Blowing Agent Market

Blowing Agent Market by Chemistry, Foaming Process, Type (Hydrochlorofluorocarbons (HCFC), Hydrofluorocarbons (HFCS), Hydrocarbons (HCS)), Foam (Polystyrene Foam, Phenolic Foam, Polyolefin Foam), and Region - Global Forecast to 2029

Report Code: CH 2309 Apr, 2024, by marketsandmarkets.com

Updated on : August 05, 2024

Blowing Agent Market

Blowing Agent Market is valued at USD 1.8 billion in 2024 and is projected to reach USD 2.3 billion by 2029, growing at 5.5% cagr from 2024 to 2029. Increasing demand in various end-use industries and high growth in the global polymeric foams market driving the market for blowing agent. The Asia Pacific region is one of the largest and fastest-growing markets for blowing agents globally. Rapid industrialization, urbanization, and infrastructure development in countries like China and India are driving the demand for blowing agents, particularly in sectors such as construction, automotive, packaging, and appliances. The construction sector in Asia Pacific is a major consumer of blowing agents, primarily for thermal insulation materials. Rising demand for residential and commercial buildings, as well as infrastructure projects, is fueling the growth of the blowing agent market in this region.

Attractive Opportunities in the Blowing Agent Market

Blowing Agent Market

To know about the assumptions considered for the study, Request for Free Sample Report

Blowing Agent Market

Blowing Agent Market Dynamics

Driver: High growth in global polymeric foams market

The polymer foam market is driven by increasing demand from the packaging, automotive, building & construction, marine, transportation, appliances, bedding & furniture, and packaging industry. The growth of the polymer foams market further facilitates the use of blowing agents, and hence this directly affects the volume of blowing agents required. Also, continuous expansion, growing awareness of high-quality products and demand of polymeric foam industry, especially in APAC, the Middle East & Africa, and South American regions, would create a huge demand for blowing agent used for foam blowing purposes. The emerging economies, such as India, China, Brazil, Southeast Asia, and Mexico, are expected to be the most lucrative destinations for the polymer foam market in the near future. Thus, the expected increase in the demand for different types of polymeric foam in varied end-use applications will drive the market for blowing agent in the coming years.

Restraint: Frequent changes in the choice of blowing agents due to environmental regulations

The growth of the blowing agents market faces challenges due to shifting preferences in blowing agents driven by environmental regulations. The transition from one blowing agent technology to another poses technical complexities that act as potential barriers. Interconnected technical, commercial, and legislative issues further complicate this shift, adding potential limitations. The regulations and codes governing blowing agent selection present a significant challenge for foam producers aiming to move towards zero-emission solutions. The Montreal Protocol plays a pivotal role in driving major transitions in blowing agents, especially in Article 5 countries, funded through national HCFC Phase-out Management Plans (HPMPs) in response to Decision XIX/6. Initially, HFC-134a replaced chlorofluorocarbons (CFCs) as a blowing agent due to the latter's ozone-depleting effects, leading to a ban under the Montreal Protocol in 1989. Presently, Massachusetts law 310 CMR 7.76 prohibits the sale of XPS foam containing specific hydrofluorocarbons (HFCs) after January 1, 2024, aiming to reduce greenhouse gas emissions from XPS foam, specifically targeting HFC-134a as a prohibited blowing agent. The increasing focus on reducing carbon emissions and the adoption of eco-friendly blowing agents in response to environmental concerns are key drivers of the next generation blowing agents’ market. Additionally, the technical complexity involved in the shift from one blowing agent technology to another is a potential barrier in itself, and the complexity of interrelated technical, commercial, and legislative problems which need to be addressed may create additional limitations.

Opportunity: Innovations in performance advancements and eco-friendly blowing agents

The demand for environmentally friendly blowing agents has rapidly increased in the past few years and is expected to remain the same in the future. The major reason behind this increase in the global demand for eco-friendly blowing agents is owing to the amendments in the rules and regulations concerning this market. The environmental regulations & restrictions such as EU F-Gas Initiatives (GWP<150), Kigali agreement, and Kyoto Protocol (5% reductions in GHG emission) plays an important role in the market development of blowing agent at a global level. The growing demand for environmentally friendly solutions is pushing the development of bio-based blowing agents derived from sources such as vegetable oils, plant starches, and organic acids. These have a lesser environmental effect and promote circular economic ideas. High-performance blowing agents, such as HFC (Hydrofluorocarbon) blowing agents, do not deplete ozone and have a lower Global Warming Potential (GWP) than typical blowing agents, making them more environmentally friendly. Blowing agents are being designed with additional features beyond gas expansion, such as flame retardancy, enhanced thermal insulation, and antibacterial qualities. This adds value to the finished foam product. Incorporating nanoparticles into foam compositions can improve mechanical strength, fire resistance, and other qualities, bringing up new uses in fields including aerospace and transportation. Increasing demand for high-performance foams in areas like medical devices, electronics, and filtration is creating niches for specialized blowing agents with tailored properties.

Challenge: Fluctuation in raw material prices and supply chain disruptions

Price variations and disruptions in the supply chain within the blowing agents market result from diverse factors such as fluctuations in raw material costs, adherence to environmental regulations, and the unpredictability of the global economy. To illustrate, let's examine the scenario of HFO-1234yf, a prevalent hydrofluoroolefin (HFO) blowing agent utilized in polyurethane (PU) foams for insulation and refrigeration purposes. HFO-1234yf is predominantly derived from tetrafluoroethane (R-134a). In 2021, the cost of R-134a surged due to global initiatives aiming to phase out high-GWP refrigerants, leading to heightened demand as a temporary alternative, especially from the air conditioning sector. Hurricane Laura in 2020 briefly halted a major R-134a production facility in the US, exacerbating supply constraints. Consequently, R-134a prices, and subsequently HFO-1234yf, quadrupled in certain regions within a year, significantly impacting polyurethane foam manufacturers. This surge in costs extended to PU foam products like insulation panels and refrigerators, potentially affecting consumer demand. Additionally, trade conflicts and protective trade policies may complicate the sourcing of specific raw materials or finished blowing agents, contributing to price fluctuations and supply shortages. The resulting uncertainty in supply poses challenges for manufacturers in maintaining optimal inventory levels, potentially leading to stockouts or overstocking.

Blowing Agent Market Ecosystem

Blowing Agent Market Ecosystem

Source: Secondary Research, Interviews with Experts, and MarketsandMarkets Analysis

"Polyurethane foam is largest foam type in blowing agent market, in terms of value."

Polyurethane foam is indeed one of the most widely used types of foam in various industries due to its versatility, durability, and excellent insulating properties. It's used in applications such as building insulation, furniture cushioning, automotive interiors, and packaging. Polyurethane foam can be formulated to have a wide range of properties, including different densities, hardness, and flexibility, making it suitable for various applications across industries.

"Based on type, hydrocarbons is the largest blowing agent market in 2023, in terms of value."

Hydrocarbons can be used in various foam applications, including insulation for buildings, refrigeration, packaging, and automotive components. Their versatility allows for a wide range of foam densities, properties, and applications. Hydrocarbons exhibit good blowing efficiency, enabling the production of foams with consistent quality and properties. They can effectively expand foam materials to achieve the desired structure and performance characteristics.

“North America accounted the second largest market for blowing agent in 2023, in terms of value."

The blowing agent market in North America has experienced significant growth in recent years, driven by various factors including increasing demand from end-use industries, regulatory changes, and technological advancements. Stringent energy efficiency regulations and building codes in North America have led to a growing demand for high-performance insulation materials. Blowing agents play a crucial role in enhancing the thermal insulation properties of foam materials used in buildings, thereby contributing to energy savings and compliance with regulations such as ENERGY STAR and LEED certification.

Blowing Agent Market by Region

To know about the assumptions considered for the study, download the pdf brochure

Blowing Agent Market Players

The key players in this market are Honeywell International Inc. (US), Solvay (Belgium), Arkema (France), Exxon Mobil Corporation (US), Linde PLC (UK), Daikin Industries Ltd. (Japan), The Chemours Company (US), BASF SE (Germany), HCS Group (Germany), FSI (US), and Harp International Ltd. (UK). Continuous developments in the market—including new product launches, mergers & acquisitions, agreements, and expansions—are expected to help the market grow.

Read More: Blowing Agents Companies

Blowing Agent Market Report Scope

Report Metric

Details

Years considered for the study

2020-2029

Base Year

2023

Forecast period

2024–2029

Units considered

Kiloton; Value (USD Million)

Segments

Type, Foam, and Region

Regions

Asia Pacific, North America, Europe, Middle East & Africa, and South America

Companies

Honeywell International Inc. (US), Solvay (Belgium), Arkema (France), Exxon Mobil Corporation (US), Linde PLC (UK), Daikin Industries Ltd. (Japan), The Chemours Company (US), BASF SE (Germany), HCS Group (Germany), FSI (US), and Harp International Ltd. (UK).

This report categorizes the global blowing agents market based on type, foam, and region.

Blowing Agent Market based on the type:
  • HC
  • HFC
  • HCFC
  • Others
Blowing Agent Market based on the foam:
  • Polyurethane Foam
  • Polystyrene Foam
  • Phenolic Foam
  • Polyolefin Foam
  • Others
Blowing Agent Market based on the region:
  • Asia Pacific
  • Europe
  • North America
  • South America
  • Middle East & Africa

Recent Developments

  • In December 2023, BASF completed its capacity expansion for key specialty amines manufactured at its Geismar, Louisiana site. As a result, BASF will be able to produce more of its key polyetheramines and amine catalysts marketed under the Baxxodur and Lupragen brands. Blowing agents falls under Lupragen products.
  • In November 2023, The Chemours Company announced it is expanding production of Chemours HFC-152a by approximately 20 percent. HFC-152a is a versatile, low GWP, non-VOC, aerosol propellant and foam blowing agent used in a wide range of personal care, household, industrial, and construction applications.

Frequently Asked Questions (FAQ):

To speak to our analyst for a discussion on the above findings, click Speak to Analyst

TABLE OF CONTENTS
 
1 INTRODUCTION (Page No. - 33)
    1.1 STUDY OBJECTIVES 
    1.2 MARKET DEFINITION 
    1.3 STUDY SCOPE 
           1.3.1 MARKET SEGMENTATION
           1.3.2 REGIONS COVERED
           1.3.3 INCLUSIONS & EXCLUSIONS
           1.3.4 YEARS CONSIDERED
    1.4 CURRENCY CONSIDERED 
    1.5 UNITS CONSIDERED 
    1.6 STAKEHOLDERS 
    1.7 SUMMARY OF CHANGES 
    1.8 RECESSION IMPACT 
 
2 RESEARCH METHODOLOGY (Page No. - 37)
    2.1 RESEARCH DATA 
          FIGURE 1 BLOWING AGENT MARKET: RESEARCH DESIGN
           2.1.1 SECONDARY DATA
                    2.1.1.1 Key data from secondary sources
           2.1.2 PRIMARY DATA
                    2.1.2.1 Key data from primary sources
                    2.1.2.2 List of primary interview participants–demand and supply side
                    2.1.2.3 Key industry insights
                    2.1.2.4 Breakdown of primary interviews
    2.2 MARKET SIZE ESTIMATION 
           2.2.1 BOTTOM-UP APPROACH
                    FIGURE 2 BLOWING AGENT MARKET: BOTTOM-UP APPROACH
           2.2.2 TOP-DOWN APPROACH
                    FIGURE 3 BLOWING AGENT MARKET: TOP-DOWN APPROACH
                    FIGURE 4 MARKET SIZE ESTIMATION: TOP-DOWN APPROACH
    2.3 FORECAST NUMBER CALCULATION 
          FIGURE 5 DEMAND-SIDE FORECAST PROJECTIONS
    2.4 DATA TRIANGULATION 
          FIGURE 6 BLOWING AGENT MARKET: DATA TRIANGULATION
    2.5 FACTOR ANALYSIS 
    2.6 ASSUMPTIONS 
    2.7 LIMITATIONS & RISKS 
    2.8 RECESSION IMPACT 
 
3 EXECUTIVE SUMMARY (Page No. - 46)
    FIGURE 7 POLYURETHANE FOAM SEGMENT TO DOMINATE MARKET DURING FORECAST PERIOD
    FIGURE 8 HYDROCARBONS (HC) TO BE FASTEST-GROWING TYPE DURING  FORECAST PERIOD
    FIGURE 9 ASIA PACIFIC TO RECORD HIGHEST GROWTH DURING FORECAST PERIOD
 
4 PREMIUM INSIGHTS (Page No. - 49)
    4.1 ATTRACTIVE OPPORTUNITIES FOR PLAYERS IN BLOWING  AGENT MARKET 
          FIGURE 10 ASIA PACIFIC TO LEAD BLOWING AGENT MARKET DURING FORECAST PERIOD
    4.2 BLOWING AGENT MARKET, BY FOAM 
          FIGURE 11 POLYURETHANE FOAM TO ACCOUNT FOR LARGEST SHARE DURING FORECAST PERIOD
    4.3 BLOWING AGENT MARKET, BY TYPE 
          FIGURE 12 HYDROCARBONS (HC) TO LEAD MARKET DURING FORECAST PERIOD
    4.4 BLOWING AGENT MARKET, BY KEY COUNTRIES 
          FIGURE 13 INDIA TO REGISTER HIGHEST CAGR DURING FORECAST PERIOD
 
5 MARKET OVERVIEW (Page No. - 51)
    5.1 INTRODUCTION 
    5.2 MARKET DYNAMICS 
          FIGURE 14 DRIVERS, RESTRAINTS, OPPORTUNITIES, AND CHALLENGES IN BLOWING AGENT MARKET
           5.2.1 DRIVERS
                    5.2.1.1 Increasing demand for blowing agents in different end-use industries
                                TABLE 1 AUTOMOTIVE INDUSTRY STATISTICS, BY COUNTRY, 2021–2022 (UNIT)
                    5.2.1.2 High growth of global polymeric foams market
           5.2.2 RESTRAINTS
                    5.2.2.1 Frequent changes in choice of blowing agents
                    5.2.2.2 Hurdles in manufacturing blowing agents due to unwanted chemical reactions
           5.2.3 OPPORTUNITIES
                    5.2.3.1 Increasing demand for eco-friendly blowing agents
                    5.2.3.2 Technological advancements leading to improved efficiency and quality control
           5.2.4 CHALLENGES
                    5.2.4.1 Release of VOCs to cause phase-out of blowing agents
                    5.2.4.2 Fluctuations in raw material costs and supply chain disruptions
 
6 INDUSTRY TRENDS (Page No. - 56)
    6.1 INTRODUCTION 
    6.2 VALUE CHAIN ANALYSIS 
          FIGURE 15 BLOWING AGENT MARKET: VALUE CHAIN ANALYSIS
           6.2.1 RAW MATERIAL SUPPLIERS
           6.2.2 BLOWING AGENT MANUFACTURERS
           6.2.3 FOAM MANUFACTURERS
           6.2.4 END USERS
    6.3 REGULATORY LANDSCAPE 
           6.3.1 REGULATIONS
           6.3.2 KYOTO PROTOCOL
           6.3.3 NORTH AMERICA
                    6.3.3.1 US ENVIRONMENT PROTECTION AGENCY (EPA)–SNAP PROGRAM
                    6.3.3.2 Regulations for manufacturing insulation with low-GWP blowing agents in Canada
                    6.3.3.3 Regulations for licensing HFCs in Mexico
           6.3.4 EUROPE
                    6.3.4.1 European Union F-Gas Regulation (Regulation (EU) No 517/2014)
                    6.3.4.2 REACH legislation (Regulation (EC) No 1907/2006)
                    6.3.4.3 Ozone Depleting Substances and Fluorinated Greenhouse Gases Regulations 2008 (ODSR & FGG Regulations)
           6.3.5 ASIA PACIFIC
                    6.3.5.1 China’s ODS phase-out program
                    6.3.5.2 India’s HFC phase-out program
           6.3.6 REGULATORY BODIES, GOVERNMENT AGENCIES, & OTHER ORGANIZATIONS
                    TABLE 2 NORTH AMERICA: REGULATORY BODIES, GOVERNMENT AGENCIES, AND OTHER ORGANIZATIONS
                    TABLE 3 ASIA PACIFIC: REGULATORY BODIES, GOVERNMENT AGENCIES, AND OTHER ORGANIZATIONS
                    TABLE 4 EUROPE: REGULATORY BODIES, GOVERNMENT AGENCIES, AND OTHER ORGANIZATIONS
    6.4 TRADE ANALYSIS 
           6.4.1 IMPORT SCENARIO
                    FIGURE 16 IMPORT OF COMPOUND PLASTICIZERS FOR RUBBER OR PLASTICS, BY KEY COUNTRIES, 2018–2022 (USD MILLION)
           6.4.2 EXPORT SCENARIO
                    FIGURE 17 EXPORT OF COMPOUND PLASTICIZERS FOR RUBBER OR PLASTICS, BY KEY COUNTRIES, 2018–2022 (USD MILLION)
    6.5 ECOSYSTEM 
          FIGURE 18 BLOWING AGENT MARKET: ECOSYSTEM MAPPING
          TABLE 5 BLOWING AGENT MARKET: ROLE IN ECOSYSTEM
    6.6 TRENDS/DISRUPTIONS IMPACTING CUSTOMER BUSINESS 
          FIGURE 19 NEW REVENUE POCKETS IN BLOWING AGENT MARKET
    6.7 TECHNOLOGY ANALYSIS 
           6.7.1 KEY TECHNOLOGY
                    6.7.1.1 HFO-based spray foam technology
           6.7.2 COMPLEMENTARY TECHNOLOGY
                    6.7.2.1 Bio-based blowing agents
           6.7.3 ADJACENT TECHNOLOGY
                    6.7.3.1 Energy storage materials
    6.8 RAW MATERIAL ANALYSIS 
           6.8.1 CHEMICAL COMPOUNDS
           6.8.2 HYDROCARBON BLOWING AGENTS
    6.9 PORTER’S FIVE FORCES ANALYSIS 
          FIGURE 20 BLOWING AGENT MARKET: PORTER’S FIVE FORCES ANALYSIS
           6.9.1 BARGAINING POWER OF SUPPLIERS
           6.9.2 THREAT OF NEW ENTRANTS
           6.9.3 THREAT OF SUBSTITUTES
           6.9.4 BARGAINING POWER OF BUYERS
           6.9.5 INTENSITY OF COMPETITIVE RIVALRY
                    TABLE 6 BLOWING AGENT MARKET: PORTER’S FIVE FORCES ANALYSIS
    6.10 KEY CONFERENCES AND EVENTS 
           TABLE 7 BLOWING AGENT MARKET: KEY CONFERENCES AND EVENTS, 2024–2025
    6.11 CASE STUDY ANALYSIS 
           6.11.1 ECOMATE: A SUPERIOR BLOWING AGENT FOR HIGH HUMIDITY AND FIRE RESISTANCE
           6.11.2 PREPARATION AND CHARACTERIZATION OF SODIUM TRISILICATE AND CALCIUM CARBONATE IN MAGNESIUM ALLOY FOAM
    6.12 PATENT ANALYSIS 
           6.12.1 METHODOLOGY
           6.12.2 DOCUMENT TYPE
                     FIGURE 21 BLOWING AGENT MARKET: GRANTED PATENTS
           6.12.3 PUBLICATION TRENDS IN LAST 10 YEARS
                     FIGURE 22 NUMBER OF PATENTS YEAR-WISE FROM 2013 TO 2023
           6.12.4 INSIGHTS
           6.12.5 LEGAL STATUS
           6.12.6 JURISDICTION ANALYSIS
                     FIGURE 23 TOP JURISDICTION, BY DOCUMENT
           6.12.7 TOP APPLICANTS
                     FIGURE 24 TOP 10 PATENT APPLICANTS
                     TABLE 8 BLOWING AGENT MARKET: PATENTS BY BASF SE
                     TABLE 9 BLOWING AGENT MARKET: PATENTS BY DOW GLOBAL TECHNOLOGIES LLC
                     TABLE 10 BLOWING AGENT MARKET: PATENTS BY EVONIK OPERATIONS GMBH
                     TABLE 11 TOP 20 PATENT OWNERS IN LAST TEN YEARS
    6.13 KEY STAKEHOLDERS AND BUYING CRITERIA 
           6.13.1 KEY STAKEHOLDERS IN BUYING PROCESS
                     FIGURE 25 INFLUENCE OF STAKEHOLDERS ON BUYING PROCESS FOR TOP 3 APPLICATIONS
                     TABLE 12 INFLUENCE OF STAKEHOLDERS ON BUYING PROCESS FOR TOP 3 APPLICATIONS (%)
           6.13.2 BUYING CRITERIA
                     FIGURE 26 KEY BUYING CRITERIA FOR TOP 3 APPLICATIONS
                     TABLE 13 KEY BUYING CRITERIA FOR TOP 3 APPLICATIONS
    6.14 MACROECONOMIC INDICATORS 
           6.14.1 GLOBAL GDP TRENDS
                     TABLE 14 TRENDS OF PER CAPITA GDP, 2020–2022 (USD)
                     TABLE 15 GDP GROWTH ESTIMATE AND PROJECTION OF KEY COUNTRIES, 2023–2027
           6.14.2 TRENDS IN AUTOMOTIVE INDUSTRY
                     TABLE 16 VEHICLE PRODUCTION STATISTICS, BY COUNTRY, 2021–2022 (UNIT)
    6.15 PRICING ANALYSIS 
           6.15.1 AVERAGE SELLING PRICE, BY REGION
                     FIGURE 27 AVERAGE SELLING PRICE TREND, BY REGION (USD/KG)
           6.15.2 AVERAGE SELLING PRICE OF PRODUCTS OFFERED  BY KEY PLAYERS, BY FOAM TYPE
                     FIGURE 28 AVERAGE SELLING PRICE TREND OF PRODUCTS OFFERED BY KEY PLAYERS,  BY FOAM (USD/KG)
           6.15.3 AVERAGE SELLING PRICE, BY FOAM (USD/KG)
                     FIGURE 29 AVERAGE SELLING PRICE TREND, BY FOAM (USD/KG)
           6.15.4 AVERAGE SELLING PRICE, BY TYPE (USD/KG)
                     TABLE 17 AVERAGE SELLING PRICE OF BLOWING AGENTS, BY TYPE (USD/KG)
    6.16 INVESTMENT AND FUNDING SCENARIO 
           FIGURE 30 INVESTMENT AND FUNDING SCENARIO, 2019–2023 (USD MILLION)
    6.17 FUNDING, DATA 
           FIGURE 31 FUNDING, BY END USE
 
7 BLOWING AGENT MARKET, BY CHEMISTRY (Page No. - 86)
    7.1 INTRODUCTION 
    7.2 PHYSICAL BLOWING AGENT 
    7.3 CHEMICAL BLOWING AGENT 
 
8 BLOWING AGENT MARKET, BY FOAMING PROCESS (Page No. - 88)
    8.1 INTRODUCTION 
    8.2 ENDOTHERMIC CHEMICAL FOAMING AGENTS 
    8.3 EXOTHERMIC CHEMICAL FOAMING AGENTS 
    8.4 ENDOTHERMIC AND EXOTHERMIC BLEND CHEMICAL  FOAMING AGENTS 
 
9 BLOWING AGENT MARKET, BY FOAM (Page No. - 90)
    9.1 INTRODUCTION 
          FIGURE 32 POLYURETHANE FOAM TO DOMINATE BLOWING AGENT MARKET
          TABLE 18 BLOWING AGENT MARKET SIZE, BY FOAM, 2020–2023 (KILOTON)
          TABLE 19 BLOWING AGENT MARKET SIZE, BY FOAM, 2024–2029 (KILOTON)
          TABLE 20 BLOWING AGENT MARKET SIZE, BY FOAM, 2020–2023 (USD MILLION)
          TABLE 21 BLOWING AGENT MARKET SIZE, BY FOAM, 2024–2029 (USD MILLION)
           9.1.1 POLYURETHANE FOAM (PU)
                    9.1.1.1 Appliances
                    9.1.1.2 Apparel
                    9.1.1.3 Automotive
                    9.1.1.4 Building & construction
                    9.1.1.5 Electronics
                    9.1.1.6 Flooring
                    9.1.1.7 Furnishing
                    9.1.1.8 Marine
                    9.1.1.9 Medical
                    9.1.1.10 Packaging
           9.1.2 POLYSTYRENE FOAM (PS)
                    9.1.2.1 Building & construction
                    9.1.2.2 Food packaging
                    9.1.2.3 Transportation
                    9.1.2.4 Other applications
           9.1.3 PHENOLIC FOAM
                    9.1.3.1 Building & construction
                    9.1.3.2 Insulation
                    9.1.3.3 Other applications
           9.1.4 POLYOLEFIN FOAM
                    9.1.4.1 Automotive
                    9.1.4.2 Medical
                    9.1.4.3 Building & construction
                    9.1.4.4 Packaging
                    9.1.4.5 Other applications
           9.1.5 OTHER FOAMS
                    9.1.5.1 Automotive
                    9.1.5.2 Building & construction
                    9.1.5.3 Packaging
                    9.1.5.4 Other applications
    9.2 HCFCS MARKET, BY FOAM 
          FIGURE 33 PU FOAM TO BE LARGEST APPLICATION OF HCFC BLOWING AGENT
          TABLE 22 HCFC BLOWING AGENT MARKET SIZE, BY FOAM, 2020–2023 (KILOTON)
          TABLE 23 HCFC BLOWING AGENT MARKET SIZE, BY FOAM, 2024–2029 (KILOTON)
          TABLE 24 HCFC BLOWING AGENT MARKET SIZE, BY FOAM, 2020–2023 (USD MILLION)
          TABLE 25 HCFC BLOWING AGENT MARKET SIZE, BY FOAM, 2024–2029 (USD MILLION)
    9.3 HFCS MARKET, BY FOAM 
          FIGURE 34 PU FOAM TO BE LARGEST APPLICATION OF HFC BLOWING AGENT
          TABLE 26 HFC BLOWING AGENT MARKET SIZE, BY FOAM, 2020–2023 (KILOTON)
          TABLE 27 HFC BLOWING AGENT MARKET SIZE, BY FOAM, 2024–2029 (KILOTON)
          TABLE 28 HFC BLOWING AGENT MARKET SIZE, BY FOAM, 2020–2023 (USD MILLION)
          TABLE 29 HFC BLOWING AGENT MARKET SIZE, BY FOAM, 2024–2029 (USD MILLION)
    9.4 HYDROCARBONS (HCS) MARKET, BY FOAM 
          FIGURE 35 PU FOAM TO BE LARGEST APPLICATION OF HC BLOWING AGENT
          TABLE 30 HC BLOWING AGENT MARKET SIZE, BY FOAM, 2020–2023 (KILOTON)
          TABLE 31 HC BLOWING AGENT MARKET SIZE, BY FOAM, 2024–2029 (KILOTON)
          TABLE 32 HC BLOWING AGENT MARKET SIZE, BY FOAM, 2020–2023 (USD MILLION)
          TABLE 33 HC BLOWING AGENT MARKET SIZE, BY FOAM, 2024–2029 (USD MILLION)
    9.5 OTHER BLOWING AGENTS MARKET, BY FOAM 
          FIGURE 36 PU FOAM TO BE LARGEST APPLICATION OF OTHER BLOWING AGENTS
          TABLE 34 OTHER BLOWING AGENTS MARKET SIZE, BY FOAM, 2020–2023 (KILOTON)
          TABLE 35 OTHER BLOWING AGENTS MARKET SIZE, BY FOAM, 2024–2029 (KILOTON)
          TABLE 36 OTHER BLOWING AGENTS MARKET SIZE, BY FOAM, 2020–2023 (USD MILLION)
          TABLE 37 OTHER BLOWING AGENTS MARKET SIZE, BY FOAM, 2024–2029 (USD MILLION)
 
10 BLOWING AGENT MARKET, BY TYPE (Page No. - 106)
     10.1 INTRODUCTION 
             FIGURE 37 HFC TO BE LARGEST SEGMENT IN OVERALL BLOWING AGENT MARKET
             TABLE 38 BLOWING AGENT MARKET SIZE, BY TYPE, 2020–2023 (KILOTON)
             TABLE 39 BLOWING AGENT MARKET SIZE, BY TYPE, 2024–2029 (KILOTON)
             TABLE 40 BLOWING AGENT MARKET SIZE, BY TYPE, 2020–2023 (USD MILLION)
             TABLE 41 BLOWING AGENT MARKET SIZE, BY TYPE, 2024–2029 (USD MILLION)
     10.2 HYDROCHLOROFLUOROCARBONS (HCFCS) 
             10.2.1 DEVELOPED COUNTRIES IN EUROPE AND NORTH AMERICA PHASING OUT USE OF HCFCS
             10.2.2 HCFC-141B
             10.2.3 HCFC-142B
             10.2.4 HCFC-22
     10.3 HYDROFLUOROCARBONS (HFCS) 
             10.3.1 STRONG DEMAND FOR HFC BLOWING AGENT IN XPS FOAM APPLICATION
             10.3.2 HFC-245FA
             10.3.3 HFC-134A
             10.3.4 HFC-365MFC/227EA
             10.3.5 HFC-152A
     10.4 HYDROCARBONS (HCS) 
             10.4.1 DEMAND FOR HC BLOWING AGENT INCREASING AS REPLACEMENT FOR HFCS OWING TO ITS LOW GWP AND ODP
             10.4.2 N-PENTANE
             10.4.3 CYCLOPENTANE
             10.4.4 ISOPENTANE
             10.4.5 ISOBUTANE
             10.4.6 N-BUTANE
             10.4.7 OTHER HCS
     10.5 OTHER TYPES 
             10.5.1 HYDROFLUOROOLEFIN (HFOS)
             10.5.2 INERT GASES
             10.5.3 METHYL FORMATE
     10.6 COMPARISON OF BLOWING AGENTS 
             TABLE 42 COMPARISON OF BLOWING AGENTS, BY PROPERTIES
 
11 BLOWING AGENT MARKET, BY REGION (Page No. - 120)
     11.1 INTRODUCTION 
             FIGURE 38 CHINA TO LEAD BLOWING AGENT MARKET DURING FORECAST PERIOD
             TABLE 43 BLOWING AGENT MARKET, BY REGION, 2020–2023 (KILOTON)
             TABLE 44 BLOWING AGENTS MARKET, BY REGION, 2024–2029 (KILOTON)
             TABLE 45 BLOWING AGENT MARKET, BY REGION, 2020–2023 (USD MILLION)
             TABLE 46 BLOWING AGENTS MARKET, BY REGION, 2024–2029 (USD MILLION)
     11.2 NORTH AMERICA 
             11.2.1 RECESSION IMPACT
                        FIGURE 39 NORTH AMERICA: BLOWING AGENT MARKET SNAPSHOT
                        TABLE 47 NORTH AMERICA: BLOWING AGENT MARKET, BY COUNTRY, 2020–2023 (KILOTON)
                        TABLE 48 NORTH AMERICA: BLOWING AGENTS MARKET, BY COUNTRY, 2024–2029 (KILOTON)
                        TABLE 49 NORTH AMERICA: BLOWING AGENT MARKET, BY COUNTRY, 2020–2023 (USD MILLION)
                        TABLE 50 NORTH AMERICA: BLOWING AGENTS MARKET, BY COUNTRY, 2024–2029 (USD MILLION)
                        TABLE 51 NORTH AMERICA: BLOWING AGENT MARKET, BY TYPE, 2020–2023 (KILOTON)
                        TABLE 52 NORTH AMERICA: BLOWING AGENTS MARKET, BY TYPE, 2024–2029 (KILOTON)
                        TABLE 53 NORTH AMERICA: BLOWING AGENT MARKET, BY TYPE, 2020–2023 (USD MILLION)
                        TABLE 54 NORTH AMERICA: BLOWING AGENTS MARKET, BY TYPE, 2024–2029 (USD MILLION)
             11.2.2 US
                        11.2.2.1 Strong demand from packaging and automotive sectors  to drive market
                                      TABLE 55 US: BLOWING AGENT MARKET, BY TYPE, 2020–2023 (KILOTON)
                                      TABLE 56 US: BLOWING AGENTS MARKET, BY TYPE, 2024–2029 (KILOTON)
                                      TABLE 57 US: BLOWING AGENT MARKET, BY TYPE, 2020–2023 (USD MILLION)
                                      TABLE 58 US: BLOWING AGENTS MARKET, BY TYPE, 2024–2029 (USD MILLION)
             11.2.3 CANADA
                        11.2.3.1 Presence of strong construction sector to drive demand
                                      TABLE 59 CANADA: BLOWING AGENT MARKET, BY TYPE, 2020–2023 (KILOTON)
                                      TABLE 60 CANADA: BLOWING AGENTS MARKET, BY TYPE, 2024–2029 (KILOTON)
                                      TABLE 61 CANADA: BLOWING AGENT MARKET, BY TYPE, 2020–2023 (USD MILLION)
                                      TABLE 62 CANADA: BLOWING AGENTS MARKET, BY TYPE, 2024–2029 (USD MILLION)
             11.2.4 MEXICO
                        11.2.4.1 Requirement for improved packaging solutions to drive blowing agent market
                                      TABLE 63 MEXICO: BLOWING AGENT MARKET, BY TYPE, 2020–2023 (KILOTON)
                                      TABLE 64 MEXICO: BLOWING AGENTS MARKET, BY TYPE, 2024–2029 (KILOTON)
                                      TABLE 65 MEXICO: BLOWING AGENT MARKET, BY TYPE, 2020–2023 (USD MILLION)
                                      TABLE 66 MEXICO: BLOWING AGENTS MARKET, BY TYPE, 2024–2029 (USD MILLION)
     11.3 EUROPE 
             11.3.1 RECESSION IMPACT
                        FIGURE 40 EUROPE: BLOWING AGENT MARKET SNAPSHOT
                        TABLE 67 EUROPE: BLOWING AGENTS MARKET, BY COUNTRY, 2020–2023 (KILOTON)
                        TABLE 68 EUROPE: BLOWING AGENT MARKET, BY COUNTRY, 2024–2029 (KILOTON)
                        TABLE 69 EUROPE: BLOWING AGENTS MARKET, BY COUNTRY, 2020–2023 (USD MILLION)
                        TABLE 70 EUROPE: BLOWING AGENT MARKET, BY COUNTRY, 2024–2029 (USD MILLION)
                        TABLE 71 EUROPE: BLOWING AGENTS MARKET, BY TYPE, 2020–2023 (KILOTON)
                        TABLE 72 EUROPE: BLOWING AGENT MARKET, BY TYPE, 2024–2029 (KILOTON)
                        TABLE 73 EUROPE: BLOWING AGENTS MARKET, BY TYPE, 2020–2023 (USD MILLION)
                        TABLE 74 EUROPE: BLOWING AGENT MARKET, BY TYPE, 2024–2029 (USD MILLION)
             11.3.2 GERMANY
                        11.3.2.1 Presence of strong automotive industry to drive demand for blowing agent
                                      TABLE 75 GERMANY: BLOWING AGENT MARKET, BY TYPE, 2020–2023 (KILOTON)
                                      TABLE 76 GERMANY: BLOWING AGENTS MARKET, BY TYPE, 2024–2029 (KILOTON)
                                      TABLE 77 GERMANY: BLOWING AGENT MARKET, BY TYPE, 2020–2023 (USD MILLION)
                                      TABLE 78 GERMANY: BLOWING AGENTS MARKET, BY TYPE, 2024–2029 (USD MILLION)
             11.3.3 UK
                        11.3.3.1 Government initiatives supporting automotive sector to fuel market growth
                                      TABLE 79 UK: BLOWING AGENT MARKET, BY TYPE, 2020–2023 (KILOTON)
                                      TABLE 80 UK: BLOWING AGENTS MARKET, BY TYPE, 2024–2029 (KILOTON)
                                      TABLE 81 UK: BLOWING AGENT MARKET, BY TYPE, 2020–2023 (USD MILLION)
                                      TABLE 82 UK: BLOWING AGENTS MARKET, BY TYPE, 2024–2029 (USD MILLION)
             11.3.4 FRANCE
                        11.3.4.1 Presence of strong construction industry to fuel market
                                      TABLE 83 FRANCE: BLOWING AGENT MARKET, BY TYPE, 2020–2023 (KILOTON)
                                      TABLE 84 FRANCE: BLOWING AGENTS MARKET, BY TYPE, 2024–2029 (KILOTON)
                                      TABLE 85 FRANCE: BLOWING AGENT MARKET, BY TYPE, 2020–2023 (USD MILLION)
                                      TABLE 86 FRANCE: BLOWING AGENTS MARKET, BY TYPE, 2024–2029 (USD MILLION)
             11.3.5 RUSSIA
                        11.3.5.1 Slowed growth of building & construction sector due to Russia-Ukraine conflict to impact market
                                      TABLE 87 RUSSIA: BLOWING AGENT MARKET, BY TYPE, 2020–2023 (KILOTON)
                                      TABLE 88 RUSSIA: BLOWING AGENTS MARKET, BY TYPE, 2024–2029 (KILOTON)
                                      TABLE 89 RUSSIA: BLOWING AGENT MARKET, BY TYPE, 2020–2023 (USD MILLION)
                                      TABLE 90 RUSSIA: BLOWING AGENTS MARKET, BY TYPE, 2024–2029 (USD MILLION)
             11.3.6 ITALY
                        11.3.6.1 Automotive industry to be major consumer of blowing  agent in Italy
                                      TABLE 91 ITALY: BLOWING AGENT MARKET, BY TYPE, 2020–2023 (KILOTON)
                                      TABLE 92 ITALY: BLOWING AGENTS MARKET, BY TYPE, 2024–2029 (KILOTON)
                                      TABLE 93 ITALY: BLOWING AGENT MARKET, BY TYPE, 2020–2023 (USD MILLION)
                                      TABLE 94 ITALY: BLOWING AGENTS MARKET, BY TYPE, 2024–2029 (USD MILLION)
             11.3.7 SPAIN
                        11.3.7.1 Growing packaging and automotive industries to drive blowing agent market
                                      TABLE 95 SPAIN: BLOWING AGENT MARKET, BY TYPE, 2020–2023 (KILOTON)
                                      TABLE 96 SPAIN: BLOWING AGENTS MARKET, BY TYPE, 2024–2029 (KILOTON)
                                      TABLE 97 SPAIN: BLOWING AGENT MARKET, BY TYPE, 2020–2023 (USD MILLION)
                                      TABLE 98 SPAIN: BLOWING AGENTS MARKET, BY TYPE, 2024–2029 (USD MILLION)
             11.3.8 TURKEY
                        11.3.8.1 HC blowing agent to witness highest growth in Turkey
                                      TABLE 99 TURKEY: BLOWING AGENT MARKET, BY TYPE, 2020–2023 (KILOTON)
                                      TABLE 100 TURKEY: BLOWING AGENTS MARKET, BY TYPE, 2024–2029 (KILOTON)
                                      TABLE 101 TURKEY: BLOWING AGENT MARKET, BY TYPE, 2020–2023 (USD MILLION)
                                      TABLE 102 TURKEY: BLOWING AGENTS MARKET, BY TYPE, 2024–2029 (USD MILLION)
             11.3.9 REST OF EUROPE
                        TABLE 103 REST OF EUROPE: BLOWING AGENT MARKET, BY TYPE, 2020–2023 (KILOTON)
                        TABLE 104 REST OF EUROPE: BLOWING AGENTS MARKET, BY TYPE, 2024–2029 (KILOTON)
                        TABLE 105 REST OF EUROPE: BLOWING AGENT MARKET, BY TYPE, 2020–2023 (USD MILLION)
                        TABLE 106 REST OF EUROPE: BLOWING AGENTS MARKET, BY TYPE, 2024–2029 (USD MILLION)
     11.4 ASIA PACIFIC 
             11.4.1 RECESSION IMPACT
                        FIGURE 41 ASIA PACIFIC: BLOWING AGENT MARKET SNAPSHOT
                        TABLE 107 AISA PACIFIC: BLOWING AGENTS MARKET, BY COUNTRY, 2020–2023 (KILOTON)
                        TABLE 108 AISA PACIFIC: BLOWING AGENT MARKET, BY COUNTRY, 2024–2029 (KILOTON)
                        TABLE 109 AISA PACIFIC: BLOWING AGENTS MARKET, BY COUNTRY, 2020–2023 (USD MILLION)
                        TABLE 110 AISA PACIFIC: BLOWING AGENT MARKET, BY COUNTRY, 2024–2029 (USD MILLION)
                        TABLE 111 AISA PACIFIC: BLOWING AGENTS MARKET, BY TYPE, 2020–2023 (KILOTON)
                        TABLE 112 AISA PACIFIC: BLOWING AGENT MARKET, BY TYPE, 2024–2029 (KILOTON)
                        TABLE 113 AISA PACIFIC: BLOWING AGENTS MARKET, BY TYPE, 2020–2023 (USD MILLION)
                        TABLE 114 AISA PACIFIC: BLOWING AGENT MARKET, BY TYPE, 2024–2029 (USD MILLION)
             11.4.2 CHINA
                        11.4.2.1 Stringent regulatory frameworks and open economy policy to support market growth
                                      TABLE 115 CHINA: BLOWING AGENTS MARKET, BY TYPE, 2020–2023 (KILOTON)
                                      TABLE 116 CHINA: BLOWING AGENT MARKET, BY TYPE, 2024–2029 (KILOTON)
                                      TABLE 117 CHINA: BLOWING AGENTS MARKET, BY TYPE, 2020–2023 (USD MILLION)
                                      TABLE 118 CHINA: BLOWING AGENT MARKET, BY TYPE, 2024–2029 (USD MILLION)
             11.4.3 JAPAN
                        11.4.3.1 Presence of large automotive industry to drive demand
                                      TABLE 119 JAPAN: BLOWING AGENTS MARKET, BY TYPE, 2020–2023 (KILOTON)
                                      TABLE 120 JAPAN: BLOWING AGENT MARKET, BY TYPE, 2024–2029 (KILOTON)
                                      TABLE 121 JAPAN: BLOWING AGENTS MARKET, BY TYPE, 2020–2023 (USD MILLION)
                                      TABLE 122 JAPAN: BLOWING AGENT MARKET, BY TYPE, 2024–2029 (USD MILLION)
             11.4.4 INDIA
                        11.4.4.1 Smart cities' mission and affordable housing initiatives by government to boost market growth
                                      TABLE 123 INDIA: BLOWING AGENTS MARKET, BY TYPE, 2020–2023 (KILOTON)
                                      TABLE 124 INDIA: BLOWING AGENT MARKET, BY TYPE, 2024–2029 (KILOTON)
                                      TABLE 125 INDIA: BLOWING AGENTS MARKET, BY TYPE, 2020–2023 (USD MILLION)
                                      TABLE 126 INDIA: BLOWING AGENT MARKET, BY TYPE, 2024–2029 (USD MILLION)
             11.4.5 SOUTH KOREA
                        11.4.5.1 Government policies to boost market growth
                                      TABLE 127 SOUTH KOREA: BLOWING AGENTS MARKET, BY TYPE, 2020–2023 (KILOTON)
                                      TABLE 128 SOUTH KOREA: BLOWING AGENT MARKET, BY TYPE, 2024–2029 (KILOTON)
                                      TABLE 129 SOUTH KOREA: BLOWING AGENTS MARKET, BY TYPE, 2020–2023 (USD MILLION)
                                      TABLE 130 SOUTH KOREA: BLOWING AGENT MARKET, BY TYPE, 2024–2029 (USD MILLION)
             11.4.6 INDONESIA
                        11.4.6.1 Increased consumption and FDIs to boost market growth
                                      TABLE 131 INDONESIA: BLOWING AGENTS MARKET, BY TYPE, 2020–2023 (KILOTON)
                                      TABLE 132 INDONESIA: BLOWING AGENT MARKET, BY TYPE, 2024–2029 (KILOTON)
                                      TABLE 133 INDONESIA: BLOWING AGENTS MARKET, BY TYPE, 2020–2023 (USD MILLION)
                                      TABLE 134 INDONESIA: BLOWING AGENT MARKET, BY TYPE, 2024–2029 (USD MILLION)
             11.4.7 THAILAND
                        11.4.7.1 HC segment to dominate overall market in Thailand
                                      TABLE 135 THAILAND: BLOWING AGENTS MARKET, BY TYPE, 2020–2023 (KILOTON)
                                      TABLE 136 THAILAND: BLOWING AGENT MARKET, BY TYPE, 2024–2029 (KILOTON)
                                      TABLE 137 THAILAND: BLOWING AGENTS MARKET, BY TYPE, 2020–2023 (USD MILLION)
                                      TABLE 138 THAILAND: BLOWING AGENT MARKET, BY TYPE, 2024–2029 (USD MILLION)
             11.4.8 AUSTRALIA
                        11.4.8.1 Growing trend toward interactive packaging to propel demand
                                      TABLE 139 AUSTRALIA: BLOWING AGENTS MARKET, BY TYPE, 2020–2023 (KILOTON)
                                      TABLE 140 AUSTRALIA: BLOWING AGENT MARKET, BY TYPE, 2024–2029 (KILOTON)
                                      TABLE 141 AUSTRALIA: BLOWING AGENTS MARKET, BY TYPE, 2020–2023 (USD MILLION)
                                      TABLE 142 AUSTRALIA: BLOWING AGENT MARKET, BY TYPE, 2024–2029 (USD MILLION)
             11.4.9 REST OF ASIA PACIFIC
                        TABLE 143 REST OF AISA PACIFIC: BLOWING AGENTS MARKET, BY TYPE, 2020–2023 (KILOTON)
                        TABLE 144 REST OF AISA PACIFIC: BLOWING AGENT MARKET, BY TYPE, 2024–2029 (KILOTON)
                        TABLE 145 REST OF AISA PACIFIC: BLOWING AGENTS MARKET, BY TYPE, 2020–2023 (USD MILLION)
                        TABLE 146 REST OF AISA PACIFIC: BLOWING AGENT MARKET, BY TYPE, 2024–2029 (USD MILLION)
     11.5 MIDDLE EAST & AFRICA 
             11.5.1 RECESSION IMPACT
                        TABLE 147 MIDDLE EAST & AFRICA: BLOWING AGENTS MARKET, BY COUNTRY,  2020–2023 (KILOTON)
                        TABLE 148 MIDDLE EAST & AFRICA: BLOWING AGENT MARKET, BY COUNTRY,  2024–2029 (KILOTON)
                        TABLE 149 MIDDLE EAST & AFRICA: BLOWING AGENTS MARKET, BY COUNTRY,  2020–2023 (USD MILLION)
                        TABLE 150 MIDDLE EAST & AFRICA: BLOWING AGENT MARKET, BY COUNTRY,  2024–2029 (USD MILLION)
                        TABLE 151 MIDDLE EAST & AFRICA: BLOWING AGENTS MARKET, BY TYPE, 2020–2023 (KILOTON)
                        TABLE 152 MIDDLE EAST & AFRICA: BLOWING AGENT MARKET, BY TYPE, 2024–2029 (KILOTON)
                        TABLE 153 MIDDLE EAST & AFRICA: BLOWING AGENTS MARKET, BY TYPE, 2020–2023 (USD MILLION)
                        TABLE 154 MIDDLE EAST & AFRICA: BLOWING AGENT MARKET, BY TYPE, 2024–2029 (USD MILLION)
             11.5.2 GCC COUNTRIES
                        11.5.2.1 Saudi Arabia
                                     11.5.2.1.1 Government initiatives to drive demand for blowing agents
                                                      TABLE 155 SAUDI ARABIA: BLOWING AGENT MARKET, BY TYPE, 2020–2023 (KILOTON)
                                                      TABLE 156 SAUDI ARABIA: BLOWING AGENTS MARKET, BY TYPE, 2024–2029 (KILOTON)
                                                      TABLE 157 SAUDI ARABIA: BLOWING AGENT MARKET, BY TYPE, 2020–2023 (USD MILLION)
                                                      TABLE 158 SAUDI ARABIA: BLOWING AGENTS MARKET, BY TYPE, 2024–2029 (USD MILLION)
                        11.5.2.2 UAE
                                     11.5.2.2.1 Business-friendly policies and investment initiatives  to drive market
                                                      TABLE 159 UAE: BLOWING AGENT MARKET, BY TYPE, 2020–2023 (KILOTON)
                                                      TABLE 160 UAE: BLOWING AGENTS MARKET, BY TYPE, 2024–2029 (KILOTON)
                                                      TABLE 161 UAE: BLOWING AGENT MARKET, BY TYPE, 2020–2023 (USD MILLION)
                                                      TABLE 162 UAE: BLOWING AGENTS MARKET, BY TYPE, 2024–2029 (USD MILLION)
                        11.5.2.3 Rest of GCC Countries
                                     11.5.2.3.1 Strong growth of end-use industries to drive demand
                                                      TABLE 163 REST OF GCC: BLOWING AGENT MARKET, BY TYPE, 2020–2023 (KILOTON)
                                                      TABLE 164 REST OF GCC: BLOWING AGENTS MARKET, BY TYPE, 2024–2029 (KILOTON)
                                                      TABLE 165 REST OF GCC: BLOWING AGENT MARKET, BY TYPE, 2020–2023 (USD MILLION)
                                                      TABLE 166 REST OF GCC: BLOWING AGENTS MARKET, BY TYPE, 2024–2029 (USD MILLION)
             11.5.3 REST OF MIDDLE EAST & AFRICA
                        TABLE 167 REST OF MIDDLE EAST & AFRICA: BLOWING AGENT MARKET, BY TYPE,  2020–2023 (KILOTON)
                        TABLE 168 REST OF MIDDLE EAST & AFRICA: BLOWING AGENTS MARKET, BY TYPE,  2024–2029 (KILOTON)
                        TABLE 169 REST OF MIDDLE EAST & AFRICA: BLOWING AGENT MARKET, BY TYPE,  2020–2023 (USD MILLION)
                        TABLE 170 REST OF MIDDLE EAST & AFRICA: BLOWING AGENTS MARKET, BY TYPE,  2024–2029 (USD MILLION)
     11.6 SOUTH AMERICA 
             11.6.1 RECESSION IMPACT
                        TABLE 171 SOUTH AMERICA: BLOWING AGENT MARKET, BY COUNTRY,  2020–2023 (KILOTON)
                        TABLE 172 SOUTH AMERICA: BLOWING AGENTS MARKET, BY COUNTRY,  2024–2029 (KILOTON)
                        TABLE 173 SOUTH AMERICA: BLOWING AGENT MARKET, BY COUNTRY, 2020–2023 (USD MILLION)
                        TABLE 174 SOUTH AMERICA: BLOWING AGENTS MARKET, BY COUNTRY, 2024–2029 (USD MILLION)
                        TABLE 175 SOUTH AMERICA: BLOWING AGENT MARKET, BY TYPE, 2020–2023 (KILOTON)
                        TABLE 176 SOUTH AMERICA: BLOWING AGENTS MARKET, BY TYPE, 2024–2029 (KILOTON)
                        TABLE 177 SOUTH AMERICA: BLOWING AGENT MARKET, BY TYPE, 2020–2023 (USD MILLION)
                        TABLE 178 SOUTH AMERICA: BLOWING AGENTS MARKET, BY TYPE, 2024–2029 (USD MILLION)
             11.6.2 BRAZIL
                        11.6.2.1 Huge demand from growing automotive sector to drive market
                                      TABLE 179 BRAZIL: BLOWING AGENT MARKET, BY TYPE, 2020–2023 (KILOTON)
                                      TABLE 180 BRAZIL: BLOWING AGENTS MARKET, BY TYPE, 2024–2029 (KILOTON)
                                      TABLE 181 BRAZIL: BLOWING AGENT MARKET, BY TYPE, 2020–2023 (USD MILLION)
                                      TABLE 182 BRAZIL: BLOWING AGENTS MARKET, BY TYPE, 2024–2029 (USD MILLION)
             11.6.3 ARGENTINA
                        11.6.3.1 Government’s strategic development plan to boost packaging industry
                                      TABLE 183 ARGENTINA: BLOWING AGENT MARKET, BY TYPE, 2020–2023 (KILOTON)
                                      TABLE 184 ARGENTINA: BLOWING AGENTS MARKET, BY TYPE, 2024–2029 (KILOTON)
                                      TABLE 185 ARGENTINA: BLOWING AGENT MARKET, BY TYPE, 2020–2023 (USD MILLION)
                                      TABLE 186 ARGENTINA: BLOWING AGENTS MARKET, BY TYPE, 2024–2029 (USD MILLION)
             11.6.4 REST OF SOUTH AMERICA
                        TABLE 187 REST OF SOUTH AMERICA: BLOWING AGENT MARKET, BY TYPE, 2020–2023 (KILOTON)
                        TABLE 188 REST OF SOUTH AMERICA: BLOWING AGENTS MARKET, BY TYPE, 2024–2029 (KILOTON)
                        TABLE 189 REST OF SOUTH AMERICA: BLOWING AGENT MARKET, BY TYPE, 2020–2023 (USD MILLION)
                        TABLE 190 REST OF SOUTH AMERICA: BLOWING AGENTS MARKET, BY TYPE, 2024–2029 (USD MILLION)
 
12 COMPETITIVE LANDSCAPE (Page No. - 192)
     12.1 OVERVIEW 
     12.2 KEY PLAYER STRATEGIES 
             FIGURE 42 OVERVIEW OF STRATEGIES ADOPTED BY KEY PLAYERS IN BLOWING AGENT MARKET BETWEEN 2019 AND 2023
     12.3 REVENUE ANALYSIS 
             FIGURE 43 REVENUE ANALYSIS OF KEY COMPANIES, 2020–2022
             TABLE 191 THREE-YEAR REVENUE ANALYSIS OF KEY COMPANIES IN BLOWING AGENT MARKET
     12.4 MARKET SHARE ANALYSIS 
             FIGURE 44 SHARES OF LEADING COMPANIES IN BLOWING AGENT MARKET, 2023
             TABLE 192 BLOWING AGENT MARKET: DEGREE OF COMPETITION
     12.5 COMPANY VALUATION AND FINANCIAL METRICS 
             FIGURE 45 COMPANY VALUATION OF LEADING COMPANIES IN BLOWING  AGENT MARKET, 2023
             FIGURE 46 FINANCIAL METRICS OF LEADING COMPANIES IN BLOWING AGENT  MARKET, 2023
     12.6 BRAND/PRODUCT COMPARISON 
             FIGURE 47 BLOWING AGENT MARKET: BRAND/PRODUCT COMPARISON
     12.7 COMPANY EVALUATION MATRIX: KEY PLAYERS, 2023 
             12.7.1 STARS
             12.7.2 EMERGING LEADERS
             12.7.3 PERVASIVE PLAYERS
             12.7.4 PARTICIPANTS
                        FIGURE 48 BLOWING AGENT MARKET: COMPANY EVALUATION MATRIX (KEY PLAYERS), 2023
             12.7.5 COMPANY FOOTPRINT: KEY PLAYERS, 2023
                        12.7.5.1 Company product footprint, by type
                                      TABLE 193 BLOWING AGENT MARKET: TYPE FOOTPRINT
                        12.7.5.2 Company product footprint, by foam type
                                      TABLE 194 BLOWING AGENT MARKET: FOAM TYPE FOOTPRINT
                        12.7.5.3 Company region footprint
                                      TABLE 195 BLOWING AGENT MARKET: REGION FOOTPRINT
                                      TABLE 196 COMPANY OVERALL FOOTPRINT
     12.8 COMPANY EVALUATION MATRIX: STARTUPS/SMES, 2023 
             12.8.1 PROGRESSIVE COMPANIES
             12.8.2 RESPONSIVE COMPANIES
             12.8.3 DYNAMIC COMPANIES
             12.8.4 STARTING BLOCKS
                        FIGURE 49 BLOWING AGENT MARKET: COMPANY EVALUATION MATRIX  (STARTUPS/SMES), 2023
             12.8.5 COMPETITIVE BENCHMARKING
                        TABLE 197 BLOWING AGENT MARKET: DETAILED LIST OF KEY STARTUPS/SMES
                        TABLE 198 BLOWING AGENT MARKET: COMPETITIVE BENCHMARKING OF START-UPS/SMES
     12.9 COMPETITIVE SCENARIO & TRENDS 
             12.9.1 PRODUCT LAUNCHES
                        TABLE 199 BLOWING AGENT MARKET: PRODUCT LAUNCHES, JANUARY 2019–DECEMBER 2023
             12.9.2 DEALS
                        TABLE 200 BLOWING AGENT MARKET: DEALS, JANUARY 2019–DECEMBER 2023
             12.9.3 EXPANSIONS
                        TABLE 201 BLOWING AGENT MARKET: EXPANSIONS, JANUARY 2019–DECEMBER 2023
 
13 COMPANY PROFILES (Page No. - 216)
(Business overview, Products/Solutions/Services offered, Recent Developments, Deals, Expansions, MnM view, Key strengths, Strategic choices, Weaknesses and competitive threats) *
     13.1 MAJOR COMPANIES 
             13.1.1 HONEYWELL INTERNATIONAL INC.
                        TABLE 202 HONEYWELL INTERNATIONAL INC.: BUSINESS OVERVIEW
                        FIGURE 50 HONEYWELL INTERNATIONAL INC.: COMPANY SNAPSHOT
                        TABLE 203 HONEYWELL INTERNATIONAL INC.: PRODUCTS/SERVICES/SOLUTIONS OFFERED
                        TABLE 204 HONEYWELL INTERNATIONAL INC.: DEALS, JANUARY 2019–DECEMBER 2023
                        TABLE 205 HONEYWELL INTERNATIONAL INC.: EXPANSIONS, JANUARY 2019–DECEMBER 2023
             13.1.2 SOLVAY
                        TABLE 206 SOLVAY SA: BUSINESS OVERVIEW
                        FIGURE 51 SOLVAY: COMPANY SNAPSHOT
                        TABLE 207 SOLVAY: PRODUCTS/SERVICES/SOLUTIONS OFFERED
                        TABLE 208 SOLVAY: DEALS, JANUARY 2019–DECEMBER 2023
                        TABLE 209 SOLVAY: EXPANSIONS, JANUARY 2019–DECEMBER 2023
             13.1.3 ARKEMA
                        TABLE 210 ARKEMA: BUSINESS OVERVIEW
                        FIGURE 52 ARKEMA: COMPANY SNAPSHOT
                        TABLE 211 ARKEMA: PRODUCTS/SERVICES/SOLUTIONS OFFERED
                        TABLE 212 ARKEMA: DEALS, JANUARY 2019–DECEMBER 2023
             13.1.4 EXXON MOBIL CORPORATION
                        TABLE 213 EXXON MOBIL CORPORATION: BUSINESS OVERVIEW
                        FIGURE 53 EXXON MOBIL CORPORATION: COMPANY SNAPSHOT
                        TABLE 214 EXXON MOBIL CORPORATION: PRODUCTS/SERVICES/SOLUTIONS OFFERED
                        TABLE 215 EXXON MOBIL CORPORATION: EXPANSIONS, JANUARY 2019–DECEMBER 2023
             13.1.5 LINDE PLC
                        TABLE 216 LINDE PLC: BUSINESS OVERVIEW
                        FIGURE 54 LINDE PLC: COMPANY SNAPSHOT
                        TABLE 217 LINDE PLC: PRODUCTS/SERVICES/SOLUTIONS OFFERED
                        TABLE 218 LINDE PLC: DEALS, JANUARY 2019–DECEMBER 2023
                        TABLE 219 LINDE PLC: EXPANSIONS, JANUARY 2019–DECEMBER 2023
             13.1.6 DAIKIN INDUSTRIES, LTD.
                        TABLE 220 DAIKIN INDUSTRIES, LTD.: BUSINESS OVERVIEW
                        FIGURE 55 DAIKIN INDUSTRIES, LTD.: COMPANY SNAPSHOT
                        TABLE 221 DAIKIN INDUSTRIES, LTD.: PRODUCTS/SERVICES/SOLUTIONS OFFERED
                        TABLE 222 DAIKIN INDUSTRIES, LTD.: DEALS, JANUARY 2019–DECEMBER 2023
                        TABLE 223 DAIKIN INDUSTRIES, LTD.: EXPANSIONS, JANUARY 2019–DECEMBER 2023
             13.1.7 THE CHEMOURS COMPANY
                        TABLE 224 THE CHEMOURS COMPANY: BUSINESS OVERVIEW
                        FIGURE 56 THE CHEMOURS COMPANY: COMPANY SNAPSHOT
                        TABLE 225 THE CHEMOURS COMPANY: PRODUCTS/SERVICES/SOLUTIONS OFFERED
                        TABLE 226 THE CHEMOURS COMPANY: PRODUCT LAUNCHES, JANUARY 2019–DECEMBER 2023
                        TABLE 227 THE CHEMOURS COMPANY: DEALS, JANUARY 2019–DECEMBER 2023
                        TABLE 228 THE CHEMOURS COMPANY: EXPANSIONS, JANUARY 2019–DECEMBER 2023
             13.1.8 BASF SE
                        TABLE 229 BASF SE: BUSINESS OVERVIEW
                        FIGURE 57 BASF SE: COMPANY SNAPSHOT
                        TABLE 230 BASF SE: PRODUCTS/SERVICES/SOLUTIONS OFFERED
                        TABLE 231 BASF SE: DEALS, JANUARY 2019–DECEMBER 2023
                        TABLE 232 BASF SE: EXPANSIONS, JANUARY 2019–DECEMBER 2023
             13.1.9 HCS GROUP GMBH
                        TABLE 233 HCS GROUP GMBH: BUSINESS OVERVIEW
                        TABLE 234 HCS GROUP GMBH: PRODUCTS/SERVICES/SOLUTIONS OFFERED
                        TABLE 235 HCS GROUP GMBH: PRODUCT LAUNCHES, JANUARY 2019–DECEMBER 2023
                        TABLE 236 HCS GROUP: EXPANSIONS, JANUARY 2019–DECEMBER 2023
             13.1.10 FSI
                        TABLE 237 FSI: BUSINESS OVERVIEW
                        TABLE 238 FSI: PRODUCTS/SERVICES/SOLUTIONS OFFERED
             13.1.11 HARP INTERNATIONAL LTD.
                        TABLE 239 HARP INTERNATIONAL LTD.: BUSINESS OVERVIEW
                        TABLE 240 HARP INTERNATIONAL LTD.: PRODUCTS/SERVICES/SOLUTIONS OFFERED
*Details on Business overview, Products/Solutions/Services offered, Recent Developments, Deals, Expansions, MnM view, Key strengths, Strategic choices, Weaknesses and competitive threats might not be captured in case of unlisted companies.
     13.2 OTHER PLAYERS 
             13.2.1 INEOS
                        TABLE 241 INEOS: COMPANY OVERVIEW
             13.2.2 NOURYON
                        TABLE 242 NOURYON: COMPANY OVERVIEW
             13.2.3 CHANGSHU 3F ZHONGHAO NEW CHEMICAL MATERIALS CO., LTD.
                        TABLE 243 CHANGSHU 3F ZHONGHAO NEW CHEMICAL MATERIALS CO., LTD.: COMPANY OVERVIEW
             13.2.4 LAMBIOTTE & CIE
                        TABLE 244 LAMBIOTTE & CIE: COMPANY OVERVIEW
             13.2.5 SCHARR CPC
                        TABLE 245 SCHARR CPC: COMPANY OVERVIEW
             13.2.6 SINOCHEM HOLDINGS CORPORATION LTD.
                        TABLE 246 SINOCHEM HOLDINGS CORPORATION LTD.: COMPANY OVERVIEW
             13.2.7 LANXESS
                        TABLE 247 LANXESS: COMPANY OVERVIEW
             13.2.8 JAHARVIR POLYMERS PRIVATE LIMITED
                        TABLE 248 JAHAVIR POLYMERS PRIVATE LIMITED: COMPANY OVERVIEW
             13.2.9 HENAN JINHE INDUSTRY CO., LTD.
                        TABLE 249 HENAN JINHE INDUSTRY CO., LTD.: COMPANY OVERVIEW
             13.2.10 EVONIK INDUSTRIES AG
                        TABLE 250 EVONIK INDUSTRIES AG: COMPANY OVERVIEW
             13.2.11 HUNTSMAN INTERNATIONAL LLC
                        TABLE 251 HUNTSMAN INTERNATIONAL LLC: COMPANY OVERVIEW
             13.2.12 HPLA GROUP
                        TABLE 252 HPLA GROUP: COMPANY OVERVIEW
             13.2.13 CHEMICO (INDIA)
                        TABLE 253 CHEMICO (INDIA): COMPANY OVERVIEW
             13.2.14 SPL GROUP
                        TABLE 254 SPL GROUP: COMPANY OVERVIEW
             13.2.15 AJANTA GROUP
                        TABLE 255 AJANTA GROUP: COMPANY OVERVIEW
             13.2.16 A-GAS INTERNATIONAL LIMITED
                        TABLE 256 A-GAS INTERNATIONAL LIMITED: COMPANY OVERVIEW
 
14 APPENDIX (Page No. - 269)
     14.1 DISCUSSION GUIDE 
     14.2 KNOWLEDGESTORE: MARKETSANDMARKETS’  SUBSCRIPTION PORTAL 
     14.3 CUSTOMIZATION OPTIONS 
     14.4 RELATED REPORTS 
     14.5 AUTHOR DETAILS 

The study involved four major activities in estimating the market size of the blowing agents market. Exhaustive secondary research was done to collect information on the market, the peer market, and the grandparent market. The next step was to validate these findings, assumptions, and sizing with industry experts across the value chain through primary research. Both top-down and bottom-up approaches were employed to estimate the complete market size. Thereafter, the market breakdown and data triangulation procedures were used to estimate the market size of the segments and subsegments.

Secondary Research

In the secondary research process, various secondary sources have been referred to for identifying and collecting information for this study. These secondary sources include annual reports, press releases, investor presentations of companies, white papers, certified publications, trade directories, articles from recognized authors, gold standard and silver standard websites, and databases. Secondary research has been used to obtain key information about the value chain of the industry, monetary chain of the market, the total pool of key players, market classification and segmentation according to industry trends to the bottom-most level, and regional markets. It was also used to obtain information about the key developments from a market-oriented perspective.

Primary Research

The blowing agents market comprises several stakeholders in the value chain, which include manufacturers, and end users. Various primary sources from the supply and demand sides of the blowing agents market have been interviewed to obtain qualitative and quantitative information. The primary interviewees from the demand side include key opinion leaders in hygiene sectors. The primary sources from the supply side include manufacturers, associations, and institutions involved in the blowing agents industry. Primary interviews were conducted to gather insights such as market statistics, data of revenue collected from the products and services, market breakdowns, market size estimations, market forecasting, and data triangulation. Primary research also helped in understanding the various trends related to type, foam, and region. Stakeholders from the demand side, such as CIOs, CTOs, and CSOs were interviewed to understand the buyer’s perspective on the suppliers, products, component providers, and their current usage of blowing agents and outlook of their business, which will affect the overall market.

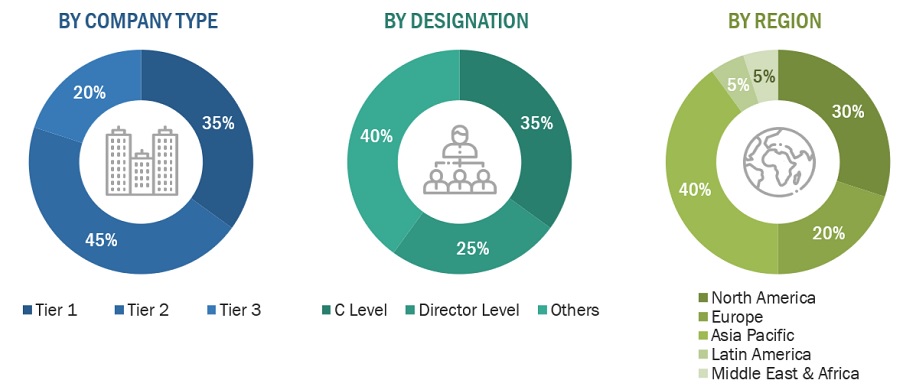
The breakdown of profiles of the primary interviewees is illustrated in the figure below:
Blowing Agent Market Size, and Share

Note: Tier 1, Tier 2, and Tier 3 companies are classified based on their market revenue in 2022 available in the public domain, product portfolios, and geographical presence.

Other designations include consultants and sales, marketing, and procurement managers.

To know about the assumptions considered for the study, download the pdf brochure

Market Size Estimation

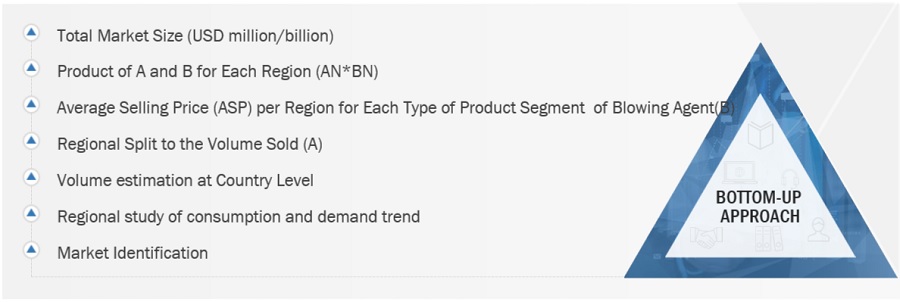
The top-down and bottom-up approaches have been used to estimate and validate the size of the blowing agents market.

  • The key players in the industry have been identified through extensive secondary research.
  • The supply chain of the industry has been determined through primary and secondary research.
  • All percentage shares, splits, and breakdowns have been determined using secondary sources and verified through primary sources.
  • All possible parameters that affect the markets covered in this research study have been accounted for, viewed in extensive detail, verified through primary research, and analyzed to obtain the final quantitative and qualitative data.
  • The research includes the study of reports, reviews, and newsletters of the key market players, along with extensive interviews for opinions with leaders such as directors and marketing executives.

Top - Down Approach-
Blowing Agent Market Size, and Share

To know about the assumptions considered for the study, Request for Free Sample Report

Bottom - Up Approach-

Blowing Agent Market Size, and Share

Data Triangulation

After arriving at the total market size from the estimation process, the overall market has been split into several segments and sub-segments. To complete the overall market engineering process and arrive at the exact statistics for all the segments and sub-segments, the data triangulation and market breakdown procedures have been employed, wherever applicable. The data has been triangulated by studying various factors and trends from both the demand and supply sides. Along with this, the market size has been validated by using both the top-down and bottom-up approaches and primary interviews. Hence, for every data segment, there have been three sources—top-down approach, bottom-up approach, and expert interviews. The data was assumed correct when the values arrived from the three sources matched.

Market Definition

Blowing agents are substances used in the manufacturing process of foam materials to create bubbles or cells within the material. These bubbles or cells contribute to the lightweight and insulating properties of foam materials. Blowing agents can be introduced into the foam material in various forms, such as gases, liquids, or chemical compounds, depending on the specific manufacturing process and desired properties of the foam. The choice of blowing agent depends on factors such as the type of foam material being produced, desired foam density, thermal insulation properties, environmental considerations, and regulatory requirements. Common types of blowing agents include hydrocarbons, hydrofluorocarbons (HFCs), hydrochlorofluorocarbons (HCFCs), carbon dioxide (CO2), water, and various chemical compounds.

Key Stakeholders

  • Senior Management
  • End User
  • Finance/Procurement Department
  • R&D Department
  • Manufacturers
  • Raw Material Suppliers

Report Objectives

  • To define, describe, and forecast the size of the blowing agents market, in terms of value and volume.
  • To provide detailed information regarding the major factors (drivers, opportunities, restraints, and challenges) influencing the growth of the market
  • To estimate and forecast the market size based on type, foam, and region.
  • To forecast the size of the market with respect to major regions, namely, Europe, North America, Asia Pacific, Middle East & Africa, and South America, along with their key countries
  • To strategically analyze micro-markets with respect to individual growth trends, prospects, and their contribution to the overall market
  • To analyze opportunities in the market for stakeholders and provide a competitive landscape of market leaders.
  • To track and analyze recent developments such as expansions, new product launches, partnerships & agreements, and acquisitions in the market.
  • To strategically profile key market players and comprehensively analyze their core competencies.

Available Customizations

Along with the given market data, MarketsandMarkets offers customizations according to the company’s specific needs. The following customization options are available for the report:

Regional Analysis

  • Further breakdown of a region with respect to a particular country or additional application

Company Information

  • Detailed analysis and profiles of additional market players

Tariff & Regulations

  • Regulations and Impact on Blowing Agents Market
Custom Market Research Services

We will customize the research for you, in case the report listed above does not meet with your exact requirements. Our custom research will comprehensively cover the business information you require to help you arrive at strategic and profitable business decisions.

Request Customization

Instant Answers with GPT - Ask Now!

Ask real questions. Get complete answers !
Report Code
CH 2309
Published ON
Apr, 2024
Choose License Type
BUY NOW
  • SHARE
X
Request Customization
Speak to Analyst
Speak to Analyst
OR FACE-TO-FACE MEETING
PERSONALIZE THIS RESEARCH
  • Triangulate with your Own Data
  • Get Data as per your Format and Definition
  • Gain a Deeper Dive on a Specific Application, Geography, Customer or Competitor
  • Any level of Personalization
REQUEST A FREE CUSTOMIZATION
LET US HELP YOU!
  • What are the Known and Unknown Adjacencies Impacting the Blowing Agent Market
  • What will your New Revenue Sources be?
  • Who will be your Top Customer; what will make them switch?
  • Defend your Market Share or Win Competitors
  • Get a Scorecard for Target Partners
CUSTOMIZED WORKSHOP REQUEST
  • Call Us
  • +1-888-600-6441 (Corporate office hours)
  • +1-888-600-6441 (US/Can toll free)
  • +44-800-368-9399 (UK office hours)
CONNECT WITH US
ABOUT TRUST ONLINE
©2024 MarketsandMarkets Research Private Ltd. All rights reserved
DMCA.com Protection Status
Website Feedback