Brine Concentration Minerals Market

Brine Concentration Minerals Market by Type (Sodium derivatives, Magnesium derivatives, Calcium derivatives, Potassium dereivatives), Technology (Solar evaporation, NF-RO-MF, Osmotically assisted RO), Application, and Region - Global Forecast to 2029

Report Code: MM 8942 Feb, 2024, by marketsandmarkets.com

The brine concentration minerals market is projected to reach USD 1.7 billion by 2029, at a CAGR of 8.1% from USD 1.1 billion in 2024. The market is mainly led by the growing demand for lithium-ion batteries. The global emphasis on sustainable  practices is a major driver for the growth of the brine concentration minerals market.

Attractive Opportunities in the Brine Concentration Minerals Market

Brine Concentration Minerals Market

To know about the assumptions considered for the study, Request for Free Sample Report

Brine Concentration Minerals Market

Market Dynamics

Driver: Growing demand for lithium-ion batteries coupled with global emphasis on sustainbale practices.

The growing demand for lithium-ion batteries has emerged as a pivotal driver for the brine concentration minerals market due to the crucial role played by lithium in these advanced energy storage devices. Lithium-ion batteries are extensively utilized in various applications, including electric vehicles, consumer electronics, and renewable energy storage. As the global transition towards sustainable and clean energy accelerates, the demand for lithium-ion batteries is expected to skyrocket. Lithium, a key component in these batteries, is primarily derived from brine concentration minerals such as lithium-rich brine deposits. Brine extraction is a cost-effective method to obtain lithium, and it often involves concentrating lithium in brine pools through evaporation. As a result, the brine concentration minerals market has witnessed significant growth to meet the escalating demand for lithium-ion batteries. The unique geological conditions required for lithium-rich brine deposits create geographical concentrations of resources, leading to the emergence of key players in specific regions. Countries with abundant lithium resources, such as those in the lithium triangle (Chile, Argentina, and Bolivia), have become focal points for brine concentration mineral extraction. Therefore, the interdependence between the burgeoning demand for lithium-ion batteries and the need for lithium extracted from brine concentration minerals underscores the pivotal role these minerals play in sustaining the expanding market for clean and renewable energy technologies. This symbiotic relationship positions the brine concentration minerals market as a crucial element in the global transition towards a cleaner and more sustainable energy landscape. The global emphasis on sustainable practices is a significant driver for the brine concentration minerals market, particularly concerning environmental friendliness and water resource conservation. The extraction of lithium from brine, a key process for lithium-ion batteries, is generally considered more environmentally friendly compared to traditional hard-rock mining. Brine extraction typically involves the utilization of natural salt flats, where lithium is concentrated through solar evaporation. This process has a lower environmental impact, minimizing the disruption of ecosystems and reducing the carbon footprint associated with extraction. Furthermore, brine concentration minerals extraction often involves the use of brine pools, allowing for the recycling and conservation of water resources. Unlike conventional mining methods that consume substantial amounts of water, brine extraction is more water-efficient. The closed-loop systems used in brine concentration help minimize water consumption and environmental impact, aligning with sustainable practices. The emphasis on environmental friendliness and water resource conservation in sustainable practices has positioned brine concentration minerals as a more eco-friendly alternative in the production of lithium, contributing to the broader goal of achieving a greener and more responsible approach to resource extraction for the rapidly growing renewable energy and energy storage sectors.

Restraint: Low mineral concentration and selective mineral recovery

Low mineral concentration and selective mineral recovery from brine pose significant restraints for the brine concentration minerals market. Extracting minerals from brine involves a process of concentrating and isolating target minerals, such as lithium, magnesium, calcium etc. which can be challenging when the initial concentration is low. This low mineral concentration increases the complexity and cost of extraction, as larger volumes of brine need to be processed to obtain commercially viable amounts of minerals. Moreover, the selective recovery of specific minerals from brine can be technically demanding. Different brine sources may contain a mix of minerals, and achieving high selectivity for the desired mineral, such as lithium, potassium and calcium while avoiding contamination with unwanted elements, adds complexity to the extraction process. Selective recovery often requires advanced technologies and additional processing steps, contributing to increased operational costs. These challenges in low mineral concentration and selective recovery impact the economic viability of brine concentration minerals, potentially limiting their competitiveness in the market. Overcoming these technical hurdles and optimizing extraction processes will be crucial for the industry to efficiently meet the growing demand for minerals in applications like lithium-ion batteries and sustainably contribute to the global push for renewable energy technologies.

Opportunity: Expanding applications across diverse sectors

The brine concentration minerals market is experiencing significant opportunities driven by the expanding applications across a diverse range of industries. Foremost among these is the growing demand for lithium-ion batteries, a cornerstone in the electric vehicle, consumer electronics, and grid-scale energy storage sectors. As the world pivots toward sustainable energy solutions, the market for brine-extracted minerals, particularly lithium, is set to thrive. Beyond energy storage, brine concentration minerals find applications in cutting-edge manufacturing, particularly in aerospace. Lithium, for example, is utilized in lightweight alloys, contributing to the development of advanced materials for aerospace applications. Additionally, the ceramics industry benefits from these minerals, where lithium enhances the properties of ceramics for use in electronics and high-temperature applications. Moreover, brine concentration minerals offer opportunities in the medical field. Lithium, for instance, is used in pharmaceuticals to treat mood disorders. This medical application further diversifies the market and contributes to its overall growth. The versatility of brine concentration minerals is underscored by their relevance in chemical manufacturing, where lithium and other minerals serve as essential components in various processes. Ongoing technological advancements in extraction processes present opportunities for cost optimization and improved environmental sustainability, bolstering the competitiveness of brine concentration minerals in the market. In conclusion, the expanding applications of brine concentration minerals across energy, aerospace, ceramics, medical, and manufacturing sectors offer a diverse array of opportunities for growth, innovation, and sustainable development.

Opportunity: Continuous technological advancements

Continuous technological advancements in the brine concentration minerals market present significant opportunities for enhanced efficiency, sustainability, and competitiveness. These advancements drive innovation in extraction, processing, and purification techniques, leading to several key benefits. Firstly, technological progress allowing more efficient and cost-effective methods of extracting minerals from brine. Advanced extraction technologies can increase the yield of valuable minerals, such as lithium, from low-concentration brine sources, addressing a key challenge in the industry. Improved efficiency contributes to lower production costs, making brine concentration minerals more economically viable. Secondly, innovations in technology  is enabling environmentally friendly extraction processes. Sustainable practices are gaining prominence in the mining industry, and technological advancements offer solutions for minimizing environmental impact. This includes the development of closed-loop systems, waste reduction strategies, and cleaner energy utilization in the extraction and processing of brine concentration minerals. Furthermore, continuous technological improvements contribute to the diversification of applications for brine-extracted minerals. This expands the market beyond traditional uses, such as lithium-ion batteries, into emerging sectors like advanced ceramics, aerospace, and pharmaceuticals. The ability to tailor extraction processes to meet the specific needs of different industries broadens the market reach and unlocks new business opportunities.

Challenge: Energy intensive nature and product quality consistency along with volatility in mineral prices

The energy-intensive nature of the brine concentration minerals extraction process poses a significant challenge for the industry. The concentration of minerals from brine often involves multiple stages, including evaporation, precipitation, and crystallization, which demand substantial energy inputs. The energy-intensive nature of these processes contributes to high operational costs, limiting the economic feasibility of extracting minerals from low-concentration brine sources. Moreover, maintaining consistent product quality is a challenge in brine concentration minerals extraction. Variations in the chemical composition of brine sources, along with the presence of impurities, can impact the quality and purity of the final mineral product. Achieving a consistent product quality is crucial, especially in industries such as electronics, where stringent specifications are required. Variability in product quality can lead to increased processing costs, quality control challenges, and may affect the suitability of the minerals for specific applications. Addressing these challenges requires innovative solutions, including the development of energy-efficient extraction technologies and advanced process control methods to ensure product quality consistency. Improving energy efficiency not only reduces operational costs but also aligns with global efforts to minimize the environmental footprint of mineral extraction processes. Volatility in mineral prices poses a major challenge for the brine concentration minerals market, encompassing minerals like lithium, sodium, potassium, magnesium, and calcium. The dynamic nature of these prices is influenced by factors such as global demand, geopolitical events, and technological advancements. As diverse applications across industries drive demand for these minerals, fluctuations in market conditions impact pricing unpredictability. Additionally, the competition from alternative mineral sources and changing extraction technologies contributes to price volatility. To navigate these challenges, industry players must adopt strategic measures, including diversification of end-use applications, optimizing extraction processes for cost efficiency, and exploring long-term contracts. A focus on sustainable practices and maintaining operational flexibility are crucial for the brine concentration minerals market to adapt and thrive amidst fluctuating prices

Market Ecosystem

A market ecosystem refers to the interconnected network of businesses, consumers, suppliers, and regulators in a particular market, influencing and interacting with each other. The major players in this market are Magrathea (US), Olokun Minerals (US), Albemarle Corporation (US), Ganfeng Lithium Group Co., Ltd. (China), Arcadium Lithium (US), ICL Industrial Products (Israel), SQM S.A. (Chile), Solvay (Belgium), SEALEAU (Netherlands), and Konoshima Chemical Co., Ltd. (Japan) etc.

Brine Concentration Minerals Market: Ecosystem

Brine Concentration Minerals Market Ecosystem

Source: Secondary Research, Interviews with Experts, and MarketsandMarkets Analysis

"Magnesium derivatives is the largest sub-segment amongst the type segment in the brine concentration minerals market in 2024, in terms of value."

Magnesium derivatives, derived from brine, have the potential to dominate the market due to their versatile applications across various industries. In the automotive sector, magnesium is favored for its use in lightweight components, contributing to enhanced fuel efficiency and reduced emissions. This application is crucial in addressing industry trends towards more sustainable and eco-friendly transportation solutions, thereby driving a substantial demand for magnesium derivatives. In agriculture, magnesium derivatives serve as valuable fertilizers, addressing soil magnesium deficiencies and promoting optimal plant growth. Additionally, magnesium compounds play a vital role in the pharmaceutical industry, where they are employed in the formulation of medications and dietary supplements. Their pharmaceutical applications underscore magnesium derivatives' significance in promoting health and well-being. Furthermore, in the construction industry, magnesium oxide, a derivative, finds utility as a fire-resistant material. Its use contributes to enhancing safety measures in construction, aligning with industry requirements for robust fire-resistant materials. In summary, the versatile applications of magnesium derivatives, spanning automotive, agriculture, pharmaceuticals, and construction, position them as a potentially dominant force in the brine concentration minerals market.

“Solar evaporation technology accounted for the largest share of the brine concentration minerals market in 2024” in terms of value.

Solar evaporation technology stands out for mineral extraction from brine due to several advantages. Firstly, it is cost-effective, demanding minimal infrastructure and relying on natural solar energy, thereby reducing operational costs. The simplicity of the process facilitates quick implementation and operation, leading to shorter setup times and lower initial capital investments. Considered environmentally friendly, solar evaporation avoids the use of chemical reagents and minimizes energy consumption, aligning with sustainability goals. Particularly advantageous in regions with high solar radiation, such as the lithium triangle (Chile, Argentina, Bolivia), solar evaporation targets minerals like lithium, potassium, magnesium, sodium, and calcium, depending on the brine source's characteristics.

“Metallurgical segment accounted for the largest application of the brine concentration minerals market in 2024” in terms of value.”

The metallurgical segment is the largest due to the use of certain brine concentration minerals in refractories. Refractories, heat-resistant materials used in industrial processes like metal smelting and glass manufacturing, often contain minerals like magnesium oxide, calcium oxide, and alumina derived from brine. These minerals contribute to the refractory's ability to withstand high temperatures and harsh conditions in metallurgical applications. The demand for refractories in the metallurgical industry, which includes applications like steel production and non-ferrous metal processing, is a primary driver for the prominence of the metallurgical segment in the brine concentration minerals market. The growth in the global steel industry and metallurgical activities could lead to increased demand for brine-derived minerals used in refractories, making the metallurgical segment a substantial market segment.

Asia pacific is the largest market for brine concentration minerals Market in 2024, in terms of value."

The Asia-Pacific Asia Pacific commands the largest market share for brine concentration minerals, and several factors contribute to this dominance. Primarily, the region's economic powerhouse, China, plays a pivotal role. China is a major consumer of brine concentration minerals, utilizing them extensively in various industries such as electronics, automotive, and construction. The country's robust manufacturing sector, coupled with its position as the world's largest producer of electric vehicles, propels the demand for minerals like lithium, potassium, and magnesium, which are essential components in batteries and lightweight materials. Furthermore, the Asia Pacific region is characterized by its significant agricultural activities. The use of brine concentration minerals as fertilizers to address soil nutrient deficiencies, particularly potassium and magnesium, is prevalent in agricultural practices across countries like India and China. The need for increased agricultural productivity further drives the demand for brine-derived minerals. In addition to economic activities, Asia Pacific is home to extensive lithium resources, particularly in countries like Australia and China. Lithium-ion batteries are pivotal in the energy storage sector and the burgeoning electric vehicle market. With the global push towards renewable energy and sustainable transportation, the demand for lithium-ion batteries has soared, and Asia Pacific, with its significant lithium resources, has become a key player in meeting this demand. Geographical factors also contribute to the region's dominance. The lithium-rich brine deposits in the lithium triangle (Chile, Argentina, Bolivia) are a crucial source for lithium extraction. While these deposits are located in South America, Asia Pacific nations actively engage in partnerships and investments in the region to secure a consistent supply of brine concentration minerals.

Brine Concentration Minerals Market by Region

To know about the assumptions considered for the study, download the pdf brochure

Key Market Players

The key players in this market are Magrathea (US), Olokun Minerals (US), Albemarle Corporation (US), Ganfeng Lithium Group Co., Ltd. (China), Arcadium Lithium (US), ICL Industrial Products (Israel), SQM S.A. (Chile), Solvay (Belgium), SEALEAU (Netherlands), and Konoshima Chemical Co., Ltd. (Japan) etc. Continuous developments in the market—including new product launches, mergers & acquisitions, agreements, and expansions—are expected to help the market grow. Leading manufacturers of brine concentration minerals have opted for new product launches and technological advancements to sustain their market position.

Get online access to the report on the World's First Market Intelligence Cloud

  • Easy to Download Historical Data & Forecast Numbers
  • Company Analysis Dashboard for high growth potential opportunities
  • Research Analyst Access for customization & queries
  • Competitor Analysis with Interactive dashboard
  • Latest News, Updates & Trend analysis
Request Sample

Scope of the Report

Report Metric

Details

Years considered for the study

2020-2029

Base Year

2023

Forecast period

2024–2029

Units considered

Value (USD Billion/Million)

Segments

Type, Application, Technology and Region

Regions

Asia Pacific, North America, Europe, Middle East & Africa, and South America

Companies

Magrathea (US), Olokun Minerals (US), Albemarle Corporation (US), Ganfeng Lithium Group Co., Ltd. (China), Arcadium Lithium (US), ICL Industrial Products (Israel), SQM S.A. (Chile), Solvay (Belgium), SEALEAU (Netherlands), and Konoshima Chemical Co., Ltd. (Japan)

Segmentation

This report categorizes the global Brine concentration minerals market based on type, application, technology and region.

On the basis of type, the market has been segmented as follows:
  • Sodium derivatives
  • Potassium derivatives
  • Calcium derivatives
  • Magnesium derivatives
  • Others
On the basis of application, the market has been segmented as follows:
  • Metallurgical
  • Pharmacetical and Food & beverages
  • Water treatment
  • Fertilizers
  • Construction
  • Others
On the basis of technology, the market has been segmented as follows:
  • Solar evaporation
  • NF-RO-MF
  • Osmotically assisted RO (OARO)
  • Others
On the basis of region, the market has been segmented as follows:
  • North America
  • Europe
  • Asia Pacific
  • Middle East & Africa
  • South America

Recent Developments

  • In December 2023, Ganfeng Lithium Group Co., Ltd. officially commenced production at the Cauchari-Olaroz salt lake project in Argentina. The lithium resource at Cauchari-Olaroz totals approximately 24.58 million tons of lithium carbonate equivalent (LCE), making it one of the largest salt lake lithium extraction projects globally. Ganfeng has control over this project. The planned Phase 1 capacity of the project is 40,000 tons of LCE, with Phase 2 not less than 20,000 tons of LCE.
  • In September 2023, Albemarle Corporation announced that the U.S. Department of Defense has approved a USD 90 million grant to help support the expansion of domestic mining and the production of lithium for the nation's battery supply chain. The funding will be provided by the Office of the Assistant Secretary of Defense for Industrial Base Policy, utilizing Defense Production Act authorities, and will be used to purchase a fleet of mining equipment as part of the company's planned reopening of its lithium mine in Kings Mountain, North Carolina.
  • In March 2023, Albemarle Corporation announced plans to locate its previously announced lithium hydroxide Mega-Flex facility in Chester County, South Carolina, US. Plans for the facility include an initial investment of at least USD 1.3 billion to help meet the surging demand for domestic and international electric vehicles and lithium-ion batteries.
  • In October 2022, Albemarle Corporation announced that its subsidiary, Albemarle Lithium UK Limited, has completed the acquisition of Guangxi Tianyuan New Energy Materials Co., Ltd. ("Tianyuan") for approximately USD 200 million. Located near the Port of Qinzhou in Guangxi, Tianyuan's operations include a lithium conversion plant with a designed annual conversion capacity of up to 25,000 metric tons LCE (lithium carbonate equivalent) and can produce battery-grade lithium carbonate and lithium hydroxide
  • In June 2022, Albemarle Corporation, present in Chile for more than 40 years, inaugurated its third chemical conversion plant, La Negra III/IV, in Antofagasta (Chile) as one of the most modern chemical conversion plants in Latin America. With new technology, the plant is expected to double lithium production and further reduce the company’s low-freshwater consumption in this process, marking a clear commitment to sustainable production.

Frequently Asked Questions (FAQ):

To speak to our analyst for a discussion on the above findings, click Speak to Analyst

TABLE OF CONTENTS
 
1 INTRODUCTION (Page No. - 32)
    1.1 STUDY OBJECTIVES 
    1.2 MARKET DEFINITION 
    1.3 INCLUSIONS & EXCLUSIONS 
    1.4 MARKET SCOPE 
          FIGURE 1 BRINE CONCENTRATION MINERALS MARKET SEGMENTATION
           1.4.1 REGIONS COVERED
           1.4.2 YEARS CONSIDERED
    1.5 CURRENCY CONSIDERED 
    1.6 UNITS CONSIDERED 
    1.7 LIMITATIONS 
    1.8 STAKEHOLDERS 
 
2 RESEARCH METHODOLOGY (Page No. - 36)
    2.1 RESEARCH DATA 
          FIGURE 2 BRINE CONCENTRATION MINERALS MARKET: RESEARCH DESIGN
           2.1.1 SECONDARY DATA
           2.1.2 PRIMARY DATA
                    2.1.2.1 Key brine concentration mineral manufacturers
                    2.1.2.2 Breakdown of interviews with experts
                    2.1.2.3 Key industry insights
    2.2 BASE NUMBER CALCULATION 
           2.2.1 APPROACH 1: SUPPLY-SIDE ANALYSIS
           2.2.2 APPROACH 2: DEMAND-SIDE ANALYSIS
    2.3 FORECAST NUMBER CALCULATION 
           2.3.1 SUPPLY SIDE
           2.3.2 DEMAND SIDE
    2.4 MARKET SIZE ESTIMATION 
          FIGURE 3 MARKET SIZE ESTIMATION METHODOLOGY: REVENUE OF MARKET PLAYERS
           2.4.1 BOTTOM-UP APPROACH
           2.4.2 TOP-DOWN APPROACH
    2.5 DATA TRIANGULATION 
          FIGURE 4 BRINE CONCENTRATION MINERALS MARKET: DATA TRIANGULATION
    2.6 ASSUMPTIONS 
    2.7 RECESSION IMPACT 
    2.8 GROWTH FORECAST 
    2.9 RISK ASSESSMENT 
 
3 EXECUTIVE SUMMARY (Page No. - 46)
    FIGURE 5 METALLURGICAL APPLICATION TO DOMINATE MARKET BETWEEN  2024 AND 2029
    FIGURE 6 SOLAR EVAPORATION TECHNOLOGY TO LEAD MARKET BETWEEN  2024 AND 2029
    FIGURE 7 MAGNESIUM DERIVATIVES TO DOMINATE MARKET DURING FORECAST PERIOD
    FIGURE 8 ASIA PACIFIC TO DOMINATE MARKET DURING FORECAST PERIOD
 
4 PREMIUM INSIGHTS (Page No. - 51)
    4.1 ATTRACTIVE OPPORTUNITIES FOR PLAYERS IN BRINE CONCENTRATION MINERALS MARKET 
          FIGURE 9 GROWING DEMAND FOR LITHIUM-ION BATTERIES TO DRIVE MARKET
    4.2 BRINE CONCENTRATION MINERALS MARKET, BY TYPE 
          FIGURE 10 MAGNESIUM DERIVATIVES TO BE FASTEST-GROWING TYPE DURING  FORECAST PERIOD
    4.3 BRINE CONCENTRATION MINERALS MARKET, BY APPLICATION 
          FIGURE 11 WATER TREATMENT TO BE FASTEST-GROWING APPLICATION DURING  FORECAST PERIOD
    4.4 BRINE CONCENTRATION MINERALS MARKET, BY TECHNOLOGY 
          FIGURE 12 NF-RO-MF TO BE FASTEST-GROWING TECHNOLOGY DURING FORECAST PERIOD
    4.5 BRINE CONCENTRATION MINERALS MARKET, BY REGION 
          FIGURE 13 ASIA PACIFIC TO BE FASTEST-GROWING REGION DURING FORECAST PERIOD
 
5 MARKET OVERVIEW (Page No. - 54)
    5.1 INTRODUCTION 
    5.2 MARKET DYNAMICS 
          FIGURE 14 BRINE CONCENTRATION MINERALS MARKET: DRIVERS, RESTRAINTS, OPPORTUNITIES, AND CHALLENGES
           5.2.1 DRIVERS
                    5.2.1.1 Growing demand for lithium-ion batteries
                    5.2.1.2 Global emphasis on sustainable practices
           5.2.2 RESTRAINTS
                    5.2.2.1 Low mineral concentrations and selective mineral recovery
           5.2.3 OPPORTUNITIES
                    5.2.3.1 Wide deployment of minerals in industrial processes and power generation
                    5.2.3.2 Technological advancements in brine concentration methods
           5.2.4 CHALLENGES
                    5.2.4.1 Variability in mineral composition and product quality
                    5.2.4.2 Volatility in mineral prices

6 INDUSTRY TRENDS (Page No. - 58)
    6.1 INTRODUCTION 
    6.2 TRENDS/DISRUPTIONS IMPACTING CUSTOMER BUSINESS 
           6.2.1 REVENUE SHIFT AND NEW REVENUE POCKETS FOR BRINE CONCENTRATION MINERAL MANUFACTURERS
                    FIGURE 15 REVENUE SHIFT OF BRINE CONCENTRATION MINERALS MARKET
    6.3 VALUE CHAIN ANALYSIS 
          FIGURE 16 OVERVIEW OF BRINE CONCENTRATION MINERALS MARKET VALUE CHAIN
           6.3.1 INBOUND LOGISTICS
           6.3.2 MANUFACTURING
           6.3.3 STORAGE & DISTRIBUTION
           6.3.4 END-USE INDUSTRIES
    6.4 PRICING ANALYSIS 
           6.4.1 AVERAGE SELLING PRICE TREND, BY REGION
                    TABLE 1 AVERAGE SELLING PRICE, BY REGION, 2020–2029 (USD/TON)
                    FIGURE 17 BRINE CONCENTRATION MINERALS MARKET: AVERAGE SELLING PRICE TREND, BY REGION
           6.4.2 AVERAGE SELLING PRICE TREND, BY TYPE
                    TABLE 2 AVERAGE SELLING PRICE, BY TYPE, 2020–2029 (USD/TON)
           6.4.3 AVERAGE SELLING PRICE TREND OF KEY PLAYERS, BY TOP THREE TYPES
                    TABLE 3 AVERAGE SELLING PRICE, BY TOP THREE TYPES, 2020–2029 (USD/TON)
                    FIGURE 18 AVERAGE SELLING PRICE TREND OF KEY PLAYERS, BY TOP 3 TYPES
           6.4.4 AVERAGE SELLING PRICE TREND, BY TECHNOLOGY
                    TABLE 4 AVERAGE SELLING PRICE, BY TECHNOLOGY, 2020–2029 (USD/TON)
           6.4.5 AVERAGE SELLING PRICE TREND, BY APPLICATION
                    TABLE 5 AVERAGE SELLING PRICE, BY APPLICATION, 2020–2029 (USD/TON)
    6.5 ECOSYSTEM MAP 
          TABLE 6 BRINE CONCENTRATION MINERALS MARKET: ECOSYSTEM
    6.6 TECHNOLOGY ANALYSIS 
          TABLE 7 TECHNOLOGIES OFFERED IN BRINE CONCENTRATION MINERALS MARKET
    6.7 PATENT ANALYSIS 
           6.7.1 METHODOLOGY
           6.7.2 GRANTED PATENTS
                    TABLE 8 TOTAL NUMBER OF PATENTS, 2014–2023
                    6.7.2.1 Publication trend over last ten years
                                FIGURE 19 PATENTS GRANTED OVER LAST TEN YEARS
           6.7.3 INSIGHTS
           6.7.4 LEGAL STATUS
                    FIGURE 20 PATENT ANALYSIS, BY LEGAL STATUS
           6.7.5 JURISDICTION ANALYSIS
                    FIGURE 21 REGIONAL ANALYSIS OF PATENTS GRANTED FOR BRINE CONCENTRATION MINERALS MARKET, 2023
           6.7.6 TOP APPLICANTS
                    FIGURE 22 TOP 10 COMPANIES WITH HIGHEST NUMBER OF PATENTS IN LAST TEN YEARS
                    TABLE 9 MAJOR PATENT OWNERS FOR BRINE CONCENTRATION MINERALS
           6.7.7 KEY PATENTS FOR BRINE CONCENTRATION MINERALS
                    TABLE 10 BRINE CONCENTRATION MINERALS MARKET: MAJOR PATENTS
    6.8 TRADE ANALYSIS 
           6.8.1 IMPORT SCENARIO
                    FIGURE 23 IMPORTS OF BRINE CONCENTRATION MINERALS, BY COUNTRY,  2022 (USD MILLION)
           6.8.2 EXPORT SCENARIO
                    FIGURE 24 EXPORTS OF BRINE CONCENTRATION MINERALS, BY COUNTRY,  2022 (USD MILLION)
    6.9 KEY CONFERENCES & EVENTS IN 2024–2025 
          TABLE 11 BRINE CONCENTRATION MINERALS MARKET: KEY CONFERENCES AND EVENTS,  2024–2025
    6.10 TARIFF AND REGULATORY LANDSCAPE 
           6.10.1 TARIFFS RELATED TO BRINE CONCENTRATION MINERALS MARKET
                     TABLE 12 TARIFFS FOR BRINE CONCENTRATION MINERALS MARKET
           6.10.2 REGULATORY BODIES, GOVERNMENT AGENCIES, AND OTHER ORGANIZATIONS
                     TABLE 13 NORTH AMERICA: REGULATORY BODIES, GOVERNMENT AGENCIES, AND OTHER ORGANIZATIONS
                     TABLE 14 EUROPE: REGULATORY BODIES, GOVERNMENT AGENCIES, AND OTHER ORGANIZATIONS
                     TABLE 15 ASIA PACIFIC: REGULATORY BODIES, GOVERNMENT AGENCIES,  AND OTHER ORGANIZATIONS
                     TABLE 16 MIDDLE EAST & AFRICA: REGULATORY BODIES, GOVERNMENT AGENCIES,  AND OTHER ORGANIZATIONS
                     TABLE 17 SOUTH AMERICA: REGULATORY BODIES, GOVERNMENT AGENCIES,  AND OTHER ORGANIZATIONS
           6.10.3 REGULATIONS RELATED TO BRINE CONCENTRATION MINERALS MARKET
                     TABLE 18 REGULATIONS FOR BRINE CONCENTRATION MINERALS MARKET
    6.11 PORTER’S FIVE FORCES ANALYSIS 
           TABLE 19 IMPACT OF PORTER’S FIVE FORCES ON BRINE CONCENTRATION MINERALS MARKET
           FIGURE 25 PORTER’S FIVE FORCES ANALYSIS: BRINE CONCENTRATION MINERALS MARKET
           6.11.1 THREAT OF NEW ENTRANTS
           6.11.2 THREAT OF SUBSTITUTES
           6.11.3 BARGAINING POWER OF SUPPLIERS
           6.11.4 BARGAINING POWER OF BUYERS
           6.11.5 INTENSITY OF COMPETITIVE RIVALRY
    6.12 KEY STAKEHOLDERS AND BUYING CRITERIA 
           6.12.1 KEY STAKEHOLDERS IN BUYING PROCESS
                     FIGURE 26 INFLUENCE OF STAKEHOLDERS ON BUYING PROCESS FOR TOP THREE APPLICATIONS
                     TABLE 20 INFLUENCE OF INSTITUTIONAL BUYERS ON BUYING PROCESS FOR TOP THREE APPLICATIONS
           6.12.2 BUYING CRITERIA
                     FIGURE 27 KEY BUYING CRITERIA
                     TABLE 21 KEY BUYING CRITERIA FOR TOP THREE APPLICATIONS
    6.13 MACROECONOMIC INDICATORS 
           6.13.1 GDP TRENDS AND FORECAST OF MAJOR ECONOMIES
    6.14 CASE STUDY ANALYSIS 
           6.14.1 INCREASING GLOBAL DESALINATION ACTIVITIES AND SUSTAINABLE BRINE MANAGEMENT
           6.14.2 ENVIRONMENTAL IMPACT OF DIRECT LITHIUM EXTRACTION FROM BRINES
           6.14.3 EXTRACTING MINERALS BY DESALINATING BRINE USING INNOVATIVE CAPACITIVE PHOTO ELECTROCATALYTIC DESALINATION CELLS
 
7 BRINE CONCENTRATION MINERALS MARKET, BY TECHNOLOGY (Page No. - 87)
    7.1 INTRODUCTION 
          FIGURE 28 SOLAR EVAPORATION SEGMENT TO LEAD MARKET DURING FORECAST PERIOD
          TABLE 23 BRINE CONCENTRATION MINERALS MARKET, BY TECHNOLOGY,  2020–2023 (USD MILLION)
          TABLE 24 BRINE CONCENTRATION MINERALS MARKET, BY TECHNOLOGY,  2024–2029 (USD MILLION)
          TABLE 25 BRINE CONCENTRATION MINERALS MARKET, BY TECHNOLOGY, 2020–2023 (KILOTON)
          TABLE 26 BRINE CONCENTRATION MINERALS MARKET, BY TECHNOLOGY, 2024–2029 (KILOTON)
    7.2 SOLAR EVAPORATION 
           7.2.1 EFFICIENT MINERAL EXTRACTION FROM SEAWATER DISTILLATION BRINE TO DRIVE MARKET
    7.3 NANOFILTRATION-REVERSE OSMOSIS-MICROFILTRATION 
           7.3.1 GROWING DEMAND FOR EFFECTIVE MINERAL EXTRACTION METHODS TO BOOST MARKET
    7.4 OSMOTICALLY ASSISTED RO 
           7.4.1 INCREASING NEED FOR HIGH WATER RECOVERY AND MINERAL CONCENTRATION TO DRIVE MARKET
    7.5 OTHER TECHNOLOGIES 
           7.5.1 MEMBRANE DISTILLATION AND NANOFILTRATION
           7.5.2 FORWARD OSMOSIS AND MEMBRANE CAPACITIVE DEIONIZATION
 
8 BRINE CONCENTRATION MINERALS, BY APPLICATION (Page No. - 93)
    8.1 INTRODUCTION 
          FIGURE 29 METALLURGICAL SEGMENT TO LEAD MARKET DURING FORECAST PERIOD
          TABLE 27 BRINE CONCENTRATION MINERALS MARKET, BY APPLICATION,  2020–2023 (USD MILLION)
          TABLE 28 BRINE CONCENTRATION MINERALS MARKET, BY APPLICATION,  2024–2029 (USD MILLION)
          TABLE 29 BRINE CONCENTRATION MINERALS MARKET, BY APPLICATION, 2020–2023 (KILOTON)
          TABLE 30 BRINE CONCENTRATION MINERALS MARKET, BY APPLICATION, 2024–2029 (KILOTON)
    8.2 METALLURGICAL 
           8.2.1 RESISTANCE TO EXTREME TEMPERATURES AND ENVIRONMENTAL SUSTAINABILITY TO FUEL MARKET
    8.3 PHARMACEUTICAL AND FOOD & BEVERAGES 
           8.3.1 WIDE USE OF ESSENTIAL MINERALS IN PHARMACEUTICAL AND FOOD INDUSTRIES TO DRIVE MARKET
    8.4 WATER TREATMENT 
           8.4.1 HIGH EFFICACY OF BRINE MINERALS IN WATER PURIFICATION TO DRIVE MARKET
    8.5 FERTILIZERS 
           8.5.1 WIDE DEPLOYMENT IN SPECIFIC FORMULATIONS TO FUEL MARKET
    8.6 CONSTRUCTION 
           8.6.1 EXTENSIVE USE IN WALL CLADDING AND CEILING SYSTEMS TO DRIVE MARKET
    8.7 OTHER APPLICATIONS 
           8.7.1 PULP & PAPER
           8.7.2 PLASTICS
           8.7.3 POWER ELECTRONICS/ENERGY
 
9 BRINE CONCENTRATION MINERALS MARKET, BY TYPE (Page No. - 101)
    9.1 INTRODUCTION 
          FIGURE 30 MAGNESIUM DERIVATIVES TO LEAD MARKET DURING FORECAST PERIOD
          TABLE 31 BRINE CONCENTRATION MINERALS MARKET, BY TYPE, 2020–2023 (USD MILLION)
          TABLE 32 BRINE CONCENTRATION MINERALS MARKET, BY TYPE, 2024–2029 (USD MILLION)
          TABLE 33 BRINE CONCENTRATION MINERALS MARKET, BY TYPE, 2020–2023 (KILOTON)
          TABLE 34 BRINE CONCENTRATION MINERALS MARKET, BY TYPE, 2024–2029 (KILOTON)
    9.2 SODIUM DERIVATIVES 
           9.2.1 WIDE APPLICATION IN AGRICULTURAL AND CONSUMER GOODS INDUSTRIES TO DRIVE MARKET
    9.3 MAGNESIUM DERIVATIVES 
           9.3.1 RISING DEMAND FROM CONSTRUCTION SECTOR TO BOOST MARKET
    9.4 CALCIUM DERIVATIVES 
           9.4.1 EXTENSIVE USE IN FOOD PRESERVATION TECHNIQUES TO DRIVE MARKET
    9.5 POTASSIUM DERIVATIVES 
           9.5.1 INCREASING DEMAND IN CRYSTALLIZATION TECHNIQUES TO FUEL MARKET
    9.6 OTHER TYPES 
           9.6.1 BROMINE
           9.6.2 BORON
           9.6.3 LITHIUM DERIVATIVES
 
10 BRINE CONCENTRATION MINERALS MARKET, BY REGION (Page No. - 108)
     10.1 INTRODUCTION 
             FIGURE 31 ASIA PACIFIC TO BE FASTEST-GROWING MARKET DURING FORECAST PERIOD
             TABLE 35 BRINE CONCENTRATION MINERALS MARKET, BY REGION, 2020–2023 (USD MILLION)
             TABLE 36 BRINE CONCENTRATION MINERALS MARKET, BY REGION, 2024–2029 (USD MILLION)
             TABLE 37 BRINE CONCENTRATION MINERALS MARKET, BY REGION, 2020–2023 (KILOTON)
             TABLE 38 BRINE CONCENTRATION MINERALS MARKET, BY REGION, 2024–2029 (KILOTON)
     10.2 ASIA PACIFIC 
             10.2.1 RECESSION IMPACT
                        FIGURE 32 ASIA PACIFIC: BRINE CONCENTRATION MINERALS MARKET SNAPSHOT
                        TABLE 39 ASIA PACIFIC: BRINE CONCENTRATION MINERALS MARKET, BY COUNTRY,  2020–2023 (USD MILLION)
                        TABLE 40 ASIA PACIFIC: BRINE CONCENTRATION MINERALS MARKET, BY COUNTRY,  2024–2029 (USD MILLION)
                        TABLE 41 ASIA PACIFIC: BRINE CONCENTRATION MINERALS MARKET, BY COUNTRY,  2020–2023 (KILOTON)
                        TABLE 42 ASIA PACIFIC: BRINE CONCENTRATION MINERALS MARKET, BY COUNTRY,  2024–2029 (KILOTON)
                        TABLE 43 ASIA PACIFIC: BRINE CONCENTRATION MINERALS MARKET, BY APPLICATION,  2020–2023 (USD MILLION)
                        TABLE 44 ASIA PACIFIC: BRINE CONCENTRATION MINERALS MARKET, BY APPLICATION,  2024–2029 (USD MILLION)
                        TABLE 45 ASIA PACIFIC: BRINE CONCENTRATION MINERALS MARKET, BY APPLICATION,  2020–2023 (KILOTON)
                        TABLE 46 ASIA PACIFIC: BRINE CONCENTRATION MINERALS MARKET, BY APPLICATION,  2024–2029 (KILOTON)
             10.2.2 CHINA
                        10.2.2.1 Advancements in mineral extraction technology to drive market
                                      TABLE 47 CHINA: BRINE CONCENTRATION MINERALS MARKET, BY APPLICATION,  2020–2023 (USD MILLION)
                                      TABLE 48 CHINA: BRINE CONCENTRATION MINERALS MARKET, BY APPLICATION,  2024–2029 (USD MILLION)
                                      TABLE 49 CHINA: BRINE CONCENTRATION MINERALS MARKET, BY APPLICATION,  2020–2023 (KILOTON)
                                      TABLE 50 CHINA: BRINE CONCENTRATION MINERALS MARKET, BY APPLICATION,  2024–2029 (KILOTON)
             10.2.3 JAPAN
                        10.2.3.1 Well-established automotive and electronics sectors to drive market
                                      TABLE 51 JAPAN: BRINE CONCENTRATION MINERALS MARKET, BY APPLICATION,  2020–2023 (USD MILLION)
                                      TABLE 52 JAPAN: BRINE CONCENTRATION MINERALS MARKET, BY APPLICATION,  2024–2029 (USD MILLION)
                                      TABLE 53 JAPAN: BRINE CONCENTRATION MINERALS MARKET, BY APPLICATION,  2020–2023 (KILOTON)
                                      TABLE 54 JAPAN: BRINE CONCENTRATION MINERALS MARKET, BY APPLICATION,  2024–2029 (KILOTON)
             10.2.4 INDIA
                        10.2.4.1 Economic development and adoption of sustainable technologies to drive market
                                      TABLE 55 INDIA: BRINE CONCENTRATION MINERALS MARKET, BY APPLICATION,  2020–2023 (USD MILLION)
                                      TABLE 56 INDIA: BRINE CONCENTRATION MINERALS MARKET, BY APPLICATION,  2024–2029 (USD MILLION)
                                      TABLE 57 INDIA: BRINE CONCENTRATION MINERALS MARKET, BY APPLICATION,  2020–2023 (KILOTON)
                                      TABLE 58 INDIA: BRINE CONCENTRATION MINERALS MARKET, BY APPLICATION,  2024–2029 (KILOTON)
             10.2.5 SOUTH KOREA
                        10.2.5.1 Rising demand for electric vehicles and renewable energy technology to drive market
                                      TABLE 59 SOUTH KOREA: BRINE CONCENTRATION MINERALS MARKET, BY APPLICATION,  2020–2023 (USD MILLION)
                                      TABLE 60 SOUTH KOREA: BRINE CONCENTRATION MINERALS MARKET, BY APPLICATION,  2024–2029 (USD MILLION)
                                      TABLE 61 SOUTH KOREA: BRINE CONCENTRATION MINERALS MARKET, BY APPLICATION,  2020–2023 (KILOTON)
                                      TABLE 62 SOUTH KOREA: BRINE CONCENTRATION MINERALS MARKET, BY APPLICATION,  2024–2029 (KILOTON)
             10.2.6 REST OF ASIA PACIFIC
                        TABLE 63 REST OF ASIA PACIFIC: BRINE CONCENTRATION MINERALS MARKET, BY APPLICATION, 2020–2023 (USD MILLION)
                        TABLE 64 REST OF ASIA PACIFIC: BRINE CONCENTRATION MINERALS MARKET, BY APPLICATION, 2024–2029 (USD MILLION)
                        TABLE 65 REST OF ASIA PACIFIC: BRINE CONCENTRATION MINERALS MARKET, BY APPLICATION, 2020–2023 (KILOTON)
                        TABLE 66 REST OF ASIA PACIFIC: BRINE CONCENTRATION MINERALS MARKET, BY APPLICATION, 2024–2029 (KILOTON)
     10.3 NORTH AMERICA 
             10.3.1 RECESSION IMPACT
                        FIGURE 33 NORTH AMERICA: BRINE CONCENTRATION MINERALS MARKET SNAPSHOT
                        TABLE 67 NORTH AMERICA: BRINE CONCENTRATION MINERALS MARKET, BY COUNTRY,  2020–2023 (USD MILLION)
                        TABLE 68 NORTH AMERICA: BRINE CONCENTRATION MINERALS MARKET, BY COUNTRY,  2024–2029 (USD MILLION)
                        TABLE 69 NORTH AMERICA: BRINE CONCENTRATION MINERALS MARKET, BY COUNTRY,  2020–2023 (KILOTON)
                        TABLE 70 NORTH AMERICA: BRINE CONCENTRATION MINERALS MARKET, BY COUNTRY,  2024–2029 (KILOTON)
                        TABLE 71 NORTH AMERICA: BRINE CONCENTRATION MINERALS MARKET, BY APPLICATION,  2020–2023 (USD MILLION)
                        TABLE 72 NORTH AMERICA: BRINE CONCENTRATION MINERALS MARKET, BY APPLICATION,  2024–2029 (USD MILLION)
                        TABLE 73 NORTH AMERICA: BRINE CONCENTRATION MINERALS MARKET, BY APPLICATION,  2020–2023 (KILOTON)
                        TABLE 74 NORTH AMERICA: BRINE CONCENTRATION MINERALS MARKET, BY APPLICATION,  2024–2029 (KILOTON)
             10.3.2 US
                        10.3.2.1 Growth of manufacturing sector to drive market
                                      TABLE 75 US: BRINE CONCENTRATION MINERALS MARKET, BY APPLICATION,  2020–2023 (USD MILLION)
                                      TABLE 76 US: BRINE CONCENTRATION MINERALS MARKET, BY APPLICATION,  2024–2029 (USD MILLION)
                                      TABLE 77 US: BRINE CONCENTRATION MINERALS MARKET, BY APPLICATION,  2020–2023 (KILOTON)
                                      TABLE 78 US: BRINE CONCENTRATION MINERALS MARKET, BY APPLICATION,  2024–2029 (KILOTON)
             10.3.3 CANADA
                        10.3.3.1 Increasing demand for lithium-ion batteries to fuel market
                                      TABLE 79 CANADA: BRINE CONCENTRATION MINERALS MARKET, BY APPLICATION,  2020–2023 (USD MILLION)
                                      TABLE 80 CANADA: BRINE CONCENTRATION MINERALS MARKET, BY APPLICATION,  2024–2029 (USD MILLION)
                                      TABLE 81 CANADA: BRINE CONCENTRATION MINERALS MARKET, BY APPLICATION,  2020–2023 (KILOTON)
                                      TABLE 82 CANADA: BRINE CONCENTRATION MINERALS MARKET, BY APPLICATION,  2024–2029 (KILOTON)
             10.3.4 MEXICO
                        10.3.4.1 Thriving mining and automotive sectors to drive market
                                      TABLE 83 MEXICO: BRINE CONCENTRATION MINERALS MARKET, BY APPLICATION,  2020–2023 (USD MILLION)
                                      TABLE 84 MEXICO: BRINE CONCENTRATION MINERALS MARKET, BY APPLICATION,  2024–2029 (USD MILLION)
                                      TABLE 85 MEXICO: BRINE CONCENTRATION MINERALS MARKET, BY APPLICATION,  2020–2023 (KILOTON)
                                      TABLE 86 MEXICO: BRINE CONCENTRATION MINERALS MARKET, BY APPLICATION,  2024–2029 (KILOTON)
     10.4 EUROPE 
             10.4.1 RECESSION IMPACT
                        FIGURE 34 EUROPE: BRINE CONCENTRATION MINERALS MARKET SNAPSHOT
                        TABLE 87 EUROPE: BRINE CONCENTRATION MINERALS MARKET, BY COUNTRY,  2020–2023 (USD MILLION)
                        TABLE 88 EUROPE: BRINE CONCENTRATION MINERALS MARKET, BY COUNTRY,  2024–2029 (USD MILLION)
                        TABLE 89 EUROPE: BRINE CONCENTRATION MINERALS MARKET, BY COUNTRY,  2020–2023 (KILOTON)
                        TABLE 90 EUROPE: BRINE CONCENTRATION MINERALS MARKET, BY COUNTRY,  2024–2029 (KILOTON)
                        TABLE 91 EUROPE: BRINE CONCENTRATION MINERALS MARKET, BY APPLICATION,  2020–2023 (USD MILLION)
                        TABLE 92 EUROPE: BRINE CONCENTRATION MINERALS MARKET, BY APPLICATION,  2024–2029 (USD MILLION)
                        TABLE 93 EUROPE: BRINE CONCENTRATION MINERALS MARKET, BY APPLICATION,  2020–2023 (KILOTON)
                        TABLE 94 EUROPE: BRINE CONCENTRATION MINERALS MARKET, BY APPLICATION,  2024–2029 (KILOTON)
             10.4.2 GERMANY
                        10.4.2.1 Wide establishment of chemical industries to drive market
                                      TABLE 95 GERMANY: BRINE CONCENTRATION MINERALS MARKET, BY APPLICATION,  2020–2023 (USD MILLION)
                                      TABLE 96 GERMANY: BRINE CONCENTRATION MINERALS MARKET, BY APPLICATION,  2024–2029 (USD MILLION)
                                      TABLE 97 GERMANY: BRINE CONCENTRATION MINERALS MARKET, BY APPLICATION,  2020–2023 (KILOTON)
                                      TABLE 98 GERMANY: BRINE CONCENTRATION MINERALS MARKET, BY APPLICATION,  2024–2029 (KILOTON)
             10.4.3 ITALY
                        10.4.3.1 Increased adoption of desalination systems to fuel market
                                      TABLE 99 ITALY: BRINE CONCENTRATION MINERALS MARKET, BY APPLICATION,  2020–2023 (USD MILLION)
                                      TABLE 100 ITALY: BRINE CONCENTRATION MINERALS MARKET, BY APPLICATION,  2024–2029 (USD MILLION)
                                      TABLE 101 ITALY: BRINE CONCENTRATION MINERALS MARKET, BY APPLICATION,  2020–2023 (KILOTON)
                                      TABLE 102 ITALY: BRINE CONCENTRATION MINERALS MARKET, BY APPLICATION,  2024–2029 (KILOTON)
             10.4.4 FRANCE
                        10.4.4.1 Increased lithium extraction and rapid expansion of electric vehicles to drive market
                                      TABLE 103 FRANCE: BRINE CONCENTRATION MINERALS MARKET, BY APPLICATION,  2020–2023 (USD MILLION)
                                      TABLE 104 FRANCE: BRINE CONCENTRATION MINERALS MARKET, BY APPLICATION,  2024–2029 (USD MILLION)
                                      TABLE 105 FRANCE: BRINE CONCENTRATION MINERALS MARKET, BY APPLICATION,  2020–2023 (KILOTON)
                                      TABLE 106 FRANCE: BRINE CONCENTRATION MINERALS MARKET, BY APPLICATION,  2024–2029 (KILOTON)
             10.4.5 UK
                        10.4.5.1 Rising environmental consciousness and deployment of desalination plants to drive market
                                      TABLE 107 UK: BRINE CONCENTRATION MINERALS MARKET, BY APPLICATION,  2020–2023 (USD MILLION)
                                      TABLE 108 UK: BRINE CONCENTRATION MINERALS MARKET, BY APPLICATION,  2024–2029 (USD MILLION)
                                      TABLE 109 UK: BRINE CONCENTRATION MINERALS MARKET, BY APPLICATION,  2020–2023 (KILOTON)
                                      TABLE 110 UK: BRINE CONCENTRATION MINERALS MARKET, BY APPLICATION,  2024–2029 (KILOTON)
             10.4.6 SPAIN
                        10.4.6.1 Infrastructure development and investments in renewable energy projects to drive market
                                      TABLE 111 SPAIN: BRINE CONCENTRATION MINERALS MARKET, BY APPLICATION,  2020–2023 (USD MILLION)
                                      TABLE 112 SPAIN: BRINE CONCENTRATION MINERALS MARKET, BY APPLICATION,  2024–2029 (USD MILLION)
                                      TABLE 113 SPAIN: BRINE CONCENTRATION MINERALS MARKET, BY APPLICATION,  2020–2023 (KILOTON)
                                      TABLE 114 SPAIN: BRINE CONCENTRATION MINERALS MARKET, BY APPLICATION,  2024–2029 (KILOTON)
             10.4.7 REST OF EUROPE
                        TABLE 115 REST OF EUROPE: BRINE CONCENTRATION MINERALS MARKET, BY APPLICATION,  2020–2023 (USD MILLION)
                        TABLE 116 REST OF EUROPE: BRINE CONCENTRATION MINERALS MARKET, BY APPLICATION,  2024–2029 (USD MILLION)
                        TABLE 117 REST OF EUROPE: BRINE CONCENTRATION MINERALS MARKET, BY APPLICATION,  2020–2023 (KILOTON)
                        TABLE 118 REST OF EUROPE: BRINE CONCENTRATION MINERALS MARKET, BY APPLICATION,  2024–2029 (KILOTON)
     10.5 MIDDLE EAST & AFRICA 
             10.5.1 RECESSION IMPACT
                        TABLE 119 MIDDLE EAST & AFRICA: BRINE CONCENTRATION MINERALS MARKET, BY COUNTRY, 2020–2023 (USD MILLION)
                        TABLE 120 MIDDLE EAST & AFRICA: BRINE CONCENTRATION MINERALS MARKET, BY COUNTRY, 2024–2029 (USD MILLION)
                        TABLE 121 MIDDLE EAST & AFRICA: BRINE CONCENTRATION MINERALS MARKET, BY COUNTRY, 2020–2023 (KILOTON)
                        TABLE 122 MIDDLE EAST & AFRICA: BRINE CONCENTRATION MINERALS MARKET, BY COUNTRY, 2024–2029 (KILOTON)
                        TABLE 123 MIDDLE EAST & AFRICA: BRINE CONCENTRATION MINERALS MARKET, BY APPLICATION, 2020–2023 (USD MILLION)
                        TABLE 124 MIDDLE EAST & AFRICA: BRINE CONCENTRATION MINERALS MARKET, BY APPLICATION, 2024–2029 (USD MILLION)
                        TABLE 125 MIDDLE EAST & AFRICA: BRINE CONCENTRATION MINERALS MARKET, BY APPLICATION, 2019–2022 (KILOTON)
                        TABLE 126 MIDDLE EAST & AFRICA: BRINE CONCENTRATION MINERALS MARKET, BY APPLICATION, 2024–2029 (KILOTON)
             10.5.2 GCC COUNTRIES
                        TABLE 127 GCC COUNTRIES: BRINE CONCENTRATION MINERALS MARKET, BY APPLICATION,  2020–2023 (USD MILLION)
                        TABLE 128 GCC COUNTRIES: BRINE CONCENTRATION MINERALS MARKET, BY APPLICATION,  2024–2029 (USD MILLION)
                        TABLE 129 GCC COUNTRIES: BRINE CONCENTRATION MINERALS MARKET, BY APPLICATION,  2019–2022 (KILOTON)
                        TABLE 130 GCC COUNTRIES: BRINE CONCENTRATION MINERALS MARKET, BY APPLICATION,  2024–2029 (KILOTON)
                        10.5.2.1 SAUDI ARABIA
                                     10.5.2.1.1 Economic diversification and increasing infrastructure development projects to drive market
                                                     TABLE 131 SAUDI ARABIA: BRINE CONCENTRATION MINERALS MARKET, BY APPLICATION,  2020–2023 (USD MILLION)
                                                     TABLE 132 SAUDI ARABIA: BRINE CONCENTRATION MINERALS MARKET, BY APPLICATION,  2024–2029 (USD MILLION)
                                                     TABLE 133 SAUDI ARABIA: BRINE CONCENTRATION MINERALS MARKET, BY APPLICATION,  2020–2023 (KILOTON)
                                                     TABLE 134 SAUDI ARABIA: BRINE CONCENTRATION MINERALS MARKET, BY APPLICATION,  2024–2029 (KILOTON)
                        10.5.2.2 UAE
                                     10.5.2.2.1 Strategic diversification and focus on renewable energy projects to drive market
                                                     TABLE 135 UAE: BRINE CONCENTRATION MINERALS MARKET, BY APPLICATION,  2020–2023 (USD MILLION)
                                                     TABLE 136 UAE: BRINE CONCENTRATION MINERALS MARKET, BY APPLICATION,  2024–2029 (USD MILLION)
                                                     TABLE 137 UAE: BRINE CONCENTRATION MINERALS MARKET, BY APPLICATION,  2020–2023 (KILOTON)
                                                     TABLE 138 UAE: BRINE CONCENTRATION MINERALS MARKET, BY APPLICATION,  2024–2029 (KILOTON)
                        10.5.2.3 REST OF GCC COUNTRIES
                                      TABLE 139 REST OF GCC COUNTRIES: BRINE CONCENTRATION MINERALS MARKET, BY APPLICATION, 2020–2023 (USD MILLION)
                                      TABLE 140 REST OF GCC COUNTRIES: BRINE CONCENTRATION MINERALS MARKET, BY APPLICATION, 2024–2029 (USD MILLION)
                                      TABLE 141 REST OF GCC COUNTRIES: BRINE CONCENTRATION MINERALS MARKET, BY APPLICATION, 2020–2023 (KILOTON)
                                      TABLE 142 REST OF GCC COUNTRIES: BRINE CONCENTRATION MINERALS MARKET, BY APPLICATION, 2024–2029 (KILOTON)
             10.5.3 SOUTH AFRICA
                        10.5.3.1 Industrialization and technological advancements to drive market
                                      TABLE 143 SOUTH AFRICA: BRINE CONCENTRATION MINERALS MARKET, BY APPLICATION,  2020–2023 (USD MILLION)
                                      TABLE 144 SOUTH AFRICA: BRINE CONCENTRATION MINERALS MARKET, BY APPLICATION,  2024–2029 (USD MILLION)
                                      TABLE 145 SOUTH AFRICA: BRINE CONCENTRATION MINERALS MARKET, BY APPLICATION,  2020–2023 (KILOTON)
                                      TABLE 146 SOUTH AFRICA: BRINE CONCENTRATION MINERALS MARKET, BY APPLICATION,  2024–2029 (KILOTON)
             10.5.4 REST OF MIDDLE EAST & AFRICA
                        TABLE 147 REST OF MIDDLE EAST & AFRICA: BRINE CONCENTRATION MINERALS MARKET,  BY APPLICATION, 2020–2023 (USD MILLION)
                        TABLE 148 REST OF MIDDLE EAST & AFRICA: BRINE CONCENTRATION MINERALS MARKET,  BY APPLICATION, 2024–2029 (USD MILLION)
                        TABLE 149 REST OF MIDDLE EAST & AFRICA: BRINE CONCENTRATION MINERALS MARKET,  BY APPLICATION, 2020–2023 (KILOTON)
                        TABLE 150 REST OF MIDDLE EAST & AFRICA: BRINE CONCENTRATION MINERALS MARKET,  BY APPLICATION, 2024–2029 (KILOTON)
     10.6 SOUTH AMERICA 
             10.6.1 RECESSION IMPACT
                        TABLE 151 SOUTH AMERICA: BRINE CONCENTRATION MINERALS MARKET, BY COUNTRY,  2020–2023 (USD MILLION)
                        TABLE 152 SOUTH AMERICA: BRINE CONCENTRATION MINERALS MARKET, BY COUNTRY,  2024–2029 (USD MILLION)
                        TABLE 153 SOUTH AMERICA: BRINE CONCENTRATION MINERALS MARKET, BY COUNTRY,  2020–2023 (KILOTON)
                        TABLE 154 SOUTH AMERICA: BRINE CONCENTRATION MINERALS MARKET, BY COUNTRY,  2024–2029 (KILOTON)
                        TABLE 155 SOUTH AMERICA: BRINE CONCENTRATION MINERALS MARKET, BY APPLICATION,  2020–2023 (USD MILLION)
                        TABLE 156 SOUTH AMERICA: BRINE CONCENTRATION MINERALS MARKET, BY APPLICATION,  2024–2029 (USD MILLION)
                        TABLE 157 SOUTH AMERICA: BRINE CONCENTRATION MINERALS MARKET, BY APPLICATION,  2020–2023 (KILOTON)
                        TABLE 158 SOUTH AMERICA: BRINE CONCENTRATION MINERALS MARKET, BY APPLICATION,  2024–2029 (KILOTON)
             10.6.2 ARGENTINA
                        10.6.2.1 Government incentives and foreign investments to drive market
                                      TABLE 159 ARGENTINA: BRINE CONCENTRATION MINERALS MARKET, BY APPLICATION,  2020–2023 (USD MILLION)
                                      TABLE 160 ARGENTINA: BRINE CONCENTRATION MINERALS MARKET, BY APPLICATION,  2024–2029 (USD MILLION)
                                      TABLE 161 ARGENTINA: BRINE CONCENTRATION MINERALS MARKET, BY APPLICATION,  2020–2023 (KILOTON)
                                      TABLE 162 ARGENTINA: BRINE CONCENTRATION MINERALS MARKET, BY APPLICATION, 2024–2029 (KILOTON)
             10.6.3 BRAZIL
                        10.6.3.1 Growth of agricultural sector to drive market
                                      TABLE 163 BRAZIL: BRINE CONCENTRATION MINERALS MARKET, BY APPLICATION,  2020–2023 (USD MILLION)
                                      TABLE 164 BRAZIL: BRINE CONCENTRATION MINERALS MARKET, BY APPLICATION,  2024–2029 (USD MILLION)
                                      TABLE 165 BRAZIL: BRINE CONCENTRATION MINERALS MARKET, BY APPLICATION,  2020–2023 (KILOTON)
                                      TABLE 166 BRAZIL: BRINE CONCENTRATION MINERALS MARKET, BY APPLICATION,  2024–2029 (KILOTON)
             10.6.4 REST OF SOUTH AMERICA
                        TABLE 167 REST OF SOUTH AMERICA: BRINE CONCENTRATION MINERALS MARKET, BY APPLICATION, 2020–2023 (USD MILLION)
                        TABLE 168 REST OF SOUTH AMERICA: BRINE CONCENTRATION MINERALS MARKET, BY APPLICATION, 2024–2029 (USD MILLION)
                        TABLE 169 REST OF SOUTH AMERICA: BRINE CONCENTRATION MINERALS MARKET, BY APPLICATION, 2020–2023 (KILOTON)
                        TABLE 170 REST OF SOUTH AMERICA: BRINE CONCENTRATION MINERALS MARKET, BY APPLICATION, 2024–2029 (KILOTON)
 
11 COMPETITIVE LANDSCAPE (Page No. - 175)
     11.1 INTRODUCTION 
     11.2 KEY PLAYER STRATEGIES/RIGHT TO WIN 
             11.2.1 OVERVIEW OF STRATEGIES ADOPTED BY KEY BRINE CONCENTRATION MINERAL MANUFACTURERS
     11.3 MARKET SHARE ANALYSIS 
             11.3.1 RANKING OF KEY MARKET PLAYERS, 2022
                        FIGURE 35 RANKING OF TOP FIVE PLAYERS IN BRINE CONCENTRATION MINERALS  MARKET, 2022
             11.3.2 MARKET SHARE OF KEY PLAYERS
                        TABLE 171 BRINE CONCENTRATION MINERALS MARKET: DEGREE OF COMPETITION
                        FIGURE 36 BRINE CONCENTRATION MINERALS MARKET: SHARE OF KEY PLAYERS
                        11.3.2.1 Albemarle Corporation
                        11.3.2.2 Ganfeng Lithium Group Co., Ltd.
                        11.3.2.3 ICL Industrial Products
                        11.3.2.4 SQM S.A.
                        11.3.2.5 Arcadium Lithium
     11.4 REVENUE ANALYSIS 
             FIGURE 37 REVENUE OF KEY PLAYERS, 2020–2024
     11.5 COMPANY EVALUATION MATRIX 
             11.5.1 STARS
             11.5.2 EMERGING LEADERS
             11.5.3 PERVASIVE PLAYERS
             11.5.4 PARTICIPANTS
                        FIGURE 38 BRINE CONCENTRATION MINERALS MARKET: COMPANY EVALUATION MATRIX, 2022
             11.5.5 COMPANY FOOTPRINT ANALYSIS
                        TABLE 172 KEY COMPANY TYPE FOOTPRINT (10 COMPANIES)
                        TABLE 173 KEY COMPANY APPLICATION FOOTPRINT (10 COMPANIES)
                        TABLE 174 KEY COMPANY TECHNOLOGIES FOOTPRINT (10 COMPANIES)
                        TABLE 175 KEY COMPANY REGIONAL FOOTPRINT (10 COMPANIES)
     11.6 STARTUP/SME EVALUATION MATRIX 
             11.6.1 PROGRESSIVE COMPANIES
             11.6.2 RESPONSIVE COMPANIES
             11.6.3 DYNAMIC COMPANIES
             11.6.4 STARTING BLOCKS
                        FIGURE 39 BRINE CONCENTRATION MINERALS MARKET: STARTUP/SME EVALUATION MATRIX, 2022
             11.6.5 COMPETITIVE BENCHMARKING
                        TABLE 176 BRINE CONCENTRATION MINERALS MARKET: KEY STARTUPS/SMES
                        FIGURE 40 BRINE CONCENTRATION MINERALS MARKET: BUSINESS STRATEGY FOOTPRINT
                        FIGURE 41 BRINE CONCENTRATION MINERALS MARKET: PRODUCT OFFERING STRATEGY
                        11.6.5.1 Brine concentration minerals market: Competitive benchmarking of key startups/SMEs
                                      TABLE 177 TYPE FOOTPRINT OF SME PLAYERS (15 COMPANIES)
                                      TABLE 178 KEY COMPANY APPLICATION FOOTPRINT OF SME PLAYERS (15 COMPANIES)
                                      TABLE 179 TECHNOLOGIES FOOTPRINT OF SME PLAYERS (15 COMPANIES)
                                      TABLE 180 REGION FOOTPRINT OF SME PLAYERS (15 COMPANIES)
     11.7 COMPETITIVE SCENARIOS AND TRENDS 
             11.7.1 DEALS
                        TABLE 181 BRINE CONCENTRATION MINERALS MARKET: DEALS (2020–2023)
             11.7.2 OTHER DEVELOPMENTS
                        TABLE 182 BRINE CONCENTRATION MINERALS MARKET: OTHER DEVELOPMENTS (2019–2023)
 
12 COMPANY PROFILES (Page No. - 199)
(Business overview, Products/Services/Solutions offered, Recent Developments, MNM view)*
     12.1 KEY PLAYERS 
             12.1.1 MAGRATHEA
                        TABLE 183 MAGRATHEA: COMPANY OVERVIEW
                        TABLE 184 MAGRATHEA: PRODUCT OFFERINGS
             12.1.2 OLOKUN MINERALS
                        TABLE 185 OLOKUN MINERALS: COMPANY OVERVIEW
                        TABLE 186 OLOKUN MINERALS: PRODUCT OFFERINGS
             12.1.3 ALBEMARLE CORPORATION
                        TABLE 187 ALBEMARLE CORPORATION: COMPANY OVERVIEW
                        FIGURE 42 ALBEMARLE CORPORATION: COMPANY SNAPSHOT
                        TABLE 188 ALBEMARLE CORPORATION: PRODUCT OFFERINGS
                        TABLE 189 ALBEMARLE CORPORATION: DEALS
                        TABLE 190 ALBEMARLE CORPORATION: OTHER DEVELOPMENTS
             12.1.4 GANFENG LITHIUM GROUP CO., LTD.
                        TABLE 191 GANFENG LITHIUM GROUP CO., LTD.: COMPANY OVERVIEW
                        FIGURE 43 GANFENG LITHIUM GROUP CO., LTD.: COMPANY SNAPSHOT
                        TABLE 192 GANFENG LITHIUM GROUP CO., LTD.: PRODUCT OFFERINGS
                        TABLE 193 GANFENG LITHIUM GROUP CO., LTD.: DEALS
                        TABLE 194 GANFENG LITHIUM GROUP CO., LTD.: OTHER DEVELOPMENTS
             12.1.5 ARCADIUM LITHIUM
                        TABLE 195 ARCADIUM LITHIUM: COMPANY OVERVIEW
                        FIGURE 44 ARCADIUM LITHIUM: COMPANY SNAPSHOT
                        TABLE 196 ARCADIUM LITHIUM: PRODUCT OFFERINGS
             12.1.6 ICL INDUSTRIAL PRODUCTS
                        TABLE 197 ICL INDUSTRIAL PRODUCTS: COMPANY OVERVIEW
                        FIGURE 45 ICL INDUSTRIAL PRODUCTS: COMPANY SNAPSHOT
                        TABLE 198 ICL INDUSTRIAL PRODUCTS: PRODUCT OFFERINGS
                        TABLE 199 ICL INDUSTRIAL PRODUCTS: DEALS
                        TABLE 200 ICL INDUSTRIAL PRODUCTS: OTHER DEVELOPMENTS
             12.1.7 SQM S.A.
                        TABLE 201 SQM S.A.: COMPANY OVERVIEW
                        FIGURE 46 SQM S.A.: COMPANY SNAPSHOT
                        TABLE 202 SQM S. A.: PRODUCT OFFERINGS
                        TABLE 203 SQM S. A.: DEALS
                        TABLE 204 SQM S.A.: OTHER DEVELOPMENTS
             12.1.8 SOLVAY
                        TABLE 205 SOLVAY: COMPANY OVERVIEW
                        FIGURE 47 SOLVAY: COMPANY SNAPSHOT
                        TABLE 206 SOLVAY: PRODUCT OFFERINGS
             12.1.9 SEALEAU
                        TABLE 207 SEALEAU: COMPANY OVERVIEW
                        TABLE 208 SEALEAU: PRODUCT OFFERINGS
             12.1.10 KONOSHIMA CHEMICALS CO., LTD.
                        TABLE 209 KONOSHIMA CHEMICALS CO., LTD.: COMPANY OVERVIEW
                        FIGURE 48 KONOSHIMA CHEMICALS CO., LTD.: COMPANY SNAPSHOT
                        TABLE 210 KONOSHIMA CHEMICALS CO., LTD.: PRODUCT OFFERINGS
     12.2 OTHER PLAYERS 
             12.2.1 KMX TECHNOLOGIES
                        TABLE 211 KMX TECHNOLOGIES: COMPANY OVERVIEW
             12.2.2 SALTWORKS TECHNOLOGIES INC.
                        TABLE 212 SALTWORKS TECHNOLOGIES INC.: COMPANY OVERVIEW
             12.2.3 CONDUCTIVE ENERGY INC.
                        TABLE 213 CONDUCTIVE ENERGY INC.: COMPANY OVERVIEW
             12.2.4 MINERVA LITHIUM
                        TABLE 214 MINERVA LITHIUM: COMPANY OVERVIEW
             12.2.5 ADIONICS
                        TABLE 215 ADIONICS: COMPANY OVERVIEW
             12.2.6 LILAC SOLUTIONS
                        TABLE 216 LILAC SOLUTIONS: COMPANY OVERVIEW
             12.2.7 AQUAFORTUS
                        TABLE 217 AQUAFORTUS: COMPANY OVERVIEW
             12.2.8 STANDARD LITHIUM LTD.
                        TABLE 218 STANDARD LITHIUM LTD.: COMPANY OVERVIEW
             12.2.9 ROCK TECH LITHIUM INC.
                        TABLE 219 ROCK TECH LITHIUM INC.: COMPANY OVERVIEW
             12.2.10 ENERGY EXPLORATION TECHNOLOGIES
                        TABLE 220 ENERGY EXPLORATION TECHNOLOGIES: COMPANY OVERVIEW
             12.2.11 ESPIKU LLC
                        TABLE 221 ESPIKU LLC: COMPANY OVERVIEW
             12.2.12 KAZAN SODA ELEKTRIK
                        TABLE 222 KAZAN SODA ELEKTRIK: COMPANY OVERVIEW
 
*Details on Business overview, Products/Services/Solutions offered, Recent Developments, MNM view might not be captured in case of unlisted companies.
 
13 APPENDIX (Page No. - 245)
     13.1 DISCUSSION GUIDE 
     13.2 KNOWLEDGESTORE: MARKETSANDMARKETS’  SUBSCRIPTION PORTAL 
     13.3 CUSTOMIZATION OPTIONS 
     13.4 RELATED REPORTS 
     13.5 AUTHOR DETAILS 

The study involved four major activities in estimating the market size of the Brine concentration minerals market. Exhaustive secondary research was done to collect information on the market, the peer market, and the parent market. The next step was to validate these findings, assumptions, and sizing with industry experts across the value chain through primary research. Both top-down and bottom-up approaches were employed to estimate the complete market size. Thereafter, the market breakdown and data triangulation procedures were used to estimate the market size of the segments and subsegments.

Secondary Research

In the secondary research process, various secondary sources have been referred to for identifying and collecting information for this study. These secondary sources include annual reports, press releases, investor presentations of companies, white papers, certified publications, trade directories, articles from recognized authors, the gold standard and silver standard websites, and databases.

Secondary research has been used to obtain key information about the value chain of the industry, the monetary chain of the market, the total pool of key players, market classification, and segmentation according to industry trends to the bottom-most level and regional markets. It was also used to obtain information about the key developments from a market-oriented perspective.

Primary Research

The brine concentration minerals market comprises several stakeholders in the value chain, which include raw material suppliers, mineralmanufacturers, distribution and logistics, and end users. Various primary sources from the supply and demand sides of the brine concentration minerals market have been interviewed to obtain qualitative and quantitative information. The primary interviewees from the demand side include key opinion leaders in end-use sectors. The primary sources from the supply side include manufacturers, associations, and institutions involved in the brine concentration minerals industry.

Primary interviews were conducted to gather insights such as market statistics, data on revenue collected from the products and services, market breakdowns, market size estimations, market forecasting, and data triangulation. Primary research also helped in understanding the various trends related to technology, type, application and region. Stakeholders from the demand side, such as CIOs, CTOs, and CSOs, were interviewed to understand the buyer’s perspective on the suppliers, products, fabricators, and their current usage of brine concentration minerals and the outlook of their business, which will affect the overall market.

The breakdown of profiles of the primary interviewees is illustrated in the figure below:

Brine Concentration Minerals Market Size, and Share

Note: Tier 1, Tier 2, and Tier 3 companies are classified based on their market revenue in 2022, available in the public domain, product portfolios, and geographical presence.

Other designations include consultants and sales, marketing, and procurement managers.

To know about the assumptions considered for the study, download the pdf brochure

Company name

Designation

Albemarle Corporation (US)

Individual Industry Expert

Arcadium Lithium (US)

Sales Manager

 Solvay (Belgium)

Manager

Konoshima Chemical Co., Ltd. (Japan)

Marketing Manager

ICL Industrial Products (Israel)

Senior Scientist

Market Size Estimation

The top-down and bottom-up approaches have been used to estimate and validate the size of the Brine concentration minerals market.

  • The key players in the industry have been identified through extensive secondary research.
  • The industry's supply chain has been determined through primary and secondary research.
  • All percentage shares, splits, and breakdowns have been determined using secondary sources and verified through primary sources.
  • All possible parameters that affect the markets covered in this research study have been accounted for, viewed in extensive detail, verified through primary research, and analyzed to obtain the final quantitative and qualitative data.
  • The research includes the study of reports, reviews, and newsletters of the key market players, along with extensive interviews for opinions with leaders such as directors and marketing executives.

Brine Concentration Minerals Market: Bottum-Up Approach

Brine Concentration Minerals Market Size, and Share

Note: All the shares are based on the global market size.

Source: Secondary Research, Interviews with Experts, and MarketsandMarkets Analysis

To know about the assumptions considered for the study, Request for Free Sample Report

Brine Concentration Minerals Market: Top-Down Approach

Brine Concentration Minerals Market Size, and Share

Data Triangulation

After arriving at the total market size from the estimation process explained above, the overall market has been split into several segments and sub-segments. To complete the overall market engineering process and arrive at the exact statistics for all the segments and sub-segments, the data triangulation and market breakdown procedures have been employed, wherever applicable. The data has been triangulated by studying various factors and trends from both the demand and supply sides. Along with this, the market size has been validated by using both the top-down and bottom-up approaches and primary interviews. Hence, for every data segment, there have been three sources—top-down approach, bottom-up approach, and expert interviews. The data was assumed correct when the values arrived from the three sources matched.

Market Definition

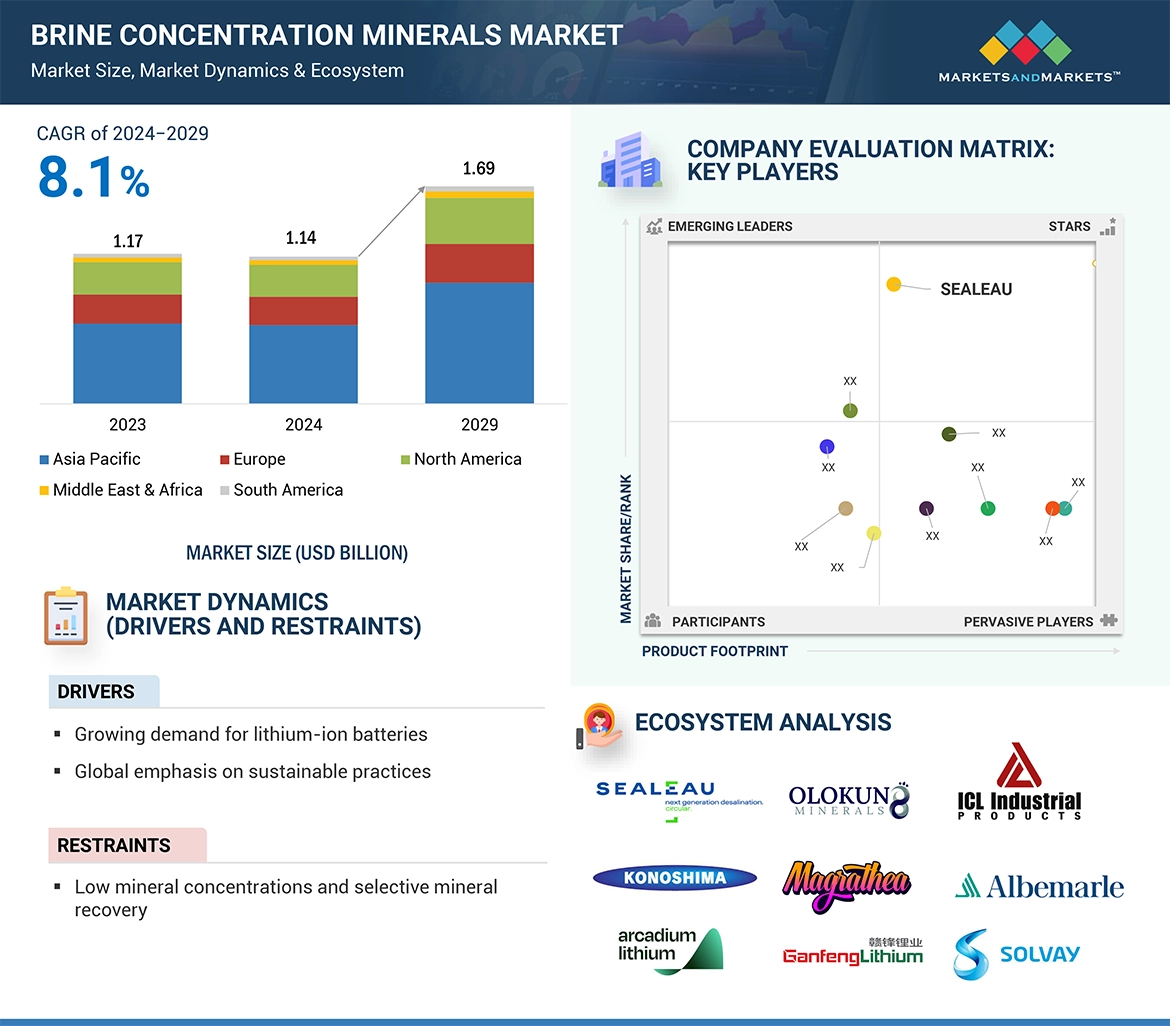
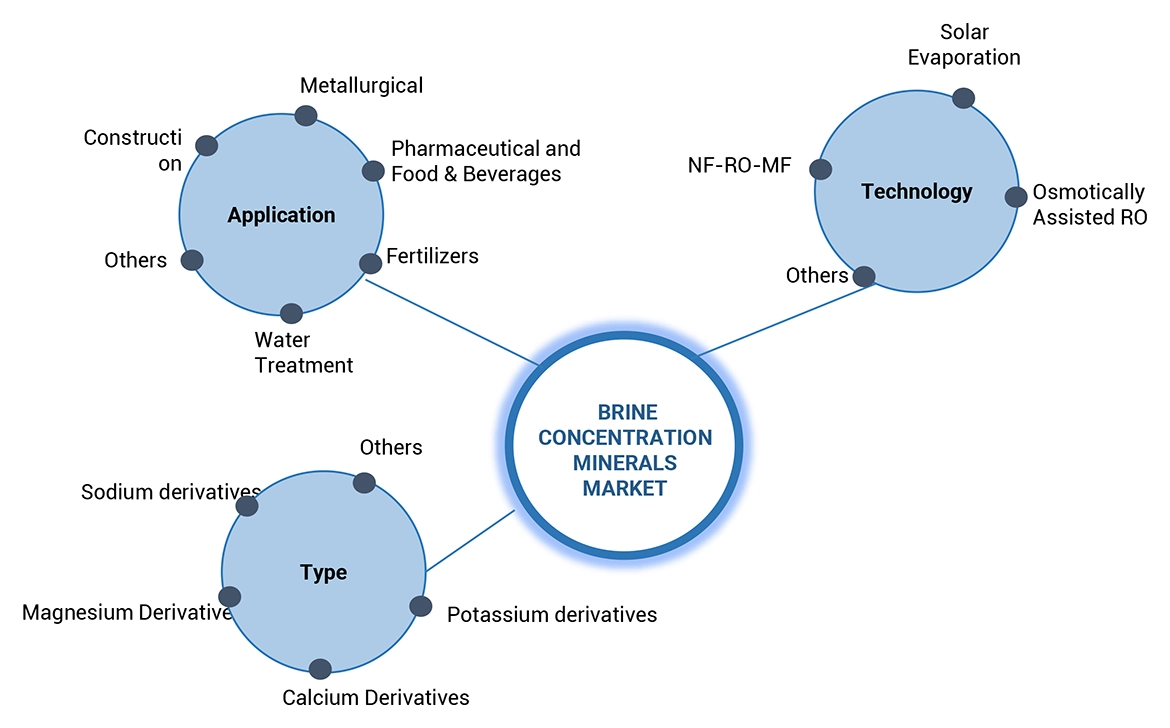
The Brine Concentration Minerals Market includes the extraction of important minerals including lithium, magnesium, calcium, potassium, and others from brine sources such as inland brine and saltwater desalination. This process employs a variety of modern technologies, such as NF-RO-MF (nanofiltration-reverse osmosis-microfiltration), OARO (osmotic aided reverse osmosis), MD (membrane distillation), NF (nanofiltration) systems, solar evaporation, electrodialysis, and reverse osmosis. These technologies enable the extraction and concentration of precious minerals from brine, resulting in more effective resource utilization. The market has a wide range of supplies, including inland brine reservoirs and seawater desalination plants. The extracted minerals, particularly lithium, magnesium, calcium, and potassium, have applications in a variety of industries, including energy storage, agriculture, and manufacturing. The Brine Concentration Minerals Market examines the increased demand for these critical minerals, driven by technological developments, and the need for sustainable resource management in an evolving global landscape.

Key Stakeholders

  • Brine concentration minerals manufacturers
  • Brine concentration minerals traders, distributors, and suppliers
  • End-use industry participants of application segment of the brine concentration minerals market
  • Government and research organizations
  • Associations and industrial bodies
  • Research and consulting firms.
  • Research & development (R&D) institutions.
  • Environmental support agencies.

Report Objectives

  • To define, describe, and forecast the size of the brine concentration minerals market, in terms of value and volume.
  • To provide detailed information regarding the major factors (drivers, opportunities, restraints, and challenges) influencing the growth of the market
  • To estimate and forecast the market size based on technology, type, application and region.
  • To forecast the size of the market with respect to major regions, namely, Europe, North America, Asia Pacific, Middle East & Africa, and South America, along with their key countries.
  • To strategically analyze micromarkets1 with respect to individual growth trends, prospects, and their contribution to the overall market.
  • To analyze opportunities in the market for stakeholders and provide a competitive landscape of market leaders.
  • To track and analyze recent developments such as expansions, new product launches, partnerships & agreements, and acquisitions in the market.
  • To strategically profile key market players and comprehensively analyze their core competencies.

Available Customizations

Along with the given market data, MarketsandMarkets offers customizations according to the company’s specific needs. The following customization options are available for the report:

Regional Analysis

  • Further breakdown of a region with respect to a particular country or additional application

Company Information

  • Detailed analysis and profiles of additional market players
Custom Market Research Services

We will customize the research for you, in case the report listed above does not meet with your exact requirements. Our custom research will comprehensively cover the business information you require to help you arrive at strategic and profitable business decisions.

Request Customization
Report Code
MM 8942
Published ON
Feb, 2024
Choose License Type
BUY NOW
  • SHARE
X
Request Customization
Speak to Analyst
Speak to Analyst
OR FACE-TO-FACE MEETING
PERSONALIZE THIS RESEARCH
  • Triangulate with your Own Data
  • Get Data as per your Format and Definition
  • Gain a Deeper Dive on a Specific Application, Geography, Customer or Competitor
  • Any level of Personalization
REQUEST A FREE CUSTOMIZATION
LET US HELP YOU!
  • What are the Known and Unknown Adjacencies Impacting the Brine Concentration Minerals Market
  • What will your New Revenue Sources be?
  • Who will be your Top Customer; what will make them switch?
  • Defend your Market Share or Win Competitors
  • Get a Scorecard for Target Partners
CUSTOMIZED WORKSHOP REQUEST
+1-888-600-6441
  • Call Us
  • +1-888-600-6441 (Corporate office hours)
  • +1-888-600-6441 (US/Can toll free)
  • +44-800-368-9399 (UK office hours)
CONNECT WITH US
ABOUT TRUST ONLINE
©2024 MarketsandMarkets Research Private Ltd. All rights reserved
DMCA.com Protection Status Website Feedback