BPaaS Market

BPaaS Market by Business Process (Human Resource Management, Customer Service & Support, Accounting & Finance), Deployment Model, Organization Size, Vertical (BFSI, Retail & eCommerce, Manufacturing, IT & Telecom) and Region - Global Forecast to 2028

Report Code: TC 1440 Feb, 2024, by marketsandmarkets.com

[245 Pages Report] The BPaaS market is expected to grow from USD 63.3 billion in 2023 to USD 92.9 billion by 2028 at a Compound Annual Growth Rate (CAGR) of 8.0% during the forecast period. BPaaS is a rapidly growing segment in the cloud services market, offering businesses a convenient and cost-effective way to outsource various operational processes. As organizations seek to streamline operations and focus on core competencies, BPaaS providers have emerged as critical partners in delivering scalable and efficient solutions. The BPaaS market encompasses various services, including human resources, finance and accounting, customer service, procurement, and supply chain management. These services are typically delivered through a cloud-based platform, allowing businesses to access them from anywhere with an internet connection. Several factors, including the increasing adoption of cloud computing, the need for greater operational efficiency, and the growing complexity of business processes, drive the BPaaS market.

Additionally, the rise of digital transformation initiatives and the proliferation of data-driven decision-making have fueled the demand for BPaaS solutions. The BPaaS market is poised for continued growth as businesses seek to optimize their operations and adapt to evolving market conditions. With its flexibility, scalability, and ability to drive operational excellence, BPaaS is becoming an indispensable tool for organizations looking to stay ahead in an increasingly digital world.

BPaaS Market

To know about the assumptions considered for the study, Request for Free Sample Report

BPaaS Market Opportunities

To know about the assumptions considered for the study, download the pdf brochure

Recession Impact on the BPaaS Market

As per the Global Economic Prospects report of the World Bank, published in June 2022, the compounding effect of the COVID-19 pandemic and the Russian invasion of Ukraine has resulted in a magnified global economic slowdown. Currently, organizations are focusing on the economic downturn and the looming possibility of a recession. As organizations battle rising prices, volatile supply chains, climate issues, talent scarcity, and the ongoing repercussions of the disruption caused by the pandemic, more than half of the executives describe a bleak economic outlook for the next 12–18 months. A wide range of energy-related commodities has witnessed a price surge due to the Ukraine war. Higher energy prices result in lower real incomes, raise production costs, tighten financial conditions, and constrain macroeconomic policies, especially in energy-importing countries. Businesses continued to invest in tangible assets, mitigating the overall impact on the market. In some countries, government spending on BPaaS increased to support businesses and stimulate the economy. For instance, the demand for non-essential services like accounting, payroll, or HR management has been reduced as companies focus on core operations. Tightened and substantial budgets lead to renegotiations or cancellations of existing contracts. Increased competition among providers drives down prices and margins.

BPaaS Market Dynamics

Driver:  Automation and AI reshape BPaaS, enhancing operational efficiency

The BPaaS market is undergoing a profound transformation propelled by integrating automation and AI technologies. Robotic Process Automation (RPA) liberates human resources by automating repetitive tasks, fostering efficiency, and minimizing errors. Artificial Intelligence (AI) algorithms delve into data, discern patterns, and drive informed decisions, facilitating process optimization and predictive analytics. Machine Learning (ML) further enhances BPaaS capabilities by dynamically adapting to real-time data, refining resource allocation, and tailoring experiences to individual business needs. Cognitive automation, a synthesis of RPA, AI, and ML, extends BPaaS into uncharted territories, enabling the automation of intricate tasks and unlocking invaluable insights previously beyond reach. This revolution underscores the evolving landscape of BPaaS, heralding unprecedented efficiency and innovation.

Restraint: Concerns over data security compliance

Security and compliance concerns loom large in the BPaaS market, posing significant challenges for providers and customers. The fear of data breaches and privacy violations, fueled by incidents in other cloud-based services, instills hesitancy among businesses to entrust critical data to third-party vendors. Moreover, navigating the intricate web of industry-specific and regional compliance regulations adds complexity and risk, deterring adoption. The lack of transparency surrounding data security practices and internal controls further exacerbates concerns, eroding trust and impeding market growth. As the industry grapples with these issues, establishing robust security measures and fostering transparent communication will be pivotal in addressing the overarching apprehensions and promoting a more secure and compliant BPaaS ecosystem.

Opportunity: Expanding market access and inclusivity in BPaaS solutions

The democratization of access in the BPaaS market heralds a new era of inclusivity and opportunity for diverse players. Smaller businesses now have access to cost-effective subscription models, user-friendly interfaces, and cloud-based delivery, expanding the market segment and democratizing process optimization. Freelancers and solopreneurs benefit from BPaaS solutions tailored to individual needs, enabling them to manage complex tasks like invoicing and customer onboarding efficiently. Additionally, micro-subscriptions cater to their specific requirements, empowering the gig economy and enhancing personal productivity. Non-profit organizations also stand to gain, as BPaaS streamlines critical operations such as donor management and volunteer coordination, allowing them to maximize impact and optimize resources effectively.

Challenge: Challenges integrating BPaaS with existing systems

Integration complexities profoundly restrain the BPaaS market. The challenge arises from incompatible systems, including outdated technologies and proprietary formats, which complicate integrating existing on-premise systems and cloud services. This disparity necessitates costly customization efforts and impedes smooth data flow. Moreover, implementing BPaaS requires specialized technical expertise, draining internal resources and posing financial burdens, particularly for smaller businesses. Additionally, hidden costs emerge from the intricacies of integration, such as data migration and ongoing maintenance, undermining the perceived cost-effectiveness of BPaaS and dissuading potential investment. These complexities underscore the formidable barriers hindering widespread adoption and smooth integration of BPaaS solutions within businesses.

BPaaS Market Ecosystem

Top Companies in BPaaS Market

Based on Business Process, the Accounting & Finance segment will grow significantly during the forecast period.

BPaaS plays a significant role in accounting and finance. It enables organizations to significantly reduce costs by outsourcing tasks like payroll processing, accounts payable, and financial reporting. Scalability is another critical driver, allowing businesses to adjust resources easily according to fluctuating demands. By leveraging BPaaS, companies gain access to specialized expertise without extensive training, thus fostering innovation and competitiveness. Moreover, by implementing robust systems and processes, BPaaS facilitates risk management and compliance. Technological innovation, particularly in cloud computing and AI, further enhances efficiency and accuracy in financial operations. Additionally, BPaaS accommodates the growing trends of globalization and remote work, enabling organizations to tap into global talent pools and adapt to evolving work environments. BPaaS transforms accounting and finance functions, offering a cost-effective, flexible, and technologically advanced solution to organizations worldwide.

Based on Vertical, the government & public sector segments will grow significantly during the forecast period.

BPaaS is pivotal in modernizing operations, improving service delivery, and enhancing citizen engagement in the government and public sector. Government agencies can reduce costs, increase efficiency, and focus on strategic priorities by outsourcing non-core functions such as procurement, human resources, and financial management to BPaaS providers. BPaaS solutions enable governments to streamline bureaucratic processes, enhance transparency, and meet the evolving needs of citizens in the digital age. Furthermore, BPaaS helps governments leverage emerging technologies such as blockchain and IoT to address societal challenges, enhance cybersecurity, and deliver innovative public services. BPaaS empowers the government and public sector to become more agile, responsive, and citizen-centric in operations and service delivery.

By region, North American BPaaS market will grow at the highest market size during the forecast period.

The BPaaS market in the United States is experiencing significant growth, fueled by several factors. Companies are increasingly opting for cloud-based solutions, making BPaaS more accessible and scalable. BPaaS solutions are incorporating automation and AI to streamline processes, improve accuracy, and free up human resources for more strategic tasks. The US market is dominated by large players like SAP SE, Oracle Corporation, IBM, and Accenture, but smaller niche providers are also gaining traction. Specific BPaaS solutions like HR BPaaS and Finance & AccountingBPaaS are experiencing particularly strong growth. Security and data privacy concerns remain key challenges for the BPaaS market, but vendors are increasingly focusing on compliance and robust security measures. Companies like CGI, EXL, and TELUS International cater to specific industry needs within Canada. Canadian government agencies are increasingly exploring BPaaS solutions for efficiency and cost savings. Toronto, Montreal, and Calgary emerge as key BPaaS hubs, but regional growth is also occurring. Overall, the North America BPaaS market exhibits steady growth potential with unique dynamics shaped by regional regulations, industry focus, and government involvement. Addressing challenges like talent acquisition and data security will be key to unlocking further market expansion. These factors drive the growth of BPaaS market in North America.

North American BPaaS Market Size, and Share

Key Market Players

The BPaaS market is dominated by a few globally established players such as Accenture (Ireland), Capgemini (France), Cognizant (US), IBM (US), TCS (India), HCL (India), Fujitsu (Japan), Genpact (US), Wipro (India), Tech Mahindra (India), EXL (US), DXC Technology (US), Conduent (US), Infosys BPM (India), Bizagi (US), among others, are the key vendors that secured BPaaS contracts in last few years. These vendors can bring global processes and execution expertise; the local players only have limited expertise. In the thriving BPaaS market, the Cloud Adoption Boom is pivotal in reshaping business processes. Companies leveraging cloud-based solutions, BPaaS capitalizes on several advantages.

Scope of Report

Report Metrics

Details

Market Size Available For Years

2018–2028

Base Year Considered

2022

Forecast Period

2023–2028

Forecast Units

Value (USD Million/Billion)

Segments Covered

Business Process, Deployment Model, Organization Size, and Vertical

Regions Covered

North America, Europe, Asia Pacific, Middle East & Africa, and Latin America

Companies Covered

 Accenture(Ireland),Capgemini(France),Cognizant(US),IBM(US), HCL(India), TCS(India), Fujitsu (Japan),Genpact(US),Wipro(India),Tech Mahindra(India), EXL(US), DXC Technology(US), Conduent(US),Infosys BPM(India),Bizagi(US)

This research report categorizes the BPaaS market to forecast revenue and analyze trends in each of the following submarkets:

By Business Process:
  • Human Resource Management
    • Payroll Processing
    • Employee Onboarding
    • Benefits Administration
    • Others 
  • Accounting & Finance
    • Accounts Payable
    • General Ledger
    • Financial Reporting
    • Others
  • Sales & Marketing
    • Lead Generation Services
    • Customer Relationship Management (CRM) Services
    • Others
  • Customer Service & Support
    • Call Center Operations
    • Help Desk Support
    • Ticket Management
    • Others
  • Procurement, Supply Chain Management & Operations
    • Vendor Management
    • Purchase Order Processing
    • Inventory Optimization
    • Distribution And Logistics
    • Others
  • Other Business Processes
By Deployment Model:
  • Public Cloud
  • Private Cloud
  • Hybrid Cloud
By Organization Size:
  • Large Enterprises
  • Small And Medium-Sized Enterprises
By Vertical:
  • BFSI
  • IT & Telecom
  • Manufacturing
  • Retail & E-commerce
  • Healthcare & Life Sciences
  • Government & Public Sector
  • Other Verticals
By Region:
  • North America
    • United States
    • Canada
  • Europe
    • United Kingdom
    • Germany
    • France
    • Italy
    • Rest of Europe
  • Asia Pacific
    • China
    • Japan
    • Australia and New Zealand
    • Rest of Asia Pacific
  • Middle East & Africa
    • GCC
      • Saudi Arabia
      • UAE
      • The rest of the GCC Countries
    • South Africa
    • Rest of the Middle East & Africa
  • Latin America
    • Brazil
    • Mexico
    • Rest of Latin America     

Recent Developments:

  • Accenture launched the Accenture Gen AI Services suite of specialized services to assist companies in customizing and maximizing the value of generative AI. These services include a proprietary "switchboard" feature, allowing users to select the most suitable AI models based on cost, accuracy, or business context. Additionally, Accenture offers customization techniques for large-language models (LLMs), along with managed services for ongoing refinement and training.
  • Capgemini and Microsoft collaborated to introduce the Azure Intelligent App Factory to accelerate generative AI implementations for businesses across various industries. This collaboration uses industry-specific digital platforms and Microsoft Cloud technologies to scale AI capabilities responsibly and sustainably. The solution, comprising Digital Industry Platforms, Industry Assistants, and Intelligent App Delivery Teams, aims to streamline AI investments, drive tangible business outcomes, and ensure compliance with security and industry standards.
  • Accenture acquired the SKS Group, a consulting firm renowned for its expertise in assisting banks across Germany, Austria, and Switzerland. It helps to modernize their technology infrastructure and meet regulatory requirements through SAP S/4HANA solutions. This strategic move bolsters Accenture's SAP and regulatory capabilities for banking clients in the region, enhancing its technology, consulting, and regulatory services portfolio. The acquisition also strengthens Accenture's ability to cater to specialized banks, including national promotional banks supporting local businesses and communities with financial and development assistance.

Frequently Asked Questions (FAQ):

To speak to our analyst for a discussion on the above findings, click Speak to Analyst

TABLE OF CONTENTS
 
1 INTRODUCTION (Page No. - 25)
    1.1 STUDY OBJECTIVES 
    1.2 MARKET DEFINITION 
           1.2.1 INCLUSIONS AND EXCLUSIONS
    1.3 MARKET SCOPE 
           1.3.1 MARKET SEGMENTATION
                    FIGURE 1 BPAAS MARKET SEGMENTATION
           1.3.2 REGIONS COVERED
                    FIGURE 2 MARKET SEGMENTATION, BY REGION
           1.3.3 YEARS CONSIDERED
    1.4 CURRENCY CONSIDERED 
           TABLE 1 USD EXCHANGE RATES, 2018–2022
    1.5 STAKEHOLDERS 
    1.6 SUMMARY OF CHANGES 
           1.6.1 RECESSION IMPACT
 
2 RESEARCH METHODOLOGY (Page No. - 32)
    2.1 RESEARCH APPROACH 
           FIGURE 3 MARKET: RESEARCH DESIGN
           2.1.1 SECONDARY DATA
           2.1.2 PRIMARY DATA
                    2.1.2.1 Breakup of primary profiles
                               FIGURE 4 BREAKUP OF PRIMARY PROFILES, BY COMPANY TYPE, DESIGNATION,  AND REGION
                    2.1.2.2 Key industry insights
                               FIGURE 5 BPAAS MARKET: KEY INDUSTRY INSIGHTS
    2.2 MARKET SIZE ESTIMATION 
           FIGURE 6 MARKET: TOP-DOWN AND BOTTOM-UP APPROACHES
           2.2.1 TOP-DOWN APPROACH
                    FIGURE 7 MARKET SIZE ESTIMATION METHODOLOGY: TOP-DOWN APPROACH
           2.2.2 BOTTOM-UP APPROACH
                    FIGURE 8 MARKET SIZE ESTIMATION METHODOLOGY: BOTTOM-UP APPROACH
                    FIGURE 9 MARKET: RESEARCH FLOW
                    FIGURE 10 MARKET SIZE ESTIMATION METHODOLOGY: SUPPLY-SIDE ANALYSIS
                    FIGURE 11 BOTTOM-UP APPROACH FROM SUPPLY SIDE: COLLECTIVE REVENUE OF VENDORS
                    FIGURE 12 CAGR PROJECTIONS FROM SUPPLY SIDE
                    FIGURE 13 DEMAND-SIDE APPROACH
    2.3 MARKET FORECAST 
           TABLE 2 FACTOR ANALYSIS
    2.4 DATA TRIANGULATION 
           FIGURE 14 MARKET: DATA TRIANGULATION
    2.5 IMPACT OF RECESSION ON GLOBAL MARKET 
    2.6 RESEARCH ASSUMPTIONS 
    2.7 STUDY LIMITATIONS 
 
3 EXECUTIVE SUMMARY (Page No. - 46)
    TABLE 3 BPAAS MARKET SIZE AND GROWTH, 2018–2022 (USD MILLION AND Y-O-Y) 
    TABLE 4 MARKET SIZE AND GROWTH, 2023–2028 (USD MILLION AND Y-O-Y) 
    FIGURE 15 GLOBAL BPAAS TO WITNESS SIGNIFICANT GROWTH 
    FIGURE 16 FASTEST-GROWING SEGMENTS IN MARKET, 2023–2028 
    FIGURE 17 MARKET: REGIONAL SNAPSHOT, 2023–2028 
 
4 PREMIUM INSIGHTS (Page No. - 50)
    4.1 OVERVIEW OF BPAAS MARKET 
           FIGURE 18 STREAMLINING AND OPTIMIZING BUSINESS PROCESSES THROUGH BPAAS  TO RESULT IN IMPROVED CUSTOMER EXPERIENCES
    4.2 MARKET, BY BUSINESS PROCESS 
           FIGURE 19 HUMAN RESOURCE MANAGEMENT TO ACCOUNT FOR LARGEST MARKET SHARE AMONG BUSINESS PROCESS DURING FORECAST PERIOD
    4.3 MARKET, BY DEPLOYMENT MODEL 
           FIGURE 20 PUBLIC CLOUD TO ACCOUNT FOR LARGEST MARKET SHARE AMONG DEPLOYMENT MODELS DURING FORECAST PERIOD
    4.4 MARKET, BY ORGANIZATION SIZE 
           FIGURE 21 LARGE ENTERPRISES TO ACCOUNT FOR LARGER ADOPTION OF MARKET DURING FORECAST PERIOD
    4.5 MARKET, BY VERTICAL 
           FIGURE 22 BFSI VERTICAL TO ACCOUNT FOR LARGEST MARKET SHARE IN 2023
    4.6 BPAAS MARKET: REGIONAL SCENARIO 
           FIGURE 23 ASIA PACIFIC TO EMERGE AS BEST MARKET FOR INVESTMENT  IN NEXT FIVE YEARS
 
5 MARKET OVERVIEW AND INDUSTRY TRENDS (Page No. - 53)
    5.1 INTRODUCTION 
    5.2 MARKET DYNAMICS 
           FIGURE 24 DRIVERS, RESTRAINTS, OPPORTUNITIES, AND CHALLENGES: BPAAS MARKET
           5.2.1 DRIVERS
                    5.2.1.1 Cloud adoption emphasized scalability and flexibility
                    5.2.1.2 Cost optimization to drive need for efficient alternatives
                    5.2.1.3 Automation and AI enhance operational efficiency of BPaaS
                    5.2.1.4 Surge in industry-specific BPaaS solutions, fostering innovation and customization
                    5.2.1.5 Growth of BPaaS adoption among SMEs, enhancing accessibility and competitiveness
           5.2.2 RESTRAINTS
                    5.2.2.1 Rise in security and compliance concerns
                    5.2.2.2 Dependency concerns on specific BPaaS providers
           5.2.3 OPPORTUNITIES
                    5.2.3.1 Focus on multi-process business workflow
                    5.2.3.2 Expanding market access and inclusivity in BPaaS solutions
           5.2.4 CHALLENGES
                    5.2.4.1 Challenges integrating BPaaS with existing systems
                    5.2.4.2 Navigating evolving regulations hampers growth and innovation
    5.3 CASE STUDY ANALYSIS 
           5.3.1 ACCENTURE’S SYNOPS FUELED OPERATIONAL EXCELLENCE FOR LEADING OIL & GAS COMPANY
           5.3.2 COGNIZANT BPAAS DROVE HEALTH PLAN TO EFFICIENCY AND REVENUE LEADERSHIP
           5.3.3 INFOSYS BPM SCALED TECH LEADER’S NLP WITH IMPROVED EFFICIENCY AND SIGNIFICANT CONFLICT REDUCTION
           5.3.4 GENPACT’S OPERATIONAL RESILIENCE FRAMEWORK ENABLED LEADING FINANCIAL ORGANIZATION TO ANTICIPATE AND ADAPT
           5.3.5 TCS SUPPORTED OPERATIONAL EXCELLENCE THROUGH COST REDUCTION AND RISK MITIGATION FOR LARGE GLOBAL  INVESTMENT BANK
    5.4 VALUE CHAIN ANALYSIS 
           FIGURE 25 BPAAS MARKET: VALUE CHAIN ANALYSIS
    5.5 ECOSYSTEM 
           FIGURE 26 MARKET: ECOSYSTEM
    5.6 TECHNOLOGICAL ANALYSIS 
           5.6.1 KEY TECHNOLOGIES
                    5.6.1.1 Cloud computing
                    5.6.1.2 Data analytics
           5.6.2 COMPLEMENTARY TECHNOLOGIES
                    5.6.2.1 Internet of things (IoT)
                    5.6.2.2 AR/VR
                    5.6.2.3 5G
           5.6.3 ADJACENT TECHNOLOGIES
                    5.6.3.1 Blockchain
                    5.6.3.2 AI/ML
    5.7 PRICING ANALYSIS 
           5.7.1 AVERAGE SELLING PRICE (ASP) TREND OF KEY PLAYERS, BY SERVICE
                    FIGURE 27 BPAAS ASP OF KEY PLAYERS, BY SERVICE (USD/MONTH)
                    TABLE 5 INDICATIVE PRICING ANALYSIS OF BPAAS VENDORS, BY OFFERING
    5.8 PATENT ANALYSIS 
           FIGURE 28 NUMBER OF PATENTS PUBLISHED, 2013–2023
           FIGURE 29 TOP FIVE GLOBAL PATENT OWNERS
           TABLE 6 US: TOP 10 PATENT APPLICANTS
    5.9 PORTER’S FIVE FORCES ANALYSIS 
           FIGURE 30 BPAAS MARKET: PORTER’S FIVE FORCES ANALYSIS
           TABLE 7 PORTER’S FIVE FORCES IMPACT ON MARKET
           5.9.1 THREAT OF NEW ENTRANTS
           5.9.2 THREAT OF SUBSTITUTES
           5.9.3 BARGAINING POWER OF SUPPLIERS
           5.9.4 BARGAINING POWER OF BUYERS
           5.9.5 INTENSITY OF COMPETITIVE RIVALRY
    5.10 REGULATORY LANDSCAPE 
           5.10.1 REGULATORY BODIES, GOVERNMENT AGENCIES, AND OTHER ORGANIZATIONS
                    TABLE 8 NORTH AMERICA: LIST OF REGULATORY BODIES, GOVERNMENT AGENCIES, AND OTHER ORGANIZATIONS
                    TABLE 9 EUROPE: LIST OF REGULATORY BODIES, GOVERNMENT AGENCIES, AND OTHER ORGANIZATIONS
                    TABLE 10 ASIA PACIFIC: LIST OF REGULATORY BODIES, GOVERNMENT AGENCIES, AND OTHER ORGANIZATIONS
                    TABLE 11 ROW: LIST OF REGULATORY BODIES, GOVERNMENT AGENCIES, AND OTHER ORGANIZATIONS
           5.10.2 REGULATIONS
    5.11 TRENDS/DISRUPTIONS IMPACTING CUSTOMER’S BUSINESS 
                    FIGURE 31 REVENUE SHIFT FOR BPAAS MARKET
    5.12 KEY STAKEHOLDERS AND BUYING CRITERIA 
           5.12.1 KEY STAKEHOLDERS IN BUYING PROCESS
                    FIGURE 32 INFLUENCE OF STAKEHOLDERS ON BUYING PROCESS FOR END USERS
                    TABLE 12 INFLUENCE OF STAKEHOLDERS ON BUYING PROCESS FOR END USERS
           5.12.2 BUYING CRITERIA
                    FIGURE 33 KEY BUYING CRITERIA FOR END USERS
                    TABLE 13 KEY BUYING CRITERIA FOR END USERS
    5.13 BUSINESS MODEL ANALYSIS 
                    FIGURE 34 MARKET: BUSINESS MODEL
    5.14 INVESTMENT AND FUNDING SCENARIO 
                    FIGURE 35 INVESTMENT AND FUNDING SCENARIO OF MAJOR BPAAS COMPANIES
    5.15 KEY CONFERENCES AND EVENTS 
                    TABLE 14 MARKET: DETAILED LIST OF CONFERENCES AND EVENTS, 2024
 
6 BPAAS MARKET, BY BUSINESS PROCESS (Page No. - 79)
    6.1 INTRODUCTION 
           FIGURE 36 HUMAN RESOURCE MANAGEMENT TO ACCOUNT FOR LARGER MARKET SIZE DURING FORECAST PERIOD
           6.1.1 BUSINESS PROCESS: MARKET DRIVERS
                    TABLE 15 MARKET, BY BUSINESS PROCESS, 2018–2022 (USD MILLION)
                    TABLE 16 MARKET, BY BUSINESS PROCESS, 2023–2028 (USD MILLION)
    6.2 HUMAN RESOURCE MANAGEMENT 
           6.2.1 OPTIMIZING RESOURCE UTILIZATION, IMPROVING OPERATIONAL EFFICIENCY, AND FOCUSING ON STRATEGIC INITIATIVES
           6.2.2 PAYROLL PROCESSING
           6.2.3 EMPLOYEE ONBOARDING
           6.2.4 BENEFITS ADMINISTRATION
           6.2.5 OTHER HUMAN RESOURCE MANAGEMENT PROCESSES
                    TABLE 17 MARKET IN HUMAN RESOURCE MANAGEMENT, BY REGION,  2018–2022 (USD MILLION)
                    TABLE 18 MARKET IN HUMAN RESOURCE MANAGEMENT, BY REGION, 2023–2028 (USD MILLION)
    6.3 ACCOUNTING & FINANCE 
           6.3.1 NEED TO MITIGATE RISKS ASSOCIATED WITH FINANCIAL TRANSACTIONS
           6.3.2 ACCOUNTS PAYABLE
           6.3.3 GENERAL LEDGER
           6.3.4 FINANCIAL REPORTING
           6.3.5 OTHER ACCOUNTING & FINANCE PROCESSES
                    TABLE 19 BPAAS MARKET IN ACCOUNTING & FINANCE, BY REGION, 2018–2022 (USD MILLION)
                    TABLE 20 MARKET IN ACCOUNTING & FINANCE, BY REGION, 2023–2028 (USD MILLION)
    6.4 SALES & MARKETING 
           6.4.1 NEED FOR LEAD SCORING, CUSTOMER SEGMENTATION, EMAIL MARKETING, AND SOCIAL MEDIA MANAGEMENT
           6.4.2 LEAD GENERATION SERVICES
           6.4.3 CUSTOMER RELATIONSHIP MANAGEMENT (CRM) SERVICES
           6.4.4 OTHER SALES & MARKETING PROCESSES
                    TABLE 21 MARKET IN SALES & MARKETING, BY REGION, 2018–2022 (USD MILLION)
                    TABLE 22 MARKET IN SALES & MARKETING, BY REGION, 2023–2028 (USD MILLION)
    6.5 CUSTOMER SERVICE & SUPPORT 
           6.5.1 GROWTH IN AWARENESS REGARDING CUSTOMER SATISFACTION AND LOYALTY IN COMPETITIVE MARKETS
           6.5.2 CALL CENTER OPERATIONS
           6.5.3 HELP DESK SUPPORT
           6.5.4 TICKET MANAGEMENT
           6.5.5 OTHER CUSTOMER SERVICE & SUPPORT PROCESSES
                    TABLE 23 BPAAS MARKET IN CUSTOMER SERVICE & SUPPORT, BY REGION,  2018–2022 (USD MILLION)
                    TABLE 24MARKET IN CUSTOMER SERVICE & SUPPORT, BY REGION,  2023–2028 (USD MILLION)
    6.6 PROCUREMENT, SUPPLY CHAIN MANAGEMENT, AND OPERATIONS 
           6.6.1 STREAMLINING PROCUREMENT AND SUPPLY CHAINS & OPERATIONS WITH END-TO-END SUPPORT
           6.6.2 VENDOR MANAGEMENT
           6.6.3 PURCHASE ORDER PROCESSING
           6.6.4 INVENTORY OPTIMIZATION
           6.6.5 DISTRIBUTION & LOGISTICS
           6.6.6 OTHER PROCUREMENT, SUPPLY CHAIN MANAGEMENT, AND OPERATION PROCESSES
                    TABLE 25 MARKET IN PROCUREMENT, SUPPLY CHAIN MANAGEMENT, AND OPERATIONS,  BY REGION, 2018–2022 (USD MILLION)
                    TABLE 26 MARKET IN PROCUREMENT, SUPPLY CHAIN MANAGEMENT, AND OPERATIONS,  BY REGION, 2023–2028 (USD MILLION)
    6.7 OTHER BUSINESS PROCESSES 
           TABLE 27 MARKET IN OTHER BUSINESS PROCESSES, BY REGION,  2018–2022 (USD MILLION)
           TABLE 28 MARKET IN OTHER BUSINESS PROCESSES, BY REGION,  2023–2028 (USD MILLION)
 
7 BPAAS MARKET, BY DEPLOYMENT MODEL (Page No. - 93)
    7.1 INTRODUCTION 
           7.1.1 DEPLOYMENT MODEL: MARKET DRIVERS
                    FIGURE 37 HYBRID CLOUD DEPLOYMENT MODEL TO RECORD HIGHEST CAGR
                    TABLE 29 MARKET, BY DEPLOYMENT MODEL, 2018–2022 (USD MILLION)
                    TABLE 30 MARKET, BY DEPLOYMENT MODEL, 2023–2028 (USD MILLION)
    7.2 PUBLIC CLOUD 
           7.2.1 SCALABILITY, FLEXIBILITY, AND COST-EFFICIENCY SOUGHT  BY ORGANIZATIONS
                    TABLE 31 PUBLIC CLOUD-BASED MARKET, BY REGION, 2018–2022 (USD MILLION)
                    TABLE 32 PUBLIC CLOUD-BASED MARKET, BY REGION, 2023–2028 (USD MILLION)
    7.3 PRIVATE CLOUD 
           7.3.1 MEETING SPECIFIC WORKLOAD REQUIREMENTS TO ENSURE OPTIMAL PERFORMANCE AND USER SATISFACTION
                    TABLE 33 PRIVATE CLOUD-BASED MARKET, BY REGION, 2018–2022 (USD MILLION)
                    TABLE 34 PRIVATE CLOUD-BASED MARKET, BY REGION, 2023–2028 (USD MILLION)
    7.4 HYBRID CLOUD 
           7.4.1 INTEROPERABILITY BETWEEN ON-PREMISES SYSTEMS AND CLOUD SERVICES TO OFFER ADDED LEVERAGE IN USING NEWER TECHNOLOGIES
                    TABLE 35 HYBRID CLOUD-BASED MARKET, BY REGION, 2018–2022 (USD MILLION)
                    TABLE 36 HYBRID CLOUD-BASED MARKET, BY REGION, 2023–2028 (USD MILLION)
 
8 BPAAS MARKET, BY ORGANIZATION SIZE (Page No. - 99)
    8.1 INTRODUCTION 
           8.1.1 ORGANIZATION SIZE: MARKET DRIVERS
                    FIGURE 38 SMALL & MEDIUM-SIZED ENTERPRISES TO RECORD HIGHER CAGR DURING FORECAST PERIOD
                    TABLE 37 MARKET, BY ORGANIZATION SIZE, 2018–2022 (USD MILLION)
                    TABLE 38 MARKET, BY ORGANIZATION SIZE, 2023–2028 (USD MILLION)
    8.2 LARGE ENTERPRISES 
           8.2.1 BUSINESS PROCESS SERVICES TAILORED TO NEEDS OF LARGE ENTERPRISES
                    TABLE 39 MARKET FOR LARGE ENTERPRISES, BY REGION, 2018–2022 (USD MILLION)
                    TABLE 40 MARKET FOR LARGE ENTERPRISES, BY REGION, 2023–2028 (USD MILLION)
    8.3 SMALL & MEDIUM-SIZED ENTERPRISES 
           8.3.1 ECONOMICAL BUSINESS PROCESS SERVICES ALIGNING  WITH NEEDS OF SMES
                    TABLE 41 MARKET FOR SMALL & MEDIUM-SIZED ENTERPRISES, BY REGION,  2018–2022 (USD MILLION)
                    TABLE 42 MARKET FOR SMALL & MEDIUM-SIZED ENTERPRISES, BY REGION,  2023–2028 (USD MILLION)
 
9 BPAAS MARKET, BY VERTICAL (Page No. - 104)
    9.1 INTRODUCTION 
           9.1.1 VERTICAL: MARKET DRIVERS
                    FIGURE 39 RETAIL & ECOMMERCE VERTICAL TO RECORD HIGHER CAGR
                    TABLE 43 MARKET, BY VERTICAL, 2018–2022 (USD MILLION)
                    TABLE 44 MARKET, BY VERTICAL, 2023–2028 (USD MILLION)
    9.2 BFSI 
           9.2.1 BFSI: USE CASES
                    9.2.1.1 Retail banking
                    9.2.1.2 Investment banking
           9.2.2 OTHER BFSI USE CASES
                    TABLE 45 MARKET IN BFSI VERTICAL, BY REGION, 2018–2022 (USD MILLION)
                    TABLE 46 MARKET IN BFSI VERTICAL, BY REGION, 2023–2028 (USD MILLION)
    9.3 IT & TELECOM 
           9.3.1 IT & TELECOM: USE CASES
                    9.3.1.1 Billing & invoicing
                    9.3.1.2 Network management
                    9.3.1.3 Other it & telecom use cases
                               TABLE 47 MARKET IN IT & TELECOM VERTICAL, BY REGION, 2018–2022 (USD MILLION)
                               TABLE 48 MARKET IN IT & TELECOM VERTICAL, BY REGION, 2023–2028 (USD MILLION)
    9.4 MANUFACTURING 
           9.4.1 MANUFACTURING: USE CASES
                    9.4.1.1 Production planning & control
           9.4.2 ASSET MANAGEMENT
           9.4.3 OTHER MANUFACTURING USE CASES
                    TABLE 49 MARKET IN MANUFACTURING VERTICAL, BY REGION, 2018–2022 (USD MILLION)
                    TABLE 50 MARKET IN MANUFACTURING VERTICAL, BY REGION, 2023–2028 (USD MILLION)
    9.5 RETAIL & ECOMMERCE 
           9.5.1 UNIFIED SHOPPING EXPERIENCE ACROSS ALL CHANNELS
           9.5.2 RETAIL & ECOMMERCE: USE CASES
                    9.5.2.1 Order processing
                    9.5.2.2 Inventory management
                    9.5.2.3 Other Retail & eCommerce use cases
                               TABLE 51 BPAAS MARKET IN RETAIL & ECOMMERCE VERTICAL, BY REGION,  2018–2022 (USD MILLION)
                               TABLE 52 MARKET IN RETAIL & ECOMMERCE VERTICAL, BY REGION,  2023–2028 (USD MILLION)
    9.6 HEALTHCARE & LIFE SCIENCES 
           9.6.1 PERSONALIZED TREATMENTS TO FACILITATE BPAAS WITH PRECISE ANALYTICS
           9.6.2 HEALTHCARE & LIFE SCIENCES: USE CASES
                    9.6.2.1 Medical billing
           9.6.3 CLAIMS PROCESSING
           9.6.4 OTHER HEALTHCARE & LIFE SCIENCES USE CASES
                    TABLE 53 MARKET IN HEALTHCARE & LIFE SCIENCES, BY REGION,  2018–2022 (USD MILLION)
                    TABLE 54 MARKET IN HEALTHCARE & LIFE SCIENCES, BY REGION,  2023–2028 (USD MILLION)
    9.7 GOVERNMENT & PUBLIC SECTOR 
           9.7.1 SERVICES FOR PUBLIC WITH ENHANCED FINANCIAL AND SECURITY DRIVEN BY BPAAS
           9.7.2 GOVERNMENT & PUBLIC SECTOR: USE CASES
                    9.7.2.1 Regulatory Compliance
                    9.7.2.2 Public Finance & Budgeting
                    9.7.2.3 Other government & public sector use cases
                               TABLE 55 MARKET IN GOVERNMENT & PUBLIC SECTOR VERTICAL, BY REGION,  2018–2022 (USD MILLION)
                               TABLE 56 MARKET IN GOVERNMENT & PUBLIC SECTOR VERTICAL, BY REGION,  2023–2028 (USD MILLION)
    9.8 OTHER VERTICALS 
           TABLE 57 MARKET IN OTHER VERTICALS, BY REGION, 2018–2022 (USD MILLION)
           TABLE 58 MARKET IN OTHER VERTICALS, BY REGION, 2023–2028 (USD MILLION)
 
10 BPAAS MARKET, BY REGION (Page No. - 118)
     10.1 INTRODUCTION 
               FIGURE 40 NORTH AMERICA TO ACCOUNT FOR LARGEST SHARE IN MARKET
               TABLE 59 MARKET, BY REGION, 2018–2022 (USD MILLION)
               TABLE 60 MARKET, BY REGION, 2023–2028 (USD MILLION)
     10.2 NORTH AMERICA 
             10.2.1 NORTH AMERICA: MARKET DRIVERS
             10.2.2 NORTH AMERICA: RECESSION IMPACT
                       FIGURE 41 NORTH AMERICA: BPAAS MARKET SNAPSHOT
                       TABLE 61 NORTH AMERICA: MARKET, BY BUSINESS PROCESS, 2018–2022 (USD MILLION)
                       TABLE 62 NORTH AMERICA: MARKET, BY BUSINESS PROCESS, 2023–2028 (USD MILLION)
                       TABLE 63 NORTH AMERICA: MARKET, BY DEPLOYMENT MODEL, 2018–2022 (USD MILLION)
                       TABLE 64 NORTH AMERICA: MARKET, BY DEPLOYMENT MODEL, 2023–2028 (USD MILLION)
                       TABLE 65 NORTH AMERICA: MARKET, BY ORGANIZATION SIZE, 2018–2022 (USD MILLION)
                       TABLE 66 NORTH AMERICA: MARKET, BY ORGANIZATION SIZE, 2023–2028 (USD MILLION)
                       TABLE 67 NORTH AMERICA: MARKET, BY VERTICAL, 2018–2022 (USD MILLION)
                       TABLE 68 NORTH AMERICA: MARKET, BY VERTICAL, 2023–2028 (USD MILLION)
                       TABLE 69 NORTH AMERICA: MARKET, BY COUNTRY, 2018–2022 (USD MILLION)
                       TABLE 70 NORTH AMERICA: MARKET, BY COUNTRY, 2023–2028 (USD MILLION)
             10.2.3 US
                       10.2.3.1 Huge cloud adoption with industry-specific BPaaS offerings
                                   TABLE 71 US: BPAAS MARKET, BY DEPLOYMENT MODEL, 2018–2022 (USD MILLION)
                                   TABLE 72 US: MARKET, BY DEPLOYMENT MODEL, 2023–2028 (USD MILLION)
                                   TABLE 73 US: MARKET, BY ORGANIZATION SIZE, 2018–2022 (USD MILLION)
                                   TABLE 74 US: MARKET, BY ORGANIZATION SIZE, 2023–2028 (USD MILLION)
             10.2.4 CANADA
                       10.2.4.1 Prioritizing AI and RPA integration for enhanced automation and efficiency with high concentration of SMEs
                                   TABLE 75 CANADA: MARKET, BY DEPLOYMENT MODEL, 2018–2022 (USD MILLION)
                                   TABLE 76 CANADA: MARKET, BY DEPLOYMENT MODEL, 2023–2028 (USD MILLION)
                                   TABLE 77 CANADA: MARKET, BY ORGANIZATION SIZE, 2018–2022 (USD MILLION)
                                   TABLE 78 CANADA: MARKET, BY ORGANIZATION SIZE, 2023–2028 (USD MILLION)
     10.3 EUROPE 
             10.3.1 EUROPEAN MARKET DRIVERS
             10.3.2 EUROPE: RECESSION IMPACT
                       TABLE 79 EUROPE: BPAAS MARKET, BY BUSINESS PROCESS, 2018–2022 (USD MILLION)
                       TABLE 80 EUROPE: MARKET, BY BUSINESS PROCESS, 2023–2028 (USD MILLION)
                       TABLE 81 EUROPE: MARKET, BY DEPLOYMENT MODEL, 2018–2022 (USD MILLION)
                       TABLE 82 EUROPE: MARKET, BY DEPLOYMENT MODEL, 2023–2028 (USD MILLION)
                       TABLE 83 EUROPE: MARKET, BY ORGANIZATION SIZE, 2018–2022 (USD MILLION)
                       TABLE 84 EUROPE: MARKET, BY ORGANIZATION SIZE, 2023–2028 (USD MILLION)
                       TABLE 85 EUROPE: MARKET, BY VERTICAL, 2018–2022 (USD MILLION)
                       TABLE 86 EUROPE: MARKET, BY VERTICAL, 2023–2028 (USD MILLION)
                       TABLE 87 EUROPE: MARKET, BY COUNTRY, 2018–2022 (USD MILLION)
                       TABLE 88 EUROPE: MARKET, BY COUNTRY, 2023–2028 (USD MILLION)
             10.3.3 UK
                       10.3.3.1 Growing adoption of advanced technologies to increase demand for BPaaS
                                   TABLE 89 UK: MARKET, BY DEPLOYMENT MODEL, 2018–2022 (USD MILLION)
                                   TABLE 90 UK: MARKET, BY DEPLOYMENT MODEL, 2023–2028 (USD MILLION)
                                   TABLE 91 UK: MARKET, BY ORGANIZATION SIZE, 2018–2022 (USD MILLION)
                                   TABLE 92 UK: MARKET, BY ORGANIZATION SIZE, 2023–2028 (USD MILLION)
             10.3.4 GERMANY
                       10.3.4.1 Rise in emphasis on enhancing customer experience using  BPaaS solutions
                                   TABLE 93 GERMANY: BPAAS MARKET, BY DEPLOYMENT MODEL, 2018–2022 (USD MILLION)
                                   TABLE 94 GERMANY: MARKET, BY DEPLOYMENT MODEL, 2023–2028 (USD MILLION)
                                   TABLE 95 GERMANY: MARKET, BY ORGANIZATION SIZE, 2018–2022 (USD MILLION)
                                   TABLE 96 GERMANY: MARKET, BY ORGANIZATION SIZE, 2023–2028 (USD MILLION)
             10.3.5 FRANCE
                       10.3.5.1 Rise in adoption of cloud-based BPaaS solutions
                                   TABLE 97 FRANCE: MARKET, BY DEPLOYMENT MODEL, 2018–2022 (USD MILLION)
                                   TABLE 98 FRANCE: MARKET, BY DEPLOYMENT MODEL, 2023–2028 (USD MILLION)
                                   TABLE 99 FRANCE: MARKET, BY ORGANIZATION SIZE, 2018–2022 (USD MILLION)
                                   TABLE 100 FRANCE: MARKET, BY ORGANIZATION SIZE, 2023–2028 (USD MILLION)
             10.3.6 ITALY
                       10.3.6.1 Increase in adoption of BPaaS in SMEs
                                   TABLE 101 ITALY: MARKET, BY DEPLOYMENT MODEL, 2018–2022 (USD MILLION)
                                   TABLE 102 ITALY: MARKET, BY DEPLOYMENT MODEL, 2023–2028 (USD MILLION)
                                   TABLE 103 ITALY: MARKET, BY ORGANIZATION SIZE, 2018–2022 (USD MILLION)
                                   TABLE 104 ITALY: MARKET, BY ORGANIZATION SIZE, 2023–2028 (USD MILLION)
             10.3.7 REST OF EUROPE
                       TABLE 105 REST OF EUROPE: MARKET, BY DEPLOYMENT MODEL, 2018–2022 (USD MILLION)
                       TABLE 106 REST OF EUROPE: MARKET, BY DEPLOYMENT MODEL, 2023–2028 (USD MILLION)
                       TABLE 107 REST OF EUROPE: MARKET, BY ORGANIZATION SIZE, 2018–2022 (USD MILLION)
                       TABLE 108 REST OF EUROPE: MARKET, BY ORGANIZATION SIZE, 2023–2028 (USD MILLION)
     10.4 ASIA PACIFIC 
             10.4.1 ASIA PACIFIC: MARKET DRIVERS
             10.4.2 ASIA PACIFIC: RECESSION IMPACT
                       FIGURE 42 ASIA PACIFIC: BPAAS MARKET SNAPSHOT
                       TABLE 109 ASIA PACIFIC: MARKET, BY BUSINESS PROCESS, 2018–2022 (USD MILLION)
                       TABLE 110 ASIA PACIFIC: MARKET, BY BUSINESS PROCESS, 2023–2028 (USD MILLION)
                       TABLE 111 ASIA PACIFIC: MARKET, BY DEPLOYMENT MODEL, 2018–2022 (USD MILLION)
                       TABLE 112 ASIA PACIFIC: MARKET, BY DEPLOYMENT MODEL, 2023–2028 (USD MILLION)
                       TABLE 113 ASIA PACIFIC: MARKET, BY ORGANIZATION SIZE, 2018–2022 (USD MILLION)
                       TABLE 114 ASIA PACIFIC: MARKET, BY ORGANIZATION SIZE, 2023–2028 (USD MILLION)
                       TABLE 115 ASIA PACIFIC: MARKET, BY VERTICAL, 2018–2022 (USD MILLION)
                       TABLE 116 ASIA PACIFIC: MARKET, BY VERTICAL, 2023–2028 (USD MILLION)
                       TABLE 117 ASIA PACIFIC: MARKET, BY COUNTRY, 2018–2022 (USD MILLION)
                       TABLE 118 ASIA PACIFIC: MARKET, BY COUNTRY, 2023–2028 (USD MILLION)
             10.4.3 CHINA
                       10.4.3.1 Rapid adoption of cloud-based services due to rise in work-from-home operations
                                   TABLE 119 CHINA: MARKET, BY DEPLOYMENT MODEL, 2018–2022 (USD MILLION)
                                   TABLE 120 CHINA: MARKET, BY DEPLOYMENT MODEL, 2023–2028 (USD MILLION)
                                   TABLE 121 CHINA: MARKET, BY ORGANIZATION SIZE, 2018–2022 (USD MILLION)
                                   TABLE 122 CHINA: MARKET, BY ORGANIZATION SIZE, 2023–2028 (USD MILLION)
             10.4.4 JAPAN
                       10.4.4.1 Growth in need to standardize or customize services
                                   TABLE 123 JAPAN: BPAAS MARKET, BY DEPLOYMENT MODEL, 2018–2022 (USD MILLION)
                                   TABLE 124 JAPAN: MARKET, BY DEPLOYMENT MODEL, 2023–2028 (USD MILLION)
                                   TABLE 125 JAPAN: MARKET, BY ORGANIZATION SIZE, 2018–2022 (USD MILLION)
                                   TABLE 126 JAPAN: MARKET, BY ORGANIZATION SIZE, 2023–2028 (USD MILLION)
             10.4.5 AUSTRALIA & NEW ZEALAND
                       10.4.5.1 Enhanced efficiency across organizations with BPaaS
                                   TABLE 127 AUSTRALIA & NEW ZEALAND: MARKET, BY DEPLOYMENT MODEL,  2018–2022 (USD MILLION)
                                   TABLE 128 AUSTRALIA & NEW ZEALAND: MARKET, BY DEPLOYMENT MODEL,  2023–2028 (USD MILLION)
                                   TABLE 129 AUSTRALIA & NEW ZEALAND: MARKET, BY ORGANIZATION SIZE,  2018–2022 (USD MILLION)
                                   TABLE 130 AUSTRALIA & NEW ZEALAND: MARKET, BY ORGANIZATION SIZE,  2023–2028 (USD MILLION)
             10.4.6 REST OF ASIA PACIFIC
                       TABLE 131 REST OF ASIA PACIFIC: MARKET, BY DEPLOYMENT MODEL,  2018–2022 (USD MILLION)
                       TABLE 132 REST OF ASIA PACIFIC: MARKET, BY DEPLOYMENT MODEL,  2023–2028 (USD MILLION)
                       TABLE 133 REST OF ASIA PACIFIC: MARKET, BY ORGANIZATION SIZE,  2018–2022 (USD MILLION)
                       TABLE 134 REST OF ASIA PACIFIC: MARKET, BY ORGANIZATION SIZE,  2023–2028 (USD MILLION)
     10.5 MIDDLE EAST & AFRICA 
             10.5.1 MIDDLE EAST & AFRICA: MARKET DRIVERS
             10.5.2 MIDDLE EAST & AFRICA: RECESSION IMPACT
                       TABLE 135 MIDDLE EAST & AFRICA: BPAAS MARKET, BY BUSINESS PROCESS,  2018–2022 (USD MILLION)
                       TABLE 136 MIDDLE EAST & AFRICA: MARKET, BY BUSINESS PROCESS,  2023–2028 (USD MILLION)
                       TABLE 137 MIDDLE EAST & AFRICA: MARKET, BY DEPLOYMENT MODEL,  2018–2022 (USD MILLION)
                       TABLE 138 MIDDLE EAST & AFRICA: MARKET, BY DEPLOYMENT MODEL,  2023–2028 (USD MILLION)
                       TABLE 139 MIDDLE EAST & AFRICA: MARKET, BY ORGANIZATION SIZE,  2018–2022 (USD MILLION)
                       TABLE 140 MIDDLE EAST & AFRICA: MARKET, BY ORGANIZATION SIZE,  2023–2028 (USD MILLION)
                       TABLE 141 MIDDLE EAST & AFRICA: MARKET, BY VERTICAL, 2018–2022 (USD MILLION)
                       TABLE 142 MIDDLE EAST & AFRICA: MARKET, BY VERTICAL, 2023–2028 (USD MILLION)
                       TABLE 143 MIDDLE EAST & AFRICA: MARKET, BY COUNTRY/REGION,  2018–2022 (USD MILLION)
                       TABLE 144 MIDDLE EAST & AFRICA: MARKET, BY COUNTRY/REGION,  2023–2028 (USD MILLION)
             10.5.3 GCC
                       10.5.3.1 Huge demand for outsourcing critical processes
                                   TABLE 145 GCC: MARKET, BY DEPLOYMENT MODEL, 2018–2022 (USD MILLION)
                                   TABLE 146 GCC: MARKET, BY DEPLOYMENT MODEL, 2023–2028 (USD MILLION)
                                   TABLE 147 GCC: MARKET, BY ORGANIZATION SIZE, 2018–2022 (USD MILLION)
                                   TABLE 148 GCC: MARKET, BY ORGANIZATION SIZE, 2023–2028 (USD MILLION)
                                   TABLE 149 GCC: MARKET, BY COUNTRY, 2018–2022 (USD MILLION)
                                   TABLE 150 GCC: MARKET, BY COUNTRY, 2023–2028 (USD MILLION)
                       10.5.3.2 Saudi Arabia
                       10.5.3.3 UAE
                       10.5.3.4 Rest of GCC
             10.5.4 SOUTH AFRICA
                       10.5.4.1 Increase in use of cloud services that offer cost optimization
                                   TABLE 151 SOUTH AFRICA: BPAAS MARKET, BY DEPLOYMENT MODEL, 2018–2022 (USD MILLION)
                                   TABLE 152 SOUTH AFRICA: MARKET, BY DEPLOYMENT MODEL, 2023–2028 (USD MILLION)
                                   TABLE 153 SOUTH AFRICA: MARKET, BY ORGANIZATION SIZE, 2018–2022 (USD MILLION)
                                   TABLE 154 SOUTH AFRICA: MARKET, BY ORGANIZATION SIZE, 2023–2028 (USD MILLION)
             10.5.5 REST OF MIDDLE EAST & AFRICA
                       TABLE 155 REST OF MIDDLE EAST & AFRICA: MARKET, BY DEPLOYMENT MODEL,  2018–2022 (USD MILLION)
                       TABLE 156 REST OF MIDDLE EAST & AFRICA: MARKET, BY DEPLOYMENT MODEL, 2023–2028 (USD MILLION)
                       TABLE 157 REST OF MIDDLE EAST & AFRICA: MARKET, BY ORGANIZATION SIZE,  2018–2022 (USD MILLION)
                       TABLE 158 REST OF MIDDLE EAST & AFRICA: MARKET, BY ORGANIZATION SIZE,  2023–2028 (USD MILLION)
     10.6 LATIN AMERICA 
             10.6.1 LATIN AMERICA: MARKET DRIVERS
             10.6.2 LATIN AMERICA: RECESSION IMPACT
                       TABLE 159 LATIN AMERICA: BPAAS MARKET, BY BUSINESS PROCESS, 2018–2022 (USD MILLION)
                       TABLE 160 LATIN AMERICA: MARKET, BY BUSINESS PROCESS, 2023–2028 (USD MILLION)
                       TABLE 161 LATIN AMERICA: MARKET, BY DEPLOYMENT MODEL, 2018–2022 (USD MILLION)
                       TABLE 162 LATIN AMERICA: MARKET, BY DEPLOYMENT MODEL, 2023–2028 (USD MILLION)
                       TABLE 163 LATIN AMERICA: MARKET, BY ORGANIZATION SIZE, 2018–2022 (USD MILLION)
                       TABLE 164 LATIN AMERICA: MARKET, BY ORGANIZATION SIZE, 2023–2028 (USD MILLION)
                       TABLE 165 LATIN AMERICA: MARKET, BY VERTICAL, 2018–2022 (USD MILLION)
                       TABLE 166 LATIN AMERICA: MARKET, BY VERTICAL, 2023–2028 (USD MILLION)
                       TABLE 167 LATIN AMERICA: MARKET, BY COUNTRY, 2018–2022 (USD MILLION)
                       TABLE 168 LATIN AMERICA: MARKET, BY COUNTRY,  2023–2028 (USD MILLION)
             10.6.3 BRAZIL
                       10.6.3.1 Development of IT industry
                                   TABLE 169 BRAZIL: MARKET, BY DEPLOYMENT MODEL, 2018–2022 (USD MILLION)
                                   TABLE 170 BRAZIL: MARKET, BY DEPLOYMENT MODEL, 2023–2028 (USD MILLION)
                                   TABLE 171 BRAZIL: MARKET, BY ORGANIZATION SIZE, 2018–2022 (USD MILLION)
                                   TABLE 172 BRAZIL: MARKET, BY ORGANIZATION SIZE,  2023–2028 (USD MILLION)
             10.6.4 MEXICO
                       10.6.4.1 Higher focus on improving business operations with remote access to skilled professionals
                                   TABLE 173 MEXICO: BPAAS MARKET, BY DEPLOYMENT MODEL, 2018–2022 (USD MILLION)
                                   TABLE 174 MEXICO: MARKET, BY DEPLOYMENT MODEL, 2023–2028 (USD MILLION)
                                   TABLE 175 MEXICO: MARKET, BY ORGANIZATION SIZE, 2018–2022 (USD MILLION)
                                   TABLE 176 MEXICO: MARKET, BY ORGANIZATION SIZE, 2023–2028 (USD MILLION)
             10.6.5 REST OF LATIN AMERICA
                       TABLE 177 REST OF LATIN AMERICA: MARKET, BY DEPLOYMENT MODEL,  2018–2022 (USD MILLION)
                       TABLE 178 REST OF LATIN AMERICA: MARKET, BY DEPLOYMENT MODEL,  2023–2028 (USD MILLION)
                       TABLE 179 REST OF LATIN AMERICA: MARKET, BY ORGANIZATION SIZE,  2018–2022 (USD MILLION)
                       TABLE 180 REST OF LATIN AMERICA: MARKET, BY ORGANIZATION SIZE,  2023–2028 (USD MILLION)
 
11 COMPETITIVE LANDSCAPE (Page No. - 164)
     11.1 OVERVIEW 
     11.2 KEY PLAYER STRATEGIES/RIGHT TO WIN 
               TABLE 181 OVERVIEW OF STRATEGIES ADOPTED BY KEY BPAAS VENDORS
     11.3 REVENUE ANALYSIS 
               FIGURE 43 REVENUE ANALYSIS OF KEY PLAYERS IN PAST FIVE YEARS (USD BILLION)
     11.4 MARKET SHARE ANALYSIS 
               FIGURE 44 SHARE OF LEADING COMPANIES IN MARKET, 2022
               TABLE 182 MARKET: DEGREE OF COMPETITION
     11.5 PRODUCT/BRAND COMPARISON 
               TABLE 183 VENDOR PRODUCTS/BRANDS COMPARISON
     11.6 COMPANY EVALUATION MATRIX FOR KEY PLAYERS 
             11.6.1 STARS
             11.6.2 EMERGING LEADERS
             11.6.3 PERVASIVE PLAYERS
             11.6.4 PARTICIPANTS
                       FIGURE 45 BPAAS MARKET: COMPANY EVALUATION MATRIX FOR KEY PLAYERS, 2022
             11.6.5 COMPANY FOOTPRINT FOR KEY PLAYERS
                       FIGURE 46 COMPANY FOOTPRINT
                       TABLE 184 REGION FOOTPRINT
                       TABLE 185 BUSINESS PROCESS FOOTPRINT
                       TABLE 186 DEPLOYMENT MODEL FOOTPRINT
                       TABLE 187 ORGANIZATION SIZE FOOTPRINT
                       TABLE 188 VERTICAL FOOTPRINT
     11.7 COMPANY EVALUATION MATRIX FOR STARTUPS/SMES 
             11.7.1 PROGRESSIVE COMPANIES
             11.7.2 RESPONSIVE COMPANIES
             11.7.3 DYNAMIC COMPANIES
             11.7.4 STARTING BLOCKS
                       FIGURE 47 MARKET: COMPANY EVALUATION MATRIX FOR STARTUPS/SMES, 2022
             11.7.5 COMPETITIVE BENCHMARKING OF STARTUPS/SMES
                       TABLE 189 MARKET: DETAILED LIST OF KEY STARTUPS/SMES, 2023
                       TABLE 190 MARKET: COMPETITIVE BENCHMARKING OF KEY STARTUPS/SMES
     11.8 COMPANY FINANCIAL METRICS 
               FIGURE 48 COMPANY FINANCIAL METRICS, 2024
     11.9 KEY MARKET DEVELOPMENTS 
             11.9.1 PRODUCT LAUNCHES & PRODUCT ENHANCEMENTS
                       TABLE 191 MARKET: PRODUCT LAUNCHES & ENHANCEMENTS, SEPTEMBER 2020–NOVEMBER 2023
             11.9.2 DEALS
                       TABLE 192 BPAAS MARKET: DEALS, FEBRUARY 2023–JANUARY 2024
 
12 COMPANY PROFILES (Page No. - 187)
     12.1 KEY PLAYERS 
(Business Overview, Products/Solutions/Services offered, Recent Developments, MnM View)*
             12.1.1 ACCENTURE
                       TABLE 193 ACCENTURE: BUSINESS OVERVIEW
                       FIGURE 49 ACCENTURE: COMPANY SNAPSHOT
                       TABLE 194 ACCENTURE: PRODUCTS/SOLUTIONS/SERVICES OFFERED
                       TABLE 195 ACCENTURE: PRODUCT LAUNCHES & ENHANCEMENTS
                       TABLE 196 ACCENTURE: DEALS
             12.1.2 CAPGEMINI
                       TABLE 197 CAPGEMINI: COMPANY OVERVIEW
                       FIGURE 50 CAPGEMINI: COMPANY SNAPSHOT
                       TABLE 198 CAPGEMINI: PRODUCTS/SOLUTIONS/SERVICES OFFERED
                       TABLE 199 CAPGEMINI: PRODUCT LAUNCHES & ENHANCEMENTS
                       TABLE 200 CAPGEMINI: DEALS
             12.1.3 COGNIZANT
                       TABLE 201 COGNIZANT: BUSINESS OVERVIEW
                       FIGURE 51 COGNIZANT: COMPANY SNAPSHOT
                       TABLE 202 COGNIZANT: PRODUCTS/SOLUTIONS/SERVICES OFFERED
                       TABLE 203 COGNIZANT: PRODUCT LAUNCHES & ENHANCEMENTS
                       TABLE 204 COGNIZANT DEALS
             12.1.4 IBM
                       TABLE 205 IBM: BUSINESS OVERVIEW
                       FIGURE 52 IBM: COMPANY SNAPSHOT
                       TABLE 206 IBM: PRODUCTS/SOLUTIONS/SERVICES OFFERED
                       TABLE 207 IBM: PRODUCT LAUNCHES & ENHANCEMENTS
                       TABLE 208 IBM: DEALS
             12.1.5 HCL
                       TABLE 209 HCL: BUSINESS OVERVIEW
                       FIGURE 53 HCL: COMPANY SNAPSHOT
                       TABLE 210 HCL: PRODUCTS/SOLUTIONS/SERVICES OFFERED
                       TABLE 211 HCL: PRODUCT LAUNCHES & ENHANCEMENTS
                       TABLE 212 HCL: DEALS
             12.1.6 TCS
                       TABLE 213 TCS: COMPANY OVERVIEW
                       FIGURE 54 TCS: COMPANY SNAPSHOT
                       TABLE 214 TCS: PRODUCTS/SOLUTIONS/SERVICES OFFERED
                       TABLE 215 TCS: DEALS
             12.1.7 FUJITSU
                       TABLE 216 FUJITSU: COMPANY OVERVIEW
                       FIGURE 55 FUJITSU: COMPANY SNAPSHOT
                       TABLE 217 FUJITSU: PRODUCTS/SOLUTIONS/SERVICES OFFERED
                       TABLE 218 FUJITSU: PRODUCT LAUNCHES & ENHANCEMENTS
                       TABLE 219 FUJITSU: DEALS
             12.1.8 GENPACT
                       TABLE 220 GENPACT: COMPANY OVERVIEW
                       FIGURE 56 GENPACT: COMPANY SNAPSHOT
                       TABLE 221 GENPACT: PRODUCTS/SOLUTIONS/SERVICES OFFERED
                       TABLE 222 GENPACT: DEALS
             12.1.9 WIPRO
                       TABLE 223 WIPRO: COMPANY OVERVIEW
                       FIGURE 57 WIPRO: COMPANY SNAPSHOT
                       TABLE 224 WIPRO: PRODUCTS/SOLUTIONS/SERVICES OFFERED
                       TABLE 225 WIPRO: DEALS
             12.1.10 TECH MAHINDRA
                       TABLE 226 TECH MAHINDRA: COMPANY OVERVIEW
                       FIGURE 58 TECH MAHINDRA: COMPANY SNAPSHOT
                       TABLE 227 TECH MAHINDRA: PRODUCTS/SOLUTIONS/SERVICES OFFERED
                       TABLE 228 TECH MAHINDRA: PRODUCT LAUNCHES & ENHANCEMENTS
                       TABLE 229 TECH MAHINDRA: DEALS
*Details on Business Overview, Products/Solutions/Services offered, Recent Developments, MnM View might not be captured in case of unlisted companies.
     12.2 OTHER KEY PLAYERS 
             12.2.1 EXL
             12.2.2 DXC TECHNOLOGY
             12.2.3 CONDUENT
             12.2.4 INFOSYS BPM
             12.2.5 BIZAGI
             12.2.6 IGRAFX
             12.2.7 AURAQUANTIC
             12.2.8 PIPEFY
             12.2.9 CFLOW
             12.2.10 AGILEPOINT
             12.2.11 WORKFLOWGEN
             12.2.12 FLOKZU
             12.2.13 INTEGRIFY
             12.2.14 LINX
             12.2.15 QUIXY
 
13 ADJACENT/RELATED MARKETS (Page No. - 233)
     13.1 INTRODUCTION 
               TABLE 230 ADJACENT MARKETS AND FORECASTS
     13.2 LIMITATIONS 
     13.3 BPAAS MARKET ECOSYSTEM AND ADJACENT MARKETS 
     13.4 BUSINESS PROCESS AUTOMATION MARKET 
             13.4.1 BUSINESS PROCESS AUTOMATION MARKET, BY COMPONENT
                       TABLE 231 BUSINESS PROCESS AUTOMATION MARKET, BY COMPONENT,  2016–2019 (USD MILLION)
                       TABLE 232 BUSINESS PROCESS AUTOMATION MARKET, BY COMPONENT,  2020–2026 (USD MILLION)
             13.4.2 BUSINESS PROCESS AUTOMATION MARKET, BY DEPLOYMENT TYPE
                       TABLE 233 BUSINESS PROCESS AUTOMATION MARKET, BY DEPLOYMENT TYPE,  2016–2019 (USD MILLION)
                       TABLE 234 BUSINESS PROCESS AUTOMATION MARKET, BY DEPLOYMENT TYPE,  2020–2026 (USD MILLION)
     13.5 BUSINESS PROCESS MANAGEMENT MARKET 
             13.5.1 BUSINESS PROCESS MANAGEMENT MARKET, BY COMPONENT
                       TABLE 235 BUSINESS PROCESS MANAGEMENT MARKET, BY COMPONENT,  2018–2025 (USD MILLION)
             13.5.2 BUSINESS PROCESS MANAGEMENT MARKET,  BY BUSINESS FUNCTION
                       TABLE 236 BUSINESS PROCESS MANAGEMENT MARKET, BY BUSINESS FUNCTION,  2018–2025 (USD MILLION)
 
14 APPENDIX (Page No. - 237)
     14.1 DISCUSSION GUIDE 
     14.2 KNOWLEDGESTORE: MARKETSANDMARKETS’  SUBSCRIPTION PORTAL 
     14.3 AVAILABLE CUSTOMIZATIONS 
     14.4 RELATED REPORTS 
     14.5 AUTHOR DETAILS 

This research study involved the extensive use of secondary sources, directories, and databases, such as D&B Hoovers, Bloomberg Businessweek, and Factiva, to identify and collect information useful for this technical, market-oriented, and commercial study of the BPaaS market. Along with that, a few other market-related sources, such as journals including the Journal of Internet Services and Applications (JISA) and Institute of Electrical and Electronics Engineers (IEEE) Transactions on Services Computing, white papers, and associations, such as Central and Eastern European Outsourcing Association (CEEOA) and Association of Business Process Management Professionals (ABPMP), were also considered while conducting extensive secondary research. Both top-down and bottom-up approaches were employed to estimate the complete market size. After that, we used the market breakup and data triangulation procedures to estimate the market size of the various segments in the BPaaS market.

The market has been predicted by analyzing the driving factors, such as the emergence of cloud computing, the growing need for cost-effective businesses, and the need for business agility and faster time to market.

Secondary Research

The market size of companies offering BPaaS was derived based on the secondary data available through paid and unpaid sources, analyzing the product portfolios of major companies in the ecosystem, and rating the companies based on their product capabilities and business strategies. In the secondary research process, various sources were referred to to identify and collect information for the study. Secondary sources included annual reports, press releases, investor presentations of companies and product data sheets, white papers, journals, certified publications, articles from recognized authors, government websites, directories, and databases.

Primary Research

In the primary research process, we interviewed various primary sources from both the supply and demand sides to obtain qualitative and quantitative information on the market. The primary sources from the supply side included various industry experts, including Chief Experience Officers (CXOs); Vice Presidents (VPs); directors from business development, marketing, and product development/innovation teams; related vital executives from BPaaS vendors, industry associations, and independent consultants; and key opinion leaders.

We conducted primary interviews to gather insights, such as market statistics, the latest trends disrupting the market, new use cases implemented, data on revenue collected from products and services, market breakups, market size estimations, market forecasts, and data triangulation. Primary research also helped in understanding various trends related to technology, service type, deployment, and region. Stakeholders from the demand side, such as Chief Information Officers (CIOs), Chief Technology Officers (CTOs), Chief Security Officers (CSOs), the installation teams of governments/end users using BPaaS, and digital initiatives project teams, were interviewed to understand the buyer's perspective on suppliers, products, service providers, and their current use of solutions, which would affect the overall BPaaS market.

BPaaS  Market Size, and Share

To know about the assumptions considered for the study, download the pdf brochure

Market Size Estimation

We used top-down and bottom-up approaches to estimate and forecast the BPaaS and other dependent submarkets. We deployed a bottom-up procedure to arrive at the overall market size using the revenues and offerings of key companies in the market. With data triangulation methods and validation through primary interviews, this study determined and confirmed the exact value of the overall parent market size. We used the overall market size in the top-down procedure to estimate the size of other individual markets via percentage splits of the market segments.

We used top-down and bottom-up approaches to estimate and validate the BPaaS market and other dependent subsegments.

The research methodology used to estimate the market size included the following details:

  • We identified key players in the market through secondary research, and we determined the revenue contributions in respective regions through primary and secondary research.
  • This entire procedure included studying top market players' annual and financial reports and extensive interviews for key insights from industry leaders, such as CEOs, VPs, directors, and marketing executives.
  • All percentage splits and breakups were determined using secondary sources and verified through primary sources.

All the possible parameters that affect the market covered in this research study have been accounted for, viewed in extensive detail, verified through primary research, and analyzed to get the final quantitative and qualitative data. This data is consolidated and added with detailed inputs and analysis from MarketsandMarkets.

BPaaSmarket: Top-down and Bottom-up approaches

BPaaS  Market Bottom Up Approach

To know about the assumptions considered for the study, Request for Free Sample Report

Data Triangulation

After arriving at the overall market size, the market was split into several segments and subsegments—using the market size estimation processes as explained above. Where applicable, data triangulation and market breakup procedures were employed to complete the overall market engineering process and determine each market segment's and subsegment's exact statistics. The data was triangulated by studying several factors and trends from the demand and supply sides in the BPaaS market.

Market Definition

BPaaS stands for Business Process as a Service. It's a cloud-based service model that delivers business process outsourcing (BPO) functions over the internet. Essentially, it provides businesses with access to various business processes, such as human resources, finance, customer service, etc., as a service rather than requiring them to build and manage these processes in-house. This model allows companies to streamline operations, reduce costs, and focus more on their core business activities. BPaaS, like SaaS, is a packaged cloud solution. BPaaS is service-oriented; therefore, it requires well-defined interfaces to connect with other services. The business process layer sits on top. This makes sense because organizations employ software to establish and maintain business processes. SaaS aims to manage and abstract business processes so organizations can focus on their core businesses.
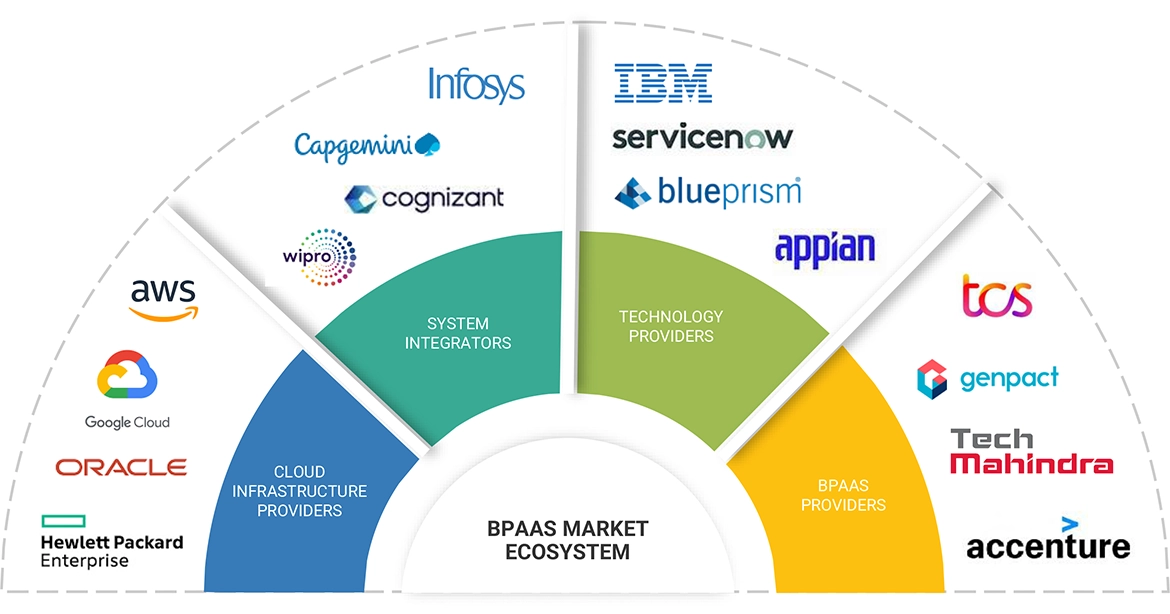
Key Stakeholders

  • Technology Service Providers
  • Cloud Service Providers (CSPs)
  • Government Organizations
  • Networking Companies
  • Consultants/Consultancies/Advisory Firms
  • Support and Maintenance Service Providers
  • Telecom Service Providers
  • Information Technology (IT) Infrastructure Providers
  • System Integrators (SIS)
  • Regional Associations
  • Independent Software Vendors (ISVS)
  • Value-added Resellers and Distributors
  • Value-added Resellers and Distributors

Report Objectives

  • To define, describe, and forecast the global BPaaS market based on business process, deployment model, organization size, vertical, and region in terms of value
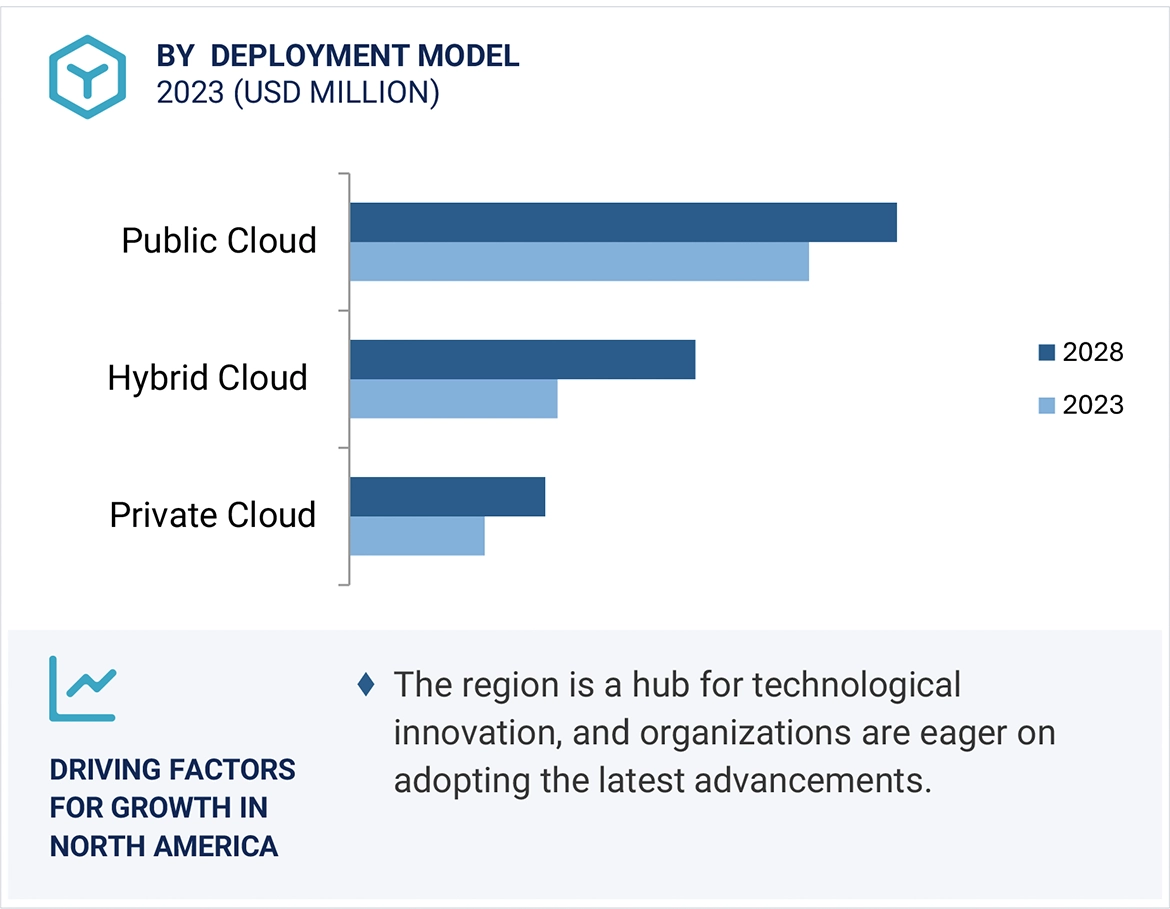
  • To forecast the market size of the five major regional segments: North America, Europe, Asia Pacific, Middle East & Africa, and Latin America
  • To strategically analyze the market subsegments concerning individual growth trends, prospects, and contributions to the total market
  • To provide detailed information related to the major drivers, restraints, opportunities, and challenges influencing the growth of the market
  • To strategically analyze macro and micro markets concerning growth trends, prospects, and their contributions to the overall market
  • To analyze industry trends, patents, innovations, and pricing data related to the BPaaS market
  • To analyze the impact of the recession on business processes, deployment models, organization size, verticals, and regions globally
  • To analyze the opportunities in the market for stakeholders and provide details of their competitive landscape for prominent players
  • To profile key players in the market and comprehensively analyze their market shares/ranking and core competencies
  • To track and analyze competitive developments, such as mergers and acquisitions, new product developments, and partnerships and collaborations in the market

Available Customizations

With the given market data, MarketsandMarkets offers customizations per the company's specific needs. The following customization options are available for the report:

Product Analysis

  • The product matrix provides a detailed comparison of the product portfolio of each company.

Geographic Analysis

  • Further breakup of the Asia Pacific market into countries contributing 75% to the regional market size
  • Further breakup of the North American market into countries contributing 75% to the regional market size
  • Further breakup of the Latin American market into countries contributing 75% to the regional market size
  • Further breakup of the Middle Eastern & African market into countries contributing 75% to the regional market size
  • Further breakup of the European market into countries contributing 75% to the regional market size

Company Information

  • Detailed analysis and profiling of additional market players (up to 5)
Custom Market Research Services

We will customize the research for you, in case the report listed above does not meet with your exact requirements. Our custom research will comprehensively cover the business information you require to help you arrive at strategic and profitable business decisions.

Request Customization
Report Code
TC 1440
Published ON
Feb, 2024
Choose License Type
BUY NOW
  • SHARE
X
Request Customization
Speak to Analyst
Speak to Analyst
OR FACE-TO-FACE MEETING
PERSONALIZE THIS RESEARCH
  • Triangulate with your Own Data
  • Get Data as per your Format and Definition
  • Gain a Deeper Dive on a Specific Application, Geography, Customer or Competitor
  • Any level of Personalization
REQUEST A FREE CUSTOMIZATION
LET US HELP YOU!
  • What are the Known and Unknown Adjacencies Impacting the BPaaS Market
  • What will your New Revenue Sources be?
  • Who will be your Top Customer; what will make them switch?
  • Defend your Market Share or Win Competitors
  • Get a Scorecard for Target Partners
CUSTOMIZED WORKSHOP REQUEST
+1-888-600-6441
  • Call Us
  • +1-888-600-6441 (Corporate office hours)
  • +1-888-600-6441 (US/Can toll free)
  • +44-800-368-9399 (UK office hours)
CONNECT WITH US
ABOUT TRUST ONLINE
©2024 MarketsandMarkets Research Private Ltd. All rights reserved
DMCA.com Protection Status Website Feedback