Drone Warfare by Cap

Drone Warfare by Capability (Platform, Application Software, Services, GCS, Drone launch & Recovery systems), Application (UCAVs, ISR, Delivery), Mode of Operation (Autonomous, Semi-autonomous), and Region - Global Forecast to 2028

Report Code: AS 8963 Mar, 2024, by marketsandmarkets.com

[312 Pages Report] The drone warfare market is poised to experience growth, advancing from USD 20.1 billion in 2023 to reach USD 30.5 billion by 2028, with a Compound Annual Growth Rate (CAGR) of 8.6% during the period from 2023 to 2028. Drones used in warfare can operate autonomously, be controlled remotely, or use a combination of both methods. These unmanned aerial vehicles (UAVs) are equipped with sensors, electronic receivers, transmitters, and offensive weaponry. They serve a critical role in strategic and combat zone reconnaissance, actively participating on the front lines by identifying targets for precision-guided munitions or directly deploying these munitions themselves.

Originating as remotely piloted vehicles (RPVs) or drones, these technologies had their beginnings as small radio-controlled aircraft in World War II, initially used for target training. Over time, these unmanned vehicles have evolved into sophisticated tools employed by major military powers and even some militia groups. Battlefield surveillance UAVs are now extensively utilized to expand the observation capabilities of ground and naval forces, significantly enhancing the range and accuracy of supporting fire.

Drone Warfare Market

Drone Warfare Market

Drone Warfare Market Forecast to 2028

To know about the assumptions considered for the study, Request for Free Sample Report

Drone warfare market Dynamics:

Driver: Drones offer significant cost advantages in terms of operation, maintenance, and training

Drones bring big cost advantages compared to manned aircraft in several ways. They use way less fuel because they're smaller and lighter, which means lower fuel costs, especially for long missions. Their maintenance is simpler too, needing less fixing and making it cheaper. Also, training people to operate drones is quicker and costs less than training pilots for regular planes.

Deploying drones is easier too. They can take off from smaller places and don't need as much infrastructure as regular planes, so they're good for remote areas. Operating them needs fewer people for support, saving on costs. Plus, drones remove the risk of losing human pilots, which saves money on training and compensating families. And if a drone gets lost, it's usually cheaper to replace than a regular plane.

Drones can do lots of different jobs, like spying and attacking, all in one, so they're more versatile. They're also better at hitting targets precisely, which can mean less damage overall. For armies working with tight budgets, drones offer big cost savings. But we also need to think about the ethical and legal issues that come with using drones in warfare.

Restraint: International Legal And Ethical Frameworks Governing The Use Of Lethal Autonomous Weapons Systems (Laws) Are Still Under Development

The rules about using autonomous weapons, like drones, are still unclear internationally. Different countries have different opinions, making it hard to agree on one set of rules for everyone. There are concerns about who should be responsible if something goes wrong and worries about these weapons making decisions without people involved.

All this uncertainty affects the market for drone warfare. People might not want to invest or make these technologies because of legal and ethical problems. Some countries might limit using these weapons until the rules are clearer. Also, public worries about these weapons could influence governments and how much they're used.

People are trying to find solutions, like making international rules for these weapons and setting ethical guidelines for using AI in military tools. Making sure there's human oversight in how these weapons make decisions might help with worries about their independence. Finding ways to deal with these uncertainties can help make using drone technology safe and ethical.

Opportunity: Development of electronic warfare (EW) systems, anti-air lasers, and drone -hunting drone  technologies

Electronic Warfare (EW) systems can mess up how enemy drones work by disrupting their communication and sensors. This helps protect friendly drones and makes missions more successful. With more drones out there, the demand for these systems is growing a lot.

Anti-air lasers are precise and quick at stopping drones without causing much harm to people on the ground. They're also cheaper than other defense systems and keep improving in their range and accuracy.

Drone -hunting drones use tactics like using nets or lasers to take down enemy drones. They're flexible and can adapt easily, making them an emerging solution for dealing with drones.

These new technologies bring in big opportunities for the drone  warfare market. They help expand what companies offer and attract more investors. Working with governments on these technologies could bring in contracts and long-term partnerships.

But there are challenges too. Developing these advanced technologies is complex and needs a lot of expertise. Rules about using lasers and autonomous weapons need careful attention to follow. There are also ethical worries about how these technologies might be used and their impact on civilians.

Challenge: Weather limitations and payload restrictions can hinder drone  effectiveness in certain scenarios

The challenges affecting drones in warfare, like weather and payload limitations, have significant implications for their effectiveness. Bad weather conditions, such as strong winds or heavy rain, greatly affect drone  flights, causing delays and increasing costs for specialized weather-resistant technology. Additionally, smaller drones have limited carrying capacity, restricting the equipment they can handle, which impacts their versatility during missions.

These challenges pose significant hurdles for the drone  warfare market, impacting the frequency and versatility of drone  missions. The limitations on flight and payload affect how useful drones can be and make it hard for smaller companies to compete due to the high costs of solving these issues. However, efforts are underway to find solutions. Improvements in drone  technology aim to make them better at handling harsh weather conditions and increase their capabilities by using groups of smaller drones. The goal is to enhance their adaptability and usefulness across a wide range of scenarios in the future.

Drone Warfare Market Ecosystem/Map

The principal consumers of Drone warfare are defense agencies and governments. These Drone warfare are installed or mount to improve their surveillance, reconnaissance, and connection. Their requirements fuel the desire for sophisticated terminals features, personalization, and operational capability.

Drone Warfare Market by Ecosystem

Based on Application, the Stealth drone segment is projected to grow at the highest CAGR during the forecast period.

A significant factor driving the growth of stealth drones within the drone warfare market is their application in various military operations, particularly for missions requiring covert surveillance and precise, stealthy strikes. Stealth drones equipped with Beyond Visual Line of Sight (BVLOS) range are proving invaluable in search and rescue operations across remote and inaccessible locations. These drones excel in scenarios where human intervention is limited or impossible, enhancing their efficacy in surveillance and stealth operations.

Boeing's Pharitom Ray stands as a prime example of a stealth unmanned combat air vehicle, demonstrating the demand for durable and stealthy UAVs in defense applications. Its versatility in conducting surveillance, ground attacks, and autonomous aerial refueling missions highlights the evolving capabilities of stealth drones in meeting military needs.

Based on mode of operation, Semi autonomous segment is estimated to account for the largest share in 2023.

Based on mode of operation, In the future battlefield, semi-autonomous drones will play a crucial role, working alongside human strategists to enhance warfare. These drones won't just follow human commands; they'll act with some independence, marking a major shift in drone warfare. This change promises more flexibility, efficiency, and reduced risks for human operators. The idea is that these drones can handle tasks on their own, from simple flight maneuvers to analyzing battlefield data, while humans focus on making strategic decisions and engaging targets.

The benefits of semi-autonomous drones are clear: they offer better battlefield awareness, execute missions more precisely, and keep human lives safer in risky situations. But challenges come with this new technology. Questions about ethics, cybersecurity, and integrating human-machine coordination need answers. Still, if managed responsibly, semi-autonomous drones could reshape warfare, making it more effective and ethical for the future.

The Europe region is projected to Grow at highest market CAGR during the forecast period.

Drone Warfare Market
 by Region

Drone Warfare Market by Region

To know about the assumptions considered for the study, download the pdf brochure

The European drone warfare market, Drones provide real-time situational awareness of battlefields to defense forces. Technological upgrades in drones, in terms of sensors and miniature payloads, have fueled the growth of the market for drones in the European region. The demand for drones in military applications is continuously increasing. Heightened geopolitical tensions, particularly with the ongoing war in Ukraine and increased assertiveness from Russia and China, have accelerated the need for enhanced defense capabilities. Drone warfares, offering both reconnaissance and strike capabilities, are now recognized as crucial tools for bolstering regional security.

European countries are actively working towards harmonizing drone regulations, promoting cross-border collaboration, and streamlining deployment processes. This regulatory framework is expected to attract larger investments, facilitating market growth. The European drone warfare market is broadening its focus beyond traditional surveillance and reconnaissance. There is a growing exploration of drones for electronic warfare, logistics and resupply, and maritime patrol. This diversification of applications is opening new avenues for growth and market expansion.

Key Market Players

The major players in the drone warfare companies are Northrop Grumman Corporation (US), Raytheon Technologies Corporation (US), Israel Aerospace Industries Ltd. (Israel), General Atomics Aeronautical Systems (GA-ASI) (US), and Teledyne FLIR LLC (US). These players have adopted various growth strategies such as contracts, joint ventures, partnerships & agreements, acquisitions, and new product launches to further expand their presence in the drone warfare market.

Get online access to the report on the World's First Market Intelligence Cloud

  • Easy to Download Historical Data & Forecast Numbers
  • Company Analysis Dashboard for high growth potential opportunities
  • Research Analyst Access for customization & queries
  • Competitor Analysis with Interactive dashboard
  • Latest News, Updates & Trend analysis
Request Sample

Scope of the Report

Report Metric

Details

Market size available for years

2020-2028

Base year considered

2022

Forecast period

2023-2028

Forecast units

Value (USD)

Segments Covered

By platform, application, mode of operation, and region


Geographies covered

North America, Europe, Asia Pacific, the Middle East, Latin America & Africa

Companies covered

Northrop Grumman Corporation(US), Raytheon Technologies Corporation(US), Israel Aerospace Industries Ltd.(Israel), AeroVironment(US), Boeing(US) among others.

Drone Warfare Market Highlights

This research report categorizes the Drone warfare markets based on capability, application, mode of operation, and region.

Segment

Subsegment

By Capability

  • Platform
  • Application Software
  • Services
  • Ground Control Station
  • Drone Launch And Recovery System

By Application

  • Unmanned Combat Aerial Vehicles (UCAVs)
  • Intelligence, Surveillnace, Reconnaissance (ISR)
  • Delivery

By Mode of Operation

  • Semi Autonomous
  • Autonomous

By Region

  • North America
  • Europe
  • Asia Pacific
  • The Middle East
  • Latin America
  • Africa

Recent Developments

  • In December 2023, General Atomics Aeronautical Systems, a division of General Atomics, was granted a USD 389 million contract to supply MQ-1C-25M Gray Eagle Modernized Extended Range systems to the U.S. Army. The fixed-price incentive award contract is slated for completion by November 29, 2024.
  • In October 2023, both Ukrainian and Russian forces heavily employed remotely piloted drones such as the MQ-9 Reaper and Orlan-10 for reconnaissance, targeting, and launching attacks, underscoring their ongoing significance in contemporary warfare.
  • In June 2023, the US Air Force effectively tested the Boeing Phantom Express, a hypersonic prototype surpassing Mach 5. This test signifies notable advancements in supersonic drone technology.
  • In June 2023, Northrop Grumman secured a USD 1.4 billion contract to provide six additional MQ-4C Triton HALE UAVs to the Royal Australian Air Force (RAAF). This expansion enhances Australia's existing fleet of three Tritons, fortifying its maritime surveillance and capabilities.

Frequently Asked Questions (FAQ’s):

To speak to our analyst for a discussion on the above findings, click Speak to Analyst

TABLE OF CONTENTS
 
1 INTRODUCTION (Page No. - 35)
    1.1 STUDY OBJECTIVES 
    1.2 MARKET DEFINITION 
    1.3 INCLUSIONS AND EXCLUSIONS 
           TABLE 1 INCLUSIONS AND EXCLUSIONS
    1.4 STUDY SCOPE 
           1.4.1 MARKETS COVERED
                    FIGURE 1 DRONE WARFARE MARKET SEGMENTATION
           1.4.2 REGIONS COVERED
           1.4.3 YEARS CONSIDERED
           1.4.4 RECESSION IMPACT ANALYSIS
    1.5 CURRENCY CONSIDERED 
           TABLE 2 USD EXCHANGE RATES
    1.6 STAKEHOLDERS 
 
2 RESEARCH METHODOLOGY (Page No. - 40)
    2.1 RESEARCH DATA 
           FIGURE 2 RESEARCH PROCESS FLOW
           FIGURE 3 RESEARCH DESIGN
           2.1.1 SECONDARY DATA
                    2.1.1.1 Key data from secondary sources
           2.1.2 PRIMARY DATA
                    2.1.2.1 Key insights from primary sources
                    2.1.2.2 Key data from primary sources
    2.2 FACTOR ANALYSIS 
           2.2.1 INTRODUCTION
           2.2.2 DEMAND-SIDE INDICATORS
           2.2.3 SUPPLY-SIDE INDICATORS
    2.3 RESEARCH APPROACH AND METHODOLOGY 
           2.3.1 BOTTOM-UP APPROACH
                    2.3.1.1 Methodology to arrive at market size using bottom-up approach
                               FIGURE 4 BOTTOM-UP APPROACH
           2.3.2 TOP-DOWN APPROACH
                    FIGURE 5 TOP-DOWN APPROACH
    2.4 DATA TRIANGULATION 
           FIGURE 6 DATA TRIANGULATION
    2.5 RESEARCH ASSUMPTIONS 
    2.6 RESEARCH LIMITATIONS 
    2.7 RISK ANALYSIS 
 
3 EXECUTIVE SUMMARY (Page No. - 50)
    FIGURE 7 SMALL DRONES SEGMENT TO EXHIBIT HIGHEST CAGR DURING FORECAST MARKET
    FIGURE 8 INTELLIGENCE, SURVEILLANCE, AND RECONNAISSANCE SEGMENT TO ACCOUNT FOR LARGEST MARKET SHARE DURING FORECAST PERIOD
    FIGURE 9 AUTONOMOUS SEGMENT TO RECORD HIGHEST CAGR DURING FORECAST PERIOD
    FIGURE 10 NORTH AMERICA ACCOUNTED FOR LARGEST MARKET SHARE IN 2023
 
4 PREMIUM INSIGHTS (Page No. - 53)
    4.1 ATTRACTIVE GROWTH OPPORTUNITIES FOR PLAYERS IN DRONE WARFARE MARKET 
           FIGURE 11 INCREASING USE OF DRONES BY DEFENSE FORCES WORLDWIDE TO DRIVE MARKET
    4.2 DRONE WARFARE MARKET, BY CAPABILITY 
           FIGURE 12 PLATFORMS SEGMENT TO LEAD MARKET DURING FORECAST PERIOD
    4.3 DRONE WARFARE MARKET, BY MODE OF OPERATION 
           FIGURE 13 SEMI-AUTONOMOUS SEGMENT TO HOLD LARGEST MARKET SHARE DURING FORECAST PERIOD
    4.4 DRONE WARFARE MARKET, BY APPLICATION 
           FIGURE 14 INTELLIGENCE, SURVEILLANCE, AND RECONNAISSANCE TO BE DOMINANT SEGMENT DURING FORECAST PERIOD
    4.5 DRONE WARFARE MARKET, BY PLATFORMS 
           FIGURE 15 STRATEGIC DRONES SEGMENT TO CAPTURE LARGEST MARKET SHARE DURING FORECAST PERIOD
 
5 MARKET OVERVIEW (Page No. - 56)
    5.1 INTRODUCTION 
    5.2 MARKET DYNAMICS 
           FIGURE 16 DRIVERS, RESTRAINTS, OPPORTUNITIES, AND CHALLENGES
           5.2.1 DRIVERS
                    5.2.1.1 Rising integration of artificial intelligence in drones
                    5.2.1.2 Growing cost advantages over manned aircraft
                    5.2.1.3 Increasing incorporation of drones into network-centric warfare
                    5.2.1.4 Surge in global conflicts and terrorist threats
           5.2.2 RESTRAINTS
                    5.2.2.1 Stringent legal and ethical frameworks
                    5.2.2.2 Limited effectiveness in adverse weather conditions
                    5.2.2.3 High dependence on robust communication infrastructure
           5.2.3 OPPORTUNITIES
                    5.2.3.1 Development of electronic warfare systems
                    5.2.3.2 Increasing adoption of miniaturized drones
                    5.2.3.3 Rising demand for counter drones
           5.2.4 CHALLENGES
                    5.2.4.1 Complex training programs
                    5.2.4.2 Limited energy density of current battery technology
    5.3 VALUE CHAIN ANALYSIS 
           FIGURE 17 VALUE CHAIN ANALYSIS
    5.4 TRENDS AND DISRUPTIONS IMPACTING CUSTOMER BUSINESS 
           FIGURE 18 REVENUE SHIFT AND NEW REVENUE POCKETS FOR DRONE WARFARE MARKET PLAYERS
    5.5 ECOSYSTEM ANALYSIS 
           5.5.1 PROMINENT COMPANIES
           5.5.2 PRIVATE AND SMALL ENTERPRISES
           5.5.3 END USERS
                    FIGURE 19 ECOSYSTEM MAPPING
                    TABLE 3 ROLE OF COMPANIES IN ECOSYSTEM
    5.6 BUSINESS MODEL 
           FIGURE 20 BUSINESS MODEL
           TABLE 4 LEASED MILITARY DRONES
    5.7 TECHNOLOGY ANALYSIS 
           5.7.1 ARTIFICIAL INTELLIGENCE IN MILITARY DRONES
                    TABLE 5 COMPANIES DEVELOPING DRONE SOFTWARE WITH AI
                    TABLE 6 COMPANIES DEVELOPING DRONE EQUIPMENT WITH AI
           5.7.2 MID-AIR REFUELING OF DRONES
           5.7.3 SPY DRONES
    5.8 AVERAGE SELLING PRICE ANALYSIS 
           FIGURE 21 AVERAGE SELLING PRICE, BY KEY PLAYERS
           TABLE 7 AVERAGE SELLING PRICE OF KEY PLAYERS FOR TOP THREE APPLICATIONS (USD MILLION)
           5.8.1 AVERAGE SELLING PRICE, BY DRONE TYPE
                    TABLE 8 AVERAGE SELLING PRICE, BY DRONE TYPE (USD MILLION)
           5.8.2 AVERAGE SELLING PRICE, BY REGION
                    TABLE 9 AVERAGE SELLING PRICE, BY REGION (USD MILLION)
           5.8.3 AVERAGE SELLING PRICE, BY PLATFORM
                    TABLE 10 AVERAGE SELLING PRICE, BY PLATFORM (USD MILLION)
           5.8.4 AVERAGE SELLING PRICE OF UNMANNED AERIAL VEHICLES AND THEIR COMPONENTS
                    TABLE 11 AVERAGE SELLING PRICE OF UNMANNED AERIAL VEHICLES AND THEIR COMPONENTS (USD)
    5.9 VOLUME ANALYSIS 
           TABLE 12 VOLUME DATA, BY PLATFORM (UNITS)
    5.10 KEY STAKEHOLDERS AND BUYING CRITERIA 
           5.10.1 KEY STAKEHOLDERS IN BUYING PROCESS
                    FIGURE 22 INFLUENCE OF STAKEHOLDERS ON BUYING PROCESS
                    TABLE 13 INFLUENCE OF STAKEHOLDERS ON BUYING PROCESS FOR TOP THREE APPLICATIONS (%)
           5.10.2 BUYING CRITERIA
                    FIGURE 23 KEY BUYING CRITERIA FOR TOP THREE APPLICATIONS
                    TABLE 14 KEY BUYING CRITERIA FOR TOP THREE APPLICATIONS
    5.11 OPERATIONAL DATA 
           FIGURE 24 TOTAL ACTIVE FLEET OF DRONES USED BY US NAVY AND MARINE (UNITS)
           FIGURE 25 TOTAL ACTIVE FLEET OF DRONES USED BY US AIR FORCE (UNITS)
           FIGURE 26 ARMED DRONES ACQUIRED, USED, AND DEVELOPED WORLDWIDE, 2000–2020
    5.12 INVESTMENT AND FUNDING SCENARIO 
           FIGURE 27 INVESTMENT SCENARIO, 2011–2022
           TABLE 15 INVESTMENT TREND IN DRONE INDUSTRY, 2022
           5.12.1 DRONE STARTUP EQUITY FUNDING (USD BILLION)
    5.13 TOTAL COST OF OWNERSHIP 
           TABLE 16 ESTIMATED COST OF DRONES
           TABLE 17 TECHNICAL COST OF DRONES
           TABLE 18 TOTAL COST OF OWNERSHIP OF DRONE WARFARE
    5.14 TECHNOLOGY ROADMAP 
           FIGURE 28 TECHNOLOGY ROADMAP
           FIGURE 29 EVOLUTION OF TECHNOLOGY TRENDS
           FIGURE 30 EMERGING TRENDS
    5.15 REGULATORY LANDSCAPE 
           5.15.1 REGULATORY BODIES, GOVERNMENT AGENCIES, AND OTHER ORGANIZATIONS
                    TABLE 19 NORTH AMERICA: REGULATORY BODIES, GOVERNMENT AGENCIES, AND OTHER ORGANIZATIONS
                    TABLE 20 EUROPE: REGULATORY BODIES, GOVERNMENT AGENCIES, AND OTHER ORGANIZATIONS
                    TABLE 21 ASIA PACIFIC: REGULATORY BODIES, GOVERNMENT AGENCIES, AND OTHER ORGANIZATIONS
                    TABLE 22 MIDDLE EAST: REGULATORY BODIES, GOVERNMENT AGENCIES, AND OTHER ORGANIZATIONS
                    TABLE 23 LATIN AMERICA: REGULATORY BODIES, GOVERNMENT AGENCIES, AND OTHER ORGANIZATIONS
           5.15.2 REGULATIONS AND APPROVALS TO OPERATE DRONES
                    TABLE 24 DRONE OPERATIONS AND APPROVALS, BY COUNTRY
                    TABLE 25 DRONE REGULATIONS, BY COUNTRY
                    5.15.2.1 Rules and guidelines to operate drones
                                TABLE 26 US: RULES AND GUIDELINES TO OPERATE DRONES
                                TABLE 27 CANADA: RULES AND GUIDELINES TO OPERATE DRONES
                                TABLE 28 UK: RULES AND GUIDELINES TO OPERATE DRONES
                                TABLE 29 GERMANY: RULES AND GUIDELINES TO OPERATE DRONES
                                TABLE 30 FRANCE: RULES AND GUIDELINES TO OPERATE DRONES
    5.16 TRADE DATA ANALYSIS 
           TABLE 31 TRADE DATA OF MAJOR COUNTRIES
           5.16.1 IMPORT DATA ANALYSIS
                    5.16.1.1 Unmanned aircraft with maximum take-off weight of >150 kg (HS Code: 880699)
                                 TABLE 32 TOP FIVE IMPORTING COUNTRIES, 2022 (USD MILLION)
                                 FIGURE 31 TOP 10 IMPORTING COUNTRIES, 2022 (USD THOUSAND)
           5.16.2 EXPORT DATA ANALYSIS
                    5.16.2.1 Unmanned aircraft with maximum take-off weight of >150 kg (HS Code: 880699)
                                 TABLE 33 TOP FIVE EXPORTING COUNTRIES, 2022 (USD MILLION)
                                 FIGURE 32 TOP 10 EXPORTING COUNTRIES, 2022 (USD THOUSAND)
    5.17 KEY CONFERENCES AND EVENTS 
           TABLE 34 KEY CONFERENCES AND EVENTS, 2024–2025
 
6 INDUSTRY TRENDS (Page No. - 92)
    6.1 INTRODUCTION 
    6.2 TECHNOLOGY TRENDS 
           6.2.1 MINIATURIZATION
           6.2.2 ARTIFICIAL INTELLIGENCE AND AUTONOMY
           6.2.3 ADVANCED SENSORS AND IMAGING
           6.2.4 HYPERSONIC PROPULSION
           6.2.5 CYBERSECURITY AND DATA PROTECTION
           6.2.6 BIO-INSPIRED FLIGHT AND ROBOTICS
    6.3 IMPACT OF MEGATRENDS 
           6.3.1 AUTONOMY
           6.3.2 ARTIFICIAL INTELLIGENCE AND MACHINE LEARNING
           6.3.3 ADVANCED SENSORS
    6.4 SUPPLY CHAIN ANALYSIS 
           FIGURE 33 SUPPLY CHAIN ANALYSIS
    6.5 USE CASE ANALYSIS 
           6.5.1 AEROVIRONMENT PUMA 3 AE FOR MARITIME USE
           6.5.2 BAYRAKTAR TB-2 USED IN RUSSIA-UKRAINE CONFLICT
           6.5.3 DRONES USED AT WEST BANK
    6.6 PATENT ANALYSIS 
           FIGURE 34 PATENT ANALYSIS
           FIGURE 35 REGIONAL ANALYSIS OF PATENTS, 2023
           TABLE 35 REGIONAL ANALYSIS OF PATENTS, 2023
           TABLE 36 INNOVATIONS AND PATENT REGISTRATIONS, 2019–2023
 
7 DRONE WARFARE MARKET, BY CAPABILITY (Page No. - 103)
    7.1 INTRODUCTION 
           TABLE 37 DRONE WARFARE MARKET, BY CAPABILITY, 2020–2022 (USD MILLION)
           TABLE 38 DRONE WARFARE MARKET, BY CAPABILITY, 2023–2028 (USD MILLION)
           7.1.1 PLATFORMS
                    FIGURE 36 DRONE WARFARE MARKET, BY PLATFORMS, 2023–2028 (USD MILLION)
                    TABLE 39 DRONE WARFARE MARKET, BY PLATFORMS, 2020–2022 (USD MILLION)
                    TABLE 40 DRONE WARFARE MARKET, BY PLATFORMS, 2023–2028 (USD MILLION)
                    7.1.1.1 Small drones
                               7.1.1.1.1 Increasing demand for surveillance and reconnaissance to drive market
                    7.1.1.2 Tactical drones
                               7.1.1.2.1 Growing need for improved situational awareness and precision strike capabilities to drive market
                    7.1.1.3 Strategic drones
                               7.1.1.3.1 Rising cost efficiency over piloted aircraft to drive market
           7.1.2 APPLICATION SOFTWARE
                    7.1.2.1 Border security and precision agriculture applications to drive market
           7.1.3 SERVICES
                    TABLE 41 DRONE WARFARE MARKET, BY SERVICES, 2020–2022 (USD MILLION)
                    TABLE 42 DRONE WARFARE MARKET, BY SERVICES, 2023–2028 (USD MILLION)
                    7.1.3.1 Repair and maintenance
                               7.1.3.1.1 Surge in checking pre- and post-flight operation efficiency to drive market
                    7.1.3.2 Simulation and training
                               7.1.3.2.1 Growing need for risk-free training environment to drive market
           7.1.4 GROUND CONTROL STATIONS
                    7.1.4.1 Portable
                               7.1.4.1.1 Increasing need for flexible deployment in challenging environments to drive market
                    7.1.4.2 Mobile
                               7.1.4.2.1 Growing need for resilient systems in harsh field conditions to drive market
           7.1.5 DRONE LAUNCH AND RECOVERY SYSTEMS
                    7.1.5.1 Rising integration of drones into explosive devices to drive market
 
8 DRONE WARFARE MARKET, BY APPLICATION (Page No. - 110)
    8.1 INTRODUCTION 
           FIGURE 37 DRONE WARFARE MARKET, BY APPLICATION, 2023–2028 (USD MILLION)
           TABLE 43 DRONE WARFARE MARKET, BY APPLICATION, 2020–2022 (USD MILLION)
           TABLE 44 DRONE WARFARE MARKET, BY APPLICATION, 2023–2028 (USD MILLION)
    8.2 UNMANNED COMBAT AERIAL VEHICLES 
           TABLE 45 DRONE WARFARE MARKET, BY UNMANNED COMBAT AERIAL VEHICLES, 2020–2022 (USD MILLION)
           TABLE 46 DRONE WARFARE MARKET, BY UNMANNED COMBAT AERIAL VEHICLES, 2023–2028 (USD MILLION)
           8.2.1 LETHAL DRONES
                    8.2.1.1 Increasing use in land and marine applications to drive market
           8.2.2 STEALTH DRONES
                    8.2.2.1 Growing use in covert surveillance and rescue operations in inaccessible locations to drive market
           8.2.3 LOITERING MUNITIONS
                    TABLE 47 DRONE WARFARE MARKET, BY LOITERING MUNITIONS, 2020–2022 (USD MILLION)
                    TABLE 48 DRONE WARFARE MARKET, BY LOITERING MUNITIONS, 2023–2028 (USD MILLION)
                    8.2.3.1 Recoverables
                               8.2.3.1.1 Retrievable and reusable features to drive market
                    8.2.3.2 Expendables
                               8.2.3.2.1 Increasing use of navigation and target acquisition systems to drive market
           8.2.4 TARGET DRONES
                    8.2.4.1 Rising need for multi-spectrum operations for undetected operations to drive market
 
           8.3.1 SURVEILLANCE DRONES
                    8.3.1.1 Increasing developments in sensor technology and autonomy to drive market
           8.3.2 RECONNAISSANCE DRONES
                    8.3.2.1 Rising preference for weapons without human intervention to drive market
           8.3.3 TARGET ACQUISITION DRONES
                    8.3.3.1 Urban warfare and environmental monitoring applications to drive market
    8.4 DELIVERY 
           8.4.1 NEED FOR CARGO DELIVERY OF MEDICAL AIDS, FOOD SUPPLIES, AND AMMUNITION ON BATTLEFIELDS TO DRIVE MARKET
 
9 DRONE WARFARE MARKET, BY MODE OF OPERATION (Page No. - 117)
    9.1 INTRODUCTION 
           FIGURE 38 DRONE WARFARE MARKET, BY MODE OF OPERATION, 2023–2028 (USD MILLION)
           TABLE 49 DRONE WARFARE MARKET, BY MODE OF OPERATION, 2020–2022 (USD MILLION)
           TABLE 50 DRONE WARFARE MARKET, BY MODE OF OPERATION, 2023–2028 (USD MILLION)
    9.2 SEMI-AUTONOMOUS 
           9.2.1 INCREASING NEED FOR IMPROVED BATTLEFIELD AWARENESS TO DRIVE MARKET
    9.3 AUTONOMOUS 
           9.3.1 GROWING USE OF AUTONOMOUS MACHINES TO DRIVE MARKET
 
10 DRONE WARFARE MARKET, BY REGION (Page No. - 120)
     10.1 INTRODUCTION 
             10.1.1 REGIONAL RECESSION IMPACT ANALYSIS
           FIGURE 39 DRONE WARFARE MARKET, BY REGION, 2023–2028
                        TABLE 51 DRONE WARFARE MARKET, BY REGION, 2020–2022 (USD MILLION)
                        TABLE 52 DRONE WARFARE MARKET, BY REGION, 2023–2028 (USD MILLION)
     10.2 NORTH AMERICA 
             10.2.1 RECESSION IMPACT ANALYSIS
             10.2.2 PESTLE ANALYSIS
                        FIGURE 40 NORTH AMERICA: DRONE WARFARE MARKET SNAPSHOT
                        TABLE 53 NORTH AMERICA: DRONE WARFARE MARKET, BY COUNTRY, 2020–2022 (USD MILLION)
                        TABLE 54 NORTH AMERICA: DRONE WARFARE MARKET, BY COUNTRY, 2023–2028 (USD MILLION)
                        TABLE 55 NORTH AMERICA: DRONE WARFARE MARKET, BY CAPABILITY, 2020–2022 (USD MILLION)
                        TABLE 56 NORTH AMERICA: DRONE WARFARE MARKET, BY CAPABILITY, 2023–2028 (USD MILLION)
                        TABLE 57 NORTH AMERICA: DRONE WARFARE MARKET, BY APPLICATION, 2020–2022 (USD MILLION)
                        TABLE 58 NORTH AMERICA: DRONE WARFARE MARKET, BY APPLICATION, 2023–2028 (USD MILLION)
             10.2.3 US
                        10.2.3.1 Growing initiatives for unmanned aerial capabilities to drive market
                                     TABLE 59 US: DRONE WARFARE MARKET, BY CAPABILITY, 2020–2022 (USD MILLION)
                                     TABLE 60 US: DRONE WARFARE MARKET, BY CAPABILITY, 2023–2028 (USD MILLION)
                                     TABLE 61 US: DRONE WARFARE MARKET, BY APPLICATION, 2020–2022 (USD MILLION)
                                     TABLE 62 US: DRONE WARFARE MARKET, BY APPLICATION, 2023–2028 (USD MILLION)
                                     TABLE 63 US: DEFENSE PROGRAM MAPPING
             10.2.4 CANADA
                        10.2.4.1 New contracts from Royal Canadian Air Force to drive market
                                     TABLE 64 CANADA: DRONE WARFARE MARKET, BY CAPABILITY, 2020–2022 (USD MILLION)
                                     TABLE 65 CANADA: DRONE WARFARE MARKET, BY CAPABILITY, 2023–2028 (USD MILLION)
                                     TABLE 66 CANADA: DRONE WARFARE MARKET, BY APPLICATION, 2020–2022 (USD MILLION)
                                     TABLE 67 CANADA: DRONE WARFARE MARKET, BY APPLICATION, 2023–2028 (USD MILLION)
                                     TABLE 68 CANADA: DEFENSE PROGRAM MAPPING
     10.3 EUROPE 
             10.3.1 RECESSION IMPACT ANALYSIS
             10.3.2 PESTLE ANALYSIS
                        FIGURE 41 EUROPE: DRONE WARFARE MARKET SNAPSHOT
                        TABLE 69 EUROPE: DRONE WARFARE MARKET, BY COUNTRY, 2020–2022 (USD MILLION)
                        TABLE 70 EUROPE: DRONE WARFARE MARKET, BY COUNTRY, 2023–2028 (USD MILLION)
                        TABLE 71 EUROPE: DRONE WARFARE MARKET, BY CAPABILITY, 2020–2022 (USD MILLION)
                        TABLE 72 EUROPE: DRONE WARFARE MARKET, BY CAPABILITY, 2023–2028 (USD MILLION)
                        TABLE 73 EUROPE: DRONE WARFARE MARKET, BY APPLICATION, 2020–2022 (USD MILLION)
                        TABLE 74 EUROPE: DRONE WARFARE MARKET, BY APPLICATION, 2023–2028 (USD MILLION)
             10.3.3 RUSSIA
                        10.3.3.1 Growing border disputes with Ukraine to drive market
                                     TABLE 75 RUSSIA: DRONE WARFARE MARKET, BY CAPABILITY, 2020–2022 (USD MILLION)
                                     TABLE 76 RUSSIA: DRONE WARFARE MARKET, BY CAPABILITY, 2023–2028 (USD MILLION)
                                     TABLE 77 RUSSIA: DRONE WARFARE MARKET, BY APPLICATION, 2020–2022 (USD MILLION)
                                     TABLE 78 RUSSIA: DRONE WARFARE MARKET, BY APPLICATION, 2023–2028 (USD MILLION)
                                     TABLE 79 RUSSIA: DEFENSE PROGRAM MAPPING
             10.3.4 FRANCE
                        10.3.4.1 Joint European drone warfare project deal to drive market
                                     TABLE 80 FRANCE: DRONE WARFARE MARKET, BY CAPABILITY, 2020–2022 (USD MILLION)
                                     TABLE 81 FRANCE: DRONE WARFARE MARKET, BY CAPABILITY, 2023–2028 (USD MILLION)
                                     TABLE 82 FRANCE: DRONE WARFARE MARKET, BY APPLICATION, 2020–2022 (USD MILLION)
                                     TABLE 83 FRANCE: DRONE WARFARE MARKET, BY APPLICATION, 2023–2028 (USD MILLION)
                                     TABLE 84 FRANCE: DEFENSE PROGRAM MAPPING
             10.3.5 UK
                        10.3.5.1 Rise in domestic innovations and collaborations to drive market
                                     TABLE 85 UK: DRONE WARFARE MARKET, BY CAPABILITY, 2020–2022 (USD MILLION)
                                     TABLE 86 UK: DRONE WARFARE MARKET, BY CAPABILITY, 2023–2028 (USD MILLION)
                                     TABLE 87 UK: DRONE WARFARE MARKET, BY APPLICATION, 2020–2022 (USD MILLION)
                                     TABLE 88 UK: DRONE WARFARE MARKET, BY APPLICATION, 2023–2028 (USD MILLION)
                                     TABLE 89 UK: DEFENSE PROGRAM MAPPING
             10.3.6 GERMANY
                        10.3.6.1 Increasing demand for drone warfare from armed forces to drive market
                                     TABLE 90 GERMANY: DRONE WARFARE MARKET, BY CAPABILITY, 2020–2022 (USD MILLION)
                                     TABLE 91 GERMANY: DRONE WARFARE MARKET, BY CAPABILITY, 2023–2028 (USD MILLION)
                                     TABLE 92 GERMANY: DRONE WARFARE MARKET, BY APPLICATION, 2020–2022 (USD MILLION)
                                     TABLE 93 GERMANY: DRONE WARFARE MARKET, BY APPLICATION, 2023–2028 (USD MILLION)
                                     TABLE 94 GERMANY: DEFENSE PROGRAM MAPPING
             10.3.7 UKRAINE
                        10.3.7.1 Growing development of strike-capable drones to drive market
                                     TABLE 95 UKRAINE: DRONE WARFARE MARKET, BY CAPABILITY, 2020–2022 (USD MILLION)
                                     TABLE 96 UKRAINE: DRONE WARFARE MARKET, BY CAPABILITY, 2023–2028 (USD MILLION)
                                     TABLE 97 UKRAINE: DRONE WARFARE MARKET, BY APPLICATION, 2020–2022 (USD MILLION)
                                     TABLE 98 UKRAINE: DRONE WARFARE MARKET, BY APPLICATION, 2023–2028 (USD MILLION)
                                     TABLE 99 UKRAINE: DEFENSE PROGRAM MAPPING
             10.3.8 ITALY
                        10.3.8.1 Surge in training initiatives to drive market
                                     TABLE 100 ITALY: DRONE WARFARE MARKET, BY CAPABILITY, 2020–2022 (USD MILLION)
                                     TABLE 101 ITALY: DRONE WARFARE MARKET, BY CAPABILITY, 2023–2028 (USD MILLION)
                                     TABLE 102 ITALY: DRONE WARFARE MARKET, BY APPLICATION, 2020–2022 (USD MILLION)
                                     TABLE 103 ITALY: DRONE WARFARE MARKET, BY APPLICATION, 2023–2028 (USD MILLION)
                                     TABLE 104 ITALY: DEFENSE PROGRAM MAPPING
             10.3.9 SWEDEN
                        10.3.9.1 Increasing focus on developing drones and associated solutions to drive market
                                     TABLE 105 SWEDEN: DRONE WARFARE MARKET, BY CAPABILITY, 2020–2022 (USD MILLION)
                                     TABLE 106 SWEDEN: DRONE WARFARE MARKET, BY CAPABILITY, 2023–2028 (USD MILLION)
                                     TABLE 107 SWEDEN: DRONE WARFARE MARKET, BY APPLICATION, 2020–2022 (USD MILLION)
                                     TABLE 108 SWEDEN: DRONE WARFARE MARKET, BY APPLICATION, 2023–2028 (USD MILLION)
             10.3.10 REST OF EUROPE
                        TABLE 109 REST OF EUROPE: DRONE WARFARE MARKET, BY CAPABILITY, 2020–2022 (USD MILLION)
                        TABLE 110 REST OF EUROPE: DRONE WARFARE MARKET, BY CAPABILITY, 2023–2028 (USD MILLION)
                        TABLE 111 REST OF EUROPE: DRONE WARFARE MARKET, BY APPLICATION, 2020–2022 (USD MILLION)
                        TABLE 112 REST OF EUROPE: DRONE WARFARE MARKET, BY APPLICATION, 2023–2028 (USD MILLION)
     10.4 ASIA PACIFIC 
             10.4.1 RECESSION IMPACT ANALYSIS
             10.4.2 PESTLE ANALYSIS
                        FIGURE 42 ASIA PACIFIC: DRONE WARFARE MARKET SNAPSHOT
                        TABLE 113 ASIA PACIFIC: DRONE WARFARE MARKET, BY COUNTRY, 2020–2022 (USD MILLION)
                        TABLE 114 ASIA PACIFIC: DRONE WARFARE MARKET, BY COUNTRY, 2023–2028 (USD MILLION)
                        TABLE 115 ASIA PACIFIC: DRONE WARFARE MARKET, BY CAPABILITY, 2020–2022 (USD MILLION)
                        TABLE 116 ASIA PACIFIC: DRONE WARFARE MARKET, BY CAPABILITY, 2023–2028 (USD MILLION)
                        TABLE 117 ASIA PACIFIC: DRONE WARFARE MARKET, BY APPLICATION, 2020–2022 (USD MILLION)
                        TABLE 118 ASIA PACIFIC: DRONE WARFARE MARKET, BY APPLICATION, 2023–2028 (USD MILLION)
             10.4.3 CHINA
                        10.4.3.1 Increasing experimentation with hypersonic and solar-powered features to drive market
                                     TABLE 119 CHINA: DRONE WARFARE MARKET, BY CAPABILITY, 2020–2022 (USD MILLION)
                                     TABLE 120 CHINA: DRONE WARFARE MARKET, BY CAPABILITY, 2023–2028 (USD MILLION)
                                     TABLE 121 CHINA: DRONE WARFARE MARKET, BY APPLICATION, 2020–2022 (USD MILLION)
                                     TABLE 122 CHINA: DRONE WARFARE MARKET, BY APPLICATION, 2023–2028 (USD MILLION)
                                     TABLE 123 CHINA: DEFENSE PROGRAM MAPPING
             10.4.4 INDIA
                        10.4.4.1 Rising defense budgets to drive market
                                     TABLE 124 INDIA: DRONE WARFARE MARKET, BY CAPABILITY, 2020–2022 (USD MILLION)
                                     TABLE 125 INDIA: DRONE WARFARE MARKET, BY CAPABILITY, 2023–2028 (USD MILLION)
                                     TABLE 126 INDIA: DRONE WARFARE MARKET, BY APPLICATION, 2020–2022 (USD MILLION)
                                     TABLE 127 INDIA: DRONE WARFARE MARKET, BY APPLICATION, 2023–2028 (USD MILLION)
                                     TABLE 128 INDIA: DEFENSE PROGRAM MAPPING
             10.4.5 JAPAN
                        10.4.5.1 Growing demand for mini unmanned aerial vehicles to drive market
                                     TABLE 129 JAPAN: DRONE WARFARE MARKET, BY CAPABILITY, 2020–2022 (USD MILLION)
                                     TABLE 130 JAPAN: DRONE WARFARE MARKET, BY CAPABILITY, 2023–2028 (USD MILLION)
                                     TABLE 131 JAPAN: DRONE WARFARE MARKET, BY APPLICATION, 2020–2022 (USD MILLION)
                                     TABLE 132 JAPAN: DRONE WARFARE MARKET, BY APPLICATION, 2023–2028 (USD MILLION)
                                     TABLE 133 JAPAN: DEFENSE PROGRAM MAPPING
             10.4.6 AUSTRALIA
                        10.4.6.1 High government funding for developing military drones to drive market
                                     TABLE 134 AUSTRALIA: DRONE WARFARE MARKET, BY CAPABILITY, 2020–2022 (USD MILLION)
                                     TABLE 135 AUSTRALIA: DRONE WARFARE MARKET, BY CAPABILITY, 2023–2028 (USD MILLION)
                                     TABLE 136 AUSTRALIA: DRONE WARFARE MARKET, BY APPLICATION, 2020–2022 (USD MILLION)
                                     TABLE 137 AUSTRALIA: DRONE WARFARE MARKET, BY APPLICATION, 2023–2028 (USD MILLION)
                                     TABLE 138 AUSTRALIA: DEFENSE PROGRAM MAPPING
             10.4.7 SOUTH KOREA
                        10.4.7.1 Surge in threats from neighboring countries to drive market
                                     TABLE 139 SOUTH KOREA: DRONE WARFARE MARKET, BY CAPABILITY, 2020–2022 (USD MILLION)
                                     TABLE 140 SOUTH KOREA: DRONE WARFARE MARKET, BY CAPABILITY, 2023–2028 (USD MILLION)
                                     TABLE 141 SOUTH KOREA: DRONE WARFARE MARKET, BY APPLICATION, 2020–2022 (USD MILLION)
                                     TABLE 142 SOUTH KOREA: DRONE WARFARE MARKET, BY APPLICATION, 2023–2028 (USD MILLION)
                                     TABLE 143 SOUTH KOREA: DEFENSE PROGRAM MAPPING
             10.4.8 REST OF ASIA PACIFIC
                        TABLE 144 REST OF ASIA PACIFIC: DRONE WARFARE MARKET, BY CAPABILITY, 2020–2022 (USD MILLION)
                        TABLE 145 REST OF ASIA PACIFIC: DRONE WARFARE MARKET, BY CAPABILITY, 2023–2028 (USD MILLION)
                        TABLE 146 REST OF ASIA PACIFIC: DRONE WARFARE MARKET, BY APPLICATION, 2020–2022 (USD MILLION)
                        TABLE 147 REST OF ASIA PACIFIC: DRONE WARFARE MARKET, BY APPLICATION, 2023–2028 (USD MILLION)
     10.5 MIDDLE EAST 
             10.5.1 RECESSION IMPACT ANALYSIS
             10.5.2 PESTLE ANALYSIS
                        FIGURE 43 MIDDLE EAST: DRONE WARFARE MARKET SNAPSHOT
                        TABLE 148 MIDDLE EAST: DRONE WARFARE MARKET, BY COUNTRY, 2020–2022 (USD MILLION)
                        TABLE 149 MIDDLE EAST: DRONE WARFARE MARKET, BY COUNTRY, 2023–2028 (USD MILLION)
                        TABLE 150 MIDDLE EAST: DRONE WARFARE MARKET, BY CAPABILITY, 2020–2022 (USD MILLION)
                        TABLE 151 MIDDLE EAST: DRONE WARFARE MARKET, BY CAPABILITY, 2023–2028 (USD MILLION)
                        TABLE 152 MIDDLE EAST: DRONE WARFARE MARKET, BY APPLICATION, 2020–2022 (USD MILLION)
                        TABLE 153 MIDDLE EAST: DRONE WARFARE MARKET, BY APPLICATION, 2023–2028 (USD MILLION)
                        TABLE 154 GCC: DRONE WARFARE MARKET, BY COUNTRY, 2020–2022 (USD MILLION)
                        TABLE 155 GCC: DRONE WARFARE MARKET, BY COUNTRY, 2023–2028 (USD MILLION)
             10.5.3 GCC
                        10.5.3.1 SAUDI ARABIA
                                     10.5.3.1.1 General Authority for Civil Aviation initiatives to drive market
                                                    TABLE 156 SAUDI ARABIA: DRONE WARFARE MARKET, BY CAPABILITY, 2020–2022 (USD MILLION)
                                                    TABLE 157 SAUDI ARABIA: DRONE WARFARE MARKET, BY CAPABILITY, 2023–2028 (USD MILLION)
                                                    TABLE 158 SAUDI ARABIA: DRONE WARFARE MARKET, BY APPLICATION, 2020–2022 (USD MILLION)
                                                    TABLE 159 SAUDI ARABIA: DRONE WARFARE MARKET, BY APPLICATION, 2023–2028 (USD MILLION)
                                                    TABLE 160 SAUDI ARABIA: DEFENSE PROGRAM MAPPING
                        10.5.3.2 UAE
                                     10.5.3.2.1 Increased innovations in artificial intelligence and swarm coordination to drive market
                                                    TABLE 161 UAE: DRONE WARFARE MARKET, BY CAPABILITY, 2020–2022 (USD MILLION)
                                                    TABLE 162 UAE: DRONE WARFARE MARKET, BY CAPABILITY, 2023–2028 (USD MILLION)
                                                    TABLE 163 UAE: DRONE WARFARE MARKET, BY APPLICATION, 2020–2022 (USD MILLION)
                                                    TABLE 164 UAE: DRONE WARFARE MARKET, BY APPLICATION, 2023–2028 (USD MILLION)
             10.5.4 ISRAEL
                        10.5.4.1 Growing upgrades in payloads and sensors to drive market
                                     TABLE 165 ISRAEL: DRONE WARFARE MARKET, BY CAPABILITY, 2020–2022 (USD MILLION)
                                     TABLE 166 ISRAEL: DRONE WARFARE MARKET, BY CAPABILITY, 2023–2028 (USD MILLION)
                                     TABLE 167 ISRAEL: DRONE WARFARE MARKET, BY APPLICATION, 2020–2022 (USD MILLION)
                                     TABLE 168 ISRAEL: DRONE WARFARE MARKET, BY APPLICATION, 2023–2028 (USD MILLION)
                                     TABLE 169 ISRAEL: DEFENSE PROGRAM MAPPING
             10.5.5 TURKEY
                        10.5.5.1 Rising deployment of unmanned aerial vehicles and their subsystems to drive market
                                     TABLE 170 TURKEY: DRONE WARFARE MARKET, BY CAPABILITY, 2020–2022 (USD MILLION)
                                     TABLE 171 TURKEY: DRONE WARFARE MARKET, BY CAPABILITY, 2023–2028 (USD MILLION)
                                     TABLE 172 TURKEY: DRONE WARFARE MARKET, BY APPLICATION, 2020–2022 (USD MILLION)
                                     TABLE 173 TURKEY: DRONE WARFARE MARKET, BY APPLICATION, 2023–2028 (USD MILLION)
                                     TABLE 174 TURKEY: DEFENSE PROGRAM MAPPING
             10.5.6 REST OF MIDDLE EAST
                        TABLE 175 REST OF MIDDLE EAST: DRONE WARFARE MARKET, BY CAPABILITY, 2020–2022 (USD MILLION)
                        TABLE 176 REST OF MIDDLE EAST: DRONE WARFARE MARKET, BY CAPABILITY, 2023–2028 (USD MILLION)
                        TABLE 177 REST OF MIDDLE EAST: DRONE WARFARE MARKET, BY APPLICATION, 2020–2022 (USD MILLION)
                        TABLE 178 REST OF MIDDLE EAST: DRONE WARFARE MARKET, BY APPLICATION, 2023–2028 (USD MILLION)
     10.6 LATIN AMERICA 
             10.6.1 RECESSION IMPACT ANALYSIS
             10.6.2 PESTLE ANALYSIS
                        FIGURE 44 LATIN AMERICA: DRONE WARFARE MARKET SNAPSHOT
                        TABLE 179 LATIN AMERICA: DRONE WARFARE MARKET, BY COUNTRY, 2020–2022 (USD MILLION)
                        TABLE 180 LATIN AMERICA: DRONE WARFARE MARKET, BY COUNTRY, 2023–2028 (USD MILLION)
                        TABLE 181 LATIN AMERICA: DRONE WARFARE MARKET, BY CAPABILITY, 2020–2022 (USD MILLION)
                        TABLE 182 LATIN AMERICA: DRONE WARFARE MARKET, BY CAPABILITY, 2023–2028 (USD MILLION)
                        TABLE 183 LATIN AMERICA: DRONE WARFARE MARKET, BY APPLICATION, 2020–2022 (USD MILLION)
                        TABLE 184 LATIN AMERICA: DRONE WARFARE MARKET, BY APPLICATION, 2023–2028 (USD MILLION)
             10.6.3 BRAZIL
                        10.6.3.1 Increasing participation in international initiatives and agreements to drive market
                                     TABLE 185 BRAZIL: DRONE WARFARE MARKET, BY CAPABILITY, 2020–2022 (USD MILLION)
                                     TABLE 186 BRAZIL: DRONE WARFARE MARKET, BY CAPABILITY, 2023–2028 (USD MILLION)
                                     TABLE 187 BRAZIL: DRONE WARFARE MARKET, BY APPLICATION, 2020–2022 (USD MILLION)
                                     TABLE 188 BRAZIL: DRONE WARFARE MARKET, BY APPLICATION, 2023–2028 (USD MILLION)
                                     TABLE 189 BRAZIL: DEFENSE PROGRAM MAPPING
             10.6.4 MEXICO
                        10.6.4.1 Growing use of drones in disaster management to drive market
                                     TABLE 190 MEXICO: DRONE WARFARE MARKET, BY CAPABILITY, 2020–2022 (USD MILLION)
                                     TABLE 191 MEXICO: DRONE WARFARE MARKET, BY CAPABILITY, 2023–2028 (USD MILLION)
                                     TABLE 192 MEXICO: DRONE WARFARE MARKET, BY APPLICATION, 2020–2022 (USD MILLION)
                                     TABLE 193 MEXICO: DRONE WARFARE MARKET, BY APPLICATION, 2023–2028 (USD MILLION)
     10.7 AFRICA 
             10.7.1 RECESSION IMPACT ANALYSIS
             10.7.2 PESTLE ANALYSIS
                        FIGURE 45 AFRICA: DRONE WARFARE MARKET SNAPSHOT
                        TABLE 194 AFRICA: DRONE WARFARE MARKET, BY REGION, 2020–2022 (USD MILLION)
                        TABLE 195 AFRICA: DRONE WARFARE MARKET, BY REGION, 2023–2028 (USD MILLION)
                        TABLE 196 AFRICA: DRONE WARFARE MARKET, BY CAPABILITY, 2020–2022 (USD MILLION)
                        TABLE 197 AFRICA: DRONE WARFARE MARKET, BY CAPABILITY, 2023–2028 (USD MILLION)
                        TABLE 198 AFRICA: DRONE WARFARE MARKET, BY APPLICATION, 2020–2022 (USD MILLION)
                        TABLE 199 AFRICA: DRONE WARFARE MARKET, BY APPLICATION, 2023–2028 (USD MILLION)
             10.7.3 SOUTH AFRICA
                        10.7.3.1 Increasing need to address unique geographical challenges to drive market
                                     TABLE 200 SOUTH AFRICA: DEFENSE PROGRAM MAPPING
             10.7.4 NIGERIA
                        10.7.4.1 Rising use of drones to address complex security challenges to drive market
                                     TABLE 201 NIGERIA: DEFENSE PROGRAM MAPPING
             10.7.5 REST OF AFRICA
 
11 COMPETITIVE LANDSCAPE (Page No. - 216)
     11.1 INTRODUCTION 
     11.2 COMPANY OVERVIEW 
     11.3 STRATEGIES OF KEY PLAYERS 
             TABLE 202 STRATEGIES OF KEY PLAYERS
     11.4 MARKET RANKING ANALYSIS 
     11.5 REVENUE ANALYSIS 
     11.6 MARKET SHARE ANALYSIS 
             TABLE 203 DEGREE OF COMPETITION
     11.7 COMPANY EVALUATION MATRIX 
             11.7.1 STARS
             11.7.2 EMERGING LEADERS
             11.7.3 PERVASIVE PLAYERS
             11.7.4 PARTICIPANTS
                        FIGURE 49 DRONE WARFARE MARKET: COMPANY EVALUATION MATRIX, 2022
             11.7.5 COMPANY FOOTPRINT
                        TABLE 204 DRONE WARFARE MARKET: COMPANY FOOTPRINT
                        TABLE 205 DRONE WARFARE MARKET: PLATFORM FOOTPRINT
                        TABLE 206 DRONE WARFARE MARKET: REGION FOOTPRINT
     11.8 STARTUP/SME EVALUATION MATRIX 
             11.8.1 PROGRESSIVE COMPANIES
             11.8.2 RESPONSIVE COMPANIES
             11.8.3 DYNAMIC COMPANIES
             11.8.4 STARTING BLOCKS
                        FIGURE 50 DRONE WARFARE MARKET: STARTUP/SME EVALUATION MATRIX, 2023
             11.8.5 COMPETITIVE BENCHMARKING
                        TABLE 207 DRONE WARFARE MARKET: KEY STARTUPS/SMES
                        TABLE 208 DRONE WARFARE MARKET: COMPETITIVE BENCHMARKING
     11.9 COMPANY VALUATION AND FINANCIAL METRICS 
             FIGURE 51 EV/EBITDA OF KEY VENDORS
     11.1 BRAND/PRODUCT COMPARISON 
             FIGURE 52 BRAND/PRODUCT COMPARISON
     11.11 COMPETITIVE SCENARIO 
             11.11.1 MARKET EVALUATION FRAMEWORK
             11.11.2 PRODUCT LAUNCHES
                        TABLE 209 DRONE WARFARE MARKET: PRODUCT LAUNCHES, APRIL 2020–AUGUST 2022
             11.11.3 DEALS
                        TABLE 210 DRONE WARFARE MARKET: DEALS, SEPTEMBER 2017–NOVEMBER 2023
             11.11.4 OTHER DEVELOPMENTS
                        TABLE 211 DRONE WARFARE MARKET: OTHER DEVELOPMENTS, APRIL 2020–SEPTEMBER 2023
 
12 COMPANY PROFILES (Page No. - 240)
     12.1 INTRODUCTION 
     12.2 KEY PLAYERS 
(Business Overview, Products Offered, Recent Developments, and MnM View (Key strengths/Right to Win, Strategic Choices Made, and Weaknesses and Competitive Threats))*  
             12.2.1 NORTHROP GRUMMAN
                        TABLE 212 NORTHROP GRUMMAN: COMPANY OVERVIEW
                        FIGURE 53 NORTHROP GRUMMAN: COMPANY SNAPSHOT
                        TABLE 213 NORTHROP GRUMMAN: PRODUCTS/SOLUTIONS/SERVICES OFFERED
                        TABLE 214 NORTHROP GRUMMAN: OTHER DEVELOPMENTS
             12.2.2 RAYTHEON TECHNOLOGIES CORPORATION
                        TABLE 215 RAYTHEON TECHNOLOGIES CORPORATION: COMPANY OVERVIEW
                        FIGURE 54 RAYTHEON TECHNOLOGIES CORPORATION: COMPANY SNAPSHOT
                        TABLE 216 RAYTHEON TECHNOLOGIES CORPORATION: PRODUCTS/SOLUTIONS/SERVICES OFFERED
                        TABLE 217 RAYTHEON TECHNOLOGIES CORPORATION: DEALS
             12.2.3 ISRAEL AEROSPACE INDUSTRIES LTD.
                        TABLE 218 ISRAEL AEROSPACE INDUSTRIES LTD.: COMPANY OVERVIEW
                        FIGURE 55 ISRAEL AEROSPACE INDUSTRIES LTD.: COMPANY SNAPSHOT
                        TABLE 219 ISRAEL AEROSPACE INDUSTRIES LTD.: PRODUCTS/SOLUTIONS/SERVICES OFFERED
                        TABLE 220 ISRAEL AEROSPACE INDUSTRIES LTD.: PRODUCT LAUNCHES
                        TABLE 221 ISRAEL AEROSPACE INDUSTRIES LTD.: DEALS
                        TABLE 222 ISRAEL AEROSPACE INDUSTRIES LTD.: OTHER DEVELOPMENTS
             12.2.4 GENERAL ATOMICS AERONAUTICAL SYSTEMS, INC.
                        TABLE 223 GENERAL ATOMICS AERONAUTICAL SYSTEMS, INC.: COMPANY OVERVIEW
                        TABLE 224 GENERAL ATOMICS AERONAUTICAL SYSTEMS, INC.: PRODUCTS/SOLUTIONS/ SERVICES OFFERED
                        TABLE 225 GENERAL ATOMICS AERONAUTICAL SYSTEMS, INC.: DEALS
                        TABLE 226 GENERAL ATOMICS AERONAUTICAL SYSTEMS, INC.: OTHER DEVELOPMENTS
             12.2.5 TELEDYNE FLIR LLC
                        TABLE 227 TELEDYNE FLIR LLC: COMPANY OVERVIEW
                        FIGURE 56 TELEDYNE FLIR LLC: COMPANY SNAPSHOT
                        TABLE 228 TELEDYNE FLIR LLC: PRODUCTS/SOLUTIONS/SERVICES OFFERED
                        TABLE 229 TELEDYNE FLIR LLC: PRODUCT LAUNCHES
                        TABLE 230 TELEDYNE FLIR LLC: DEALS
                        TABLE 231 TELEDYNE FLIR LLC: OTHER DEVELOPMENTS
             12.2.6 AEROVIRONMENT, INC.
                        TABLE 232 AEROVIRONMENT, INC.: COMPANY OVERVIEW
                        FIGURE 57 AEROVIRONMENT, INC.: COMPANY SNAPSHOT
                        TABLE 233 AEROVIRONMENT, INC.: PRODUCTS/SOLUTIONS/SERVICES OFFERED
                        TABLE 234 AEROVIRONMENT, INC.: PRODUCT LAUNCHES
                        TABLE 235 AEROVIRONMENT, INC.: DEALS
                        TABLE 236 AEROVIRONMENT, INC.: OTHER DEVELOPMENTS
             12.2.7 BOEING
                        TABLE 237 BOEING: COMPANY OVERVIEW
                        FIGURE 58 BOEING: COMPANY SNAPSHOT
                        TABLE 238 BOEING: PRODUCTS/SOLUTIONS/SERVICES OFFERED
                        TABLE 239 BOEING: PRODUCT LAUNCHES
                        TABLE 240 BOEING: OTHER DEVELOPMENTS
             12.2.8 AIRBUS
                        TABLE 241 AIRBUS: COMPANY OVERVIEW
                        FIGURE 59 AIRBUS: COMPANY SNAPSHOT
                        TABLE 242 AIRBUS: PRODUCTS/SOLUTIONS/SERVICES OFFERED
                        TABLE 243 AIRBUS: OTHER DEVELOPMENTS
             12.2.9 TEXTRON INC.
                        TABLE 244 TEXTRON INC.: COMPANY OVERVIEW
                        FIGURE 60 TEXTRON INC.: COMPANY SNAPSHOT
                        TABLE 245 TEXTRON INC.: PRODUCTS/SOLUTIONS/SERVICES OFFERED
                        TABLE 246 TEXTRON INC.: OTHER DEVELOPMENTS
             12.2.10 LOCKHEED MARTIN CORPORATION
                        TABLE 247 LOCKHEED MARTIN CORPORATION: COMPANY OVERVIEW
                        FIGURE 61 LOCKHEED MARTIN CORPORATION: COMPANY SNAPSHOT
                        TABLE 248 LOCKHEED MARTIN CORPORATION: PRODUCTS/SOLUTIONS/SERVICES OFFERED
                        TABLE 249 LOCKHEED MARTIN CORPORATION: OTHER DEVELOPMENTS
             12.2.11 ELBIT SYSTEMS LTD.
                        TABLE 250 ELBIT SYSTEMS LTD.: COMPANY OVERVIEW
                        FIGURE 62 ELBIT SYSTEMS LTD.: COMPANY SNAPSHOT
                        TABLE 251 ELBIT SYSTEMS LTD.: PRODUCTS/SOLUTIONS/SERVICES OFFERED
                        TABLE 252 ELBIT SYSTEMS LTD.: OTHER DEVELOPMENTS
             12.2.12 THALES
                        TABLE 253 THALES: COMPANY OVERVIEW
                        FIGURE 63 THALES: COMPANY SNAPSHOT
                        TABLE 254 THALES: PRODUCTS/SOLUTIONS/SERVICES OFFERED
                        TABLE 255 THALES: OTHER DEVELOPMENTS
             12.2.13 DRONEDEPLOY INC.
                        TABLE 256 DRONEDEPLOY INC.: COMPANY OVERVIEW
                        TABLE 257 DRONEDEPLOY INC.: PRODUCTS/SOLUTIONS/SERVICES OFFERED
                        TABLE 258 DRONEDEPLOY INC.: DEALS
             12.2.14 KRATOS DEFENSE & SECURITY SOLUTIONS, INC.
                        TABLE 259 KRATOS DEFENSE & SECURITY SOLUTIONS, INC.: COMPANY OVERVIEW
                        FIGURE 64 KRATOS DEFENSE & SECURITY SOLUTIONS, INC.: COMPANY SNAPSHOT
                        TABLE 260 KRATOS DEFENSE & SECURITY SOLUTIONS, INC.: PRODUCTS/SOLUTIONS/SERVICES OFFERED
                        TABLE 261 KRATOS DEFENSE & SECURITY SOLUTIONS, INC.: OTHER DEVELOPMENTS
             12.2.15 LEIDOS
                        TABLE 262 LEIDOS: COMPANY OVERVIEW
                        FIGURE 65 LEIDOS: COMPANY SNAPSHOT
                        TABLE 263 LEIDOS: PRODUCTS/SOLUTIONS/SERVICES OFFERED
                        TABLE 264 LEIDOS: OTHER DEVELOPMENTS
             12.2.16 AERONAUTICS
                        TABLE 265 AERONAUTICS: COMPANY OVERVIEW
                        TABLE 266 AERONAUTICS: PRODUCTS/SOLUTIONS/SERVICES OFFERED
                        TABLE 267 AERONAUTICS: OTHER DEVELOPMENTS
     12.3 OTHER PLAYERS 
             12.3.1 DYNETICS
                        TABLE 268 DYNETICS: COMPANY OVERVIEW
             12.3.2 ROBOTICAN CORPORATION
                        TABLE 269 ROBOTICAN CORPORATION: COMPANY OVERVIEW
             12.3.3 VOLANSI, INC.
                        TABLE 270 VOLANSI, INC.: COMPANY OVERVIEW
             12.3.4 GRIFFON AEROSPACE
                        TABLE 271 GRIFFON AEROSPACE: COMPANY OVERVIEW
             12.3.5 PLATFORM AEROSPACE
                        TABLE 272 PLATFORM AEROSPACE: COMPANY OVERVIEW
             12.3.6 SHIELD AI
                        TABLE 273 SHIELD AI: COMPANY OVERVIEW
             12.3.7 INSTANTEYE ROBOTICS
                        TABLE 274 INSTANTEYE ROBOTICS: COMPANY OVERVIEW
             12.3.8 ATHLON AVIA
                        TABLE 275 ATHLON AVIA: COMPANY OVERVIEW
             12.3.9 SILVERTONE UAV
                        TABLE 276 SILVERTONE UAV: COMPANY OVERVIEW
             12.3.10 BLUEBIRD AERO SYSTEMS LTD.
                        TABLE 277 BLUEBIRD AERO SYSTEMS LTD.: COMPANY OVERVIEW
             12.3.11 ANDURIL INDUSTRIES
                        TABLE 278 ANDURIL INDUSTRIES: COMPANY OVERVIEW
             12.3.12 SKYDIO INC.
                        TABLE 279 SKYDIO INC.: COMPANY OVERVIEW
             12.3.13 INDEMNIS, INC.
                        TABLE 280 INDEMNIS, INC.: COMPANY OVERVIEW
*Details on Business Overview, Products Offered, Recent Developments, and MnM View (Key strengths/Right to Win, Strategic Choices Made, and Weaknesses and Competitive Threats) might not be captured in case of unlisted companies.  
 
13 APPENDIX (Page No. - 307)
     13.1 DISCUSSION GUIDE 
     13.2 KNOWLEDGESTORE: MARKETSANDMARKETS’ SUBSCRIPTION PORTAL 
     13.3 CUSTOMIZATION OPTIONS 
     13.4 RELATED REPORTS 
     13.5 AUTHOR DETAILS 
 

This research study on the drones warfare market involved the extensive use of secondary sources, directories, and databases such as Hoovers, Bloomberg BusinessWeek, and Factiva to identify and collect information relevant to the market. Primary sources included industry experts, service providers, manufacturers, solution providers, technology developers, alliances, and organizations related to all segments of this industry's value chain. In-depth interviews with primary respondents, including key industry participants, subject matter experts, industry consultants, and C-level executives, were conducted to obtain and verify critical qualitative and quantitative information about the drone warfare market and assess the market's growth prospects.

Secondary Research

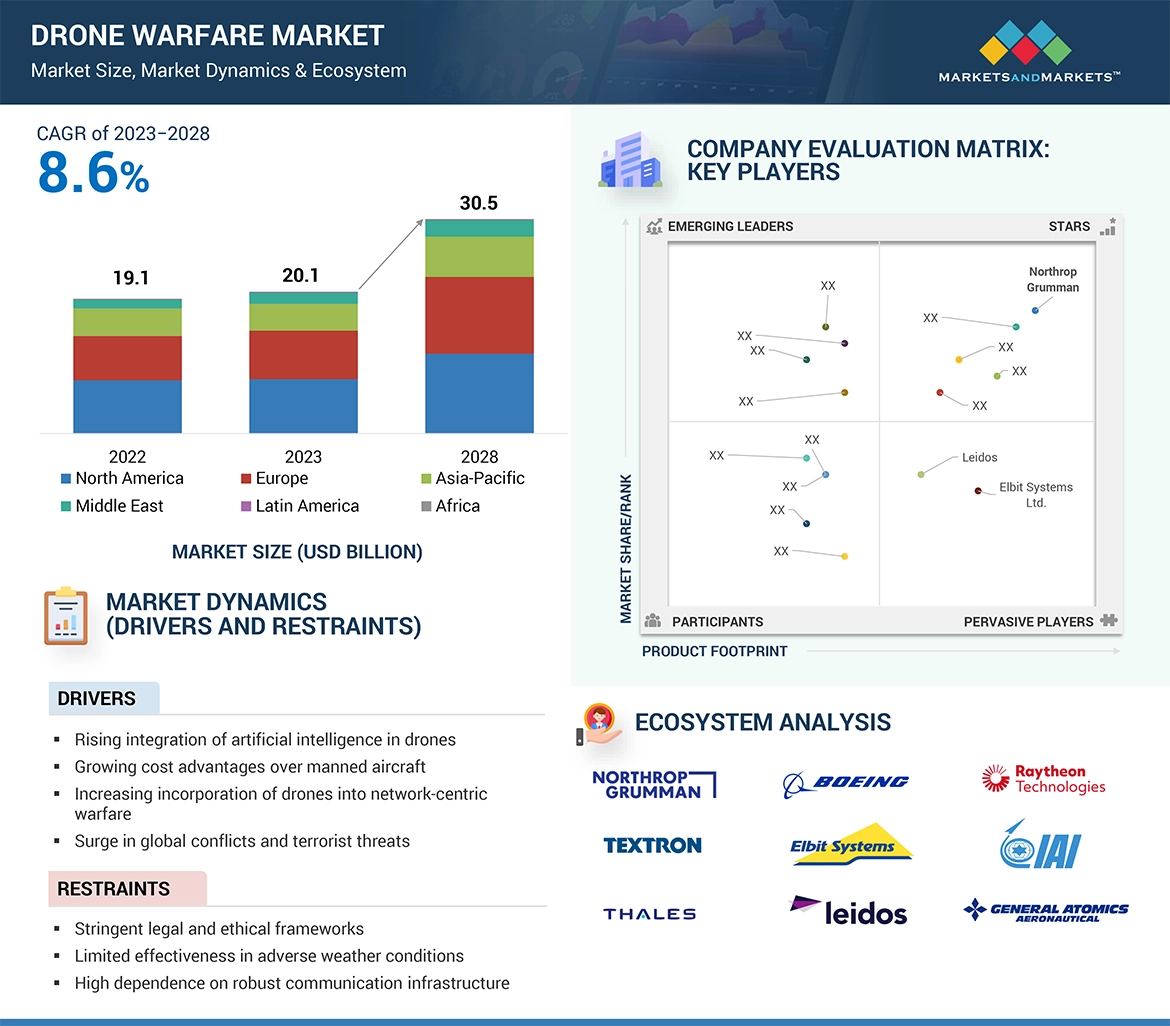
The ranking analysis of companies in the drone warfare market was determined using secondary data from paid and unpaid sources and by analyzing major companies’ product portfolios and service offerings. These companies were rated based on the performance and quality of their products. These data points were further validated by primary sources.

Secondary sources referred for this research study on the drone warfare market included financial statements of companies offering drone warfare capability, along with various trade, business, and professional associations, among others. The secondary data was collected and analyzed to arrive at the overall size of the drone warfare market, which was validated by primary respondents.

In addition, the secondary research was used to obtain key information about the industry’s value chain and supply chain to identify key players operating in the market; market classifications and segmentation according to offerings of major players; and industry trends related to the capability, application, mode of operation, and regions as well as key developments in the market.

Primary Research

Extensive primary research was conducted after obtaining information about the current scenario of the drone warfare market through secondary research. Several primary interviews were conducted with market experts from both the demand and supply sides across six regions: North America, Europe, Asia Pacific, the Middle East, Latin America, and Africa. This primary data was collected through questionnaires, emails, and telephonic interviews.

These interviews were conducted to gather insights such as market statistics, data on revenue collected from the products and services, market breakdowns, market size estimations, market size forecasting, and data triangulation. It also helped analyze the capability, application, and mode of operation segments of the market for six key regions.

Drone Warfare Market
 Size, and Share

To know about the assumptions considered for the study, download the pdf brochure

Market Size Estimation

  • Both top-down and bottom-up approaches were used to estimate and validate the size of the Drone warfare market.
  • Key players were identified through secondary research, and their market ranking was determined through primary and secondary research. This included a study of annual and financial reports of the top market players and extensive interviews of leaders, including CEOs, directors, and marketing executives.
  • All percentage shares, splits, and breakdowns were determined using secondary sources and verified through primary sources. All possible parameters that affect the markets covered in this research study were accounted for, viewed in extensive detail, verified through primary research, and analyzed to obtain the final quantitative and qualitative data. This data was consolidated, enhanced with detailed inputs, analyzed by MarketsandMarkets, and presented in this report.

Market size estimation methodology: Bottom-up Approach

Drone Warfare Market
 Size, and Bottom-up Approach

Market size estimation methodology: Top-down Approach

Drone Warfare Market
 Size, and Top-down Approach

Data triangulation

After arriving at the overall size of the drone warfare market from the market size estimation process explained above, the total market was split into several segments and subsegments. To complete the overall market engineering process and arrive at the exact statistics for various market segments and subsegments, data triangulation and market breakdown procedures explained below were implemented, wherever applicable. The data was triangulated by studying various factors and trends from both the demand and supply sides. Along with this, the market size was validated using both top-down and bottom-up approaches.

Market Definition

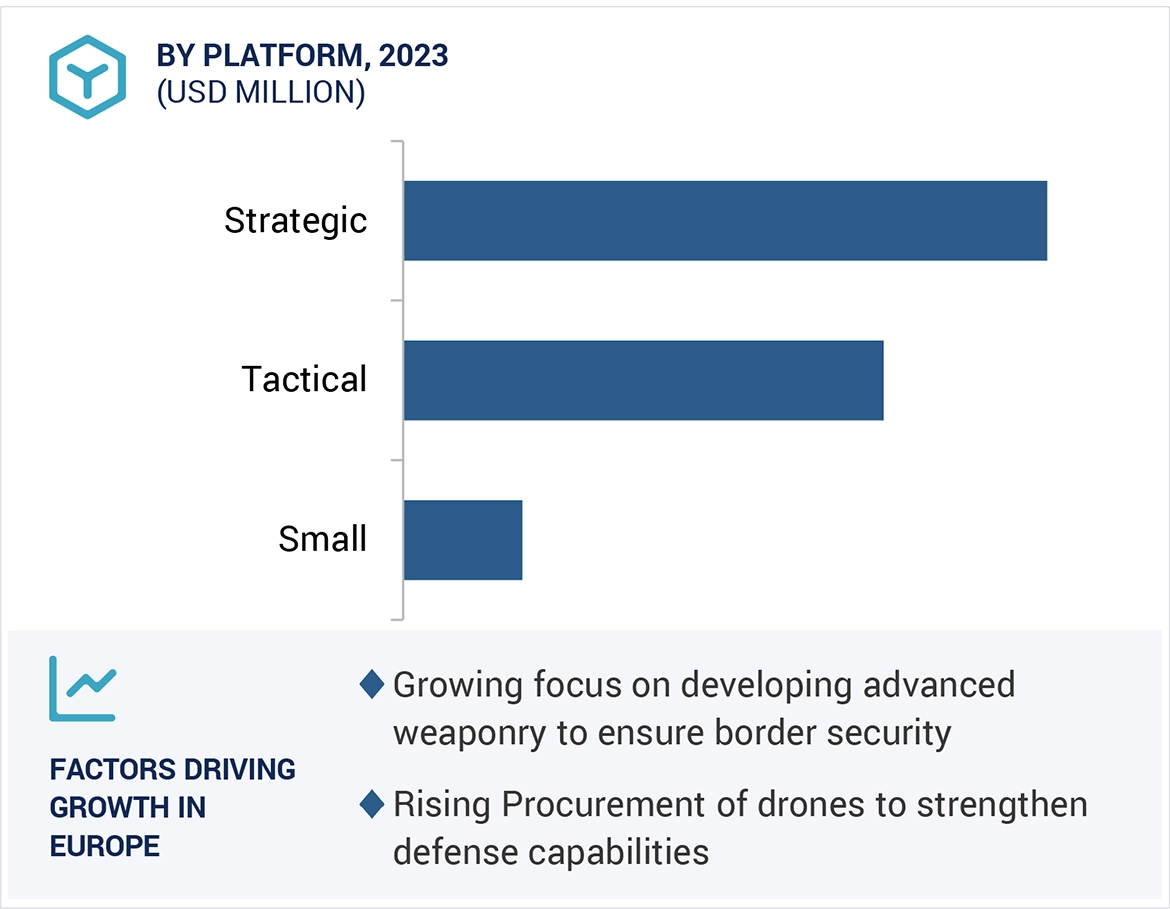
Drone warfare, also known as unmanned aerial vehicles, find application in diverse military roles like combat, intelligence, surveillance, reconnaissance (ISR), and delivery. The global armed forces increasingly embrace unmanned combat aerial vehicles (UCAVs), including lethal drones, combat drones, and target drones. These drones can be remotely piloted, optionally piloted, or fully autonomous, and they are categorized based on platforms such as small, strategic, and tactical. High Altitude Long Endurance (HALE) and Medium Altitude Long Endurance (MALE) drones, characterized by extended endurance, serve as fixed platforms capable of carrying substantial ISR payloads and precision munitions for combat.
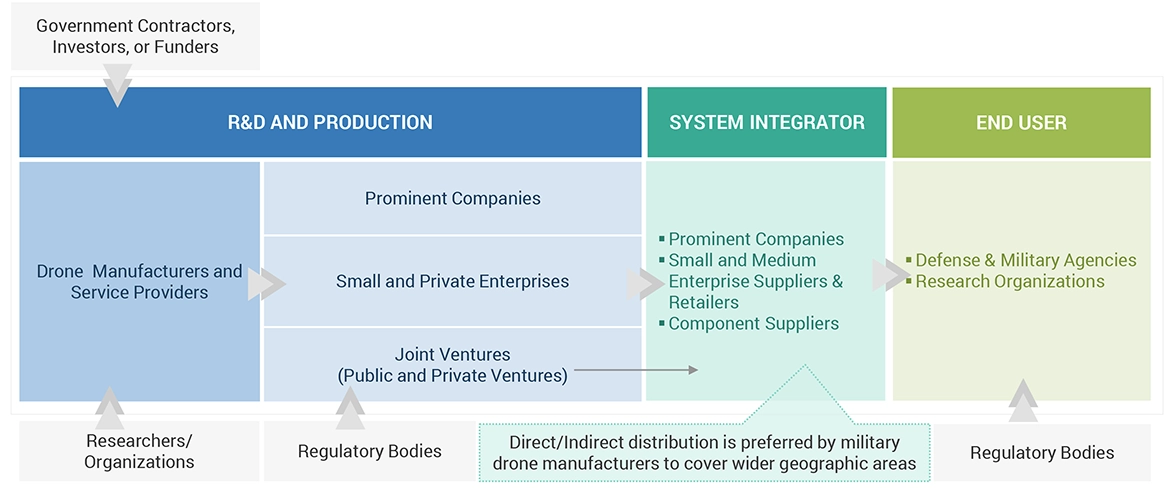
Stakeholders

Various stakeholders of the market are listed below:

  • Military Drone Manufacturers
  • Defence contractors
  • Original Equipment Manufacturers
  • Military Service Providers
  • Payload & Warhead Suppliers
  • Research Organizations
  • Investors and Venture Capitalists
  • Ministries of Defense
  • R&D Companies

Report Objectives

  • To define, describe, and forecast the size of the drone warfare market based on Capability, application, mode of operation and region from 2023 to 2028
  • To forecast the size of market segments with respect to five major regions, namely North America, Europe, Asia Pacific, the Middle East, Latin America and Africa.
  • To identify and analyze key drivers, restraints, opportunities, and challenges influencing the growth of the market
  • To strategically analyze micromarkets1  with respect to individual growth trends, prospects, and their contribution to the market
  • To analyze opportunities for stakeholders in the market by identifying key market trends
  • To analyze competitive developments such as contracts, acquisitions, expansions, agreements, joint ventures and partnerships, product developments, and research and development (R&D) activities in the market
  • To provide a detailed competitive landscape of the -market, in addition to an analysis of business and corporate strategies adopted by leading market players
  • To strategically profile key market players and comprehensively analyze their core competencies2

1 Micromarkets are referred to as the segments and subsegments of the Drone warfare markets considered in the scope of the report.

2 Core competencies of companies were captured in terms of their key developments and key strategies adopted to sustain their positions in the market.

Available customizations

Along with the market data, MarketsandMarkets offers customizations as per the specific needs of companies. The following customization options are available for the report:

Product Analysis

  • Product matrix, which gives a detailed comparison of the product portfolio of each company

Regional Analysis

  • Further breakdown of the market segments at the country level

Company Information

  • Detailed analysis and profiling of additional market players (up to 5)
Custom Market Research Services

We will customize the research for you, in case the report listed above does not meet with your exact requirements. Our custom research will comprehensively cover the business information you require to help you arrive at strategic and profitable business decisions.

Request Customization
Report Code
AS 8963
Published ON
Mar, 2024
Choose License Type
BUY NOW
  • SHARE
X
Request Customization
Speak to Analyst
Speak to Analyst
OR FACE-TO-FACE MEETING
PERSONALIZE THIS RESEARCH
  • Triangulate with your Own Data
  • Get Data as per your Format and Definition
  • Gain a Deeper Dive on a Specific Application, Geography, Customer or Competitor
  • Any level of Personalization
REQUEST A FREE CUSTOMIZATION
LET US HELP YOU!
  • What are the Known and Unknown Adjacencies Impacting the Drone Warfare by Cap
  • What will your New Revenue Sources be?
  • Who will be your Top Customer; what will make them switch?
  • Defend your Market Share or Win Competitors
  • Get a Scorecard for Target Partners
CUSTOMIZED WORKSHOP REQUEST
+1-888-600-6441
  • Call Us
  • +1-888-600-6441 (Corporate office hours)
  • +1-888-600-6441 (US/Can toll free)
  • +44-800-368-9399 (UK office hours)
CONNECT WITH US
ABOUT TRUST ONLINE
©2024 MarketsandMarkets Research Private Ltd. All rights reserved
DMCA.com Protection Status Website Feedback