Eco-Friendly Plasticizers Market

Report Code CH 9235
Published in Dec, 2024, By MarketsandMarkets™
Download PDF

Choose License Type

Buy Report Now Inquire Before Buying

Eco-Friendly Plasticizers Market by Product (Bio-based, Non-phthalate), Application (Packaging, Consumer Goods, Automotive & Transportation, Building & Construction, Textile, Agriculture & Horticulture), and Region - Global Forecast to 2030

Overview

The eco-friendly plasticizer market is projected to reach USD 2.62 billion by 2030 from USD 1.65 billion in 2024, at a CAGR of 6.7% during the forecast period. Advances in global environmental awareness and demand for safer, non-toxic alternatives to traditional plasticizers will fuel the eco-friendly plasticizers market. Industries are finding it prudent to shift from phthalate-based plasticizers as concerns over their health impacts are rising. Instead, eco-friendly plasticizers possessing lower toxicity and higher sustainability levels are required. Consumer goods stand to consume a greater share of the market with manufacturers increasingly adding bio-based and non-phthalate plasticizers to products ranging from toys to packaging materials. Improving consumer disposable income across the world also supports further growth in goods consumption, and hence their environmental-friendly version. Improving production processes and advanced biodegradable materials are also making environmental-friendly plasticizers increasingly attractive. Regulatory bodies are also doing their bit toward facilitation of these alternatives as it sets hurdles in using the harmful substances by enforcing stricter regulations. Thus, with more and more industries opting for sustainability and going hand-in-hand with environmental standards, the eco-friendly plasticizers market is set to witness robust growth during the next couple of years.

Eco-Friendly Plasticizers Market

Attractive Opportunities in the Eco-Friendly Plasticizers Market

Asia Pacific

Market growth in the Asia Pacific can be attributed to presence of a large and growing population, an increasing demand from end-use industries.

Rising environmental awareness and stringent regulations against harmful substances, particularly phthalates, are pushing industries to seek safer alternatives. As consumers and manufacturers alike prioritize sustainability, the demand for eco-friendly plasticizers is surging, particularly in applications such as packaging, automotive, and construction.

The growing demand for flexible PVC across various applications, such as packaging and construction, further fuels the need for eco-friendly plasticizers, which enhance product characteristics without compromising safety.

The eco-friendly plasticizers market in the Asia Pacific is expected to be USD 0.51 billion by 2030.

Issues associated due high production costs associated with advanced technologies required for manufacturing plasticizers can limit their competitiveness against conventional options.

Global Eco-Friendly Plasticizers Market Dynamics

DRIVER: Stringent norms & regulations to drive the market

The demand for bio-based plasticizers is increasingly on the rise due to growing regulatory concerns over phthalates and their potential health impacts on humans. The European Commission has published tough regulations aimed at banning certain phthalates, including di(2-ethylhexyl) phthalate (DEHP) and di-n-butyl phthalate (DBP), in products that come into contact with the human skin, especially concentrations above 0.1%. These chemicals are common in flexible plastics of many consumer products including childcare items and automotive interiors. The step toward phase-out is a giant step forward toward protecting consumers from these chemicals and environment. Similar steps have been initiated by regulatory agencies in the US, such as the FDA, which has recommended DEHP exposure limits for newborns through medical procedures. The U.S. However, the Environmental Protection Agency (EPA) launched an Action Plan in 2009 focused on eight specific phthalates under the Toxic Substances Control Act (TSCA), showing a concern on continuing health and safety aspects. Thereby, these regulations had to be met, and the plasticizer industry increasingly had to rely on safer alternatives from renewable feedstocks. Generally, bio-based plasticisers, such as epoxidized soybean oil, ESBO and citrate esters, have good safety profiles and performance properties. The market pressure from new regulatory policies, especially in Europe, has driven the trend towards bio-based plasticisers. This is also being complemented by customer trends seeking safer alternatives for their particular applications, bringing an enormous innovation and expansion opportunity for the plasticiser industry.

RESTRAINT: Higher price of non-phthalate plasticizers in comparison to phthalate plasticizers

Non-phthalate plasticizers are pricey in comparison to the phthalate plasticizers because of high prices of raw materials and the process of manufacturing. The raw materials for some non-phthalate plasticizers are quite expensive, so that the prices of non-phthalate plasticizers increase, like trimellitate anhydride for trimellitates and adipic acid, which is used in the production of plasticizers and lubricant components. 85% of produced adipic acid is turned into nyion.

More due to the increasing standard of living in developing countries like China and India, the demand for nylon has resulted in supplying adipic acid asymmetrically. As a consequence, the price of non-phthalate plasticizers has gone up. The production process of a non-phthalate plasticizer, 1,2-cyclohexane dicarboxylic acid, diisononyl ester (DINCH), is rather complicated. The production of this compound begins with the production of DINP, which It is further processed for the production of DINCH. All these factors have led to an increase in the price of non-phthalate plasticizers.


OPPORTUNITY: Growing awareness about the harmful effects associated with the use of phthalate plasticizers

Phthalate-based plasticizers are not chemically bound to vinyl and can leach, migrate, or evaporate into indoor air and concentrate in household dust. The widespread use of phthalates in building materials and consumer products has resulted in nearly universal contamination of people's bodies with certain phthalates, which have also been measured in breast milk, umbilical cord blood, and amniotic fluid. Ten years of biomonitoring data gathered by the US Centers for Disease Control and Prevention (CDC) shows near universal exposure to most phthalates in a representative sampling of Americans. Children are more exposed to phthalates than adults, as most of the toys contain phthalates. Many phthalates are hormone-disrupting chemicals that interfere with the production of the testosterone, which is necessary for proper development and function of the male reproductive organs. Interference with testosterone activity, especially early in life, can have irreversible effects on male reproduction. Phthalate exposure in humans has been linked to changes in sex hormone levels, altered development of genitals, and low sperm count and quality. Phthalates have also been linked with obesity, reduced female fertility, preterm birth and low birthweight, a worsening of allergy and asthma symptoms, and altered toddler behavior. Other phthalates, such as diisodecyl phthalate (DIDP), have been linked to other types of birth defects.

CHALLENGES: Poor performance and incompatibility of few non-phthalate plasticizers

Non-phthalate plasticizers could overcome the sustainability issues and environmental challenges posed by their production. However, it remains challenged by several factors, such as relatively poor performance. For instance, epoxidized soybean oil (ESBO) and epoxidized linseed oil (ELO) become incompatible with polymers at higher concentrations or show poor performance, which causes the PVC to break under stress. Various non-phthalate plasticizers have failed due to their incompatibility with the polymers and poor performance when compared to the phthalate plasticizers. Moreover, the use of bio-based materials for plasticization requires high ductility at room temperature so that there is no tolerance for the polymer tearing or cracking when subjected to stresses during package manufacturing or use. Few bio-based plasticizers impart properties that cause relatively poor performance of the polymers. The polymers can be subjected to break or tear under stress. Few bio-based polymers do not show good flexibility and durability properties in high temperatures and are not suitable for applications subjected to high temperatures.

Global Eco-Friendly Plasticizers Market Ecosystem Analysis

Prominent companies in this market include well-established, financially stable manufacturers of eco-friendly plasticizers. These companies have been operating in the market for several years and possess diversified product portfolios and strong global sales and marketing networks.

Eco-Friendly Plasticizers Market
 

Automotive & Transportation is the third largest segment in the eco-friendly plasticizers market.

Eco-friendly plasticizers have the third highest share in the Automotive & Transportation industry. Demand is increasing because of compliance with regulations as well as customer preference for non-environmentally hazardous products, hence this segment is growing. The non-toxic application, coupled with providing flexibility and durability, increases the usage in automotive interiors, wiring, and a number of other components. The global automotive industry is set to advance at a CAGR of around 5.5%, thereby fueling growth in this application area as well. As the auto industry tries to minimize their environmental footprint, use of bio-based plasticizers is going to continue on an upward trajectory, thus becoming a critical application in the eco-friendly plasticizers market.

Asia Pacific is estimated to be the fastest-growing region in the eco-friendly plasticizers market.

The Asia Pacific region is going to be a very high growth market for eco-friendly plasticizers, as it hosts tremendous industrialization coupled with increasing awareness of the environment and is supported by the government. Growth leaders in this aspect include countries like China and India, mainly due to their increasing manufacturing sectors and their demand for sustainable materials in various applications such as packaging, automotive, and consumer goods. Increasing consumer awareness towards environmental impacts of traditional plasticizers is further fueling demand for biodegradable and non-toxic alternatives. Additionally, strict regulatory bodies across the region in efforts to eliminate hazardous content within the manufacturing process also drive green plasticizer uptake. Asia Pacific is expected to see a strong market share in eco-friendly plasticizers due to investments in green technology to date.

HIGHEST CAGR MARKET IN 2024-2029
ASIA PACIFIC FASTEST GROWING MARKET IN THE REGION
Eco-Friendly Plasticizers Market

Recent Developments of Eco-Friendly Plasticizers Market

  • In October 2024, Evonik Qxeno, a subsidiary of Evonik Industries AG, is significantly increasing the production capacities for the INA-based plasticizers ELATUR CH (DINCH) and ELATUR DINCD at its Marl facility in Germany. The underlying motivation was the ever-increasing demand for these two products, which have already become an accepted standard for customers. The company is committed to the scientific evaluation of its products, including VESTINOL 9 (DINP), and ELATUR products from sustainable biobased or circular raw materials. This makes it a strategic focus of Evonik on sustainability and innovation in the plasticizer market.
  • In July 2024, Eastman Chemical Company is enabling sustainability in the plastics industry through its Renew plasticizers, which combine certified recycled content from advanced molecular recycling technologies. This conversion process turns the difficult-to-recycle plastic waste into high-quality building blocks, dealing with the problem that a whopping 83% of plastic is not recycled and is expected to triple by 2060. In a significant step, Eastman's plant in Kingsport, Tenn., has committed USD 2.25 billion towards recycling over 500 million pounds of plastics a year through the end of 2030. Renew plasticizers meet the food contact safety requirements of the U.S. and Europe. This will enable formulators to proclaim their sustainability message without sacrificing the quality of their products, therefore illustrating Eastman's approach to converting plastic waste into valuable resources for a more sustainable future.
  • In July 2024, Univar's decision to become Eastman's preferred distributor for plasticizers influences the chemical as well. These plasticizers enhance the flexibility and toughness of certain polymers and coatings. Univar Solutions LLC facilitates the sale of Eastman products in Mexico, which include sustainable options like Benzoflex 9-88 and Eastman 168TM SG.
  • In August 2024, BASF signed a Memorandum of Understanding (MoU) with UPC Technology Corporation to intensify its co-operation on plasticizer alcohols and catalysts. The main focus will be on the sustainable search for solutions to reduce carbon footprint through its production process and products.

Key Market Players

Want to explore hidden markets that can drive new revenue in Eco-Friendly Plasticizers Market?

Scope of the Report

Report Metric Details
Market size available for years 2022-2030
Base Year Considered 2023
Forecast period 2024-2030
Forecast units Value (USD Million) Volume (Kiloton)
Segments covered Product, Application, and Region
Geographies covered North America, Europe, Asia Pacific, South America and Middle East & Africa


Key Questions Addressed by the Report

What primary factor is propelling the growth of the eco-friendly plasticizer market?
The growing demand for sustainable and environmentally friendly products.
How is the eco-friendly plasticizer market segmented?
The eco-friendly plasticizer market is segmented into products, applications, and regions.
What are the major challenges in the eco-friendly plasticizers market?
Poor performance and incompatibility of a few non-phthalate plasticizers.
What are the major opportunities in the eco-friendly plasticizers market?
Growing awareness about the harmful effects of phthalate plasticizers and the emerging market for bio-based plasticizers.
Which region has the largest demand?
The Asia Pacific (APAC) region has the highest demand for eco-friendly plasticizers.
Who are the major manufacturers of eco-friendly plasticizers?
Major manufacturers include BASF (Germany), Eastman Chemical Company (US), Evonik Industries AG (Germany), Lanxess (Germany), Dow Chemical Company (US), DIC Corporation (Japan), Cargill, Incorporated (US), Arkema Group (France), LG Chem (South Korea), and Valtris Specialty Chemicals (US).


Personalize This Research

  • Triangulate with your Own Data
  • Get Data as per your Format and Definition
  • Gain a Deeper Dive on a Specific Application, Geography, Customer or Competitor
  • Any level of Personalization
Request A Free Customisation

Let Us Help You

  • What are the Known and Unknown Adjacencies Impacting the Eco-Friendly Plasticizers Market
  • What will your New Revenue Sources be?
  • Who will be your Top Customer; what will make them switch?
  • Defend your Market Share or Win Competitors
  • Get a Scorecard for Target Partners
Customized Workshop Request

Table of Contents

Exclusive indicates content/data unique to MarketsandMarkets and not available with any competitors.

TITLE
PAGE NO
INTRODUCTION
24
RESEARCH METHODOLOGY
28
EXECUTIVE SUMMARY
36
PREMIUM INSIGHTS
39
MARKET OVERVIEW
42
  • 5.1 INTRODUCTION
  • 5.2 MARKET DYNAMICS
    DRIVERS
    - Stringent norms & regulations
    - Growing automotive industry in Asia Pacific
    - Stringent regulations on use of phthalate plasticizers
    RESTRAINTS
    - Higher price of non-phthalate plasticizers compared to phthalate plasticizers
    OPPORTUNITIES
    - Growing awareness of harmful effects associated with use of phthalate plasticizers
    - Emerging market for bio-based plasticizers
    CHALLENGES
    - Poor performance and incompatibility of few non-phthalate plasticizers
  • 5.3 PORTER’S FIVE FORCES ANALYSIS
    THREAT OF NEW ENTRANTS
    THREAT OF SUBSTITUTES
    BARGAINING POWER OF SUPPLIERS
    BARGAINING POWER OF BUYERS
    INTENSITY OF COMPETITIVE RIVALRY
  • 5.4 KEY STAKEHOLDERS AND BUYING CRITERIA
    KEY STAKEHOLDERS IN BUYING PROCESS
    BUYING CRITERIA
  • 5.5 VALUE CHAIN ANALYSIS
    RAW MATERIAL SUPPLIERS
    MANUFACTURERS
    DISTRIBUTORS
    END USERS/CONSUMERS
  • 5.6 TRENDS & DISRUPTIONS IMPACTING CUSTOMER BUSINESS
  • 5.7 PRICING ANALYSIS
    INDICATIVE PRICING ANALYSIS, BY PRODUCT
  • 5.8 ECOSYSTEM ANALYSIS
  • 5.9 TECHNOLOGY ANALYSIS
    KEY TECHNOLOGIES
    - Bio-based plasticizer production technology
    - Non-phthalate plasticizer technology
    COMPLEMENTARY TECHNOLOGIES
    - Integration with biodegradable polymers
    - Collaboration with additive manufacturing
    - Synergy with recycling technologies
  • 5.10 TRADE ANALYSIS
    IMPORT SCENARIO (HS CODE 381220)
    EXPORT SCENARIO (HS CODE 381220)
  • 5.11 KEY CONFERENCES AND EVENTS
  • 5.12 REGULATORY LANDSCAPE
    ENVIRONMENTAL REGULATIONS
    - North America
    - Europe
    - Others
    REGULATORY BODIES, GOVERNMENT AGENCIES, AND OTHER ORGANIZATIONS
  • 5.13 MACROECONOMIC INDICATORS
    GLOBAL GDP TRENDS
    GLOBAL VEHICLE PRODUCTION STATISTICS
  • 5.14 INVESTMENT AND FUNDING SCENARIO
  • 5.15 CASE STUDY ANALYSIS
    CASE STUDY ON LUXURY VINYL TILE (LVT)
    CASE STUDY ON SCREEN-PRINTED APPAREL
    CASE STUDY ON INFLATABLE PVC TOYS
    CASE STUDY ON GARDEN HOSES
    CASE STUDY ON IV FLUID DELIVERY PRODUCTS
  • 5.16 PATENT ANALYSIS
    METHODOLOGY
    DOCUMENT TYPES
    INSIGHTS
    LEGAL STATUS OF PATENTS
    JURISDICTION ANALYSIS
    TOP APPLICANTS
  • 5.17 IMPACT OF AI/GEN AI
ECO-FRIENDLY PLASTICIZERS MARKET, BY PRODUCT
72
  • 6.1 INTRODUCTION
  • 6.2 BIO-BASED PLASTICIZERS
    PRODUCED FROM VEGETABLE RAW MATERIALS
    EPOXIDIZED SOYBEAN OIL (ESBO)
    CASTOR OIL
    CITRATE
    SUCCINIC ACID
    OTHER BIO-BASED PLASTICIZERS
  • 6.3 NON-PHTHALATE PLASTICIZERS
    INCREASED USE IN SENSITIVE APPLICATIONS TO DRIVE MARKET
    ADIPATES
    TRIMELLITATES
    BENZOATES
    EPOXIES
    OTHER NON-PHTHALATE PLASTICIZERS
ECO-FRIENDLY PLASTICIZERS MARKET, BY APPLICATION
81
  • 7.1 INTRODUCTION
  • 7.2 PACKAGING
    ABILITY TO IMPROVE FLEXIBILITY AND DURABILITY WHILE REDUCING RELIANCE ON HARMFUL CHEMICALS TO DRIVE MARKET
  • 7.3 CONSUMER GOODS
    CONSUMER PREFERENCE FOR GREENER AND SAFER PRODUCTS TO PROPEL MARKET
  • 7.4 AUTOMOTIVE & TRANSPORTATION
    NEED TO REDUCE CARBON FOOTPRINT TO SUPPORT MARKET GROWTH
  • 7.5 BUILDING & CONSTRUCTION
    ABILITY TO IMPROVE WORKABILITY AND LONGEVITY OF MATERIALS TO DRIVE MARKET
  • 7.6 TEXTILE
    ADOPTION OF NON-PHTHALATE ALTERNATIVES LED TO DECREASE IN VOC EMISSIONS DURING TEXTILE PRODUCTION PROCESSES
  • 7.7 AGRICULTURE & HORTICULTURE
    RISING DEMAND FOR SUSTAINABLE CROPS TO DRIVE MARKET
  • 7.8 OTHER APPLICATIONS
ECO-FRIENDLY PLASTICIZERS MARKET, BY REGION
88
  • 8.1 INTRODUCTION
  • 8.2 NORTH AMERICA
    US
    - Rising demand for bio-based packaging in food and consumer product industries to drive market
    CANADA
    - Stringent environmental regulations to propel market
    MEXICO
    - Increasing environmental awareness and regulatory initiatives to drive market
  • 8.3 ASIA PACIFIC
    CHINA
    - Increasing environmental awareness and stringent government regulations to drive market
    JAPAN
    - Rising consumer preference for sustainable products to support market growth
    INDIA
    - Growing population and increasing urbanization to propel market
    SOUTH KOREA
    - Technological advancements to drive market
    REST OF ASIA PACIFIC
  • 8.4 EUROPE
    GERMANY
    - Stringent regulations regarding use of traditional phthalate plasticizers to propel market
    FRANCE
    - Growing demand for eco-friendly plasticizers to support market growth
    SPAIN
    - Growing focus on green building practices to propel market
    UK
    - Rising consumer demand for sustainable packaging solutions to drive market
    ITALY
    - Increasing environmental awareness and regulatory pressures to drive market
    REST OF EUROPE
  • 8.5 SOUTH AMERICA
    BRAZIL
    - Rising environmental and health concerns to propel market
    ARGENTINA
    - Government initiatives to promote green procurement policies to drive market
    REST OF SOUTH AMERICA
  • 8.6 MIDDLE EAST & AFRICA
    GCC COUNTRIES
    - Saudi Arabia
    - UAE
    - Rest of GCC countries
    SOUTH AFRICA
    - Increasing awareness and demand for sustainable products to drive market
    REST OF MIDDLE EAST & AFRICA
COMPETITIVE LANDSCAPE
169
  • 9.1 OVERVIEW
  • 9.2 KEY PLAYER STRATEGIES/RIGHT TO WIN
  • 9.3 REVENUE ANALYSIS
  • 9.4 MARKET SHARE ANALYSIS
  • 9.5 COMPANY VALUATION AND FINANCIAL METRICS
    COMPANY VALUATION
    FINANCIAL METRICS
  • 9.6 BRAND/PRODUCTION COMPARISON
  • 9.7 COMPANY EVALUATION MATRIX: KEY PLAYERS, 2023
    STARS
    EMERGING LEADERS
    PERVASIVE PLAYERS
    PARTICIPANTS
    COMPANY FOOTPRINT: KEY PLAYERS, 2023
    - Company footprint
    - Product footprint
    - Application footprint
    - Region footprint
  • 9.8 COMPANY EVALUATION MATRIX: STARTUPS/SMES, 2023
    PROGRESSIVE COMPANIES
    RESPONSIVE COMPANIES
    DYNAMIC COMPANIES
    STARTING BLOCKS
    COMPETITIVE BENCHMARKING
    - Detailed list of key startups/SMEs
    - Competitive benchmarking of key startups/SMEs
  • 9.9 COMPETITIVE SCENARIO
    PRODUCT LAUNCHES
    DEALS
    EXPANSIONS
COMPANY PROFILES
195
  • 10.1 KEY PLAYERS
    BASF
    - Business overview
    - Products offered
    - Recent developments
    - MnM view
    EASTMAN CHEMICAL COMPANY
    - Business overview
    - Products offered
    - Recent developments
    - MnM view
    EVONIK INDUSTRIES AG
    - Business overview
    - Products offered
    - Recent developments
    - MnM view
    LANXESS
    - Business overview
    - Products offered
    - Recent developments
    - MnM view
    THE DOW CHEMICAL COMPANY
    - Business overview
    - Products Offered
    - MnM view
    DIC CORPORATION
    - Business overview
    - Products offered
    - MnM view
    CARGILL, INCORPORATED
    - Business overview
    - Products offered
    - Recent developments
    - MnM view
    ARKEMA
    - Business overview
    - Products offered
    - Recent developments
    - MnM view
    LG CHEM
    - Business overview
    - Products offered
    - MnM view
    VALTRIS SPECIALTY CHEMICALS
    - Business overview
    - Products offered
    - MnM view
  • 10.2 OTHER PLAYERS
    PERSTORP
    AVIENT CORPORATION
    EMERY OLEOCHEMICALS
    MATRÌCA S.P.A.
    AURORIUM
    NAYAKEM ORGANICS PVT. LTD.
    ROQUETTE FRÈRES
    HANWHA CORPORATION
    UPC TECHNOLOGY CORPORATION
    SHANDONG NOVISTA CHEMICALS CO., LTD.
    SANYO CHEMICAL INDUSTRIES, LTD.
    ACS TECHNICAL PRODUCTS
    JUNGBUNZLAUER SUISSE AG
    K-TECH (INDIA) LIMITED
    TECNOSINTESI S.P.A.
APPENDIX
249
  • 11.1 DISCUSSION GUIDE
  • 11.2 KNOWLEDGESTORE: MARKETSANDMARKETS’ SUBSCRIPTION PORTAL
  • 11.3 CUSTOMIZATION OPTIONS
  • 11.4 RELATED REPORTS
  • 11.5 AUTHOR DETAILS
LIST OF TABLES
 
  • TABLE 1 ECO-FRIENDLY PLASTICIZERS MARKET: INCLUSIONS AND EXCLUSIONS OF STUDY
  • TABLE 2 VEHICLE PRODUCTION, BY COUNTRY, 2021–2023 (UNITS)
  • TABLE 3 REGULATIONS FOR PHTHALATE PLASTICIZERS
  • TABLE 4 ECO-FRIENDLY PLASTICIZERS MARKET: PORTER’S FIVE FORCES ANALYSIS
  • TABLE 5 INFLUENCE OF STAKEHOLDERS ON BUYING PROCESS, BY APPLICATION
  • TABLE 6 KEY BUYING CRITERIA FOR ECO-FRIENDLY PLASTICIZERS, BY APPLICATION
  • TABLE 7 INDICATIVE PRICING ANALYSIS, BY PRODUCT, 2023 (USD/KG)
  • TABLE 8 ECO-FRIENDLY PLASTICIZERS MARKET: ROLE IN ECOSYSTEM
  • TABLE 9 ECO-FRIENDLY PLASTICIZERS MARKET: KEY CONFERENCES AND EVENTS, 2024–2025
  • TABLE 10 NORTH AMERICA: REGULATORY BODIES, GOVERNMENT AGENCIES, AND OTHER ORGANIZATIONS
  • TABLE 11 EUROPE: REGULATORY BODIES, GOVERNMENT AGENCIES, AND OTHER ORGANIZATIONS
  • TABLE 12 ASIA PACIFIC: REGULATORY BODIES, GOVERNMENT AGENCIES, AND OTHER ORGANIZATIONS
  • TABLE 13 TRENDS OF PER CAPITA GDP, BY COUNTRY, 2020–2023 (USD)
  • TABLE 14 GDP GROWTH, BY COUNTRY, 2024–2027 (USD)
  • TABLE 15 VEHICLE PRODUCTION STATISTICS, BY COUNTRY, 2021–2023 (UNITS)
  • TABLE 16 ECO-FRIENDLY PLASTICIZERS MARKET, BY PRODUCT, 2022–2024 (USD MILLION)
  • TABLE 17 ECO-FRIENDLY PLASTICIZERS MARKET, BY PRODUCT, 2025–2030 (USD MILLION)
  • TABLE 18 ECO-FRIENDLY PLASTICIZERS MARKET, BY PRODUCT, 2022–2024 (KILOTON)
  • TABLE 19 ECO-FRIENDLY PLASTICIZERS MARKET, BY PRODUCT, 2025–2030 (KILOTON)
  • TABLE 20 ECO-FRIENDLY PLASTICIZERS MARKET, BY APPLICATION, 2022–2024 (USD MILLION)
  • TABLE 21 ECO-FRIENDLY PLASTICIZERS MARKET, BY APPLICATION, 2025–2030 (USD MILLION)
  • TABLE 22 ECO-FRIENDLY PLASTICIZERS MARKET, BY APPLICATION, 2022–2024 (KILOTON)
  • TABLE 23 ECO-FRIENDLY PLASTICIZERS MARKET, BY APPLICATION, 2025–2030 (KILOTON)
  • TABLE 24 ECO-FRIENDLY PLASTICIZERS MARKET, BY REGION, 2022–2024 (USD MILLION)
  • TABLE 25 ECO-FRIENDLY PLASTICIZERS MARKET, BY REGION, 2025–2030 (USD MILLION)
  • TABLE 26 ECO-FRIENDLY PLASTICIZERS MARKET, BY REGION, 2022–2024 (KILOTON)
  • TABLE 27 ECO-FRIENDLY PLASTICIZERS MARKET, BY REGION, 2025–2030 (KILOTON)
  • TABLE 28 NORTH AMERICA: ECO-FRIENDLY PLASTICIZERS MARKET, BY COUNTRY, 2022–2024 (USD MILLION)
  • TABLE 29 NORTH AMERICA: ECO-FRIENDLY PLASTICIZERS MARKET, BY COUNTRY, 2025–2030 (USD MILLION)
  • TABLE 30 NORTH AMERICA: ECO-FRIENDLY PLASTICIZERS MARKET, BY COUNTRY, 2022–2024 (KILOTON)
  • TABLE 31 NORTH AMERICA: ECO-FRIENDLY PLASTICIZERS MARKET, BY COUNTRY, 2025–2030 (KILOTON)
  • TABLE 32 NORTH AMERICA: ECO-FRIENDLY PLASTICIZERS MARKET, BY PRODUCT, 2022–2024 (USD MILLION)
  • TABLE 33 NORTH AMERICA: ECO-FRIENDLY PLASTICIZERS MARKET, BY PRODUCT, 2025–2030 (USD MILLION)
  • TABLE 34 NORTH AMERICA: ECO-FRIENDLY PLASTICIZERS MARKET, BY PRODUCT, 2022–2024 (KILOTON)
  • TABLE 35 NORTH AMERICA: ECO-FRIENDLY PLASTICIZERS MARKET, BY PRODUCT, 2025–2030 (KILOTON)
  • TABLE 36 NORTH AMERICA: ECO-FRIENDLY PLASTICIZERS MARKET, BY APPLICATION, 2022–2024 (USD MILLION)
  • TABLE 37 NORTH AMERICA: ECO-FRIENDLY PLASTICIZERS MARKET, BY APPLICATION, 2025–2030 (USD MILLION)
  • TABLE 38 NORTH AMERICA: ECO-FRIENDLY PLASTICIZERS MARKET, BY APPLICATION, 2022–2024 (KILOTON)
  • TABLE 39 NORTH AMERICA: ECO-FRIENDLY PLASTICIZERS MARKET, BY APPLICATION, 2025–2030 (KILOTON)
  • TABLE 40 US: ECO-FRIENDLY PLASTICIZERS MARKET, BY APPLICATION, 2022–2024 (USD MILLION)
  • TABLE 41 US: ECO-FRIENDLY PLASTICIZERS MARKET, BY APPLICATION, 2025–2030 (USD MILLION)
  • TABLE 42 US: ECO-FRIENDLY PLASTICIZERS MARKET, BY APPLICATION, 2022–2024 (KILOTON)
  • TABLE 43 US: ECO-FRIENDLY PLASTICIZERS MARKET, BY APPLICATION, 2025–2030 (KILOTON)
  • TABLE 44 CANADA: ECO-FRIENDLY PLASTICIZERS MARKET, BY APPLICATION, 2022–2024 (USD MILLION)
  • TABLE 45 CANADA: ECO-FRIENDLY PLASTICIZERS MARKET, BY APPLICATION, 2025–2030 (USD MILLION)
  • TABLE 46 CANADA: ECO-FRIENDLY PLASTICIZERS MARKET, BY APPLICATION, 2022–2024 (KILOTON)
  • TABLE 47 CANADA: ECO-FRIENDLY PLASTICIZERS MARKET, BY APPLICATION, 2025–2030 (KILOTON)
  • TABLE 48 MEXICO: ECO-FRIENDLY PLASTICIZERS MARKET, BY APPLICATION, 2022–2024 (USD MILLION)
  • TABLE 49 MEXICO: ECO-FRIENDLY PLASTICIZERS MARKET, BY APPLICATION, 2025–2030 (USD MILLION)
  • TABLE 50 MEXICO: ECO-FRIENDLY PLASTICIZERS MARKET, BY APPLICATION, 2022–2024 (KILOTON)
  • TABLE 51 MEXICO: ECO-FRIENDLY PLASTICIZERS MARKET, BY APPLICATION, 2025–2030 (KILOTON)
  • TABLE 52 ASIA PACIFIC: ECO-FRIENDLY PLASTICIZERS MARKET, BY COUNTRY, 2022–2024 (USD MILLION)
  • TABLE 53 ASIA PACIFIC: ECO-FRIENDLY PLASTICIZERS MARKET, BY COUNTRY, 2025–2030 (USD MILLION)
  • TABLE 54 ASIA PACIFIC: ECO-FRIENDLY PLASTICIZERS MARKET, BY COUNTRY, 2022–2024 (KILOTON)
  • TABLE 55 ASIA PACIFIC: ECO-FRIENDLY PLASTICIZERS MARKET, BY COUNTRY, 2025–2030 (KILOTON)
  • TABLE 56 ASIA PACIFIC: ECO-FRIENDLY PLASTICIZERS MARKET, BY PRODUCT, 2022–2024 (USD MILLION)
  • TABLE 57 ASIA PACIFIC: ECO-FRIENDLY PLASTICIZERS MARKET, BY PRODUCT, 2025–2030 (USD MILLION)
  • TABLE 58 ASIA PACIFIC: ECO-FRIENDLY PLASTICIZERS MARKET, BY PRODUCT, 2022–2024 (KILOTON)
  • TABLE 59 ASIA PACIFIC: ECO-FRIENDLY PLASTICIZERS MARKET, BY PRODUCT, 2025–2030 (KILOTON)
  • TABLE 60 ASIA PACIFIC: ECO-FRIENDLY PLASTICIZERS MARKET, BY APPLICATION, 2022–2024 (USD MILLION)
  • TABLE 61 ASIA PACIFIC: ECO-FRIENDLY PLASTICIZERS MARKET, BY APPLICATION, 2025–2030 (USD MILLION)
  • TABLE 62 ASIA PACIFIC: ECO-FRIENDLY PLASTICIZERS MARKET, BY APPLICATION, 2022–2024 (KILOTON)
  • TABLE 63 ASIA PACIFIC: ECO-FRIENDLY PLASTICIZERS MARKET, BY APPLICATION, 2025–2030 (KILOTON)
  • TABLE 64 CHINA: ECO-FRIENDLY PLASTICIZERS MARKET, BY APPLICATION, 2022–2024 (USD MILLION)
  • TABLE 65 CHINA: ECO-FRIENDLY PLASTICIZERS MARKET, BY APPLICATION, 2025–2030 (USD MILLION)
  • TABLE 66 CHINA: ECO-FRIENDLY PLASTICIZERS MARKET, BY APPLICATION, 2022–2024 (KILOTON)
  • TABLE 67 CHINA: ECO-FRIENDLY PLASTICIZERS MARKET, BY APPLICATION, 2025–2030 (KILOTON)
  • TABLE 68 JAPAN: ECO-FRIENDLY PLASTICIZERS MARKET, BY APPLICATION, 2022–2024 (USD MILLION)
  • TABLE 69 JAPAN: ECO-FRIENDLY PLASTICIZERS MARKET, BY APPLICATION, 2025–2030 (USD MILLION)
  • TABLE 70 JAPAN: ECO-FRIENDLY PLASTICIZERS MARKET, BY APPLICATION, 2022–2024 (KILOTON)
  • TABLE 71 JAPAN: ECO-FRIENDLY PLASTICIZERS MARKET, BY APPLICATION, 2025–2030 (KILOTON)
  • TABLE 72 INDIA: ECO-FRIENDLY PLASTICIZERS MARKET, BY APPLICATION, 2022–2024 (USD MILLION)
  • TABLE 73 INDIA: ECO-FRIENDLY PLASTICIZERS MARKET, BY APPLICATION, 2025–2030 (USD MILLION)
  • TABLE 74 INDIA: ECO-FRIENDLY PLASTICIZERS MARKET, BY APPLICATION, 2022–2024 (KILOTON)
  • TABLE 75 INDIA: ECO-FRIENDLY PLASTICIZERS MARKET, BY APPLICATION, 2025–2030 (KILOTON)
  • TABLE 76 SOUTH KOREA: ECO-FRIENDLY PLASTICIZERS MARKET, BY APPLICATION, 2022–2024 (USD MILLION)
  • TABLE 77 SOUTH KOREA: ECO-FRIENDLY PLASTICIZERS MARKET, BY APPLICATION, 2025–2030 (USD MILLION)
  • TABLE 78 SOUTH KOREA: ECO-FRIENDLY PLASTICIZERS MARKET, BY APPLICATION, 2022–2024 (KILOTON)
  • TABLE 79 SOUTH KOREA: ECO-FRIENDLY PLASTICIZERS MARKET, BY APPLICATION, 2025–2030 (KILOTON)
  • TABLE 80 REST OF ASIA PACIFIC: ECO-FRIENDLY PLASTICIZERS MARKET, BY APPLICATION, 2022–2024 (USD MILLION)
  • TABLE 81 REST OF ASIA PACIFIC: ECO-FRIENDLY PLASTICIZERS MARKET, BY APPLICATION, 2025–2030 (USD MILLION)
  • TABLE 82 REST OF ASIA PACIFIC: ECO-FRIENDLY PLASTICIZERS MARKET, BY APPLICATION, 2022–2024 (KILOTON)
  • TABLE 83 REST OF ASIA PACIFIC: ECO-FRIENDLY PLASTICIZERS MARKET, BY APPLICATION, 2025–2030 (KILOTON)
  • TABLE 84 EUROPE: ECO-FRIENDLY PLASTICIZERS MARKET, BY COUNTRY, 2022–2024 (USD MILLION)
  • TABLE 85 EUROPE: ECO-FRIENDLY PLASTICIZERS MARKET, BY COUNTRY, 2025–2030 (USD MILLION)
  • TABLE 86 EUROPE: ECO-FRIENDLY PLASTICIZERS MARKET, BY COUNTRY, 2022–2024 (KILOTON)
  • TABLE 87 EUROPE: ECO-FRIENDLY PLASTICIZERS MARKET, BY COUNTRY, 2025–2030 (KILOTON)
  • TABLE 88 EUROPE: ECO-FRIENDLY PLASTICIZERS MARKET, BY PRODUCT, 2022–2024 (USD MILLION)
  • TABLE 89 EUROPE: ECO-FRIENDLY PLASTICIZERS MARKET, BY PRODUCT, 2025–2030 (USD MILLION)
  • TABLE 90 EUROPE: ECO-FRIENDLY PLASTICIZERS MARKET, BY PRODUCT, 2022–2024 (KILOTON)
  • TABLE 91 EUROPE: ECO-FRIENDLY PLASTICIZERS MARKET, BY PRODUCT, 2025–2030 (KILOTON)
  • TABLE 92 EUROPE: ECO-FRIENDLY PLASTICIZERS MARKET, BY APPLICATION, 2022–2024 (USD MILLION)
  • TABLE 93 EUROPE: ECO-FRIENDLY PLASTICIZERS MARKET, BY APPLICATION, 2025–2030 (USD MILLION)
  • TABLE 94 EUROPE: ECO-FRIENDLY PLASTICIZERS MARKET, BY APPLICATION, 2022–2024 (KILOTON)
  • TABLE 95 EUROPE: ECO-FRIENDLY PLASTICIZERS MARKET, BY APPLICATION, 2025–2030 (KILOTON)
  • TABLE 96 GERMANY: ECO-FRIENDLY PLASTICIZERS MARKET, BY APPLICATION, 2022–2024 (USD MILLION)
  • TABLE 97 GERMANY: ECO-FRIENDLY PLASTICIZERS MARKET, BY APPLICATION, 2025–2030 (USD MILLION)
  • TABLE 98 GERMANY: ECO-FRIENDLY PLASTICIZERS MARKET, BY APPLICATION, 2022–2024 (KILOTON)
  • TABLE 99 GERMANY: ECO-FRIENDLY PLASTICIZERS MARKET, BY APPLICATION, 2025–2030 (KILOTON)
  • TABLE 100 FRANCE: ECO-FRIENDLY PLASTICIZERS MARKET, BY APPLICATION, 2022–2024 (USD MILLION)
  • TABLE 101 FRANCE: ECO-FRIENDLY PLASTICIZERS MARKET, BY APPLICATION, 2025–2030 (USD MILLION)
  • TABLE 102 FRANCE: ECO-FRIENDLY PLASTICIZERS MARKET, BY APPLICATION, 2022–2024 (KILOTON)
  • TABLE 103 FRANCE: ECO-FRIENDLY PLASTICIZERS MARKET, BY APPLICATION, 2025–2030 (KILOTON)
  • TABLE 104 SPAIN: ECO-FRIENDLY PLASTICIZERS MARKET, BY APPLICATION, 2022–2024 (USD MILLION)
  • TABLE 105 SPAIN: ECO-FRIENDLY PLASTICIZERS MARKET, BY APPLICATION, 2025–2030 (USD MILLION)
  • TABLE 106 SPAIN: ECO-FRIENDLY PLASTICIZERS MARKET, BY APPLICATION, 2022–2024 (KILOTON)
  • TABLE 107 SPAIN: ECO-FRIENDLY PLASTICIZERS MARKET, BY APPLICATION, 2025–2030 (KILOTON)
  • TABLE 108 UK: ECO-FRIENDLY PLASTICIZERS MARKET, BY APPLICATION, 2022–2024 (USD MILLION)
  • TABLE 109 UK: ECO-FRIENDLY PLASTICIZERS MARKET, BY APPLICATION, 2025–2030 (USD MILLION)
  • TABLE 110 UK: ECO-FRIENDLY PLASTICIZERS MARKET, BY APPLICATION, 2022–2024 (KILOTON)
  • TABLE 111 UK: ECO-FRIENDLY PLASTICIZERS MARKET, BY APPLICATION, 2025–2030 (KILOTON)
  • TABLE 112 ITALY: ECO-FRIENDLY PLASTICIZERS MARKET, BY APPLICATION, 2022–2024 (USD MILLION)
  • TABLE 113 ITALY: ECO-FRIENDLY PLASTICIZERS MARKET, BY APPLICATION, 2025–2030 (USD MILLION)
  • TABLE 114 ITALY: ECO-FRIENDLY PLASTICIZERS MARKET, BY APPLICATION, 2022–2024 (KILOTON)
  • TABLE 115 ITALY: ECO-FRIENDLY PLASTICIZERS MARKET, BY APPLICATION, 2025–2030 (KILOTON)
  • TABLE 116 REST OF EUROPE: ECO-FRIENDLY PLASTICIZERS MARKET, BY APPLICATION, 2022–2024 (USD MILLION)
  • TABLE 117 REST OF EUROPE: ECO-FRIENDLY PLASTICIZERS MARKET, BY APPLICATION, 2025–2030 (USD MILLION)
  • TABLE 118 REST OF EUROPE: ECO-FRIENDLY PLASTICIZERS MARKET, BY APPLICATION, 2022–2024 (KILOTON)
  • TABLE 119 REST OF EUROPE: ECO-FRIENDLY PLASTICIZERS MARKET, BY APPLICATION, 2025–2030 (KILOTON)
  • TABLE 120 SOUTH AMERICA: ECO-FRIENDLY PLASTICIZERS MARKET, BY COUNTRY, 2022–2024 (USD MILLION)
  • TABLE 121 SOUTH AMERICA: ECO-FRIENDLY PLASTICIZERS MARKET, BY COUNTRY, 2025–2030 (USD MILLION)
  • TABLE 122 SOUTH AMERICA: ECO-FRIENDLY PLASTICIZERS MARKET, BY COUNTRY, 2022–2024 (KILOTON)
  • TABLE 123 SOUTH AMERICA: ECO-FRIENDLY PLASTICIZERS MARKET, BY COUNTRY, 2025–2030 (KILOTON)
  • TABLE 124 SOUTH AMERICA: ECO-FRIENDLY PLASTICIZERS MARKET, BY PRODUCT, 2022–2024 (USD MILLION)
  • TABLE 125 SOUTH AMERICA: ECO-FRIENDLY PLASTICIZERS MARKET, BY PRODUCT, 2025–2030 (USD MILLION)
  • TABLE 126 SOUTH AMERICA: ECO-FRIENDLY PLASTICIZERS MARKET, BY PRODUCT, 2022–2024 (KILOTON)
  • TABLE 127 SOUTH AMERICA: ECO-FRIENDLY PLASTICIZERS MARKET, BY PRODUCT, 2025–2030 (KILOTON)
  • TABLE 128 SOUTH AMERICA: ECO-FRIENDLY PLASTICIZERS MARKET, BY APPLICATION, 2022–2024 (USD MILLION)
  • TABLE 129 SOUTH AMERICA: ECO-FRIENDLY PLASTICIZERS MARKET, BY APPLICATION, 2025–2030 (USD MILLION)
  • TABLE 130 SOUTH AMERICA: ECO-FRIENDLY PLASTICIZERS MARKET, BY APPLICATION, 2022–2024 (KILOTON)
  • TABLE 131 SOUTH AMERICA: ECO-FRIENDLY PLASTICIZERS MARKET, BY APPLICATION, 2025–2030 (KILOTON)
  • TABLE 132 BRAZIL: ECO-FRIENDLY PLASTICIZERS MARKET, BY APPLICATION, 2022–2024 (USD MILLION)
  • TABLE 133 BRAZIL: ECO-FRIENDLY PLASTICIZERS MARKET, BY APPLICATION, 2025–2030 (USD MILLION)
  • TABLE 134 BRAZIL: ECO-FRIENDLY PLASTICIZERS MARKET, BY APPLICATION, 2022–2024 (KILOTON)
  • TABLE 135 BRAZIL: ECO-FRIENDLY PLASTICIZERS MARKET, BY APPLICATION, 2025–2030 (KILOTON)
  • TABLE 136 ARGENTINA: ECO-FRIENDLY PLASTICIZERS MARKET, BY APPLICATION, 2022–2024 (USD MILLION)
  • TABLE 137 ARGENTINA: ECO-FRIENDLY PLASTICIZERS MARKET, BY APPLICATION, 2025–2030 (USD MILLION)
  • TABLE 138 ARGENTINA: ECO-FRIENDLY PLASTICIZERS MARKET, BY APPLICATION, 2022–2024 (KILOTON)
  • TABLE 139 ARGENTINA: ECO-FRIENDLY PLASTICIZERS MARKET, BY APPLICATION, 2025–2030 (KILOTON)
  • TABLE 140 REST OF SOUTH AMERICA: ECO-FRIENDLY PLASTICIZERS MARKET, BY APPLICATION, 2022–2024 (USD MILLION)
  • TABLE 141 REST OF SOUTH AMERICA: ECO-FRIENDLY PLASTICIZERS MARKET, BY APPLICATION, 2025–2030 (USD MILLION)
  • TABLE 142 REST OF SOUTH AMERICA: ECO-FRIENDLY PLASTICIZERS MARKET, BY APPLICATION, 2022–2024 (KILOTON)
  • TABLE 143 REST OF SOUTH AMERICA: ECO-FRIENDLY PLASTICIZERS MARKET, BY APPLICATION, 2025–2030 (KILOTON)
  • TABLE 144 MIDDLE EAST & AFRICA: ECO-FRIENDLY PLASTICIZERS MARKET, BY COUNTRY, 2022–2024 (USD MILLION)
  • TABLE 145 MIDDLE EAST & AFRICA: ECO-FRIENDLY PLASTICIZERS MARKET, BY COUNTRY, 2025–2030 (USD MILLION)
  • TABLE 146 MIDDLE EAST & AFRICA: ECO-FRIENDLY PLASTICIZERS MARKET, BY COUNTRY, 2022–2024 (KILOTON)
  • TABLE 147 MIDDLE EAST & AFRICA: ECO-FRIENDLY PLASTICIZERS MARKET, BY COUNTRY, 2025–2030 (KILOTON)
  • TABLE 148 MIDDLE EAST & AFRICA: ECO-FRIENDLY PLASTICIZERS MARKET, BY PRODUCT, 2022–2024 (USD MILLION)
  • TABLE 149 MIDDLE EAST & AFRICA: ECO-FRIENDLY PLASTICIZERS MARKET, BY PRODUCT, 2025–2030 (USD MILLION)
  • TABLE 150 MIDDLE EAST & AFRICA: ECO-FRIENDLY PLASTICIZERS MARKET, BY PRODUCT, 2022–2024 (KILOTON)
  • TABLE 151 MIDDLE EAST & AFRICA: ECO-FRIENDLY PLASTICIZERS MARKET, BY PRODUCT, 2025–2030 (KILOTON)
  • TABLE 152 MIDDLE EAST & AFRICA: ECO-FRIENDLY PLASTICIZERS MARKET, BY APPLICATION, 2022–2024 (USD MILLION)
  • TABLE 153 MIDDLE EAST & AFRICA: ECO-FRIENDLY PLASTICIZERS MARKET, BY APPLICATION, 2025–2030 (USD MILLION)
  • TABLE 154 MIDDLE EAST & AFRICA: ECO-FRIENDLY PLASTICIZERS MARKET, BY APPLICATION, 2022–2024 (KILOTON)
  • TABLE 155 MIDDLE EAST & AFRICA: ECO-FRIENDLY PLASTICIZERS MARKET, BY APPLICATION, 2025–2030 (KILOTON)
  • TABLE 156 GCC COUNTRIES: ECO-FRIENDLY PLASTICIZERS MARKET, BY APPLICATION, 2022–2024 (USD MILLION)
  • TABLE 157 GCC COUNTRIES: ECO-FRIENDLY PLASTICIZERS MARKET, BY APPLICATION, 2025–2030 (USD MILLION)
  • TABLE 158 GCC COUNTRIES: ECO-FRIENDLY PLASTICIZERS MARKET, BY APPLICATION, 2022–2024 (KILOTON)
  • TABLE 159 GCC COUNTRIES: ECO-FRIENDLY PLASTICIZERS MARKET, BY APPLICATION, 2025–2030 (KILOTON)
  • TABLE 160 SAUDI ARABIA: ECO-FRIENDLY PLASTICIZERS MARKET, BY APPLICATION, 2022–2024 (USD MILLION)
  • TABLE 161 SAUDI ARABIA: ECO-FRIENDLY PLASTICIZERS MARKET, BY APPLICATION, 2025–2030 (USD MILLION)
  • TABLE 162 SAUDI ARABIA: ECO-FRIENDLY PLASTICIZERS MARKET, BY APPLICATION, 2022–2024 (KILOTON)
  • TABLE 163 SAUDI ARABIA: ECO-FRIENDLY PLASTICIZERS MARKET, BY APPLICATION, 2025–2030 (KILOTON)
  • TABLE 164 UAE: ECO-FRIENDLY PLASTICIZERS MARKET, BY APPLICATION, 2022–2024 (USD MILLION)
  • TABLE 165 UAE: ECO-FRIENDLY PLASTICIZERS MARKET, BY APPLICATION, 2025–2030 (USD MILLION)
  • TABLE 166 UAE: ECO-FRIENDLY PLASTICIZERS MARKET, BY APPLICATION, 2022–2024 (KILOTON)
  • TABLE 167 UAE: ECO-FRIENDLY PLASTICIZERS MARKET, BY APPLICATION, 2025–2030 (KILOTON)
  • TABLE 168 REST OF GCC COUNTRIES: ECO-FRIENDLY PLASTICIZERS MARKET, BY APPLICATION, 2022–2024 (USD MILLION)
  • TABLE 169 REST OF GCC COUNTRIES: ECO-FRIENDLY PLASTICIZERS MARKET, BY APPLICATION, 2025–2030 (USD MILLION)
  • TABLE 170 REST OF GCC COUNTRIES: ECO-FRIENDLY PLASTICIZERS MARKET, BY APPLICATION, 2022–2024 (KILOTON)
  • TABLE 171 REST OF GCC COUNTRIES: ECO-FRIENDLY PLASTICIZERS MARKET, BY APPLICATION, 2025–2030 (KILOTON)
  • TABLE 172 SOUTH AFRICA: ECO-FRIENDLY PLASTICIZERS MARKET, BY APPLICATION, 2022–2024 (USD MILLION)
  • TABLE 173 SOUTH AFRICA: ECO-FRIENDLY PLASTICIZERS MARKET, BY APPLICATION, 2025–2030 (USD MILLION)
  • TABLE 174 SOUTH AFRICA: ECO-FRIENDLY PLASTICIZERS MARKET, BY APPLICATION, 2022–2024 (KILOTON)
  • TABLE 175 SOUTH AFRICA: ECO-FRIENDLY PLASTICIZERS MARKET, BY APPLICATION, 2025–2030 (KILOTON)
  • TABLE 176 REST OF MIDDLE EAST & AFRICA: ECO-FRIENDLY PLASTICIZERS MARKET, BY APPLICATION, 2022–2024 (USD MILLION)
  • TABLE 177 REST OF MIDDLE EAST & AFRICA: ECO-FRIENDLY PLASTICIZERS MARKET, BY APPLICATION, 2025–2030 (USD MILLION)
  • TABLE 178 REST OF MIDDLE EAST & AFRICA: ECO-FRIENDLY PLASTICIZERS MARKET, BY APPLICATION, 2022–2024 (KILOTON)
  • TABLE 179 REST OF MIDDLE EAST & AFRICA: ECO-FRIENDLY PLASTICIZERS MARKET, BY APPLICATION, 2025–2030 (KILOTON)
  • TABLE 180 OVERVIEW OF STRATEGIES ADOPTED BY KEY PLAYERS IN ECO-FRIENDLY PLASTICIZERS MARKET BETWEEN JANUARY 2021 AND OCTOBER 2024
  • TABLE 181 ECO-FRIENDLY PLASTICIZERS MARKET: DEGREE OF COMPETITION, 2023
  • TABLE 182 ECO-FRIENDLY PLASTICIZERS MARKET: PRODUCT FOOTPRINT
  • TABLE 183 ECO-FRIENDLY PLASTICIZERS MARKET: APPLICATION FOOTPRINT
  • TABLE 184 ECO-FRIENDLY PLASTICIZERS MARKET: REGION FOOTPRINT
  • TABLE 185 ECO-FRIENDLY PLASTICIZERS MARKET: DETAILED LIST OF KEY STARTUPS/SMES
  • TABLE 186 ECO-FRIENDLY PLASTICIZERS MARKET: COMPETITIVE BENCHMARKING OF STARTUPS/SMES
  • TABLE 187 ECO-FRIENDLY PLASTICIZERS MARKET: PRODUCT LAUNCHES, JANUARY 2O21–OCTOBER 2024
  • TABLE 188 ECO-FRIENDLY PLASTICIZERS MARKET: DEALS, JANUARY 2O21–OCTOBER 2024
  • TABLE 189 ECO-FRIENDLY PLASTICIZERS MARKET: EXPANSIONS, JANUARY 2O21– OCTOBER 2024
  • TABLE 190 BASF SE: COMPANY OVERVIEW
  • TABLE 191 BASF: PRODUCTS OFFERED
  • TABLE 192 BASF: PRODUCT LAUNCHES, JANUARY 2021–OCTOBER 2024
  • TABLE 193 BASF: DEALS, JANUARY 2021–OCTOBER 2024
  • TABLE 194 EASTMAN CHEMICAL COMPANY: COMPANY OVERVIEW
  • TABLE 195 EASTMAN CHEMICAL COMPANY: PRODUCTS OFFERED
  • TABLE 196 EASTMAN CHEMICAL COMPANY: PRODUCT LAUNCHES, JANUARY 2021–OCTOBER 2024
  • TABLE 197 EASTMAN CHEMICAL COMPANY: DEALS, JANUARY 2021–OCTOBER 2024
  • TABLE 198 EASTMAN CHEMICAL COMPANY: EXPANSIONS, JANUARY 2021–OCTOBER 2024
  • TABLE 199 EVONIK INDUSTRIES AG: COMPANY OVERVIEW
  • TABLE 200 EVONIK INDUSTRIES AG: PRODUCTS OFFERED
  • TABLE 201 EVONIK INDUSTRIES AG: DEALS, JANUARY 2021–OCTOBER 2024
  • TABLE 202 EVONIK INDUSTRIES AG: EXPANSIONS, JANUARY 2021–OCTOBER 2024
  • TABLE 203 LANXESS: COMPANY OVERVIEW
  • TABLE 204 LANXESS: PRODUCTS OFFERED
  • TABLE 205 LANXESS: PRODUCT LAUNCHES, JANUARY 2021–OCTOBER 2024
  • TABLE 206 LANXESS: DEALS, JANUARY 2021–OCTOBER 2024
  • TABLE 207 THE DOW CHEMICAL COMPANY: COMPANY OVERVIEW
  • TABLE 208 THE DOW CHEMICAL COMPANY: PRODUCTS OFFERED
  • TABLE 209 DIC CORPORATION: COMPANY OVERVIEW
  • TABLE 210 DIC CORPORATION: PRODUCTS OFFERED
  • TABLE 211 CARGILL, INCORPORATED: COMPANY OVERVIEW
  • TABLE 212 CARGILL, INCORPORATED: PRODUCTS OFFERED
  • TABLE 213 CARGILL, INCORPORATED: DEALS, JANUARY 2021–OCTOBER 2024
  • TABLE 214 ARKEMA: COMPANY OVERVIEW
  • TABLE 215 ARKEMA: PRODUCTS OFFERED
  • TABLE 216 ARKEMA: DEALS, JANUARY 2021–OCTOBER 2024
  • TABLE 217 LG CHEM: COMPANY OVERVIEW
  • TABLE 218 LG CHEM: PRODUCTS OFFERED
  • TABLE 219 VALTRIS SPECIALTY CHEMICALS: BUSINESS OVERVIEW
  • TABLE 220 VALTRIS SPECIALTY CHEMICALS: PRODUCTS OFFERED
  • TABLE 221 PERSTORP: COMPANY OVERVIEW
  • TABLE 222 AVIENT CORPORATION: COMPANY OVERVIEW
  • TABLE 223 EMERY OLEOCHEMICALS: COMPANY OVERVIEW
  • TABLE 224 MATRÌCA S.P.A.: COMPANY OVERVIEW
  • TABLE 225 AURORIUM: COMPANY OVERVIEW
  • TABLE 226 NAYAKEM ORGANICS PVT. LTD.: COMPANY OVERVIEW
  • TABLE 227 ROQUETTE FRÈRES: COMPANY OVERVIEW
  • TABLE 228 HANWHA CORPORATION: COMPANY OVERVIEW
  • TABLE 229 UPC TECHNOLOGY CORPORATION: COMPANY OVERVIEW
  • TABLE 230 SHANDONG NOVISTA CHEMICALS CO., LTD.: COMPANY OVERVIEW
  • TABLE 231 SANYO CHEMICAL INDUSTRIES, LTD.: COMPANY OVERVIEW
  • TABLE 232 ACS TECHNICAL PRODUCTS: COMPANY OVERVIEW
  • TABLE 233 JUNGBUNZLAUER SUISSE AG: COMPANY OVERVIEW
  • TABLE 234 K-TECH (INDIA) LIMITED: COMPANY OVERVIEW
  • TABLE 235 TECNOSINTESI S.P.A.: COMPANY OVERVIEW
LIST OF FIGURES
 
  • FIGURE 1 ECO-FRIENDLY PLASTICIZERS MARKET SEGMENTATION
  • FIGURE 2 ECO-FRIENDLY PLASTICIZERS MARKET: RESEARCH DESIGN
  • FIGURE 3 ECO-FRIENDLY PLASTICIZERS MARKET: BOTTOM-UP APPROACH
  • FIGURE 4 ECO-FRIENDLY PLASTICIZERS MARKET: TOP-DOWN APPROACH
  • FIGURE 5 ECO-FRIENDLY PLASTICIZERS MARKET: DATA TRIANGULATION
  • FIGURE 6 BIO-BASED PLASTICIZERS SEGMENT TO REGISTER HIGHEST CAGR DURING FORECAST PERIOD
  • FIGURE 7 PACKAGING SEGMENT WILL CONTINUE TO DOMINATE MARKET DURING FORECAST PERIOD
  • FIGURE 8 ASIA PACIFIC TO BE FASTEST-GROWING MARKET DURING FORECAST PERIOD
  • FIGURE 9 GROWING AUTOMOTIVE INDUSTRY IN ASIA PACIFIC TO DRIVE MARKET
  • FIGURE 10 BIO-BASED PLASTICIZERS SEGMENT TO REGISTER HIGHEST CAGR DURING FORECAST PERIOD
  • FIGURE 11 CONSUMER GOODS SEGMENT TO WITNESS HIGHEST GROWTH DURING FORECAST PERIOD
  • FIGURE 12 INDIA TO REGISTER HIGHEST CAGR DURING FORECAST PERIOD
  • FIGURE 13 ECO-FRIENDLY PLASTICIZERS MARKET: DRIVERS, RESTRAINTS, OPPORTUNITIES, AND CHALLENGES
  • FIGURE 14 PRICE COMPARISON: BIO-BASED PLASTICIZERS AND CONVENTIONAL PLASTICIZERS, 2024 (USD/KG)
  • FIGURE 15 PORTER’S FIVE FORCES ANALYSIS
  • FIGURE 16 REVENUE SHIFT FOR ECO-FRIENDLY PLASTICIZER MANUFACTURERS
  • FIGURE 17 INDICATIVE PRICING ANALYSIS, BY REGION (USD/KT)
  • FIGURE 18 ECO-FRIENDLY PLASTICIZERS MARKET: ECOSYSTEM ANALYSIS
  • FIGURE 19 IMPORT DATA RELATED TO HS CODE-381220 COMPOUND PLASTICIZERS FOR RUBBER OR PLASTICS, N.E.S., BY KEY COUNTRY, 2014–2023 (USD MILLION)
  • FIGURE 20 EXPORT DATA RELATED TO HS CODE 381220 COMPOUND PLASTICIZERS FOR RUBBER OR PLASTICS, N.E.S., BY KEY COUNTRY, 2014–2023 (USD MILLION)
  • FIGURE 21 INVESTMENT AND FUNDING SCENARIO (USD MILLION)
  • FIGURE 22 PATENT APPLICATIONS ACCOUNTED FOR SIGNIFICANT SHARE OF ECO-FRIENDLY PLASTICIZERS MARKET FROM 2013 TO 2023
  • FIGURE 23 LEGAL STATUS OF PATENTS
  • FIGURE 24 NON-PHTHALATE PLASTICIZERS TO DOMINATE MARKET DURING FORECAST PERIOD
  • FIGURE 25 PACKAGING SEGMENT TO DOMINATE MARKET DURING FORECAST PERIOD
  • FIGURE 26 ECO-FRIENDLY PLASTICIZERS MARKET: TOTAL AND SEGMENTAL REVENUE ANALYSIS OF KEY PLAYERS, 2023 (USD BILLION)
  • FIGURE 27 ECO-FRIENDLY PLASTICIZERS MARKET: REVENUE ANALYSIS OF KEY PLAYERS, 2019–2023 (USD BILLION)
  • FIGURE 28 ECO-FRIENDLY PLASTICIZERS MARKET SHARE ANALYSIS, 2023
  • FIGURE 29 ECO-FRIENDLY PLASTICIZERS MARKET: COMPANY VALUATION OF LEADING COMPANIES, 2023
  • FIGURE 30 ECO-FRIENDLY PLASTICIZERS MARKET: FINANCIAL METRICS OF LEADING COMPANIES, 2023
  • FIGURE 31 ECO-FRIENDLY PLASTICIZERS MARKET: BRAND/PRODUCTION COMPARISON
  • FIGURE 32 ECO-FRIENDLY PLASTICIZERS MARKET: COMPANY EVALUATION MATRIX (KEY PLAYERS), 2023
  • FIGURE 33 ECO-FRIENDLY PLASTICIZERS MARKET: COMPANY FOOTPRINT
  • FIGURE 34 ECO-FRIENDLY PLASTICIZERS MARKET: COMPANY EVALUATION MATRIX (STARTUPS/SMES), 2023
  • FIGURE 35 BASF: COMPANY SNAPSHOT
  • FIGURE 36 EASTMAN CHEMICAL COMPANY: COMPANY SNAPSHOT
  • FIGURE 37 EVONIK INDUSTRIES AG: COMPANY SNAPSHOT
  • FIGURE 38 LANXESS: COMPANY SNAPSHOT
  • FIGURE 39 THE DOW CHEMICAL COMPANY: COMPANY SNAPSHOT
  • FIGURE 40 DIC CORPORATION: COMPANY SNAPSHOT
  • FIGURE 41 ARKEMA: COMPANY SNAPSHOT
  • FIGURE 42 LG CHEM: COMPANY SNAPSHOT


The study involved four major activities for estimating the current size of the global flexible eco-friendly plasticizers market. Exhaustive secondary research was conducted to collect information on the market, the peer product market, and the parent product group market. The next step was to validate these findings, assumptions, and sizes with the industry experts across the value chain of eco-friendly plasticizers through primary research. Both the top-down and bottom-up approaches were employed to estimate the overall size of the eco-friendly plasticizers market. After that, market breakdown and data triangulation procedures were used to determine the size of different segments and sub-segments of the market.

Secondary Research

In the secondary research process, various secondary sources such as Hoovers, Factiva, Bloomberg BusinessWeek, and Dun & Bradstreet were referred, to identify and collect information for this study on the eco-friendly plasticizers market. These secondary sources included annual reports, press releases & investor presentations of companies; white papers; certified publications; articles by recognized authors; regulatory bodies, trade directories, and databases.

Primary Research

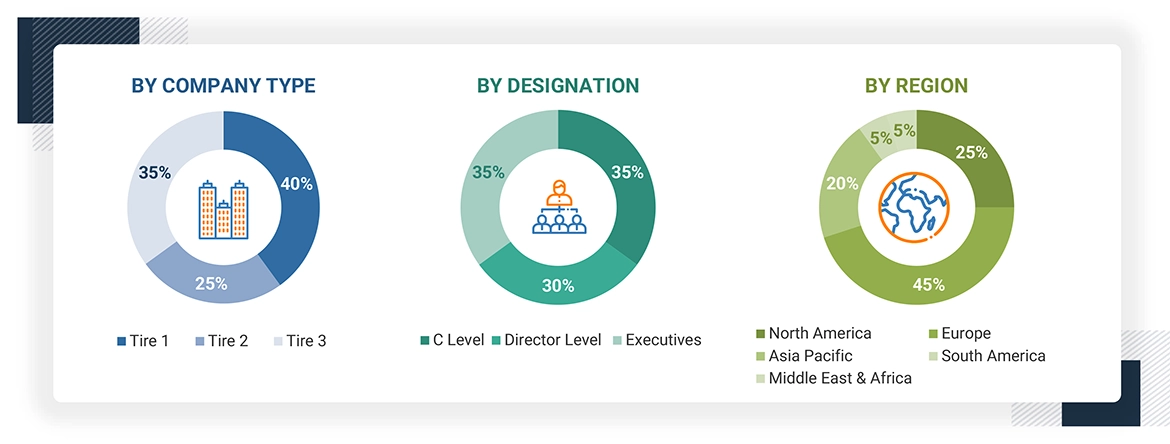
The eco-friendly plasticizers market comprises several stakeholders in the supply chain, which include raw material suppliers, processors, end-product manufacturers, buyers, and regulatory organizations. Various primary sources from the supply and demand sides of the markets have been interviewed to obtain qualitative and quantitative information. The primary participants from the demand side include key opinion leaders, executives, vice presidents, and CEOs of companies in the eco-friendly plasticizers market. Primary sources from the supply side include associations and institutions involved in the eco-friendly plasticizers market, key opinion leaders, and processing players.

Following is the breakdown of primary respondents:
Eco-Friendly Plasticizers Market

To know about the assumptions considered for the study, download the pdf brochure

Market Size Estimation

The bottom-up and top-down approaches have been used to estimate the eco-friendly plasticizers market by packaging product, application, and region. The research methodology used to calculate the market size includes the following steps:

  • The key players in the industry and markets were identified through extensive secondary research.
  • In terms of value, the industry’s supply chain and market size were determined through primary and secondary research processes.
  • All percentage shares, splits, and breakdowns were determined using secondary sources and verified through primary sources.
  • All possible parameters that affect the markets covered in this research study were accounted for, viewed in extensive detail, verified through primary research, and analyzed to obtain the final quantitative and qualitative data.
  • The research included studying reports, reviews, and newsletters of top market players and extensive interviews with leaders such as directors and marketing executives to obtain opinions.

The following figure illustrates the overall market size estimation process employed for this study.

Eco-Friendly Plasticizers Market

Data Triangulation

After arriving at the overall size of the eco-friendly plasticizer market from the estimation process explained above, the total market was split into several segments and sub-segments. The data triangulation and market breakdown procedures were employed, wherever applicable, to complete the overall market engineering process and arrive at the exact statistics for all segments and subsegments. The data was triangulated by studying various factors and trends from both the demand and supply sides. Along with this, the market size was validated using both the top-down and bottom-up approaches.

Market Definition

The definition of eco-friendly plasticizers is additives that enhance the flexibility and workability of plastic materials, bringing a very minimal effect on the environment and health. The basis of these plasticizers is renewable sources or such that they are known to be nontoxic, providing safer alternatives in contrast to traditional phthalate-based plasticizers that have been linked to various health risks, including endocrine disruption. There is building momentum within the eco-friendly plasticizer space from growing consumer awareness around sustainability, stringent regulatory requirements, and upticks in demand for greener products across multiple industries including packaging, automotive, and construction. As the carbon footprint of industries continues to minimize and conform to standards based on environmental regulations, the presence of ecological plasticizers is turning into a vital component of creating sustainable materials that will significantly promote innovation and growth in this market.

Stakeholders

  • Eco-Friendly Plasticizer Manufacturers
  • Raw Material Suppliers
  • Regulatory Bodies and Government Agencies
  • Distributors and Suppliers
  • End-Use Industries
  • Associations and Industrial Bodies
  • Market Research and Consulting Firms

Report Objectives

  • To define, describe, and forecast the size of the eco-friendly plasticizers market in terms of value and volume.
  • To provide detailed information regarding the key factors influencing the growth of the market (drivers, restraints, opportunities, and challenges).
  • To forecast the market size based on product, application and region.
  • To forecast the market size for the five main regions—North America, Europe, Asia Pacific (APAC), South America and the Middle East & Africa (MEA),—along with their key countries.
  • To strategically analyze micro markets with respect to individual growth trends, prospects, and contributions to the total market.
  • To analyze the opportunities in the market for stakeholders and provide details of the competitive landscape for the market leaders.
  • To strategically profile leading players and comprehensively analyze their key developments such as new product launches, expansions, and deals in the eco-friendly plasticizers market.
  • To strategically profile key players and comprehensively analyze their market shares and core competencies.
  • To study the impact of AI/Gen AI on the market under study, along with the macroeconomic outlook.

Previous Versions of this Report

"Our USP is "providing game-changing business opportunities reports with free customization" - so please feel free to provide us with your specific areas of interest / business challenges in much greater detail !!"

We appreciate your interest in this report. Once you fill out the form, you'll be immediately directed to an exclusive solution tailored to your needs. This high-value offering can help boost your revenue by 30% - a must-see opportunity for anyone looking to maximize growth.


By clicking the "Submit" button, you are agreeing to the Terms of Use and Privacy Policy.

Custom Market Research Services

We Will Customise The Research For You, In Case The Report Listed Above Does Not Meet With Your Requirements

Get 10% Free Customisation

Growth opportunities and latent adjacency in Eco-Friendly Plasticizers Market

DMCA.com Protection Status