EPDM Market by application (Automotive, Building & Construction, Plastic Modification, Tires & Tubes, Wires & Cables and Lubricant Additives), Manufacturing Process, Region (North America, Europe, APAC, MEA, and South America) - Global Forecast to 2027
Updated on : April 25, 2023
EPDM Market
Ethylene Propylene Diene Monomer (EPDM) Rubber Market Size was valued at USD 3.6 billion in 2022 and is projected to reach USD 4.8 billion by 2027, growing at a cagr 5.9% from 2022 to 2027. Increasing usage of ethylene propylene diene monomer in automotive and construction & buildings are driving the demand for EPDM during the forecast period. Growth potential in emerging economies in Asia pacific region offers opportunities for EPDM market.
To know about the assumptions considered for the study, Request for Free Sample Report
COVID-19 impact on the global EPDM Market
In 2020, the EPDM market grew by more than 20% in terms of volume, compared to 2020, due fast recovery of end use industries. The supply chain was disrupted and declined in end-use industries impacted the EPDM market in 2020, amid pandemic. The end-use industries like automotive also showed steady recovery in production by post pandemic. In 2021-2022 with global economy returning to normal, increased vaccination and reopening of businesses, the demand expects to increase during the forecast period.
EPDM Market Dynamics
Driver: Increasing use of EPDM polymer in blended products
EPDM is an elastomer that provides resistance against ozone, UV, temperature, and weathering. However, it is unable to provide resistance against hydrocarbon fuel. It is often mixed with other chemical products to enhance the performance of the product.
- To provide strength and resistance against ozone and heat, EPDM is mixed with butyl rubber (IIR) for the manufacture of tire inner tubes. For other tire applications, EPDM is blended with natural rubber and styrene-butadiene rubber (SBR). The steady recovery of the automotive sector is expected to fuel the market for the tire industry, further increasing the demand for EPDM in this application.
- EPDM is blended with polypropylene (PP) to produce thermoplastic vulcanizate (TPV). TPV is suitable for resistance against oil and has better recyclability. EPDM is also used as a modifier for TPO to provide better low temperature and crack resistance. TPV finds applications in automotive such as in airbag covers and door and window seals. These types of thermoplastic elastomers are substituting thermoplastics such as PVC and bitumen in various applications.
TPV and other types of blended products have increasing applications in the automotive and construction industries. ExxonMobil provides TPV under the brand name Santoprene, which offers reduced cost, reduced weight, and better recyclability than other thermoset rubbers.
Restraints: Availability of substitutes of EPDM
EPDM rubber is known for its resistance against ozone, UV, and weathering. The product also has increased product life compared to other elastomers. However, there are certain disadvantages of EPDM.
- EPDM shows poor resistance against non-polar solvents and petroleum-based fuel.
- EPDM for sheet roof application mainly comes in black color.
- Recycling is difficult.
Companies are focusing on developing a product with increased performance and sustainability. They are developing various thermoplastic elastomers such as TPV and TPO which are replacing EPDM rubber in applications in the automotive and construction industries.
Opportunity: Development of environment-friendly technology for production of EPDM
EPDM has ethylene as a primary constituent for production. Ethylene is mainly produced from natural gas and by the thermal cracking of naphtha. As EPDM is derived from a petrochemical raw material, the product has an impact on the environment.
Companies are focusing on developing eco-friendly technologies and products for various applications in end-use industries to minimize the CO2 footprins, using renewable raw materials in production processes and thus increase sustainability. This technology is expected to generate significant revenue as production saves energy and higher production rates as the number of steps required in the manufacture of EPDM are significantly reduced. Further savings in terms of operational costs and time have also been enabled as the catalyst stage is not required in the manufacturing process. Arlanxeo (Netherlands) produces bio-based EPDM under the product grade name Keltan ECO. The EPDM is produced from sugarcane by deriving ethylene from ethanol. It has up to 70% bio-based content.
This EPDM can be used as an alternative to petroleum-based EPDM. The price of conventional EPDM is subject to price fluctuations in the crude oil market. Companies are focusing on products with minimum impact on the environment. Arlanxeo, in collaboration with ACE technology, Dow Inc., and AMC technology, focused on increasing production efficiency and decreasing pollution. Major industrial consumers of EPDM such as the automotive industry and the wire & cable industry, are focusing on the green technology to reduce the impact of their products on nature in future.
Challenges: Difficulty in recycling of EPDM
EPDM is a type of thermoset elastomer formed by ethylene and propylene monomers that enables cross-linking or vulcanization at high temperatures using cross-linking agents like sulfur or peroxides. Although thermoset rubbers have increase performance regarding temperature and chemical resistance, these rubbers are difficult to recycle compared to thermoplastic elastomers. The difficulty in recycling is due to the presence of the cross-linked structure.
Automotive and building & construction are the major sectors contributing towards rubber waste in the environment. The European Union's End-of-Life Vehicle (ELV) Directive sets the target for the recyclability of vehicles and their components. It encourages vehicle manufacturers to use environmentally-friendly materials in their production. Moreover, the industry’s shift towards a circular economy further shifted the focus towards renewable resources and reusable products.
EPDM rubber is majorly used in automotive applications and accounts for about 50% of the overall rubber weight in a car. Automotive manufacturers are focused on alternative materials which can provide better performance and have less impact on the environment. For instance, TPV provides ease of processing, recyclability, and manufacturing flexibility compared to EPDM. Therefore, TPV is actively preferred over EPDM, where resistance to high temperature is not required.
EPDM Market Ecosystem
Solution Polymerization Process is the fastest growing segment by form in the EPDM market.
Based on manufacturing process, solution polymerization process is estimated to be the largest and fastest growing segment of EPDM during the forecast period. Polymerization and catalyst technologies in use today provide the ability to design polymers to meet specific and demanding application and processing needs.
Automotive is the fastest growing segment by end-use industry in the EPDM market.
Automotive is estimated to be the largest end-use industry segment in the EPDM market during the forecast period. According to the Organisation Internationale des Constructeurs d'Automobiles (OICA), the global production of vehicles increased by 3% in 2021 compared to the previous year. However, the market is expected to grow in the near future with the rise in the living standard of people and the development of new technologies.
Asia Pacific is estimated to be the largest market for EPDM.
Asia Pacific is the largest and fastest growing market for EPDM, followed by North America and Europe. The growth of the Asia Pacific EPDM market can be attributed to the increased demand for EPDM from various end-use industries of the region. The major end users of EPDM in Asia Pacific include construction & building, automotive, plastic modifications, tires & tubes, wire & cables, lubricant additives and others. The market in this region is driven by the recovery of the automotive sector in China, India, and Southeast Asian countries. Global automobile manufacturers are investing in APAC countries in establish their production plants to enhance their market presence in the region. China is the significant market for automobile and the largest importer of EPDM in the world. The focus towards the development of New Energy Vehicles (NEVs) to reduce carbon footprint will drive the automotive industry in China which will further enhance the demand of EPDM during the forecast period.
Global EPDM manufacturers such as ARLANXEO (Netherlands), DOW Inc. (US), Exxon Mobil Corporation (US), JSR Corporation (Kumho Polychem Co. Ltd.) (South Korea), PetroChina Company Limited (China), Versalis S.p. A.(Italy), SK Global Chemical Co., Ltd. (South Korea), Sumitomo Chemical Co., Ltd. (Japan), and Mitsui Chemicals, Inc. (Japan and others have their business operation in the region.
To know about the assumptions considered for the study, download the pdf brochure
EPDM Market Players
The leading players in the EPDM market are ARLANXEO (Netherlands), DOW Inc. (US), Exxon Mobil Corporation (US), JSR Corporation (Kumho Polychem Co. Ltd.) (South Korea), PetroChina Company Limited (China), Versalis S.p. A.(Italy), SK Global Chemical Co., Ltd. (South Korea), Sumitomo Chemical Co., Ltd. (Japan), and Mitsui Chemicals, Inc. (Japan and others have their business operation in the region.
These companies have adopted various organic as well as inorganic growth strategies between 2018 and 2022 to strengthen their position in the market. New product development, joint venture, acquisition, and expansion were among the key growth strategies adopted by these leading players to enhance their product offering and regional presence and meet the growing demand for the EPDM in the emerging economies.
EPDM Market Report Scope
Report Metric |
Details |
Market Size Value in 2022 |
USD 3.6 billion |
Revenue Forecast in 2027 |
USD 4.8 billion |
CAGR |
5.9% |
Years Considered |
2020–2027 |
Base year |
2021 |
Forecast period |
2022–2027 |
Unit considered |
Value (USD Billion), Volume (Kilotons) |
Segments |
Manufacturing Process, Application and Region |
Regions |
North America, Europe, Asia-Pacific, Middle East & Africa and South America |
Companies |
The major players are ARLANXEO (Netherlands), Exxon Mobil Corporation (US), DOW Inc. (US), Kumho Polychem Co. Ltd. (South Korea), PetroChina Company Limited (China), Versalis S.p. A. (Italy), SK Global Chemical Co., Ltd. (South Korea), Mitsui Chemicals, Inc. (Japan), Lion Elastomers LLC (US), PJSC Nizhnekamskneftekhim (Russia), SABIC (Saudi Arabia), and others are covered in the EPDM market. |
This research report categorizes the global EPDM market on the basis of Grade, Form, End-use industry, and Region.
EPDM Market, By Manufacturing Process
- Solution Polymerization Process
- Slurry/Suspension Process
- Gas-phase Polymerization Process
EPDM Market, By Application
- Automotive
- Building & Construction
- Plastic Modifications
- Tires & Tubes
- Wire & Cables
- Lubricant Additives
- Others
EPDM Market, By Region
- North America
- Europe
- Asia Pacific (APAC)
- South America
- Middle East & Africa (MEA)
The market has been further analyzed for the key countries in each of these regions.
Recent Developments
- In March 2022, Arlanxeo planned to increase the operation capacity by 15% for its EPDM plant in Changzhou, China.
- In May 2021, ENEOS Corporation acquired elastomers business from JSR Corporation. The elastomer business included manufacture and sale of synthetic rubber.
- In July 2020, Carlisle Companies Incorporated introduced 60-mil Reinforced Sure-Tough EPDM SAT (Self-Adhering Technology) to increase roofing projects' productivity
- In March 2019, Carlisle Companies Incorporated introduced 60-mil Non-Reinforced Sure-Seal and Sure-White SAT (Self-Adhering Technology) EPDM to increase roofing projects' productivity
- In July 2018, Arlanxeo developed TPVs using Keltan Eco. The application of the product includes automotive sealing.
Key Questions addressed by the report
- What was the market size of EPDM and the estimated share of each region in 2021, in terms of volume and value?
- What will be the CAGR of the EPDM market in all the key regions during the forecast period?
- What are the new revenue streams for the EPDM market?
- What is the estimated demand for EPDM in various applications?
- Who are the major players in the market region wise?
- What is the impact of the COVID-19 pandemic on the EPDM market?
Frequently Asked Questions (FAQ):
What is the major driver influencing the growth of the EPDM market?
The major driver influencing the growth of EPDM is the recovery of automotive sector in APAC region. Automotive application account for largest share in the EPDM market
How is the EPDM market segmented in terms of applications?
The EPDM market is segmented into automotive, building and construction, plastic modification, wires and cable, tires and tubes, lubricants additives and others.
What are the major challenges in EPDM market?
Antidumping duties imposed by China in 2020 and difficult recyclability of EPDM are major challenges in EPDM market.
What are major catalysts used in production of EPDM?
Ziegler-Natta catalyst and Metallocene catalysts are catalyst, mainly used in production of EPDM
What are the major opportunities in EPDM market?
Growth in electric vehicle and environmentally friendly technology for production of EPDM are opportunities in EPDM market.
What are the production processes for EPDM?
The major processes used in the manufacturing of EPDM are slurry (suspension), gas-phase, and solution. Solution polymerization process is usually used in the commercial production of EPDM.
Which region has the largest demand?
APAC has the largest demand for EPDM owing to automotive industries present in China, India, Japan, South Korea and other Southeast Asian countries.
What are the application areas of EPDM rubber in automotive application?
In automotive application, EPDM is used as weather stripping seals, hoses, gaskets O-ring, grommets, and other under-the-hood applications.
Who are the major manufacturers of EPDM?
The major manufacturers of EPDM are ARLANXEO (Netherlands), DOW Inc. (US), Exxon Mobil Corporation (US), JSR Corporation (Kumho Polychem Co. Ltd.) (South Korea), PetroChina Company Limited (China), Versalis S.p. A.(Italy), SK Global Chemical Co., Ltd. (South Korea), Sumitomo Chemical Co., Ltd. (Japan), and Mitsui Chemicals (Japan).).
To speak to our analyst for a discussion on the above findings, click Speak to Analyst
TABLE OF CONTENTS
1 INTRODUCTION (Page No. - 22)
1.1 STUDY OBJECTIVES
1.2 MARKET DEFINITION
TABLE 1 MARKET SEGMENT DEFINITION, BY APPLICATION
TABLE 2 MARKET SEGMENT DEFINITION, BY MANUFACTURING PROCESS
1.2.1 INCLUSIONS AND EXCLUSIONS
TABLE 3 APPLICATIONS CONSIDERED IN REPORT
1.3 MARKET SCOPE
FIGURE 1 EPDM MARKET SEGMENTATION
1.3.1 REGIONS COVERED
1.3.2 YEARS CONSIDERED FOR STUDY
1.4 CURRENCY
1.5 UNIT CONSIDERED
1.6 LIMITATIONS
1.7 STAKEHOLDERS
1.8 SUMMARY OF CHANGES
2 RESEARCH METHODOLOGY (Page No. - 27)
2.1 RESEARCH DATA
FIGURE 2 EPDM MARKET: RESEARCH DESIGN
2.1.1 SECONDARY DATA
2.1.1.1 Key data from secondary sources
2.1.2 PRIMARY DATA
2.1.2.1 Key data from primary sources
2.1.2.2 Key industry insights
2.1.2.3 Breakdown of primary interviews
2.2 MARKET SIZE ESTIMATION
2.2.1 SUPPLY-SIDE ESTIMATION: BASED ON SYNTHETIC RUBBER MARKET
FIGURE 3 SUPPLY-SIDE ESTIMATION: BASED ON SYNTHETIC RUBBER MARKET
2.2.2 DEMAND-SIDE ESTIMATION: BASED ON TOTAL AUTOMOBILE PRODUCTION
FIGURE 4 DEMAND-SIDE ESTIMATION: BASED ON TOTAL AUTOMOBILE PRODUCTION (2021)
2.3 DATA TRIANGULATION
FIGURE 5 EPDM MARKET: DATA TRIANGULATION
2.4 ASSUMPTIONS AND LIMITATIONS
2.4.1 ASSUMPTIONS
2.4.2 LIMITATIONS
2.4.3 GROWTH RATE ASSUMPTIONS
3 EXECUTIVE SUMMARY (Page No. - 35)
FIGURE 6 AUTOMOTIVE SEGMENT ACCOUNTED FOR LARGEST SHARE IN 2021
FIGURE 7 SOLUTION POLYMERIZATION PROCESS SEGMENT ACCOUNTED FOR LARGER SHARE IN 2021
FIGURE 8 MARKET IN ASIA PACIFIC TO GROW AT HIGHEST CAGR DURING FORECAST PERIOD
4 PREMIUM INSIGHTS (Page No. - 38)
4.1 SIGNIFICANT OPPORTUNITIES IN EPDM MARKET
FIGURE 9 GROWTH IN AUTOMOTIVE SECTOR TO OFFER MARKET GROWTH OPPORTUNITIES
4.2 ASIA PACIFIC MARKET, BY APPLICATION AND COUNTRY, 2021
FIGURE 10 CHINA AND BUILDING & CONSTRUCTION SEGMENT ACCOUNTED FOR LARGEST SHARES
4.3 EPDM MARKET, BY APPLICATION
FIGURE 11 AUTOMOTIVE SEGMENT TO DOMINATE MARKET, 2022–2027
4.4 MARKET, BY MANUFACTURING PROCESS
FIGURE 12 SOLUTION POLYMERIZATION SEGMENT TO LEAD MARKET, 2022–2027
4.5 GLOBAL EPDM MARKET, BY COUNTRY
FIGURE 13 CHINA TO BE FASTEST-GROWING MARKET FOR EPDM
5 MARKET OVERVIEW (Page No. - 41)
5.1 INTRODUCTION
5.2 MARKET DYNAMICS
FIGURE 14 DRIVERS, RESTRAINTS, OPPORTUNITIES, AND CHALLENGES IN EPDM MARKET
5.2.1 DRIVERS
5.2.1.1 Expected recovery of global automotive sector to drive EPDM market
5.2.1.2 Increasing use of EPDM polymer in blended products
5.2.2 RESTRAINTS
5.2.2.1 Availability of substitutes for EPDM
TABLE 4 THERMOPLASTIC ELASTOMERS: TPV AND TPO
5.2.3 OPPORTUNITIES
5.2.3.1 Growth of electric vehicle market expected to provide new revenue streams for EPDM manufacturers
TABLE 5 TYPES OF RUBBER PARTS USED IN ELECTRIC VEHICLES AND INTERNAL COMBUSTION ENGINES
5.2.3.2 Development of environment-friendly technology for production of EPDM
5.2.4 CHALLENGES
5.2.4.1 Anti-dumping duties imposed by China
TABLE 6 ANTI-DUMPING DUTIES IMPOSED ON MANUFACTURING COMPANIES
5.2.4.2 Difficulties in recycling EPDM
5.3 PORTER’S FIVE FORCES ANALYSIS
FIGURE 15 EPDM MARKET: PORTER’S FIVE FORCES ANALYSIS
5.3.1 BARGAINING POWER OF SUPPLIERS
5.3.2 BARGAINING POWER OF BUYERS
5.3.3 INTENSITY OF COMPETITIVE RIVALRY
5.3.4 THREAT OF NEW ENTRANTS
5.3.5 THREAT OF SUBSTITUTES
5.4 COVID-19 IMPACT ANALYSIS
FIGURE 16 PRE & POST-COVID ANALYSIS OF DEMAND FOR EPDM
FIGURE 17 GLOBAL PRODUCTION OF PASSENGER AND COMMERCIAL VEHICLES
5.5 SUPPLY CHAIN ANALYSIS
FIGURE 18 SUPPLY CHAIN ANALYSIS
5.6 REGULATORY LANDSCAPE
5.6.1 REGULATORY BODIES, GOVERNMENT AGENCIES, AND OTHER ORGANIZATIONS
TABLE 7 NORTH AMERICA: LIST OF REGULATORY BODIES, GOVERNMENT AGENCIES, AND OTHER ORGANIZATIONS
TABLE 8 EUROPE: LIST OF REGULATORY BODIES, GOVERNMENT AGENCIES, AND OTHER ORGANIZATIONS
TABLE 9 ASIA PACIFIC: LIST OF REGULATORY BODIES, GOVERNMENT AGENCIES, AND OTHER ORGANIZATIONS
5.7 RANGE SCENARIOS FOR EPDM MARKET
5.8 KEY CONFERENCES & EVENTS IN 2022–2023
TABLE 10 MARKET: DETAILED LIST OF CONFERENCES & EVENTS
5.9 CASE STUDY
5.9.1 EPDM ROOFING MEMBRANE IDEAL CHOICE FOR POOLING APPLICATION
5.9.2 EPDM ROOFING MEMBRANE IDEAL CHOICE FOR GREEN ROOF APPLICATION
5.10 TECHNOLOGY ANALYSIS
5.10.1 ZIEGLER-NATTA CATALYST
5.10.2 METALLOCENE CATALYSTS
5.10.3 ACE TECHNOLOGY
5.10.4 AMC TECHNOLOGY
5.10.5 BIO-BASED EPDM
5.11 AVERAGE SELLING PRICE ANALYSIS
TABLE 11 AVERAGE PRICE RANGE OF EPDM, BY REGION (USD/TON)
FIGURE 19 EPDM PRICE ANALYSIS (USD/TON), BY REGION, 2021
5.12 EPDM TRADE ANALYSIS
TABLE 12 EPDM IMPORT BY COUNTRY (2018-2021) IN TONS
TABLE 13 EPDM EXPORT BY COUNTRY (2018-2021) IN TONS
5.13 EPDM ECOSYSTEM
5.14 TRENDS/DISRUPTIONS IMPACTING CUSTOMER BUSINESSES
FIGURE 20 ELECTRIC & HYBRID VEHICLES AND ENVIRONMENT-FRIENDLY PRODUCTS TO ENHANCE FUTURE REVENUE MIX
TABLE 14 YC, YCC, AND SHIFT IN EPDM MARKET
5.15 KEY STAKEHOLDERS & BUYING CRITERIA
5.15.1 KEY STAKEHOLDERS IN BUYING PROCESS
FIGURE 21 INFLUENCE OF STAKEHOLDERS IN BUYING PROCESS
TABLE 15 INFLUENCE OF STAKEHOLDERS IN BUYING PROCESS FOR DIFFERENT CATALYSTS (%)
5.15.2 BUYING CRITERIA
FIGURE 22 KEY BUYING CRITERIA FOR DIFFERENT GRADES
TABLE 16 KEY BUYING CRITERIA FOR DIFFERENT GRADES
5.16 PATENT ANALYSIS
5.16.1 INTRODUCTION
5.16.2 METHODOLOGY
5.16.3 DOCUMENT TYPE
FIGURE 23 NUMBER OF PATENTS FILED DURING LAST 10 YEARS
5.16.4 PUBLICATION TRENDS - LAST 10 YEARS
FIGURE 24 YEAR-WISE DATA FOR NUMBER OF PATENTS PUBLISHED, 2011–2021
5.16.5 INSIGHTS
5.16.6 LEGAL STATUS OF PATENTS
FIGURE 25 LEGAL STATUS
5.16.7 JURISDICTION ANALYSIS
FIGURE 26 PATENT ANALYSIS FOR TOP 10 JURISDICTIONS BY DOCUMENT
5.16.8 TOP COMPANIES/APPLICANTS
FIGURE 27 TOP 10 COMPANIES/APPLICANTS WITH HIGHEST NUMBER OF PATENTS, 2011–2021
TABLE 17 LIST OF PATENTS BY SUMITOMO RUBBER INDUSTRIES
TABLE 18 LIST OF PATENTS BY HYUNDAI MOTOR CO LTD.
TABLE 19 LIST OF PATENTS BY NOK CORP
TABLE 20 TOP 10 PATENT OWNERS (US) DURING LAST 10 YEARS
6 EPDM MARKET, BY MANUFACTURING PROCESS (Page No. - 74)
6.1 INTRODUCTION
FIGURE 28 SOLUTION POLYMERIZATION PROCESS TO COMMAND LARGEST MARKET SHARE DURING FORECAST PERIOD
TABLE 21 EPDM MARKET SIZE, BY MANUFACTURING PROCESS, 2017–2020 (KILOTON)
TABLE 22 MARKET SIZE, BY MANUFACTURING PROCESS, 2021–2027 (KILOTON)
TABLE 23 MARKET SIZE, BY MANUFACTURING PROCESS, 2017–2020 (USD MILLION)
TABLE 24 MARKET SIZE, BY MANUFACTURING PROCESS, 2021–2027 (USD MILLION)
6.2 SOLUTION POLYMERIZATION PROCESS
6.2.1 POLYMERIZATION TECHNIQUE WIDELY USED FOR ITS ABILITY TO MEET SPECIFIC DESIGN NEEDS
TABLE 25 SOLUTION POLYMERIZATION PROCESS: EPDM MARKET SIZE, BY REGION, 2017–2020 (KILOTON)
TABLE 26 SOLUTION POLYMERIZATION PROCESS: EPDM MARKET SIZE, BY REGION, 2021–2027 (KILOTON)
TABLE 27 SOLUTION POLYMERIZATION PROCESS: EPDM MARKET SIZE, BY REGION, 2017–2020 (USD MILLION)
TABLE 28 SOLUTION POLYMERIZATION PROCESS: EPDM MARKET SIZE, BY REGION, 2021–2027 (USD MILLION)
6.3 SLURRY/SUSPENSION PROCESS
6.3.1 SLURRY/SUSPENSION PROCESS REDUCES NEED FOR SOLVENT AND SOLVENT HANDLING EQUIPMENT
TABLE 29 SLURRY/SUSPENSION PROCESS: EPDM MARKET SIZE, BY REGION, 2017–2020 (KILOTON)
TABLE 30 SLURRY/SUSPENSION PROCESS: EPDM MARKET SIZE, BY REGION, 2021–2027 (KILOTON)
TABLE 31 SLURRY/SUSPENSION PROCESS: EPDM MARKET SIZE, BY REGION, 2017–2020 (USD MILLION)
TABLE 32 SLURRY/SUSPENSION PROCESS: EPDM MARKET SIZE, BY REGION, 2021–2027 (USD MILLION)
6.4 GAS-PHASE POLYMERIZATION PROCESS
6.4.1 GAS-PHASE POLYMERIZATION TECHNOLOGY MAKES PRODUCTS CLEANER AND LESS POLLUTING
TABLE 33 GAS-PHASE POLYMERIZATION PROCESS: EPDM MARKET SIZE, BY REGION, 2017–2020 (KILOTON)
TABLE 34 GAS-PHASE POLYMERIZATION PROCESS: EPDM MARKET SIZE, BY REGION, 2021–2027 (KILOTON)
TABLE 35 GAS-PHASE POLYMERIZATION PROCESS: EPDM MARKET SIZE, BY REGION, 2017–2020 (USD MILLION)
TABLE 36 GAS-PHASE POLYMERIZATION PROCESS: EPDM MARKET SIZE, BY REGION, 2021–2027 (USD MILLION)
7 EPDM MARKET, BY APPLICATION (Page No. - 82)
7.1 INTRODUCTION
TABLE 37 APPLICATIONS OF EPDM
FIGURE 29 AUTOMOTIVE SEGMENT ACCOUNTED FOR LARGEST SHARE OF OVERALL MARKET IN 2021 (BY VALUE)
TABLE 38 EPDM MARKET SIZE, BY APPLICATION, 2017–2020 (KILOTON)
TABLE 39 MARKET SIZE, BY APPLICATION, 2021–2027 (KILOTON)
TABLE 40 MARKET SIZE, BY APPLICATION, 2017–2020 (USD MILLION)
TABLE 41 MARKET SIZE, BY APPLICATION, 2021–2027 (USD MILLION)
7.2 AUTOMOTIVE
7.2.1 GROWTH IN AUTOMOTIVE INDUSTRY TO DRIVE MARKET FOR EPDM
TABLE 42 EPDM MARKET SIZE IN AUTOMOTIVE, BY REGION, 2017–2020 (KILOTON)
TABLE 43 MARKET SIZE IN AUTOMOTIVE, BY REGION, 2021–2027 (KILOTON)
TABLE 44 MARKET SIZE IN AUTOMOTIVE, BY REGION, 2017–2020 (USD MILLION)
TABLE 45 MARKET SIZE IN AUTOMOTIVE, BY REGION, 2021–2027 (USD MILLION)
7.3 BUILDING & CONSTRUCTION
7.3.1 GROWTH IN ROOFING APPLICATION TO DRIVE EPDM MARKET IN BUILDING & CONSTRUCTION
TABLE 46 MARKET SIZE IN BUILDING & CONSTRUCTION, BY REGION, 2017–2020 (KILOTON)
TABLE 47 MARKET SIZE IN BUILDING & CONSTRUCTION, BY REGION, 2021–2027 (KILOTON)
TABLE 48 MARKET SIZE IN BUILDING & CONSTRUCTION, BY REGION, 2017–2020 (USD MILLION)
TABLE 49 MARKET SIZE IN BUILDING & CONSTRUCTION, BY REGION, 2021–2027 (USD MILLION)
7.4 PLASTIC MODIFICATION
7.4.1 INCREASE IN DEMAND FROM AUTOMOTIVE AND BUILDING & CONSTRUCTION TO DRIVE MARKET IN PLASTIC MODIFICATION
TABLE 50 EPDM MARKET SIZE IN PLASTIC MODIFICATIONS, BY REGION, 2017–2020 (KILOTON)
TABLE 51 MARKET SIZE IN PLASTIC MODIFICATIONS, BY REGION, 2021–2027 (KILOTON)
TABLE 52 MARKET SIZE IN PLASTIC MODIFICATIONS, BY REGION, 2017–2020 (USD MILLION)
TABLE 53 MARKET SIZE IN PLASTIC MODIFICATIONS, BY REGION, 2021–2027 (USD MILLION)
7.5 TIRES & TUBES
7.5.1 DEMAND FOR EPDM BLEND & TUBES TO DRIVE EPDM MARKET IN THIS SEGMENT
TABLE 54 MARKET SIZE IN TIRES & TUBES, BY REGION, 2017–2020 (KILOTON)
TABLE 55 MARKET SIZE IN TIRES & TUBES, BY REGION, 2021–2027 (KILOTON)
TABLE 56 MARKET SIZE IN TIRES & TUBES, BY REGION, 2017–2020 (USD MILLION)
TABLE 57 MARKET SIZE IN TIRES & TUBES, BY REGION, 2021–2027 (USD MILLION)
7.6 WIRES & CABLES
7.6.1 EPDM WIDELY USED IN HIGH-TEMPERATURE AND HIGH VOLTAGE APPLICATIONS
TABLE 58 EPDM MARKET SIZE IN WIRES & CABLES, BY REGION, 2017–2020 (KILOTON)
TABLE 59 MARKET SIZE IN WIRES & CABLES, BY REGION, 2021–2027 (KILOTON)
TABLE 60 MARKET SIZE IN WIRES & CABLES, BY REGION, 2017–2020 (USD MILLION)
TABLE 61 MARKET SIZE IN WIRES & CABLES, BY REGION, 2021–2027 (USD MILLION)
7.7 LUBRICANT ADDITIVES
7.7.1 INCREASED USE OF LUBRICANT ADDITIVES IN AUTOMOTIVE DRIVING MARKET FOR EPDM
TABLE 62 EPDM MARKET SIZE IN LUBRICANT ADDITIVES, BY REGION, 2017–2020 (KILOTON)
TABLE 63 MARKET SIZE IN LUBRICANT ADDITIVES, BY REGION, 2021–2027 (KILOTON)
TABLE 64 MARKET SIZE IN LUBRICANT ADDITIVES, BY REGION, 2017–2020 (USD MILLION)
TABLE 65 MARKET SIZE IN LUBRICANT ADDITIVES, BY REGION, 2021–2027 (USD MILLION)
7.8 OTHERS
TABLE 66 EPDM MARKET SIZE IN OTHER APPLICATIONS, BY REGION, 2017–2020 (KILOTON)
TABLE 67 MARKET SIZE IN OTHER APPLICATIONS, BY REGION, 2021–2027 (KILOTON)
TABLE 68 MARKET SIZE IN OTHER APPLICATIONS, BY REGION, 2017–2020 (USD MILLION)
TABLE 69 MARKET SIZE IN OTHER APPLICATIONS, BY REGION, 2021–2027 (USD MILLION)
8 EPDM MARKET, BY REGION (Page No. - 98)
8.1 INTRODUCTION
FIGURE 30 RAPIDLY GROWING MARKETS ARE EMERGING AS NEW HOTSPOTS
TABLE 70 EPDM MARKET SIZE, BY REGION, 2017–2020 (KILOTON)
TABLE 71 MARKET SIZE, BY REGION, 2021–2027 (KILOTON)
TABLE 72 MARKET SIZE, BY REGION, 2017–2020 (USD MILLION)
TABLE 73 MARKET SIZE, BY REGION, 2021–2027 (USD MILLION)
8.2 ASIA PACIFIC
FIGURE 31 ASIA PACIFIC: EPDM MARKET SNAPSHOT
TABLE 74 ASIA PACIFIC:MARKET SIZE, BY COUNTRY, 2017–2020 (KILOTON)
TABLE 75 ASIA PACIFIC:MARKET SIZE, BY COUNTRY, 2021–2027 (KILOTON)
TABLE 76 ASIA PACIFIC: MARKET SIZE, BY COUNTRY, 2017–2020 (USD MILLION)
TABLE 77 ASIA PACIFIC: MARKET SIZE, BY COUNTRY, 2021–2027 (USD MILLION)
TABLE 78 ASIA PACIFIC: MARKET SIZE, BY APPLICATION, 2017–2020 (KILOTON)
TABLE 79 ASIA PACIFIC: MARKET SIZE, BY APPLICATION, 2021–2027 (KILOTON)
TABLE 80 ASIA PACIFIC: MARKET SIZE, BY APPLICATION, 2017–2020 (USD MILLION)
TABLE 81 ASIA PACIFIC: MARKET SIZE, BY APPLICATION, 2021–2027 (USD MILLION)
TABLE 82 ASIA PACIFIC: MARKET SIZE, BY MANUFACTURING PROCESS, 2017–2020 (KILOTON)
TABLE 83 ASIA PACIFIC: MARKET SIZE, BY MANUFACTURING PROCESS, 2021–2027 (KILOTON)
TABLE 84 ASIA PACIFIC: MARKET SIZE, BY MANUFACTURING PROCESS, 2017–2020 (USD MILLION)
TABLE 85 ASIA PACIFIC: MARKET SIZE, BY MANUFACTURING PROCESS, 2021–2027 (USD MILLION)
8.2.1 CHINA
8.2.1.1 Imposition of anti-dumping duties by government to enhance domestic market
TABLE 86 CHINA: EPDM MARKET SIZE, BY APPLICATION, 2017–2020 (KILOTON)
TABLE 87 CHINA: MARKET SIZE, BY APPLICATION, 2021–2027 (KILOTON)
TABLE 88 CHINA: MARKET SIZE, BY APPLICATION, 2017–2020 (USD MILLION)
TABLE 89 CHINA: MARKET SIZE, BY APPLICATION, 2021–2027 (USD MILLION)
8.2.2 INDIA
8.2.2.1 Rising investments in automotive sector to drive EPDM market
TABLE 90 INDIA: EPDM MARKET SIZE, BY APPLICATION, 2017–2020 (KILOTON)
TABLE 91 INDIA: MARKET SIZE, BY APPLICATION, 2021–2027 (KILOTON)
TABLE 92 INDIA: MARKET SIZE, BY APPLICATION, 2017–2020 (USD MILLION)
TABLE 93 INDIA: MARKET SIZE, BY APPLICATION, 2021–2027 (USD MILLION)
8.2.3 JAPAN
8.2.3.1 Steady increase in export to enhance EPDM market in Japan
TABLE 94 JAPAN: EPDM MARKET SIZE, BY APPLICATION, 2017–2020 (KILOTON)
TABLE 95 JAPAN: MARKET SIZE, BY APPLICATION, 2021–2027 (KILOTON)
TABLE 96 JAPAN: MARKET SIZE, BY APPLICATION, 2017–2020 (USD MILLION)
TABLE 97 JAPAN: MARKET SIZE, BY APPLICATION, 2021–2027 (USD MILLION)
8.2.4 SOUTH KOREA
8.2.4.1 Technological development and innovation in automotive industry to drive growth
TABLE 98 SOUTH KOREA: EPDM MARKET SIZE, BY APPLICATION, 2017–2020 (KILOTON)
TABLE 99 SOUTH KOREA: MARKET SIZE, BY APPLICATION, 2021–2027 (KILOTON)
TABLE 100 SOUTH KOREA: MARKET SIZE, BY APPLICATION, 2017–2020 (USD MILLION)
TABLE 101 SOUTH KOREA: MARKET SIZE, BY APPLICATION, 2021–2027 (USD MILLION)
8.2.5 THAILAND
8.2.5.1 Development in automotive sector to drive demand for EPDM
TABLE 102 THAILAND: EPDM MARKET SIZE, BY APPLICATION, 2017–2020 (KILOTON)
TABLE 103 THAILAND:MARKET SIZE, BY APPLICATION, 2021–2027 (KILOTON)
TABLE 104 THAILAND: MARKET SIZE, BY APPLICATION, 2017–2020 (USD MILLION)
TABLE 105 THAILAND: MARKET SIZE, BY APPLICATION, 2021–2027 (USD MILLION)
8.2.6 INDONESIA
8.2.6.1 FDI in automotive sector to enhance production of vehicles
TABLE 106 INDONESIA: EPDM MARKET SIZE, BY APPLICATION, 2017–2020 (KILOTON)
TABLE 107 INDONESIA: MARKET SIZE, BY APPLICATION, 2021–2027 (KILOTON)
TABLE 108 INDONESIA: MARKET SIZE, BY APPLICATION, 2017–2020 (USD MILLION
TABLE 109 INDONESIA: MARKET SIZE, BY APPLICATION, 2021–2027 (USD MILLION)
8.2.7 REST OF ASIA PACIFIC
TABLE 110 REST OF ASIA PACIFIC: EPDM MARKET SIZE, BY APPLICATION, 2017–2020 (KILOTON)
TABLE 111 REST OF ASIA PACIFIC: MARKET SIZE, BY APPLICATION, 2021–2027 (KILOTON)
TABLE 112 REST OF ASIA PACIFIC: MARKET SIZE, BY APPLICATION, 2017–2020 (USD MILLION)
TABLE 113 REST OF ASIA PACIFIC: MARKET SIZE, BY APPLICATION, 2021–2027 (USD MILLION)
8.3 NORTH AMERICA
FIGURE 32 NORTH AMERICA: EPDM MARKET SNAPSHOT
TABLE 114 NORTH AMERICA: MARKET SIZE, BY COUNTRY, 2017–2020 (KILOTON)
TABLE 115 NORTH AMERICA: MARKET SIZE, BY COUNTRY, 2021–2027 (KILOTON)
TABLE 116 NORTH AMERICA: MARKET SIZE, BY COUNTRY, 2017–2020 (USD MILLION)
TABLE 117 NORTH AMERICA: MARKET SIZE, BY COUNTRY, 2021–2027 (USD MILLION)
TABLE 118 NORTH AMERICA: MARKET SIZE, BY APPLICATION, 2017–2020 (KILOTON)
TABLE 119 NORTH AMERICA: MARKET SIZE, BY APPLICATION, 2021–2027 (KILOTON)
TABLE 120 NORTH AMERICA: MARKET SIZE, BY APPLICATION, 2017–2020 (USD MILLION)
TABLE 121 NORTH AMERICA: MARKET SIZE, BY APPLICATION, 2021–2027 (USD MILLION)
TABLE 122 NORTH AMERICA: MARKET SIZE, BY MANUFACTURING PROCESS, 2017–2020 (KILOTON)
TABLE 123 NORTH AMERICA: MARKET SIZE, BY MANUFACTURING PROCESS, 2021–2027 (KILOTON)
TABLE 124 NORTH AMERICA: MARKET SIZE, BY MANUFACTURING PROCESS, 2017–2020 (USD MILLION)
TABLE 125 NORTH AMERICA: EPDM MARKET SIZE, BY MANUFACTURING PROCESS, 2021–2027 (USD MILLION)
8.3.1 US
8.3.1.1 Automotive is largest consumer of EPDM in US
TABLE 126 US: EPDM MARKET SIZE, BY APPLICATION, 2017–2020 (KILOTON)
TABLE 127 US: MARKET SIZE, BY APPLICATION, 2021–2027 (KILOTON)
TABLE 128 US MARKET SIZE, BY APPLICATION, 2017–2020 (USD MILLION)
TABLE 129 US: MARKET SIZE, BY APPLICATION, 2021–2027 (USD MILLION)
8.3.2 CANADA
8.3.2.1 Technological innovation in automotive sector to provide new opportunities for EPDM
TABLE 130 CANADA: EPDM MARKET SIZE, BY APPLICATION, 2017–2020 (KILOTON)
TABLE 131 CANADA: MARKET SIZE, BY APPLICATION, 2021–2027 (KILOTON)
TABLE 132 CANADA: MARKET SIZE, BY APPLICATION, 2017–2020 (USD MILLION)
TABLE 133 CANADA: MARKET SIZE, BY APPLICATION, 2021–2027 (USD MILLION)
8.3.3 MEXICO
8.3.3.1 Liberalization in trade policy to drive growth in country
TABLE 134 MEXICO: EPDM MARKET SIZE, BY APPLICATION, 2017–2020 (KILOTON)
TABLE 135 MEXICO: MARKET SIZE, BY APPLICATION, 2021–2027 (KILOTON)
TABLE 136 MEXICO MARKET SIZE, BY APPLICATION, 2017–2020 (USD MILLION)
TABLE 137 MEXICO: MARKET SIZE, BY APPLICATION, 2021–2027 (USD MILLION)
8.4 EUROPE
TABLE 138 EUROPE: EPDM MARKET SIZE, BY COUNTRY, 2017–2020 (KILOTON)
TABLE 139 EUROPE: MARKET SIZE, BY COUNTRY, 2021–2027 (KILOTON)
TABLE 140 EUROPE: MARKET SIZE, BY COUNTRY, 2017–2020 (USD MILLION)
TABLE 141 EUROPE: MARKET SIZE, BY COUNTRY, 2021–2027 (USD MILLION)
TABLE 142 EUROPE: MARKET SIZE, BY APPLICATION, 2017–2020 (KILOTON)
TABLE 143 EUROPE:MARKET SIZE, BY APPLICATION, 2021–2027 (KILOTON)
TABLE 144 EUROPE: MARKET SIZE, BY APPLICATION, 2017–2020 (USD MILLION)
TABLE 145 EUROPE: MARKET SIZE, BY APPLICATION, 2021–2027 (USD MILLION)
TABLE 146 EUROPE: MARKET SIZE, BY MANUFACTURING PROCESS, 2017–2020 (KILOTON)
TABLE 147 EUROPE: MARKET SIZE, BY MANUFACTURING PROCESS, 2021–2027 (KILOTON)
TABLE 148 EUROPE: MARKET SIZE, BY MANUFACTURING PROCESS, 2017–2020 (USD MILLION)
TABLE 149 EUROPE: MARKET SIZE, BY MANUFACTURING PROCESS, 2021–2027 (USD MILLION)
8.4.1 GERMANY
8.4.1.1 Growth in electric vehicles to improve demand for EPDM
TABLE 150 GERMANY: EPDM MARKET SIZE, BY APPLICATION, 2017–2020 (KILOTON)
TABLE 151 GERMANY: MARKET SIZE, BY APPLICATION, 2021–2027 (KILOTON)
TABLE 152 GERMANY: MARKET SIZE, BY APPLICATION, 2017–2020 (USD MILLION)
TABLE 153 GERMANY: MARKET SIZE, BY APPLICATION, 2021–2027 (USD MILLION)
8.4.2 POLAND
8.4.2.1 Growth in FDI to enhance recovery of automotive sector
TABLE 154 POLAND: EPDM MARKET SIZE, BY APPLICATION, 2017–2020 (KILOTON)
TABLE 155 POLAND: MARKET SIZE, BY APPLICATION, 2021–2027 (KILOTON)
TABLE 156 POLAND:MARKET SIZE, BY APPLICATION, 2017–2020 (USD MILLION)
TABLE 157 POLAND: MARKET SIZE, BY APPLICATION, 2021–2027 (USD MILLION)
8.4.3 ITALY
8.4.3.1 Growth in end-use industries to improve demand for EPDM
TABLE 158 ITALY: EPDM MARKET SIZE, BY APPLICATION, 2017–2020 (KILOTON)
TABLE 159 ITALY: MARKET SIZE, BY APPLICATION, 2021–2027 (KILOTON)
TABLE 160 ITALY: MARKET SIZE, BY APPLICATION, 2017–2020 (USD MILLION)
TABLE 161 ITALY: MARKET SIZE, BY APPLICATION, 2021–2027 (USD MILLION)
8.4.4 TURKEY
8.4.4.1 Investment in automotive sector to improve demand for EPDM
TABLE 162 TURKEY: EPDM MARKET SIZE, BY APPLICATION, 2017–2020 (KILOTON)
TABLE 163 TURKEY: MARKET SIZE, BY APPLICATION, 2021–2027 (KILOTON)
TABLE 164 TURKEY: MARKET SIZE, BY APPLICATION, 2017–2020 (USD MILLION)
TABLE 165 TURKEY: MARKET SIZE, BY APPLICATION, 2021–2027 (USD MILLION)
8.4.5 CZECH REPUBLIC
8.4.5.1 Increased focus on EVs and hybrid vehicles to drive demand
TABLE 166 CZECH REPUBLIC: EPDM MARKET SIZE, BY APPLICATION, 2017–2020 (KILOTON)
TABLE 167 CZECH REPUBLIC: MARKET SIZE, BY APPLICATION, 2021–2027 (KILOTON)
TABLE 168 CZECH REPUBLIC: MARKET SIZE, BY APPLICATION, 2017–2020 (USD MILLION)
TABLE 169 CZECH REPUBLIC: MARKET SIZE, BY APPLICATION, 2021–2027 (USD MILLION)
8.4.6 SPAIN
8.4.6.1 Investment in electric automotive sector to enhance revival of automotive market
TABLE 170 SPAIN: EPDM MARKET SIZE, BY APPLICATION, 2017–2020 (KILOTON)
TABLE 171 SPAIN: MARKET SIZE, BY APPLICATION, 2021–2027 (KILOTON)
TABLE 172 SPAIN: MARKET SIZE, BY APPLICATION, 2017–2020 (USD MILLION)
TABLE 173 SPAIN: MARKET SIZE, BY APPLICATION, 2021–2027 (USD MILLION)
8.4.7 FRANCE
8.4.7.1 Government investment to revive automotive market from COVID-19
TABLE 174 FRANCE: EPDM MARKET SIZE, BY APPLICATION, 2017–2020 (KILOTON)
TABLE 175 FRANCE: MARKET SIZE, BY APPLICATION, 2021–2027 (KILOTON)
TABLE 176 FRANCE: MARKET SIZE, BY APPLICATION, 2017–2020 (USD MILLION
TABLE 177 FRANCE: MARKET SIZE, BY APPLICATION, 2021–2027 (USD MILLION)
8.4.8 REST OF EUROPE
TABLE 178 REST OF EUROPE: EPDM MARKET SIZE, BY APPLICATION, 2017–2020 (KILOTON)
TABLE 179 REST OF EUROPE: MARKET SIZE, BY APPLICATION, 2021–2027 (KILOTON)
TABLE 180 REST OF EUROPE: MARKET SIZE, BY APPLICATION, 2017–2020 (USD MILLION)
TABLE 181 REST OF EUROPE: MARKET SIZE, BY APPLICATION, 2021–2027 (USD MILLION)
8.5 MIDDLE EAST & AFRICA
TABLE 182 MIDDLE EAST & AFRICA: EPDM MARKET SIZE, BY COUNTRY, 2017–2020 (KILOTON)
TABLE 183 MIDDLE EAST & AFRICA: MARKET SIZE, BY COUNTRY, 2021–2027 (KILOTON)
TABLE 184 MIDDLE EAST & AFRICA: MARKET SIZE, BY COUNTRY, 2017–2020 (USD MILLION)
TABLE 185 MIDDLE EAST & AFRICA: MARKET SIZE, BY COUNTRY, 2021–2027 (USD MILLION)
TABLE 186 MIDDLE EAST & AFRICA: MARKET SIZE, BY MANUFACTURING PROCESS, 2017–2020 (KILOTON)
TABLE 187 MIDDLE EAST & AFRICA: MARKET SIZE, BY MANUFACTURING PROCESS, 2021–2027 (KILOTON)
TABLE 188 MIDDLE EAST & AFRICA: MARKET SIZE, BY MANUFACTURING PROCESS, 2017–2020 (USD MILLION)
TABLE 189 MIDDLE EAST & AFRICA: MARKET SIZE, BY MANUFACTURING PROCESS, 2021–2027 (USD MILLION)
TABLE 190 MIDDLE EAST & AFRICA: MARKET SIZE, BY APPLICATION, 2017–2020 (KILOTON)
TABLE 191 MIDDLE EAST & AFRICA: MARKET SIZE, BY APPLICATION, 2021–2027 (KILOTON)
TABLE 192 MIDDLE EAST & AFRICA: MARKET SIZE, BY APPLICATION, 2017–2020 (USD MILLION)
TABLE 193 MIDDLE EAST & AFRICA: MARKET SIZE, BY APPLICATION, 2021–2027 (USD MILLION)
8.5.1 SAUDI ARABIA
8.5.1.1 Vision 2030 and other government plans to boost construction and automotive industries to fuel market growth
TABLE 194 SAUDI ARABIA: EPDM MARKET SIZE, BY APPLICATION, 2017–2020 (KILOTON)
TABLE 195 SAUDI ARABIA: MARKET SIZE, BY APPLICATION, 2021–2027 (KILOTON)
TABLE 196 SAUDI ARABIA: MARKET SIZE, BY APPLICATION, 2017–2020 (USD MILLION)
TABLE 197 SAUDI ARABIA: MARKET SIZE, BY APPLICATION, 2021–2027 (USD MILLION)
8.5.2 UAE
8.5.2.1 Increased investment in construction industry to drive market during forecast period
TABLE 198 UAE: EPDM MARKET SIZE, BY APPLICATION, 2017–2020 (KILOTON)
TABLE 199 UAE: MARKET SIZE, BY APPLICATION, 2021–2027 (KILOTON)
TABLE 200 UAE: MARKET SIZE, BY APPLICATION, 2017–2020 (USD MILLION)
TABLE 201 UAE: MARKET SIZE, BY APPLICATION, 2021–2027 (USD MILLION)
8.5.3 REST OF MIDDLE EAST & AFRICA
TABLE 202 REST OF MIDDLE EAST & AFRICA: EPDM MARKET SIZE, BY APPLICATION, 2017–2020 (KILOTON)
TABLE 203 REST OF MIDDLE EAST & AFRICA: MARKET SIZE, BY APPLICATION, 2021–2027 (KILOTON)
TABLE 204 REST OF MIDDLE EAST & AFRICA: MARKET SIZE, BY APPLICATION, 2017–2020 (USD MILLION)
TABLE 205 REST OF MIDDLE EAST & AFRICA: MARKET SIZE, BY APPLICATION, 2021–2027 (USD MILLION)
8.6 SOUTH AMERICA
TABLE 206 SOUTH AMERICA: EPDM MARKET SIZE, BY COUNTRY, 2017–2020 (KILOTON)
TABLE 207 SOUTH AMERICA: MARKET SIZE, BY COUNTRY, 2021–2027 (KILOTON)
TABLE 208 SOUTH AMERICA: MARKET SIZE, BY COUNTRY, 2017–2020 (USD MILLION)
TABLE 209 SOUTH AMERICA: MARKET SIZE, BY COUNTRY, 2021–2027 (USD MILLION)
TABLE 210 SOUTH AMERICA: MARKET SIZE, BY MANUFACTURING PROCESS, 2017–2020 (KILOTON)
TABLE 211 SOUTH AMERICA: MARKET SIZE, BY MANUFACTURING PROCESS, 2021–2027 (KILOTON)
TABLE 212 SOUTH AMERICA: MARKET SIZE, BY MANUFACTURING PROCESS, 2017–2020 (USD MILLION)
TABLE 213 SOUTH AMERICA: MARKET SIZE, BY MANUFACTURING PROCESS, 2021–2027 (USD MILLION)
TABLE 214 SOUTH AMERICA: MARKET SIZE, BY APPLICATION, 2017–2020 (KILOTON)
TABLE 215 SOUTH AMERICA: MARKET SIZE, BY APPLICATION, 2021–2027 (KILOTON)
TABLE 216 SOUTH AMERICA: MARKET SIZE, BY APPLICATION, 2017–2020 (USD MILLION)
TABLE 217 SOUTH AMERICA: MARKET SIZE, BY APPLICATION, 2021–2027 (USD MILLION)
8.6.1 BRAZIL
8.6.1.1 Rising demand from automotive sector to support market growth
FIGURE 33 BRAZIL: TOTAL VEHICLE PRODUCTION, 2010–2021 (UNITS)
TABLE 218 BRAZIL: EPDM MARKET SIZE, BY APPLICATION, 2017–2020 (KILOTON)
TABLE 219 BRAZIL: MARKET SIZE, BY APPLICATION, 2021–2027 (KILOTON)
TABLE 220 BRAZIL: MARKET SIZE, BY APPLICATION, 2017–2020 (USD MILLION)
TABLE 221 BRAZIL: MARKET SIZE, BY APPLICATION, 2021–2027 (USD MILLION)
8.6.2 ARGENTINA
8.6.2.1 Sluggish growth of manufacturing sector to have negative impact on market
TABLE 222 ARGENTINA: EPDM MARKET SIZE, BY APPLICATION, 2017–2020 (KILOTON)
TABLE 223 ARGENTINA: MARKET SIZE, BY APPLICATION, 2021–2027 (KILOTON)
TABLE 224 ARGENTINA: MARKET SIZE, BY APPLICATION, 2017–2020 (USD MILLION)
TABLE 225 ARGENTINA: MARKET SIZE, BY APPLICATION, 2021–2027 (USD MILLION)
8.6.3 REST OF SOUTH AMERICA
TABLE 226 REST OF SOUTH AMERICA: EPDM MARKET SIZE, BY APPLICATION, 2017–2020 (KILOTON)
TABLE 227 REST OF SOUTH AMERICA: MARKET SIZE, BY APPLICATION, 2021–2027 (KILOTON)
TABLE 228 REST OF SOUTH AMERICA: MARKET SIZE, BY APPLICATION, 2017–2020 (USD MILLION)
TABLE 229 REST OF SOUTH AMERICA: EPDM MARKET SIZE, BY APPLICATION, 2021–2027 (USD MILLION)
9 COMPETITIVE LANDSCAPE (Page No. - 171)
9.1 INTRODUCTION
FIGURE 34 COMPANIES MAINLY ADOPTED ORGANIC GROWTH STRATEGIES BETWEEN 2018 AND 2021
9.2 REVENUE ANALYSIS
FIGURE 35 REVENUE ANALYSIS FOR KEY COMPANIES OVER PAST 5 YEARS
9.3 MARKET SHARE ANALYSIS
FIGURE 36 MARKET SHARE OF KEY PLAYERS, BY PRODUCTION CAPACITY, 2021
TABLE 230 EPDM MARKET: DEGREE OF COMPETITION
TABLE 231 STRATEGIC POSITIONING OF KEY PLAYERS
9.4 COMPANY EVALUATION MATRIX DEFINITION AND TECHNOLOGY
9.4.1 STAR
9.4.2 EMERGING LEADER
9.4.3 PERVASIVE
9.4.4 PARTICIPANT
FIGURE 37 EPDM MARKET: COMPANY EVALUATION MATRIX, 2021
9.5 STARTUPS AND SMALL AND MEDIUM-SIZED ENTERPRISES (SMES) EVALUATION MATRIX
9.5.1 RESPONSIVE COMPANIES
9.5.2 DYNAMIC COMPANIES
9.5.3 STARTING BLOCKS
FIGURE 38 START-UPS AND SMALL AND MEDIUM-SIZED ENTERPRISES (SMES) EVALUATION MATRIX, 2021
9.6 COMPETITIVE BENCHMARKING
TABLE 232 EPDM MARKET: DETAILED LIST OF KEY STARTUP/SMES
TABLE 233 MARKET: COMPETITIVE BENCHMARKING OF KEY PLAYERS [STARTUPS/SMES]
9.7 COMPANY PRODUCT FOOTPRINT
TABLE 234 COMPANY FOOTPRINT, BY APPLICATION
TABLE 235 COMPANY FOOTPRINT, BY REGION
9.8 KEY MARKET DEVELOPMENTS
9.8.1 NEW PRODUCT DEVELOPMENT
TABLE 236 NEW PRODUCT DEVELOPMENTS, 2018–2021
9.8.2 DEALS
TABLE 237 DEALS, 2018–2021
9.8.3 OTHERS
TABLE 238 OTHERS, 2018–2021
10 COMPANY PROFILES (Page No. - 184)
(Business overview, Products offered, Recent developments & MnM View)*
10.1 KEY PLAYERS
10.1.1 EXXON MOBIL CORPORATION
TABLE 239 EXXON MOBIL CORPORATION: COMPANY OVERVIEW
FIGURE 39 EXXON MOBIL CORPORATION: COMPANY SNAPSHOT
TABLE 240 EXXON MOBIL CORPORATION: PRODUCT OFFERINGS
TABLE 241 EXXON MOBIL CORPORATION: OTHERS
FIGURE 40 EXXON MOBIL CORPORATION’S CAPABILITIES IN EPDM MARKET
10.1.2 VERSALIS S.P.A
TABLE 242 VERSALIS S.P.A: COMPANY OVERVIEW
FIGURE 41 VERSALIS S.P.A: COMPANY SNAPSHOT
TABLE 243 VERSALIS S.P.A: PRODUCT OFFERINGS
TABLE 244 VERSALIS S.P.A: OTHERS
FIGURE 42 VERSALIS S.P.A’S CAPABILITIES IN MARKET
10.1.3 DOW INC.
TABLE 245 DOW INC.: COMPANY OVERVIEW
FIGURE 43 DOW INC.: COMPANY SNAPSHOT
TABLE 246 DOW INC.: PRODUCT OFFERINGS
TABLE 247 DOW INC.: OTHERS
TABLE 248 DOW INC.: PRODUCT LAUNCHES
FIGURE 44 DOW INC.’S CAPABILITIES IN MARKET
10.1.4 ARLANXEO
TABLE 249 ARLANXEO: COMPANY OVERVIEW
TABLE 250 ARLANXEO: PRODUCT OFFERINGS
TABLE 251 ARLANXEO: DEAL
TABLE 252 ARLANXEO: PRODUCT LAUNCHES
TABLE 253 ARLANXEO: OTHERS
FIGURE 45 ARLANXEO’S CAPABILITIES IN EPDM MARKET
10.1.5 PETROCHINA COMPANY LIMITED
TABLE 254 PETROCHINA COMPANY LIMITED: COMPANY OVERVIEW
FIGURE 46 PETROCHINA COMPANY LIMITED: COMPANY SNAPSHOT
TABLE 255 PETROCHINA COMPANY LIMITED: PRODUCT OFFERINGS
FIGURE 47 PETROCHINA’S CAPABILITIES IN MARKET
10.1.6 LION ELASTOMERS LLC
TABLE 256 LION ELASTOMERS LLC: COMPANY OVERVIEW
TABLE 257 LION ELASTOMERS LLC: PRODUCT OFFERINGS
10.1.7 SK GLOBAL CHEMICAL CO., LTD
TABLE 258 SK GLOBAL CHEMICAL CO., LTD: COMPANY OVERVIEW
TABLE 259 SK GLOBAL CHEMICAL CO., LTD: PRODUCT OFFERINGS
TABLE 260 SK GLOBAL CHEMICAL CO., LTD: OTHERS
10.1.8 KUMHO POLYCHEM
TABLE 261 KUMHO POLYCHEM: COMPANY OVERVIEW
TABLE 262 KUMHO POLYCHEM: PRODUCT OFFERINGS
10.1.9 ENEOS HOLDING GROUP
TABLE 263 ENEOS HOLDING GROUP: COMPANY OVERVIEW
FIGURE 48 ENEOS HOLDING GROUP: COMPANY SNAPSHOT
TABLE 264 ENEOS HOLDING GROUP: PRODUCT OFFERINGS
TABLE 265 ENEOS HOLDING GROUP: DEALS
10.1.10 MITSUI CHEMICALS INC.
TABLE 266 MITSUI CHEMICALS INC.: COMPANY OVERVIEW
FIGURE 49 MITSUI CHEMICALS INC.: COMPANY SNAPSHOT
TABLE 267 MITSUI CHEMICALS INC.: PRODUCT OFFERINGS
10.1.11 CARLISLE COMPANIES INCORPORATED
TABLE 268 CARLISLE COMPANIES INCORPORATED: COMPANY OVERVIEW
FIGURE 50 CARLISLE COMPANIES INCORPORATED: COMPANY SNAPSHOT
TABLE 269 CARLISLE COMPANIES INCORPORATED: PRODUCT OFFERINGS
TABLE 270 CARLISLE COMPANIES INCORPORATED: PRODUCT LAUNCHES
10.1.12 PJSC NIZHNEKAMSKNEFTEKHIM
TABLE 271 PJSC NIZHNEKAMSKNEFTEKHIM: COMPANY OVERVIEW
FIGURE 51 PJSC NIZHNEKAMSKNEFTEKHIM: COMPANY SNAPSHOT
TABLE 272 PJSC NIZHNEKAMSKNEFTEKHIM: PRODUCT OFFERINGS
10.1.13 SABIC
TABLE 273 SABIC: COMPANY OVERVIEW
FIGURE 52 SABIC: COMPANY SNAPSHOT
TABLE 274 SABIC: PRODUCT OFFERINGS
*Details on Business overview, Products offered, Recent developments & MnM View might not be captured in case of unlisted companies.
10.2 OTHER PLAYERS
10.2.1 SHANGHAI SINOPEC MITSUI CHEMICALS, CO., LTD.
TABLE 275 SHANGHAI SINOPEC MITSUI CHEMICALS, CO., LTD.: COMPANY OVERVIEW
10.2.2 JIAXING RUNNING RUBBER &PLASTIC; CO., LTD
TABLE 276 JIAXING RUNNING RUBBER &PLASTIC; CO., LTD: COMPANY OVERVIEW
10.2.3 FIRESTONE BUILDING PRODUCTS
TABLE 277 FIRESTONE BUILDING PRODUCTS: COMPANY OVERVIEW
10.2.4 DENKA ELASTLUTION CO., LTD.
TABLE 278 DENKA ELASTLUTION CO., LTD.: COMPANY OVERVIEW
10.2.5 THE GOODYEAR TIRE AND RUBBER COMPANY
TABLE 279 THE GOODYEAR TIRE AND RUBBER COMPANY: COMPANY OVERVIEW
10.2.6 SUMITOMO BAKELITE COMPANY LIMITED
TABLE 280 SUMITOMO BAKELITE COMPANY LIMITED: COMPANY OVERVIEW
10.2.7 RABIGH REFINING AND PETROCHEMICAL COMPANY
TABLE 281 RABIGH REFINING AND PETROCHEMICAL COMPANY: COMPANY OVERVIEW
10.2.8 WEST AMERICAN RUBBER COMPANY LLC
TABLE 282 WEST AMERICAN RUBBER COMPANY LLC: COMPANY OVERVIEW
11 APPENDIX (Page No. - 223)
11.1 DISCUSSION GUIDE
11.2 KNOWLEDGE STORE: MARKETSANDMARKETS’ SUBSCRIPTION PORTAL
11.3 AVAILABLE CUSTOMIZATIONS
11.4 RELATED REPORTS
11.5 AUTHOR DETAILS
This research involves the use of extensive secondary sources and databases, such as Factiva and Bloomberg, to identify and collect information useful for a technical and market-oriented study of the EPDM market. Primary sources include industry experts from related industries and preferred suppliers, manufacturers, distributors, technologists, standards & certification organizations, and organizations related to all segments of the value chain of this industry. In-depth interviews have been conducted with various primary respondents, such as key industry participants, subject matter experts (SMEs), executives of key companies, and industry consultants to obtain and verify critical qualitative and quantitative information as well as to assess growth prospects.
Secondary Research
In the secondary research process, various sources such as annual reports, press releases, and investor presentations of companies; white papers; and publications from recognized websites and databases have been referred to for identifying and collecting information. Secondary research has been used to obtain key information about the industry's supply chain, the total pool of key players, market classification and segmentation according to the industry trends to the bottom-most level, regional markets, and key developments from both market-and technology-oriented perspectives.
Primary Research
The EPDM market comprises several stakeholders in the supply chain, which include suppliers, processors, and end-product manufacturers. Various primary sources from the supply and demand sides of the markets have been interviewed to obtain qualitative and quantitative information. The primary participants from the demand side include key opinion leaders, executives, vice presidents, and CEOs of companies in the EPDM market. Primary sources from the supply side include associations and institutions involved in the EPDM industry, key opinion leaders, and processing players.
Following is the breakdown of primary respondents—
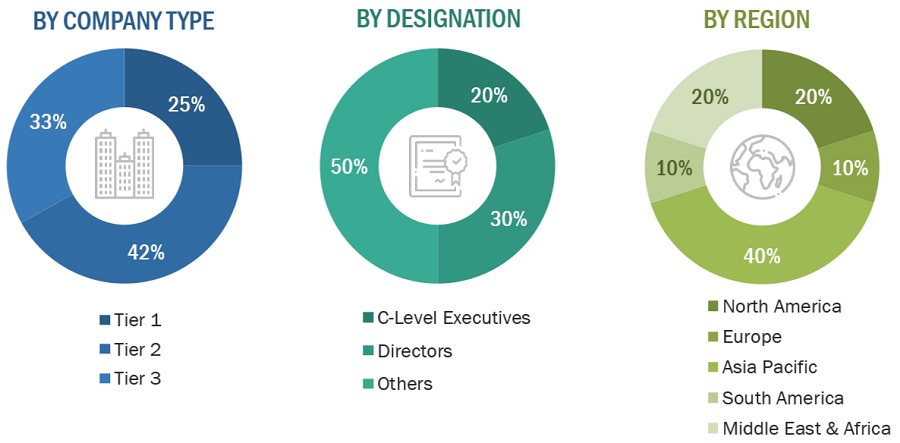
To know about the assumptions considered for the study, download the pdf brochure
Market Size Estimation
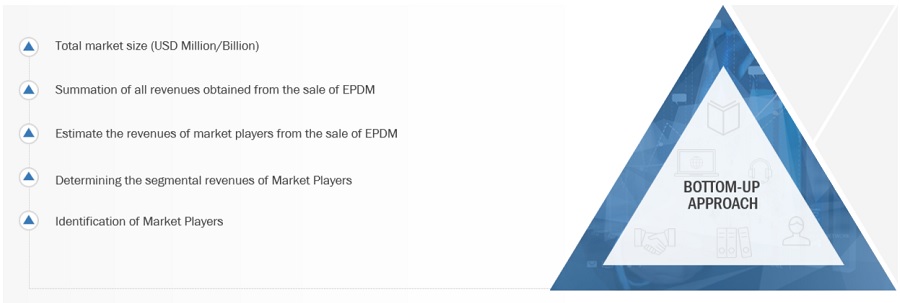
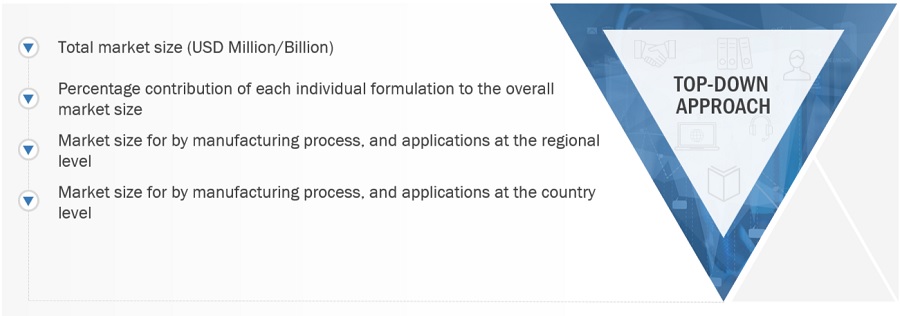
Both top-down and bottom-up approaches were used to estimate and validate the size of the global EPDM market. The research methodology used to estimate the market size includes the following:
- The key players in the industry were identified through extensive secondary research.
- The supply chain of the industry and market size, in terms of value, were determined through primary and secondary research.
- All percentage shares split, and breakdowns were determined using secondary sources and verified through primary sources.
- All possible parameters that affect the markets covered in this research study were accounted for, viewed in extensive detail, verified through primary research, and analyzed to obtain the final quantitative and qualitative data.
- The research includes the study of reports, reviews, and newsletters of key industry players along with extensive interviews with key officials, such as directors and marketing executives.
Data Triangulation
After arriving at the total market size from the estimation process explained above, the overall market was split into several segments and subsegments. To complete the overall market size estimation process and arrive at the exact statistics for all segments and subsegments, the data triangulation and market breakdown procedures have been employed, wherever applicable. The data have been triangulated by studying various factors and trends from both the demand and supply sides. In addition, the market size has been validated by using both the top-down and bottom-up approaches.
Report Objectives
- To define, describe, and forecast the global EPDM market in terms of both volume and value
- To provide insights regarding the significant factors influencing the growth of the market (drivers, restraints, opportunities, and challenges)
- To analyze and forecast the market based on application
- To analyze the impact of COVID-19 on the market
- To forecast the market size, in terms of volume and value, with respect to five main regions, namely, North America, Europe, Asia Pacific, the Middle East & Africa, and South America
- To analyze the opportunities in the market for stakeholders and provide details of the competitive landscape
- To strategically profile key players in the market
- To analyze competitive developments in the market, such as new product launch, capacity expansion, and merger & acquisition
- To strategically profile the leading players and comprehensively analyze their key developments, such as expansions and mergers & acquisitions, in the EPDM market
Available Customizations:
Along with the given market data, MarketsandMarkets offers customizations as per the specific needs of the companies. The following customization options are available for the report:
Product Analysis:
- Product Matrix which gives a detailed comparison of the product portfolio of each company
Regional Analysis:
- Further breakdown of the Rest of APAC EPDM market
- Further breakdown of Rest of Europe EPDM market
Company Information:
- Detailed analysis and profiling of additional market players (up to 5)
EPDM Rubber Market Overview
EPDM Rubber Market Trends
Top Companies in EPDM Rubber Market
EPDM Rubber Market Impact on Different Industries
Speak to our Analyst today to know more about EPDM Rubber Market!
Growth opportunities and latent adjacency in EPDM Market