Explainable AI Market

Explainable AI Market by Offering (Solutions & Services), Software Type (Standalone Software, Integrated Software, Automated Reporting Tools, Interactive Model Visualization), Methods, Vertical and Region - Global Forecast to 2028

Report Code: TC 8851 Nov, 2023, by marketsandmarkets.com

The Explainable AI Market is projected to grow by 20.9% resulting in a market value of $16.2 billion by 2028. The size value was USD 6.2 billion in 2023. There is growing interest in developing machine learning models that are inherently interpretable, such as decision trees or linear regression. These models naturally provide insights into their decision-making process.

Explainable AI Market

To know about the assumptions considered for the study, Request for Free Sample Report

Explainable AI Market

To know about the assumptions considered for the study, download the pdf brochure

Explainable AI Market Dynamics

Driver:  Industry 4.0 Driving Demand for Explainable AI

The convergence of advanced technologies and digital transformation, often referred to as Industry 4.0, is a driving force behind the demand for Explainable AI. This trend has led to the successful transformation of various industries by embracing digital technologies. The integration of AI and XAI methods with Industry 4.0 technologies enables accurate and high-quality applications, making organizations more agile and customer focused. Industry 4.0 leverages AI for predictive maintenance and fault detection, reducing unplanned downtime. With XAI, operators can comprehend the reasoning behind AI's predictions and recommendations. This transparency is crucial for maintenance personnel, allowing them to make informed decisions about when and how to perform maintenance activities.

Restraint: Shortage of skilled XAI professionals

The shortage of skilled professionals in the field of Explainable AI (XAI) is a growing concern in the AI industry. As the demand for transparent and interpretable AI systems continues to rise, there is a pressing need for individuals with the expertise to develop, implement, and maintain XAI solutions. Skilled XAI professionals possess a deep understanding of complex AI models and are proficient in the design of techniques and tools that can render these models more transparent and interpretable. However, the scarcity of such experts can impede the effective integration of XAI in various industries, limiting the broader adoption of ethical and accountable AI systems.

Opportunity: Enhanced Decision Support

XAI provides an opportunity to improve decision support systems across various domains. By offering transparent and interpretable insights into AI-driven decisions, XAI can empower decision-makers to make more informed choices. This is particularly beneficial in healthcare, where clinicians can use XAI to understand the reasoning behind AI-assisted diagnoses or treatment recommendations. Similarly, in financial services, XAI can aid in risk assessment and investment decisions, with clear explanations for model-driven predictions, enabling professionals to understand and trust the AI's guidance. XAI provides interpretable insights into AI-driven recommendations and decisions.

Challenge: Complexity of AI models

AI models evolve over time to meet the needs of organizations. The demand for more effective decision-making can lead to the adoption of increasingly complex AI models that are difficult to explain. XAI systems must be continuously improved to keep pace with these changes and maintain the ability to provide meaningful explanations for AI decisions. This requires ongoing research and development to ensure that XAI techniques can effectively address the challenges posed by complex and evolving AI models. AI models, particularly deep neural networks, pose a formidable challenge for Explainable AI (XAI).

Explainable AI Market Ecosystem

Explainable AI Market

By Methods, the Model-Specific Methods segment is to grow at the largest market size during the forecast period.

Model-specific methods are tailored to specific machine learning models or algorithms. Companies use these techniques when they have in-depth knowledge of the model and can modify it for enhanced interpretability. Decision trees inherently offer transparency as they represent a series of decisions and outcomes. Companies may choose to use decision trees or rule-based models in scenarios where transparency is of utmost importance.

By Software Type, the Standalone Software segment is to grow at the largest market size during the forecast period.

Standalone Explainable AI software is designed to be a dedicated, independent tool for making AI models more interpretable and understandable. This software typically focuses on post hoc interpretability, meaning it can be applied to existing AI models without requiring changes to the model's architecture. These tools often offer a range of interpretability techniques, such as feature importance analysis, saliency maps, and rule-based explanations. They provide users with in-depth insights into the model's predictions and decision-making processes.

North America to account for the largest market size during the forecast period.

By region, North America is one of the leading explainable AI markets in terms of share. North America, particularly the United States and Canada, has seen the introduction of regulations that emphasize the importance of transparency in AI systems, especially in sensitive sectors like finance, healthcare, and law enforcement. Government regulations such as the Algorithmic Accountability Act and the proposed Algorithmic Justice and Online Platform Transparency Act in the U.S. have propelled organizations to invest in Explainable AI technologies to comply with these laws.

Explainable AI Market Size, and Share

Key Market Players

The Explainable AI vendors have implemented various types of organic and inorganic growth strategies, such as new product launches, product upgrades, partnerships and agreements, business expansions, and mergers and acquisitions to strengthen their offerings in the market. The major vendors in the global Explainable AI market include Microsoft (US), IBM (US), Google (US), Salesforce (US),Intel Corporation(US), NVIDIA(US), SAS Institute(US), Alteryx(US), AWS(US), Equifax(US), FICO(US), Temenos(Switzerland),Mphasis(India), C3.AI(US), H2O.ai(US), Fiddler(US), Zest AI(US), Seldon(London), Squirro(Switzerland), Kyndi(US), DataRobot(US),Databricks(US), Tredence(US), DarwinAI(Canada), Tensor AI solutions(Germany), . EXPAI(Spain), Abzu(Denmark), Arthur(US), and Intellico(Italy).

Get online access to the report on the World's First Market Intelligence Cloud

  • Easy to Download Historical Data & Forecast Numbers
  • Company Analysis Dashboard for high growth potential opportunities
  • Research Analyst Access for customization & queries
  • Competitor Analysis with Interactive dashboard
  • Latest News, Updates & Trend analysis
Request Sample

Scope of the Report

Report Metrics

Details

Market size available for years

2018–2028

Base year considered

2022

Forecast period

2023–2028

Forecast units

USD Million/Billion

Segments Covered

By Offering, Software Type, Methods, Vertical, and Region

Geographies covered

North America, Europe, Asia Pacific, Middle East & Africa, and Latin America

Companies covered

Microsoft (US), IBM (US), Google (US), Salesforce (US), Intel Corporation(US), NVIDIA(US), SAS Institute(US), Alteryx(US), AWS(US), Equifax(US), FICO(US), Temenos(Switzerland), Mphasis(India), C3.AI(US), H2O.ai(US), Fiddler(US), Zest AI(US), Seldon(London), Squirro(Switzerland), Kyndi(US), DataRobot(US), Databricks(US), Tredence(US), DarwinAI(Canada), Tensor AI solutions(Germany),. EXPAI(Spain), Abzu(Denmark), Arthur(US), and Intellico(Italy).

This research report categorizes the explainable AI market based on offering, software type, methods, vertical, and region.

By Offering:
  • Solutions
    • Solution By Type
    • Solution By Deployment Mode
  • Services
    • Consulting Services
    • Deployment and Integration Services
    • Training and Education Services
    • Post-Implementation Support
    • Data Science Advisory Services
    • AI/ML Research
    • AI/ML Enabled Services
    • Data Engineering Services
By Software Type:
  • Standalone Software
  • Integrated Software
  • Automated Reporting Tools
  • Interactive Model Visualization  
By Methods:
  • Model-Agnostic Methods
  • Model-Specific Methods
By Vertical:
  • BFSI
  • Retail & eCommerce
  • IT/ITeS
  • Healthcare & Life Sciences
  • Government & Public Sector
  • Media & Entertainment
  • Manufacturing
  • Energy & Utilities
  • Telecommunications
  • Other Verticals  
By Region:
  • North America
    • US
    • Canada
  • Europe
    • UK
    • Germany
    • France
    • Spain
    • Italy
    • Rest of Europe
  • Asia Pacific
    • China
    • Japan
    • India
    • Australia & New Zealand
    • South Korea
    • Rest of Asia Pacific
  • Middle East & Africa
    • UAE
    • Saudi Arabia
    • South Africa
    • Israel
    • Rest of Middle East & Africa
  • Latin America
    • Brazil
    • Mexico
    • Argentina
    • Rest of Latin America

Recent Developments:

  • In April 2023, Epic has strategic partnership with Microsoft, aiming to integrate generative AI technology into the healthcare domain. This expanded collaboration will harness the capabilities of the Azure OpenAI Service and Epic's widely recognized electronic health record (EHR) software, with the objective of delivering the advantages of AI to the healthcare industry.
  • In May 2023, SAP and IBM entered into a collaborative partnership where IBM's Watson technology will be seamlessly integrated into SAP's solutions. The goal of this integration is to empower users with advanced AI-driven insights and automation features.
  • In April 2023, Google announced the launch of new AI enables Claims Acceleration Suite to streamline health insurance prior authorization and claims processing.
  • In May 2023, Esquire Bank will use Salesforce Customer 360 to unify its customer data from across its various systems, including its core banking system, CRM system, and marketing automation system.
  • In May 2023, NVIDIA announced a collaboration with Microsoft to accelerate enterprise-ready generative AI. The collaboration involves integrating NVIDIA AI Enterprise software into Microsoft's Azure Machine Learning to help enterprises create AI models.
  • In January 2023, SAS Institute collaborated with Erasmus MC to develop an AI algorithm to predict whether patients should remain in the hospital after oncological surgery or could be safely dismissed.

Frequently Asked Questions (FAQ):

To speak to our analyst for a discussion on the above findings, click Speak to Analyst

TABLE OF CONTENTS
 
1 INTRODUCTION (Page No. - 29)
    1.1 STUDY OBJECTIVES 
    1.2 MARKET DEFINITION 
    1.3 STUDY SCOPE 
           1.3.1 MARKET SEGMENTATION
           1.3.2 INCLUSIONS & EXCLUSIONS
           1.3.3 REGIONS COVERED
    1.4 YEARS CONSIDERED 
    1.5 CURRENCY CONSIDERED 
           TABLE 1 USD EXCHANGE RATES, 2020–2022
    1.6 STAKEHOLDERS 
 
2 RESEARCH METHODOLOGY (Page No. - 34)
    2.1 RESEARCH DATA 
           FIGURE 1 RESEARCH DESIGN
           2.1.1 SECONDARY DATA
           2.1.2 PRIMARY DATA
                    TABLE 2 LIST OF PRIMARY INTERVIEWS
                    2.1.2.1 Breakup of primary profiles
                    2.1.2.2 Key industry insights
    2.2 MARKET FORECAST 
           TABLE 3 FACTOR ANALYSIS
    2.3 MARKET BREAKUP & DATA TRIANGULATION 
    2.4 MARKET SIZE ESTIMATION 
           FIGURE 2 TOP-DOWN AND BOTTOM-UP APPROACHES
           2.4.1 TOP-DOWN APPROACH
           2.4.2 BOTTOM-UP APPROACH
                    FIGURE 3 APPROACH 1 (SUPPLY SIDE): REVENUE OF SOLUTIONS/SERVICES OF EXPLAINABLE AI VENDORS
                    FIGURE 4 APPROACH 2, BOTTOM-UP (SUPPLY-SIDE): COLLECTIVE REVENUE FROM ALL SOLUTIONS/SERVICES OF EXPLAINABLE AI VENDORS
                    FIGURE 5 APPROACH 3, BOTTOM-UP (SUPPLY-SIDE): COLLECTIVE REVENUE FROM ALL SOLUTIONS/SERVICES OF EXPLAINABLE AI VENDORS
                    FIGURE 6 APPROACH 4, BOTTOM-UP (DEMAND-SIDE): SHARE OF EXPLAINABLE AI SOLUTIONS AND SERVICES THROUGH OVERALL SPENDING
    2.5 RESEARCH ASSUMPTIONS 
    2.6 LIMITATIONS AND RISK ASSESSMENT 
    2.7 IMPLICATIONS OF RECESSION ON EXPLAINABLE AI MARKET 
 
3 EXECUTIVE SUMMARY (Page No. - 46)
    TABLE 4 EXPLAINABLE AI MARKET SIZE AND GROWTH RATE, 2018–2022 (USD MILLION, Y-O-Y GROWTH) 
    TABLE 5 MARKET SIZE AND GROWTH RATE, 2023–2030 (USD BILLION, Y-O-Y GROWTH) 
    FIGURE 7 SOLUTIONS TO FORM LARGER MARKET IN 2023 
    FIGURE 8 DEPLOYMENT & INTEGRATION SERVICES TO LEAD MARKET FOR EXPLAINABLE AI SERVICES IN 2023 
    FIGURE 9 STANDALONE SOFTWARE TO DOMINATE MARKET IN 2023 
    FIGURE 10 ON-PREMISE DEPLOYMENT TO LEAD OVER CLOUD MARKET IN 2023 
    FIGURE 11 BFSI VERTICAL TO ACCOUNT FOR LARGEST MARKET IN 2023 
    FIGURE 12 NORTH AMERICA TO ACCOUNT FOR LARGEST SHARE IN 2023 
 
4 PREMIUM INSIGHTS (Page No. - 50)
    4.1 ATTRACTIVE OPPORTUNITIES FOR EXPLAINABLE AI MARKET PLAYERS 
           FIGURE 13 RISING INVESTMENTS IN EXPLAINABLE AI RESEARCH & DEVELOPMENT TO DRIVE MARKET GROWTH
    4.2 OVERVIEW OF RECESSION IN GLOBAL MARKET 
           FIGURE 14 MARKET TO WITNESS MINOR DECLINE IN Y-O-Y GROWTH IN 2023
    4.3 MARKET, BY VERTICAL 
           FIGURE 15 BFSI TO ACCOUNT FOR LARGEST MARKET DURING FORECAST PERIOD
    4.4 MARKET, BY KEY OFFERING AND VERTICAL 
           FIGURE 16 STANDALONE SOFTWARE AND BFSI TO LEAD RESPECTIVE SEGMENTS IN MARKET IN 2023
    4.5 MARKET, BY REGION 
           FIGURE 17 NORTH AMERICA TO DOMINATE MARKET IN 2023
 
5 MARKET OVERVIEW AND INDUSTRY TRENDS (Page No. - 53)
    5.1 INTRODUCTION 
    5.2 MARKET DYNAMICS 
           FIGURE 18 DRIVERS, RESTRAINTS, OPPORTUNITIES, AND CHALLENGES: EXPLAINABLE AI MARKET
           5.2.1 DRIVERS
                    5.2.1.1 Industry 4.0 driving demand for explainable AI
                    5.2.1.2 Adoption of deep learning and neural networks
                    5.2.1.3 Rise in technological advancements and innovations
           5.2.2 RESTRAINTS
                    5.2.2.1 Shortage of skilled XAI professionals
                    5.2.2.2 Data security concerns
           5.2.3 OPPORTUNITIES
                    5.2.3.1 Enhanced decision support
                    5.2.3.2 Ethical AI and fairness
                    5.2.3.3 Improved user adoption and collaboration
           5.2.4 CHALLENGES
                    5.2.4.1 Complexity of AI models
                    5.2.4.2 Concerns related to bias and inaccurately generated output
    5.3 EXPLAINABLE AI: EVOLUTION 
           FIGURE 19 EVOLUTION OF EXPLAINABLE AI
    5.4 EXPLAINABLE AI: ECOSYSTEM 
           FIGURE 20 EXPLAINABLE AI MARKET: ECOSYSTEM
           TABLE 6 MARKET: ECOSYSTEM
    5.5 CASE STUDY ANALYSIS 
           5.5.1 CASE STUDY 1: DARWINAI DELIVERED EXPLAINABLE AI USING OPENVINO TOOLKIT
           5.5.2 CASE STUDY 2: H20.AI AND WELLS FARGO HELPED TO MANAGE MACHINE LEARNING MODEL
           5.5.3 CASE STUDY 3: CONJURA REDUCED TIME TO DETECT AND RESOLVE MODEL DRIFT FROM DAYS TO HOURS WITH FIDDLER
           5.5.4 CASE STUDY 4: FICO HELPED NORTH AMERICAN BANK TO IMPROVE CREDIT RISK DECISIONS
           5.5.5 CASE STUDY 5: HOW.FM REDUCED TIME TO DETECT MODEL ISSUES FROM DAYS TO MINUTES
    5.6 TECHNOLOGY ANALYSIS 
           5.6.1 KEY TECHNOLOGIES
                    5.6.1.1 Machine Learning
                    5.6.1.2 NLP
                    5.6.1.3 Computer Vision
                    5.6.1.4 Big Data Analytics
           5.6.2 ADJACENT TECHNOLOGIES
                    5.6.2.1 IoT
                    5.6.2.2 AutoML
                    5.6.2.3 Blockchain
                    5.6.2.4 Conversational AI
                    5.6.2.5 Knowledge Graph
    5.7 SUPPLY/VALUE CHAIN ANALYSIS 
           FIGURE 21 SUPPLY/VALUE CHAIN ANALYSIS
    5.8 PORTER’S FIVE FORCES ANALYSIS 
           FIGURE 22 EXPLAINABLE AI MARKET: PORTER’S FIVE FORCES ANALYSIS
           TABLE 7 MARKET: PORTER’S FIVE FORCES ANALYSIS
           5.8.1 THREAT OF NEW ENTRANTS
           5.8.2 THREAT OF SUBSTITUTES
           5.8.3 BARGAINING POWER OF SUPPLIERS
           5.8.4 BARGAINING POWER OF BUYERS
           5.8.5 INTENSITY OF COMPETITIVE RIVALRY
    5.9 PRICING MODEL ANALYSIS 
           5.9.1 SELLING PRICES OF KEY PLAYERS, BY OFFERING
                    FIGURE 23 SELLING PRICES OF KEY PLAYERS, BY OFFERING
                    TABLE 8 SELLING PRICES OF KEY PLAYERS, BY OFFERING (USD)
    5.10 PATENT ANALYSIS 
           5.10.1 METHODOLOGY
           5.10.2 DOCUMENT TYPE
                    TABLE 9 PATENTS FILED, 2013–2023
           5.10.3 INNOVATION AND PATENT APPLICATIONS
                    FIGURE 24 TOTAL NUMBER OF PATENTS GRANTED ANNUALLY, 2013–2023
                    5.10.3.1 Top applicants
                               FIGURE 25 TOP TEN COMPANIES WITH HIGHEST NUMBER OF PATENT APPLICATIONS, 2013–2023
                               TABLE 10 TOP 20 PATENT OWNERS IN EXPLAINABLE AI MARKET, 2013–2023
                               TABLE 11 LIST OF MAJOR PATENTS IN MARKET, 2021–2023
    5.11 KEY CONFERENCES & EVENTS IN 2023–2024 
                    TABLE 12 MARKET: LIST OF CONFERENCES & EVENTS
    5.12 TARIFF AND REGULATORY LANDSCAPE 
           5.12.1 REGULATORY BODIES, GOVERNMENT AGENCIES, AND OTHER ORGANIZATIONS
                    TABLE 13 NORTH AMERICA: LIST OF REGULATORY BODIES, GOVERNMENT AGENCIES, AND OTHER ORGANIZATIONS
                    TABLE 14 EUROPE: LIST OF REGULATORY BODIES, GOVERNMENT AGENCIES, AND OTHER ORGANIZATIONS
                    TABLE 15 ASIA PACIFIC: LIST OF REGULATORY BODIES, GOVERNMENT AGENCIES, AND OTHER ORGANIZATIONS
                    TABLE 16 MIDDLE EAST & AFRICA: LIST OF REGULATORY BODIES, GOVERNMENT AGENCIES, AND OTHER ORGANIZATIONS
                    TABLE 17 LATIN AMERICA: LIST OF REGULATORY BODIES, GOVERNMENT AGENCIES, AND OTHER ORGANIZATIONS
    5.13 TRENDS/DISRUPTIONS IMPACTING BUYERS/CLIENTS IN EXPLAINABLE AI MARKET 
                    FIGURE 26 MARKET: TRENDS/DISRUPTIONS IMPACTING BUYERS/CLIENTS
    5.14 KEY STAKEHOLDERS AND BUYING CRITERIA 
           5.14.1 KEY STAKEHOLDERS IN BUYING PROCESS
                    FIGURE 27 INFLUENCE OF STAKEHOLDERS ON BUYING PROCESS FOR TOP THREE VERTICALS
                    TABLE 18 INFLUENCE OF STAKEHOLDERS ON BUYING PROCESS FOR TOP THREE VERTICALS (%)
           5.14.2 BUYING CRITERIA
                    FIGURE 28 KEY BUYING CRITERIA FOR TOP THREE VERTICALS
                    TABLE 19 KEY BUYING CRITERIA FOR TOP THREE VERTICALS
    5.15 BEST PRACTICES IN MARKET 
           5.15.1 UNDERSTAND NEED FOR EXPLANATION
           5.15.2 INTERPRETABLE MODELS
           5.15.3 ETHICAL CONSIDERATIONS
           5.15.4 USER-CENTRIC DESIGN
           5.15.5 TRANSPARENCY AND DOCUMENTATION
    5.16 TECHNOLOGY ROADMAP OF EXPLAINABLE AI MARKET 
                    FIGURE 29 TECHNOLOGY ROADMAP OF MARKET, 2023–2030
                    TABLE 20 TECHNOLOGY ROADMAP OF MARKET, 2023–2030
    5.17 PILLARS/PRINCIPLES OF EXPLAINABLE AI 
           5.17.1 INFORM SUBJECT OF ALGORITHM
           5.17.2 BUILD SOCIETAL TRUST IN AI SYSTEMS
           5.17.3 SATISFY COMPLIANCE OR REGULATORY REQUIREMENTS
           5.17.4 ASSIST WITH FURTHER SYSTEM DEVELOPMENT
           5.17.5 BENEFIT ALGORITHM’S OWNER
 
6 EXPLAINABLE AI MARKET, BY OFFERING (Page No. - 83)
    6.1 INTRODUCTION 
           6.1.1 OFFERING: MARKET DRIVERS
                    FIGURE 30 EXPLAINABLE AI SERVICES TO REGISTER HIGHER CAGR DURING FORECAST PERIOD
                    TABLE 21 MARKET, BY OFFERING, 2018–2022 (USD MILLION)
                    TABLE 22 MARKET, BY OFFERING, 2023–2028 (USD MILLION)
    6.2 SOLUTIONS, BY TYPE 
           FIGURE 31 SOFTWARE TOOLKITS & FRAMEWORKS TO GROW AT HIGHER CAGR DURING FORECAST PERIOD
           TABLE 23 EXPLAINABLE AI SOLUTIONS MARKET, BY TYPE, 2018–2022 (USD MILLION)
           TABLE 24 EXPLAINABLE AI SOLUTIONS MARKET, BY TYPE, 2023–2028 (USD MILLION)
           6.2.1 SOFTWARE PLATFORMS
                    6.2.1.1 Explainable AI software platforms to allow users to continuously monitor behavior of AI models in real time
                               TABLE 25 SOFTWARE PLATFORMS: MARKET, BY REGION, 2018–2022 (USD MILLION)
                               TABLE 26 SOFTWARE PLATFORMS: MARKET, BY REGION, 2023–2028 (USD MILLION)
           6.2.2 SOFTWARE TOOLKITS & FRAMEWORKS
                    6.2.2.1 Software toolkits & frameworks for explainable AI to be more developer-centric
                               TABLE 27 SOFTWARE TOOLKITS & FRAMEWORKS: MARKET, BY REGION, 2018–2022 (USD MILLION)
                               TABLE 28 SOFTWARE TOOLKITS & FRAMEWORKS: MARKET, BY REGION, 2023–2028 (USD MILLION)
    6.3 SOLUTIONS, BY DEPLOYMENT MODE 
           FIGURE 32 CLOUD TO GROW AT HIGHER CAGR DURING FORECAST PERIOD
           TABLE 29 EXPLAINABLE AI SOLUTIONS MARKET, BY DEPLOYMENT MODE, 2018–2022 (USD MILLION)
           TABLE 30 EXPLAINABLE AI SOLUTIONS MARKET, BY DEPLOYMENT MODE, 2023–2028 (USD MILLION)
           6.3.1 CLOUD
                    6.3.1.1 Cloud-based explainable AI solutions to enable to process large datasets and complex models efficiently
                               TABLE 31 CLOUD: EXPLAINABLE AI MARKET, BY REGION, 2018–2022 (USD MILLION)
                               TABLE 32 CLOUD: MARKET, BY REGION, 2023–2028 (USD MILLION)
           6.3.2 ON-PREMISES
                    6.3.2.1 On-premises explainable AI solutions to be customizable and configurable to align with organization’s unique infrastructure and security policies
                               TABLE 33 ON-PREMISES: MARKET, BY REGION, 2018–2022 (USD MILLION)
                               TABLE 34 ON-PREMISES: MARKET, BY REGION, 2023–2028 (USD MILLION)
    6.4 SERVICES 
           FIGURE 33 DATA ENGINEERING TO GROW AT HIGHEST CAGR DURING FORECAST PERIOD
           TABLE 35 MARKET, BY SERVICE, 2018–2022 (USD MILLION)
           TABLE 36 MARKET, BY SERVICE, 2023–2028 (USD MILLION)
           6.4.1 CONSULTING
                    6.4.1.1 Consulting firms to guide businesses in making informed decisions about explainable AI adoption
                               TABLE 37 CONSULTING: MARKET, BY REGION, 2018–2022 (USD MILLION)
                               TABLE 38 CONSULTING: MARKET, BY REGION, 2023–2028 (USD MILLION)
           6.4.2 DEPLOYMENT & INTEGRATION
                    6.4.2.1 Deployment & integration services to be crucial for implementing explainable AI solutions seamlessly
                               TABLE 39 DEPLOYMENT & INTEGRATION: MARKET, BY REGION, 2018–2022 (USD MILLION)
                               TABLE 40 DEPLOYMENT & INTEGRATION: MARKET, BY REGION, 2023–2028 (USD MILLION)
           6.4.3 TRAINING & EDUCATION
                    6.4.3.1 By providing ongoing education, explainable AI vendors to contribute to transparent and responsible AI ecosystem
                               TABLE 41 TRAINING & EDUCATION: EXPLAINABLE AI MARKET, BY REGION, 2018–2022 (USD MILLION)
                               TABLE 42 TRAINING & EDUCATION: MARKET, BY REGION, 2023–2028 (USD MILLION)
           6.4.4 POST-IMPLEMENTATION SUPPORT
                    6.4.4.1 Post-implementation support to involve monitoring and maintaining models to prevent model drift and data biases
                               TABLE 43 POST-IMPLEMENTATION SUPPORT: MARKET, BY REGION, 2018–2022 (USD MILLION)
                               TABLE 44 POST-IMPLEMENTATION SUPPORT: MARKET, BY REGION, 2023–2028 (USD MILLION)
           6.4.5 DATA SCIENCE ADVISORY
                    6.4.5.1 Data science advisory services in explainable AI domain to involve various aspects of AI and machine learning
                               TABLE 45 DATA SCIENCE ADVISORY: MARKET, BY REGION, 2018–2022 (USD MILLION)
                               TABLE 46 DATA SCIENCE ADVISORY: MARKET, BY REGION, 2023–2028 (USD MILLION)
           6.4.6 AI/ML RESEARCH
                    6.4.6.1 Companies to frequently engage in AI and ML research to stay at forefront of technological advancements
                               TABLE 47 AI/ML RESEARCH: MARKET, BY REGION, 2018–2022 (USD MILLION)
                               TABLE 48 AI/ML RESEARCH: MARKET, BY REGION, 2023–2028 (USD MILLION)
           6.4.7 AI/ML-ENABLED SERVICES
                    6.4.7.1 AI/ML-enabled services to emphasize on transparency and interpretability
                               TABLE 49 AI/ML-ENABLED SERVICES: MARKET, BY REGION, 2018–2022 (USD MILLION)
                               TABLE 50 AI/ML-ENABLED SERVICES: MARKET, BY REGION, 2023–2028 (USD MILLION)
           6.4.8 DATA ENGINEERING
                    6.4.8.1 Effective data engineering to lay foundation for successful AI and explainable AI implementations
                               TABLE 51 DATA ENGINEERING: MARKET, BY REGION, 2018–2022 (USD MILLION)
                               TABLE 52 DATA ENGINEERING: MARKET, BY REGION, 2023–2028 (USD MILLION)
 
7 EXPLAINABLE AI MARKET, BY SOFTWARE TYPE (Page No. - 101)
    7.1 INTRODUCTION 
           7.1.1 SOFTWARE TYPE: MARKET DRIVERS
                    FIGURE 34 STANDALONE SOFTWARE TO REGISTER HIGHEST CAGR DURING FORECAST PERIOD
                    TABLE 53 MARKET, BY SOFTWARE TYPE, 2018–2022 (USD MILLION)
                    TABLE 54 MARKET, BY SOFTWARE TYPE, 2023–2028 (USD MILLION)
    7.2 STANDALONE SOFTWARE 
           7.2.1 STANDALONE SOFTWARE TO TYPICALLY FOCUS ON POST HOC INTERPRETABILITY
                    TABLE 55 STANDALONE SOFTWARE: MARKET, BY REGION, 2018–2022 (USD MILLION)
                    TABLE 56 STANDALONE SOFTWARE: MARKET, BY REGION, 2023–2028 (USD MILLION)
    7.3 INTEGRATED SOFTWARE 
           7.3.1 INTEGRATED EXPLAINABLE AI SOFTWARE TO WORK SEAMLESSLY WITHIN LARGER AI AND MACHINE LEARNING PLATFORMS OR WORKFLOWS
                    TABLE 57 INTEGRATED SOFTWARE: MARKET, BY REGION, 2018–2022 (USD MILLION)
                    TABLE 58 INTEGRATED SOFTWARE: MARKET, BY REGION, 2023–2028 (USD MILLION)
    7.4 AUTOMATED REPORTING TOOLS 
           7.4.1 AUTOMATED REPORTING TOOLS TO BE INVALUABLE FOR ORGANIZATIONS THAT NEED TO SHARE AI INSIGHTS WITH REGULATORY BODIES
                    TABLE 59 AUTOMATED REPORTING TOOLS: MARKET, BY REGION, 2018–2022 (USD MILLION)
                    TABLE 60 AUTOMATED REPORTING TOOLS: MARKET, BY REGION, 2023–2028 (USD MILLION)
    7.5 INTERACTIVE MODEL VISUALIZATION 
           7.5.1 INTERACTIVE MODEL VISUALIZATION SOFTWARE TO ALLOW USERS TO VISUALIZE MODEL INPUTS, OUTPUTS, AND INTERMEDIATE LAYERS IN REAL TIME
                    TABLE 61 INTERACTIVE MODEL VISUALIZATION: MARKET, BY REGION, 2018–2022 (USD MILLION)
                    TABLE 62 INTERACTIVE MODEL VISUALIZATION: MARKET, BY REGION, 2023–2028 (USD MILLION)
 
8 EXPLAINABLE AI MARKET, BY METHOD (Page No. - 108)
    8.1 INTRODUCTION 
           8.1.1 METHOD: MARKET DRIVERS
                    FIGURE 35 MODEL-AGNOSTIC METHODS TO WITNESS HIGHER GROWTH RATE DURING FORECAST PERIOD
                    TABLE 63 MARKET, BY METHOD, 2018–2022 (USD MILLION)
                    TABLE 64 MARKET, BY METHOD, 2023–2028 (USD MILLION)
    8.2 MODEL-AGNOSTIC METHODS 
           8.2.1 COMPANIES TO UTILIZE MODEL-AGNOSTIC METHODS TO MAKE AI MODELS MORE INTERPRETABLE AND BUILD TRUST WITH USERS AND STAKEHOLDERS
                    TABLE 65 MODEL-AGNOSTIC METHODS: MARKET, BY REGION, 2018–2022 (USD MILLION)
                    TABLE 66 MODEL-AGNOSTIC METHODS: MARKET, BY REGION, 2023–2028 (USD MILLION)
    8.3 MODEL-SPECIFIC METHODS 
           8.3.1 COMPANIES TO USE THESE TECHNIQUES WHEN THEY HAVE IN-DEPTH KNOWLEDGE OF MODEL AND CAN MODIFY IT FOR ENHANCED INTERPRETABILITY
                    TABLE 67 MODEL-SPECIFIC METHODS: MARKET, BY REGION, 2018–2022 (USD MILLION)
                    TABLE 68 MODEL-SPECIFIC METHODS: MARKET, BY REGION, 2023–2028 (USD MILLION)
 
9 EXPLAINABLE AI MARKET, BY VERTICAL (Page No. - 113)
    9.1 INTRODUCTION 
           9.1.1 VERTICAL: MARKET DRIVERS
                    FIGURE 36 HEALTHCARE & LIFE SCIENCES TO WITNESS HIGHEST GROWTH RATE DURING FORECAST PERIOD
                    TABLE 69 MARKET, BY VERTICAL, 2018–2022 (USD MILLION)
                    TABLE 70 MARKET, BY VERTICAL, 2023–2028 (USD MILLION)
    9.2 BFSI 
           TABLE 71 BFSI: MARKET, BY REGION, 2018–2022 (USD MILLION)
           TABLE 72 BFSI: MARKET, BY REGION, 2023–2028 (USD MILLION)
           9.2.1 CREDIT SCORING AND LOAN APPROVALS
                    9.2.1.1 Explainable AI to play vital role in providing clear understanding of factors influencing customers’ creditworthiness
           9.2.2 FRAUD DETECTION AND PREVENTION
                    9.2.2.1 Explainable AI models to provide insights into features and patterns that contributed to transactions being labeled as suspicious
           9.2.3 RISK ASSESSMENT IN INVESTMENTS
                    9.2.3.1 Explainable AI crucial for enabling investors and asset managers to make informed decisions
           9.2.4 CUSTOMER SERVICE AND QUERIES
                    9.2.4.1 Explainable AI to assist in improving the overall customer experience and satisfaction
           9.2.5 BIAS DETECTION AND MITIGATION
                    9.2.5.1 Explainable AI to help BFSI organizations mitigate reputational risks associated with biased or unfair practices
           9.2.6 OTHERS
    9.3 RETAIL & ECOMMERCE 
           TABLE 73 RETAIL & ECOMMERCE: EXPLAINABLE AI MARKET, BY REGION, 2018–2022 (USD MILLION)
           TABLE 74 RETAIL & ECOMMERCE: MARKET, BY REGION, 2023–2028 (USD MILLION)
           9.3.1 CUSTOMER BEHAVIOR ANALYSIS
                    9.3.1.1 Explainable AI to play crucial role in retail business by providing interpretable insights on customer behavior
           9.3.2 DYNAMIC PRICING STRATEGIES
                    9.3.2.1 Explainable AI algorithms to help customers understand rationale behind price changes
           9.3.3 SUPPLY CHAIN OPTIMIZATION
                    9.3.3.1 Explainable AI to optimize supply chains by providing transparency into decision-making processes
           9.3.4 PRODUCT RECOMMENDATIONS
                    9.3.4.1 Explainable AI to help by providing clear and understandable justifications for product recommendations made to customers
           9.3.5 OTHERS
    9.4 GOVERNMENT & PUBLIC SECTOR 
           TABLE 75 GOVERNMENT & PUBLIC SECTOR: MARKET, BY REGION, 2018–2022 (USD MILLION)
           TABLE 76 GOVERNMENT & PUBLIC SECTOR: MARKET, BY REGION, 2023–2028 (USD MILLION)
           9.4.1 POLICY DECISION SUPPORT
                    9.4.1.1 Explainable AI to be able to identify potential biases in policy recommendations, ensuring fairness and equitability
           9.4.2 TRAFFIC AND URBAN PLANNING
                    9.4.2.1 Explainable AI to assist in predictive modeling for future urban development by highlighting environmental and societal impact of various scenarios
           9.4.3 ECOSYSTEM MONITORING
                    9.4.3.1 Explainable AI to help identify factors influencing species population dynamics, supporting more effective conservation strategies
           9.4.4 PREDICTIVE POLICING
                    9.4.4.1 Explainable AI to enhance predictive policing models
           9.4.5 OTHERS
    9.5 HEALTHCARE & LIFE SCIENCES 
           TABLE 77 HEALTHCARE & LIFE SCIENCES: EXPLAINABLE AI MARKET, BY REGION, 2018–2022 (USD MILLION)
           TABLE 78 HEALTHCARE & LIFE SCIENCES: MARKET, BY REGION, 2023–2028 (USD MILLION)
           9.5.1 MEDICAL DIAGNOSTICS AND IMAGING
                    9.5.1.1 Explainable AI to reduce errors, improve clinical confidence, and ultimately enhance patient care
           9.5.2 DRUG DISCOVERY AND DEVELOPMENT
                    9.5.2.1 Explainable AI to optimize process of identifying potential drug candidates
           9.5.3 PERSONALIZED MEDICINE
                    9.5.3.1 Explainable AI to enhance patient and clinician trust in personalized treatment plans
           9.5.4 CLINICAL TRIAL ELIGIBILITY
                    9.5.4.1 Explainable AI to demystify black-box nature of machine learning models
           9.5.5 MODEL TRANSPARENCY AND DEBUGGING
                    9.5.5.1 By enhancing model transparency and facilitating debugging, explainable AI to bolster confidence of healthcare practitioners
           9.5.6 OTHERS
    9.6 MANUFACTURING 
           TABLE 79 MANUFACTURING: MARKET, BY REGION, 2018–2022 (USD MILLION)
           TABLE 80 MANUFACTURING: MARKET, BY REGION, 2023–2028 (USD MILLION)
           9.6.1 PRODUCTION LINE OPTIMIZATION
                    9.6.1.1 Explainable AI to identify patterns leading to machine breakdowns or suboptimal performance
           9.6.2 RESOURCE ALLOCATION
                    9.6.2.1 Explainable AI to explain why energy usage fluctuates and how it is influenced by production volume and machine settings
           9.6.3 CUSTOM PRODUCT DESIGN
                    9.6.3.1 Explainable AI to facilitate better collaboration between manufacturers and their clients
           9.6.4 SUPPLIER SELECTION
                    9.6.4.1 Explainable AI to assist in risk assessment and highlight potential red flags in supplier’s track record
           9.6.5 OTHERS
    9.7 ENERGY & UTILITIES 
           TABLE 81 ENERGY & UTILITIES: EXPLAINABLE AI MARKET, BY REGION, 2018–2022 (USD MILLION)
           TABLE 82 ENERGY & UTILITIES: MARKET, BY REGION, 2023–2028 (USD MILLION)
           9.7.1 GRID MANAGEMENT
                    9.7.1.1 Explainable AI to help investigate root causes, which is crucial for post-incident analysis and continuous improvement in grid management
           9.7.2 RENEWABLE ENERGY FORECASTING
                    9.7.2.1 Explainable AI to enhance trustworthiness of forecasts by providing clear insights into features and data points
           9.7.3 ENERGY CONSUMPTION ANALYSIS
                    9.7.3.1 Explainable AI to assist by providing transparency in energy consumption analysis
           9.7.4 ASSET MAINTENANCE OPTIMIZATION
                    9.7.4.1 AI to help build trust among stakeholders and make it easier to justify maintenance decisions to regulators and public
           9.7.5 OTHERS
    9.8 TELECOMMUNICATIONS 
           TABLE 83 TELECOMMUNICATIONS: MARKET, BY REGION, 2018–2022 (USD MILLION)
           TABLE 84 TELECOMMUNICATIONS: MARKET, BY REGION, 2023–2028 (USD MILLION)
           9.8.1 NETWORK MANAGEMENT
                    9.8.1.1 Explainable AI to help telecom operators better understand and optimize their network performance
           9.8.2 SERVICE PLAN RECOMMENDATIONS
                    9.8.2.1 Explainable AI to enhance personalization and customer experience
           9.8.3 CHURN PREDICTION AND RETENTION
                    9.8.3.1 Explainable AI to help craft personalized retention strategies
           9.8.4 QUALITY OF SERVICE (QOS) OPTIMIZATION
                    9.8.4.1 Explainable AI to provide transparency and insights into decision-making processes behind QoS optimization
           9.8.5 OTHERS
    9.9 MEDIA & ENTERTAINMENT 
           TABLE 85 MEDIA & ENTERTAINMENT: EXPLAINABLE AI MARKET, BY REGION, 2018–2022 (USD MILLION)
           TABLE 86 MEDIA & ENTERTAINMENT: MARKET, BY REGION, 2023–2028 (USD MILLION)
           9.9.1 CONTENT RECOMMENDATIONS
                    9.9.1.1 Explainable AI to provide transparent recommendations to users in media & entertainment space
           9.9.2 COPYRIGHT INFRINGEMENT DETECTION
                    9.9.2.1 Explainable AI to help educate content creators and users about copyright laws and best practices
           9.9.3 VIRTUAL REALITY AND GAMING
                    9.9.3.1 Explainable AI to offer players insights into how their in-game decisions affect outcomes and provide them with guidance on strategies or tactics
           9.9.4 AUDIENCE INSIGHTS
                    9.9.4.1 Explainable AI to help derive meaningful insights from large datasets, shedding light on viewer preferences and behavior
           9.9.5 OTHERS
    9.10 IT & ITES 
           TABLE 87 IT & ITES: MARKET, BY REGION, 2018–2022 (USD MILLION)
           TABLE 88 IT & ITES: MARKET, BY REGION, 2023–2028 (USD MILLION)
           9.10.1 CODE REVIEW AND DEBUGGING
                    9.10.1.1 Explainable AI to improve code quality and accelerate debugging process by pinpointing root causes of issues
           9.10.2 SERVICE LEVEL AGREEMENTS (SLA) MANAGEMENT
                    9.10.2.1 Explainable AI to analyze service performance, offering explanations for any deviations from SLAs
           9.10.3 DATA SECURITY AND PRIVACY
                    9.10.3.1 Explainable AI to help monitor, detect, and explain potential security breaches or anomalies within data systems
           9.10.4 USER EXPERIENCE (UX) ENHANCEMENT
                    9.10.4.1 Explainable AI to analyze user interactions and preferences, providing interpretable insights
           9.10.5 OTHERS
    9.11 OTHER VERTICALS 
                    TABLE 89 OTHER VERTICALS: MARKET, BY REGION, 2018–2022 (USD MILLION)
                    TABLE 90 OTHER VERTICALS: MARKET, BY REGION, 2023–2028 (USD MILLION)
 
10 EXPLAINABLE AI MARKET, BY REGION (Page No. - 141)
     10.1 INTRODUCTION 
               FIGURE 37 AUSTRALIA & NEW ZEALAND TO ACHIEVE HIGHEST GROWTH DURING FORECAST PERIOD
               FIGURE 38 ASIA PACIFIC TO REGISTER HIGHEST CAGR DURING FORECAST PERIOD
               TABLE 91 MARKET, BY REGION, 2018–2022 (USD MILLION)
               TABLE 92 MARKET, BY REGION, 2023–2028 (USD MILLION)
     10.2 NORTH AMERICA 
             10.2.1 NORTH AMERICA: MARKET DRIVERS
             10.2.2 NORTH AMERICA: RECESSION IMPACT
                       FIGURE 39 NORTH AMERICA: MARKET SNAPSHOT
                       TABLE 93 NORTH AMERICA: MARKET, BY OFFERING, 2018–2022 (USD MILLION)
                       TABLE 94 NORTH AMERICA: EXPLAINABLE AI MARKET, BY OFFERING, 2023–2028 (USD MILLION)
                       TABLE 95 NORTH AMERICA: MARKET, BY SERVICE, 2018–2022 (USD MILLION)
                       TABLE 96 NORTH AMERICA: MARKET, BY SERVICE, 2023–2028 (USD MILLION)
                       TABLE 97 NORTH AMERICA: MARKET, BY SOLUTION, 2018–2022 (USD MILLION)
                       TABLE 98 NORTH AMERICA: MARKET, BY SOLUTION, 2023–2028 (USD MILLION)
                       TABLE 99 NORTH AMERICA: MARKET, BY SOFTWARE TYPE, 2018–2022 (USD MILLION)
                       TABLE 100 NORTH AMERICA: MARKET, BY SOFTWARE TYPE, 2023–2028 (USD MILLION)
                       TABLE 101 NORTH AMERICA: EXPLAINABLE AI SOLUTIONS MARKET, BY DEPLOYMENT MODE, 2018–2022 (USD MILLION)
                       TABLE 102 NORTH AMERICA: EXPLAINABLE AI SOLUTIONS MARKET, BY DEPLOYMENT MODE, 2023–2028 (USD MILLION)
                       TABLE 103 NORTH AMERICA: MARKET, BY METHOD, 2018–2022 (USD MILLION)
                       TABLE 104 NORTH AMERICA: MARKET, BY METHOD, 2023–2028 (USD MILLION)
                       TABLE 105 NORTH AMERICA: MARKET, BY VERTICAL, 2018–2022 (USD MILLION)
                       TABLE 106 NORTH AMERICA: MARKET, BY VERTICAL, 2023–2028 (USD MILLION)
                       TABLE 107 NORTH AMERICA: MARKET, BY COUNTRY, 2018–2022 (USD MILLION)
                       TABLE 108 NORTH AMERICA: MARKET, BY COUNTRY, 2023–2028 (USD MILLION)
             10.2.3 US
                       10.2.3.1 Initiatives by tech companies, research institutions, and venture capital firms toward AI technologies to drive market
                                   TABLE 109 US: EXPLAINABLE AI MARKET, BY OFFERING, 2018–2022 (USD MILLION)
                                   TABLE 110 US: MARKET, BY OFFERING, 2023–2028 (USD MILLION)
                                   TABLE 111 US: EXPLAINABLE AI SOLUTIONS MARKET, BY DEPLOYMENT MODE, 2018–2022 (USD MILLION)
                                   TABLE 112 US: EXPLAINABLE AI SOLUTIONS MARKET, BY DEPLOYMENT MODE, 2023–2028 (USD MILLION)
                                   TABLE 113 US: MARKET, BY METHOD, 2018–2022 (USD MILLION)
                                   TABLE 114 US: MARKET, BY METHOD, 2023–2028 (USD MILLION)
             10.2.4 CANADA
                       10.2.4.1 Regulatory frameworks and guidelines to encourage Canadian businesses to invest in explainable AI solutions
     10.3 EUROPE 
             10.3.1 EUROPE: MARKET DRIVERS
             10.3.2 EUROPE: RECESSION IMPACT
                       TABLE 115 EUROPE: EXPLAINABLE AI MARKET, BY OFFERING, 2018–2022 (USD MILLION)
                       TABLE 116 EUROPE: MARKET, BY OFFERING, 2023–2028 (USD MILLION)
                       TABLE 117 EUROPE: MARKET, BY SERVICE, 2018–2022 (USD MILLION)
                       TABLE 118 EUROPE: MARKET, BY SERVICE, 2023–2028 (USD MILLION)
                       TABLE 119 EUROPE: MARKET, BY SOLUTION, 2018–2022 (USD MILLION)
                       TABLE 120 EUROPE: MARKET, BY SOLUTION, 2023–2028 (USD MILLION)
                       TABLE 121 EUROPE: MARKET, BY SOFTWARE TYPE, 2018–2022 (USD MILLION)
                       TABLE 122 EUROPE: MARKET, BY SOFTWARE TYPE, 2023–2028 (USD MILLION)
                       TABLE 123 EUROPE: EXPLAINABLE AI SOLUTIONS MARKET, BY DEPLOYMENT MODE, 2018–2022 (USD MILLION)
                       TABLE 124 EUROPE: EXPLAINABLE AI SOLUTIONS MARKET, BY DEPLOYMENT MODE, 2023–2028 (USD MILLION)
                       TABLE 125 EUROPE: MARKET, BY METHOD, 2018–2022 (USD MILLION)
                       TABLE 126 EUROPE: MARKET, BY METHOD, 2023–2028 (USD MILLION)
                       TABLE 127 EUROPE: MARKET, BY VERTICAL, 2018–2022 (USD MILLION)
                       TABLE 128 EUROPE: MARKET, BY VERTICAL, 2023–2028 (USD MILLION)
                       TABLE 129 EUROPE: MARKET, BY COUNTRY, 2018–2022 (USD MILLION)
                       TABLE 130 EUROPE: MARKET, BY COUNTRY, 2023–2028 (USD MILLION)
             10.3.3 UK
                       10.3.3.1 Recognition of transformative potential of XAI and its impact of innovation to boost growth
                                   TABLE 131 UK: EXPLAINABLE AI MARKET, BY OFFERING, 2018–2022 (USD MILLION)
                                   TABLE 132 UK: MARKET, BY OFFERING, 2023–2028 (USD MILLION)
                                   TABLE 133 UK: EXPLAINABLE AI SOLUTIONS MARKET, BY DEPLOYMENT MODE, 2018–2022 (USD MILLION)
                                   TABLE 134 UK: EXPLAINABLE AI SOLUTIONS MARKET, BY DEPLOYMENT MODE, 2023–2028 (USD MILLION)
                                   TABLE 135 UK: MARKET, BY METHOD, 2018–2022 (USD MILLION)
                                   TABLE 136 UK: MARKET, BY METHOD, 2023–2028 (USD MILLION)
             10.3.4 GERMANY
                       10.3.4.1 Heavy investments by government to accelerate development and adoption of XAI technologies to fuel growth
             10.3.5 FRANCE
                       10.3.5.1 Collaboration between global and local players to accelerate XAI adoption of innovation in coming years
             10.3.6 ITALY
                       10.3.6.1 Commitment to fostering digital skills and research capabilities to encourage adoption of explainable AI solutions in startup ecosystem
             10.3.7 SPAIN
                       10.3.7.1 Government initiatives to promote AI-driven innovation to spur market growth
             10.3.8 REST OF EUROPE
     10.4 ASIA PACIFIC 
             10.4.1 ASIA PACIFIC: MARKET DRIVERS
             10.4.2 ASIA PACIFIC: IMPACT OF RECESSION
                       FIGURE 40 ASIA PACIFIC: MARKET SNAPSHOT
                       TABLE 137 ASIA PACIFIC: EXPLAINABLE AI MARKET, BY OFFERING, 2018–2022 (USD MILLION)
                       TABLE 138 ASIA PACIFIC: MARKET, BY OFFERING, 2023–2028 (USD MILLION)
                       TABLE 139 ASIA PACIFIC: MARKET, BY SERVICE, 2018–2022 (USD MILLION)
                       TABLE 140 ASIA PACIFIC: MARKET, BY SERVICE, 2023–2028 (USD MILLION)
                       TABLE 141 ASIA PACIFIC: MARKET, BY SOLUTION, 2018–2022 (USD MILLION)
                       TABLE 142 ASIA PACIFIC: MARKET, BY SOLUTION, 2023–2028 (USD MILLION)
                       TABLE 143 ASIA PACIFIC: MARKET, BY SOFTWARE TYPE, 2018–2022 (USD MILLION)
                       TABLE 144 ASIA PACIFIC: MARKET, BY SOFTWARE TYPE, 2023–2028 (USD MILLION)
                       TABLE 145 ASIA PACIFIC: EXPLAINABLE AI SOLUTIONS MARKET, BY DEPLOYMENT MODE, 2018–2022 (USD MILLION)
                       TABLE 146 ASIA PACIFIC: EXPLAINABLE AI SOLUTIONS MARKET, BY DEPLOYMENT MODE, 2023–2028 (USD MILLION)
                       TABLE 147 ASIA PACIFIC: MARKET, BY METHOD, 2018–2022 (USD MILLION)
                       TABLE 148 ASIA PACIFIC: MARKET, BY METHOD, 2023–2028 (USD MILLION)
                       TABLE 149 ASIA PACIFIC: MARKET, BY VERTICAL, 2018–2022 (USD MILLION)
                       TABLE 150 ASIA PACIFIC: MARKET, BY VERTICAL, 2023–2028 (USD MILLION)
                       TABLE 151 ASIA PACIFIC: MARKET, BY COUNTRY, 2018–2022 (USD MILLION)
                       TABLE 152 ASIA PACIFIC: MARKET, BY COUNTRY, 2023–2028 (USD MILLION)
             10.4.3 CHINA
                       10.4.3.1 Focus of government on bolstering research & development efforts to drive market
                                   TABLE 153 CHINA: EXPLAINABLE AI MARKET, BY OFFERING, 2018–2022 (USD MILLION)
                                   TABLE 154 CHINA: MARKET, BY OFFERING, 2023–2028 (USD MILLION)
                                   TABLE 155 CHINA: EXPLAINABLE AI SOLUTIONS MARKET, BY DEPLOYMENT MODE, 2018–2022 (USD MILLION)
                                   TABLE 156 CHINA: EXPLAINABLE AI SOLUTIONS MARKET, BY DEPLOYMENT MODE, 2023–2028 (USD MILLION)
                                   TABLE 157 CHINA: MARKET, BY METHOD, 2018–2022 (USD MILLION)
                                   TABLE 158 CHINA: MARKET, BY METHOD, 2023–2028 (USD MILLION)
             10.4.4 JAPAN
                       10.4.4.1 Rise in global prominence of generative AI to drive development and integration of explainable AI into local players’ business operations
             10.4.5 SOUTH KOREA
                       10.4.5.1 Influence of AI technology across healthcare, finance, and defense sectors to spur growth
             10.4.6 INDIA
                       10.4.6.1 Rapid surge in development and adoption of XAI technologies to drive growth
             10.4.7 AUSTRALIA & NEW ZEALAND
                       10.4.7.1 AI leveraged for customer service automation, predictive analytics, fraud detection, and supply chain optimization to propel market
             10.4.8 REST OF ASIA PACIFIC
     10.5 MIDDLE EAST & AFRICA 
             10.5.1 MIDDLE EAST & AFRICA: MARKET DRIVERS
             10.5.2 MIDDLE EAST & AFRICA: RECESSION IMPACT
                       TABLE 159 MIDDLE EAST & AFRICA: EXPLAINABLE AI MARKET, BY OFFERING, 2018–2022 (USD MILLION)
                       TABLE 160 MIDDLE EAST & AFRICA: MARKET, BY OFFERING, 2023–2028 (USD MILLION)
                       TABLE 161 MIDDLE EAST & AFRICA: MARKET, BY SERVICE, 2018–2022 (USD MILLION)
                       TABLE 162 MIDDLE EAST & AFRICA: MARKET, BY SERVICE, 2023–2028 (USD MILLION)
                       TABLE 163 MIDDLE EAST & AFRICA: MARKET, BY SOLUTION, 2018–2022 (USD MILLION)
                       TABLE 164 MIDDLE EAST & AFRICA: MARKET, BY SOLUTION, 2023–2028 (USD MILLION)
                       TABLE 165 MIDDLE EAST & AFRICA: MARKET, BY SOFTWARE TYPE, 2018–2022 (USD MILLION)
                       TABLE 166 MIDDLE EAST & AFRICA: MARKET, BY SOFTWARE TYPE, 2023–2028 (USD MILLION)
                       TABLE 167 MIDDLE EAST & AFRICA: EXPLAINABLE AI SOLUTIONS MARKET, BY DEPLOYMENT MODE, 2018–2022 (USD MILLION)
                       TABLE 168 MIDDLE EAST & AFRICA: EXPLAINABLE AI SOLUTIONS MARKET, BY DEPLOYMENT MODE, 2023–2028 (USD MILLION)
                       TABLE 169 MIDDLE EAST & AFRICA: MARKET, BY METHOD, 2018–2022 (USD MILLION)
                       TABLE 170 MIDDLE EAST & AFRICA: MARKET, BY METHOD, 2023–2028 (USD MILLION)
                       TABLE 171 MIDDLE EAST & AFRICA: MARKET, BY VERTICAL, 2018–2022 (USD MILLION)
                       TABLE 172 MIDDLE EAST & AFRICA: MARKET, BY VERTICAL, 2023–2028 (USD MILLION)
                       TABLE 173 MIDDLE EAST & AFRICA: MARKET, BY COUNTRY, 2018–2022 (USD MILLION)
                       TABLE 174 MIDDLE EAST & AFRICA: EXPLAINABLE AI MARKET, BY COUNTRY, 2023–2028 (USD MILLION)
             10.5.3 ISRAEL
                       10.5.3.1 Growth in research and application of artificial intelligence across various verticals to boost market
             10.5.4 SAUDI ARABIA
                       10.5.4.1 Greater emphasis on artificial intelligence development across key industry verticals
             10.5.5 UAE
                       10.5.5.1 Implementation of proactive strategies and establishing regulatory frameworks to spur growth
             10.5.6 EGYPT
                       10.5.6.1 Adoption and utilization of XAI technologies to drive transformative changes across sectors
             10.5.7 SOUTH AFRICA
                       10.5.7.1 Rapid advancements in field of XAI to encourage market expansion
             10.5.8 REST OF MIDDLE EAST & AFRICA
     10.6 LATIN AMERICA 
             10.6.1 LATIN AMERICA: MARKET DRIVERS
             10.6.2 LATIN AMERICA: RECESSION IMPACT
                       TABLE 175 LATIN AMERICA: EXPLAINABLE AI MARKET, BY OFFERING, 2018–2022 (USD MILLION)
                       TABLE 176 LATIN AMERICA: MARKET, BY OFFERING, 2023–2028 (USD MILLION)
                       TABLE 177 LATIN AMERICA: MARKET, BY SERVICE, 2018–2022 (USD MILLION)
                       TABLE 178 LATIN AMERICA: MARKET, BY SERVICE, 2023–2028 (USD MILLION)
                       TABLE 179 LATIN AMERICA: MARKET, BY SOLUTION, 2018–2022 (USD MILLION)
                       TABLE 180 LATIN AMERICA: MARKET, BY SOLUTION, 2023–2028 (USD MILLION)
                       TABLE 181 LATIN AMERICA: MARKET, BY SOFTWARE TYPE, 2018–2022 (USD MILLION)
                       TABLE 182 LATIN AMERICA: MARKET, BY SOFTWARE TYPE, 2023–2028 (USD MILLION)
                       TABLE 183 LATIN AMERICA: EXPLAINABLE AI SOLUTIONS MARKET, BY DEPLOYMENT MODE, 2018–2022 (USD MILLION)
                       TABLE 184 LATIN AMERICA: EXPLAINABLE AI SOLUTIONS MARKET, BY DEPLOYMENT MODE, 2023–2028 (USD MILLION)
                       TABLE 185 LATIN AMERICA: MARKET, BY METHOD, 2018–2022 (USD MILLION)
                       TABLE 186 LATIN AMERICA: MARKET, BY METHODS, 2023–2028 (USD MILLION)
                       TABLE 187 LATIN AMERICA: MARKET, BY VERTICAL, 2018–2022 (USD MILLION)
                       TABLE 188 LATIN AMERICA: MARKET, BY VERTICAL, 2023–2028 (USD MILLION)
                       TABLE 189 LATIN AMERICA: MARKET, BY COUNTRY, 2018–2022 (USD MILLION)
                       TABLE 190 LATIN AMERICA: EXPLAINABLE AI MARKET, BY COUNTRY, 2023–2028 (USD MILLION)
             10.6.3 BRAZIL
                       10.6.3.1 Rapid shift in technological landscape toward adoption of AI technologies to spur growth
             10.6.4 MEXICO
                       10.6.4.1 Endeavor to become digitally advanced country, using proximity to US, to drive technology adoption
             10.6.5 ARGENTINA
                       10.6.5.1 Need for adoption of artificial intelligence to enhance processes and improve decision-making to propel market growth
             10.6.6 REST OF LATIN AMERICA
 
11 COMPETITIVE LANDSCAPE (Page No. - 193)
     11.1 OVERVIEW 
     11.2 STRATEGIES ADOPTED BY KEY PLAYERS 
               TABLE 191 OVERVIEW OF STRATEGIES ADOPTED BY KEY PLAYERS IN MARKET
     11.3 HISTORICAL REVENUE ANALYSIS OF KEY PLAYERS 
               FIGURE 41 HISTORICAL REVENUE ANALYSIS OF TOP PLAYERS, 2020–2022 (USD MILLION)
     11.4 MARKET SHARE ANALYSIS 
               FIGURE 42 MARKET SHARE ANALYSIS, 2022
               TABLE 192 EXPLAINABLE AI MARKET: DEGREE OF COMPETITION
     11.5 EXPLAINABLE AI BRAND/PRODUCT COMPARATIVE LANDSCAPE 
             11.5.1 EXPLAINABLE AI TRENDING PRODUCTS/BRAND COMPARISON
     11.6 COMPANY EVALUATION QUADRANT 
             11.6.1 STARS
             11.6.2 EMERGING LEADERS
             11.6.3 PERVASIVE PLAYERS
             11.6.4 PARTICIPANTS
                       FIGURE 43 COMPANY EVALUATION MATRIX, 2022
             11.6.5 COMPANY FOOTPRINT
                       TABLE 193 KEY COMPANY PRODUCT FOOTPRINT
     11.7 STARTUP/SME EVALUATION QUADRANT 
             11.7.1 PROGRESSIVE COMPANIES
             11.7.2 RESPONSIVE COMPANIES
             11.7.3 DYNAMIC COMPANIES
             11.7.4 STARTING BLOCKS
             11.7.5 COMPETITIVE BENCHMARKING
                       TABLE 194 MARKET: DETAILED LIST OF KEY STARTUPS/SMES
                       TABLE 195 EXPLAINABLE AI MARKET: COMPETITIVE BENCHMARKING OF STARTUPS/SMES
                       FIGURE 44 STARTUP/SME EVALUATION MATRIX, 2022
     11.8 COMPETITIVE SCENARIO 
             11.8.1 PRODUCT LAUNCHES
                       TABLE 196 PRODUCT LAUNCHES, 2019–2023
             11.8.2 DEALS
                       TABLE 197 DEALS, 2020-2023
     11.9 VALUATION AND FINANCIAL METRICS OF KEY EXPLAINABLE AI VENDORS 
               FIGURE 45 VALUATION AND FINANCIAL METRICS OF KEY VENDORS
     11.10 YEAR-TO-DATE (YTD) PRICE TOTAL RETURN AND STOCK BETA OF KEY EXPLAINABLE AI VENDORS 
               FIGURE 46 YEAR-TO-DATE (YTD) PRICE TOTAL RETURN AND STOCK BETA OF KEY VENDORS
 
12 COMPANY PROFILES (Page No. - 210)
     12.1 INTRODUCTION 
     12.2 KEY PLAYERS 
(Business Overview, Products/Solutions/Services offered, Recent Developments, MnM View)*
             12.2.1 MICROSOFT
                       TABLE 198 MICROSOFT: BUSINESS OVERVIEW
                       FIGURE 47 MICROSOFT: COMPANY SNAPSHOT
                       TABLE 199 MICROSOFT: PRODUCTS/SOLUTIONS/SERVICES OFFERED
                       TABLE 200 MICROSOFT: SERVICES OFFERED
                       TABLE 201 MICROSOFT: PRODUCT LAUNCHES AND ENHANCEMENTS
                       TABLE 202 MICROSOFT: DEALS
             12.2.2 IBM
                       TABLE 203 IBM: BUSINESS OVERVIEW
                       FIGURE 48 IBM: COMPANY SNAPSHOT
                       TABLE 204 IBM: PRODUCTS/SOLUTIONS/SERVICES OFFERED
                       TABLE 205 IBM: SERVICES OFFERED
                       TABLE 206 IBM: PRODUCT LAUNCHES AND ENHANCEMENTS
                       TABLE 207 IBM: DEALS
             12.2.3 GOOGLE
                       TABLE 208 GOOGLE: BUSINESS OVERVIEW
                       FIGURE 49 GOOGLE: COMPANY SNAPSHOT
                       TABLE 209 GOOGLE: PRODUCTS/SOLUTIONS/SERVICES OFFERED
                       TABLE 210 GOOGLE: PRODUCT LAUNCHES AND ENHANCEMENTS
                       TABLE 211 GOOGLE: DEALS
             12.2.4 INTEL
                       TABLE 212 INTEL: BUSINESS OVERVIEW
                       FIGURE 50 INTEL: COMPANY SNAPSHOT
                       TABLE 213 INTEL: PRODUCTS/SOLUTIONS/SERVICES OFFERED
                       TABLE 214 INTEL: PRODUCT LAUNCHES AND ENHANCEMENTS
                       TABLE 215 INTEL: DEALS
             12.2.5 SALESFORCE
                       TABLE 216 SALESFORCE: BUSINESS OVERVIEW
                       FIGURE 51 SALESFORCE: COMPANY SNAPSHOT
                       TABLE 217 SALESFORCE: PRODUCTS/SOLUTIONS OFFERED
                       TABLE 218 SALESFORCE: SERVICES OFFERED
                       TABLE 219 SALESFORCE: PRODUCT LAUNCHES AND ENHANCEMENTS
                       TABLE 220 SALESFORCE: DEALS
             12.2.6 NVIDIA
                       TABLE 221 NVIDIA: BUSINESS OVERVIEW
                       FIGURE 52 NVIDIA: COMPANY SNAPSHOT
                       TABLE 222 NVIDIA: PRODUCTS/SOLUTIONS/SERVICES OFFERED
                       TABLE 223 NVIDIA: DEALS
             12.2.7 SAS INSTITUTE
                       TABLE 224 SAS INSTITUTE: BUSINESS OVERVIEW
                       TABLE 225 SAS INSTITUTE: PRODUCTS/SOLUTIONS/SERVICES OFFERED
                       TABLE 226 SAS INSTITUTE: DEALS
             12.2.8 ALTERYX
                       TABLE 227 ALTERYX: BUSINESS OVERVIEW
                       FIGURE 53 ALTERYX: COMPANY SNAPSHOT
                       TABLE 228 ALTERYX: PRODUCTS/SOLUTIONS/SERVICES OFFERED
                       TABLE 229 ALTERYX: PRODUCT LAUNCHES AND ENHANCEMENTS
                       TABLE 230 ALTERYX: DEALS
             12.2.9 AWS
                       TABLE 231 AWS: BUSINESS OVERVIEW
                       FIGURE 54 AWS: COMPANY SNAPSHOT
                       TABLE 232 AWS: PRODUCTS/SOLUTIONS/SERVICES OFFERED
                       TABLE 233 AWS: PRODUCT LAUNCHES AND ENHANCEMENTS
                       TABLE 234 AWS: DEALS
             12.2.10 EQUIFAX
                       TABLE 235 EQUIFAX: BUSINESS OVERVIEW
                       FIGURE 55 EQUIFAX: COMPANY SNAPSHOT
                       TABLE 236 EQUIFAX: PRODUCTS/SOLUTIONS/SERVICES OFFERED
                       TABLE 237 EQUIFAX: DEALS
             12.2.11 FICO
                       TABLE 238 FICO: BUSINESS OVERVIEW
                       FIGURE 56 FICO: COMPANY SNAPSHOT
                       TABLE 239 FICO: PRODUCTS/SOLUTIONS/SERVICES OFFERED
             12.2.12 TEMENOS
                       TABLE 240 TEMENOS: BUSINESS OVERVIEW
                       FIGURE 57 TEMENOS: COMPANY SNAPSHOT
                       TABLE 241 TEMENOS: PRODUCTS/SOLUTIONS/SERVICES OFFERED
                       TABLE 242 TEMENOS: DEALS
             12.2.13 MPHASIS
                       TABLE 243 MPHASIS: BUSINESS OVERVIEW
                       FIGURE 58 MPHASIS: COMPANY SNAPSHOT
                       TABLE 244 MPHASIS: PRODUCTS/SOLUTIONS/SERVICES OFFERED
                       TABLE 245 MPHASIS: DEALS
     12.3 SMES AND STARTUPS 
             12.3.1 C3 AI
             12.3.2 H20.AI
             12.3.3 FIDDLER LABS
             12.3.4 ZEST AI
             12.3.5 SELDON
             12.3.6 SQUIRRO
             12.3.7 KYNDI
             12.3.8 DATAROBOT
             12.3.9 DATABRICKS
             12.3.10 TREDENCE
             12.3.11 DARWINAI
             12.3.12 TENSOR AI SOLUTIONS
             12.3.13 EXPAI
             12.3.14 ABZU
             12.3.15 ARTHUR
             12.3.16 INTELLICO
*Details on Business Overview, Products/Solutions/Services offered, Recent Developments, MnM View might not be captured in case of unlisted companies.
 
13 ADJACENT AND RELATED MARKETS (Page No. - 261)
     13.1 ADJACENT AND RELATED MARKETS 
             13.1.1 INTRODUCTION
             13.1.2 GENERATIVE AI MARKET—GLOBAL FORECAST TO 2028
                       13.1.2.1 Market definition
                       13.1.2.2 Market overview
                                   TABLE 246 GLOBAL GENERATIVE AI MARKET SIZE AND GROWTH RATE, 2019–2022 (USD MILLION, Y-O-Y)
                                   TABLE 247 GLOBAL GENERATIVE AI MARKET SIZE AND GROWTH RATE, 2023–2028 (USD MILLION, Y-O-Y)
                       13.1.2.3 Generative AI market, by offering
                                   TABLE 248 GENERATIVE AI MARKET, BY OFFERING, 2019–2022 (USD MILLION)
                                   TABLE 249 GENERATIVE AI MARKET, BY OFFERING, 2023–2028 (USD MILLION)
                       13.1.2.4 Generative AI market, by application
                                   TABLE 250 GENERATIVE AI MARKET, BY APPLICATION, 2019–2022 (USD MILLION)
                                   TABLE 251 GENERATIVE AI MARKET, BY APPLICATION, 2023–2028 (USD MILLION)
                       13.1.2.5 Generative AI market, by vertical
                                   TABLE 252 GENERATIVE AI MARKET, BY VERTICAL, 2019–2022 (USD MILLION)
                                   TABLE 253 GENERATIVE AI MARKET, BY VERTICAL, 2023–2028 (USD MILLION)
                       13.1.2.6 Generative AI market, by region
                                   TABLE 254 GENERATIVE AI MARKET, BY REGION, 2019–2022 (USD MILLION)
                                   TABLE 255 GENERATIVE AI MARKET, BY REGION, 2023–2028 (USD MILLION)
             13.1.3 CONVERSATIONAL AI MARKET—GLOBAL FORECAST TO 2028
                       13.1.3.1 Market definition
                       13.1.3.2 Market overview
                       13.1.3.3 Conversational AI market, by offering
                                   TABLE 256 CONVERSATIONAL AI MARKET BY OFFERING, 2018–2022 (USD MILLION)
                                   TABLE 257 CONVERSATIONAL AI MARKET BY OFFERING, 2023–2028 (USD MILLION)
                       13.1.3.4 Conversational AI market, by business function
                                   TABLE 258 CONVERSATIONAL AI MARKET, BY BUSINESS FUNCTION, 2018–2022 (USD MILLION)
                                   TABLE 259 CONVERSATIONAL AI MARKET, BY BUSINESS FUNCTION, 2023–2028 (USD MILLION)
                       13.1.3.5 Conversational AI market, by channel
                                   TABLE 260 CONVERSATIONAL AI MARKET, BY CHANNEL, 2018–2022 (USD MILLION)
                                   TABLE 261 CONVERSATIONAL AI MARKET, BY CHANNEL, 2023–2028 (USD MILLION)
                       13.1.3.6 Conversational AI market, by conversational interface
                                   TABLE 262 CONVERSATIONAL AI MARKET, BY CONVERSATIONAL INTERFACE, 2018–2022 (USD MILLION)
                                   TABLE 263 CONVERSATIONAL AI MARKET, BY CONVERSATIONAL INTERFACE, 2023–2028 (USD MILLION)
                       13.1.3.7 Conversational AI market, by technology
                                   TABLE 264 CONVERSATIONAL AI MARKET BY TECHNOLOGY, 2018–2022 (USD MILLION)
                                   TABLE 265 CONVERSATIONAL AI MARKET, TECHNOLOGY, 2023–2028 (USD MILLION)
                       13.1.3.8 Conversational AI market, by vertical
                                   TABLE 266 CONVERSATIONAL AI MARKET, BY VERTICAL, 2018–2022 (USD MILLION)
                                   TABLE 267 CONVERSATIONAL AI MARKET BY VERTICAL, 2023–2028 (USD MILLION)
                       13.1.3.9 Conversational AI market, by region
                                   TABLE 268 CONVERSATIONAL AI MARKET BY REGION, 2018–2022 (USD MILLION)
                                   TABLE 269 CONVERSATIONAL AI MARKET, BY REGION, 2023–2028 (USD MILLION)
 
14 APPENDIX (Page No. - 274)
     14.1 DISCUSSION GUIDE 
     14.2 KNOWLEDGESTORE: MARKETSANDMARKETS’ SUBSCRIPTION PORTAL 
     14.3 CUSTOMIZATION OPTIONS 
     14.4 RELATED REPORTS 
     14.5 AUTHOR DETAILS 

The research study involved the use of extensive secondary sources, directories, as well as several journals and magazines such as the Institute of Electrical and Electronic Engineers IoT Journal, International Journal of Data Science and Analytics, and IoT Magazine to identify and collect the information useful for a comprehensive market research study on the explainable AI market. The primary sources were mainly industry experts from the core and related industries, preferred XAI solution providers, third-party service providers, consulting service providers, end users, and other commercial enterprises. In-depth interviews were conducted with various primary respondents, including key industry participants and subject matter experts, to obtain and verify critical qualitative and quantitative information, as well as assess the market’s prospects.

Secondary Research

In the secondary research process, various sources were referred to for identifying and collecting information for the study. The secondary sources included annual reports, press releases, investor presentations of companies, white papers, journals, and certified publications and articles from recognized authors, directories, and databases.

Primary Research

In the primary research process, various sources from both supply and demand sides were interviewed to obtain qualitative and quantitative information on the market. The primary sources from the supply side included various industry experts, including Chief Experience Officers (CXOs), Vice Presidents (VPs), directors from business development, marketing, product development/innovation teams, related key executives from explainable AI solution vendors, SIs, professional service providers, industry associations, and key opinion leaders. All possible parameters that affect the market covered in this research study have been accounted for, viewed in extensive detail, verified through primary research, and analyzed to get the final quantitative and qualitative data.

The following is the breakup of primary profiles:

Explainable AI Market Size, and Share

To know about the assumptions considered for the study, download the pdf brochure

Market Size Estimation

Top-down and bottom-up approaches were used to estimate and validate the size of the global explainable AI market and various other dependent subsegments. The research methodology used to estimate the market size included the following details: the key players not limited to IBM, Microsoft, NVIDIA and Google in the market were identified through extensive secondary research, and their revenue contributions in the respective regions were determined through primary and secondary research. The entire procedure included the study of the annual and financial reports of top market players and extensive interviews for key insights from industry leaders, such as CEOs, VPs, directors, and marketing executives. All percentage splits and breakups were determined using secondary sources and verified through primary sources.

All the possible parameters that affect the market covered in the research study have been accounted for, viewed in extensive detail, verified through primary research, and analyzed to get the final quantitative and qualitative data. The data is consolidated and added with detailed inputs and analysis from MarketsandMarkets.

  • The pricing trend is assumed to vary over time.
  • All the forecasts are made with the standard assumption that the accepted currency is USD.
  • For the conversion of various currencies to USD, average historical exchange rates are used according to the year specified. For all the historical and current exchange rates required for calculations and currency conversions, the US Internal Revenue Service's website is used.
  • All the forecasts are made under the standard assumption that the globally accepted currency USD remains constant during the next five years.
  • Vendor-side analysis: The market size estimates of associated solutions and services are factored in from the vendor side by assuming an average of licensing and subscription-based models of leading and innovative vendors in the market.
  • Demand/end-user analysis: End users operating in verticals across regions are analyzed in terms of market spending on XAI solutions based on some of the key use cases. These factors for the XAI industry per region are separately analyzed, and the average spending was extrapolated with an approximation based on assumed weightage. This factor is derived by averaging various market influencers, including recent developments, regulations, mergers and acquisitions, enterprise/SME adoption, startup ecosystem, IT spending, technology propensity and maturity, use cases, and the estimated number of organizations per region.

Top-Down Approach

In the top-down approach, an exhaustive list of all the vendors offering solutions and services in the explainable AI market was prepared. The revenue contribution of the market vendors was estimated through annual reports, press releases, funding, investor presentations, paid databases, and primary interviews. Each vendor’s offerings were evaluated on the basis of the breadth of solutions and services, deployment modes, applications, and verticals. The aggregate of all the companies’ revenue was extrapolated to reach the overall market size. Each subsegment was studied and analyzed for its global market size and regional penetration. The markets were triangulated through both primary and secondary research. The primary procedure included extensive interviews for key insights from industry leaders, such as CIOs, CEOs, VPs, directors, and marketing executives. The market numbers were further triangulated with the existing MarketsandMarkets repository for validation.

Bottom-Up Approach

In the bottom-up approach, the adoption rate of explainable AI solutions among different end-users in key countries with respect to their regions that contribute the most to the market share was identified. For cross-validation, the adoption of explainable AI solutions and services among industries, along with different use cases with respect to their regions, was identified and extrapolated. Weightage was given to use cases identified in different regions for the market size calculation.

Based on the market numbers, the regional split was determined by primary and secondary sources. The procedure included the analysis of the explainable AI market’s regional penetration. Based on secondary research, the regional spending on Information and Communications Technology (ICT), socio-economic analysis of each country, strategic vendor analysis of major artificial intelligence providers, and organic and inorganic business development activities of regional and global players were estimated. With the data triangulation procedure and data validation through primaries, the exact values of the overall explainable AI market size and segments’ size were determined and confirmed using the study.

Explainable AI Market Size, and Share

To know about the assumptions considered for the study, Request for Free Sample Report

Explainable AI Market Size, and Share

Market Definition

According to IBM, Explainable AI is used to describe an AI model, its expected impact, and potential biases. It helps characterize model accuracy, fairness, transparency, and outcomes in AI-powered decision making. Explainable AI is crucial for an organization in building trust and confidence when putting AI models into production. AI explainability also helps an organization adopt a responsible approach to AI development.

Data Triangulation

After arriving at the overall market size using the market size estimation processes as explained above, the market was split into several segments and subsegments. To complete the overall market engineering process and arrive at the exact statistics of each market segment and subsegment, data triangulation, and market breakup procedures were employed, wherever applicable. The overall market size was then used in the top-down procedure to estimate the size of other individual markets via percentage splits of the market segmentation.

Key Stakeholders

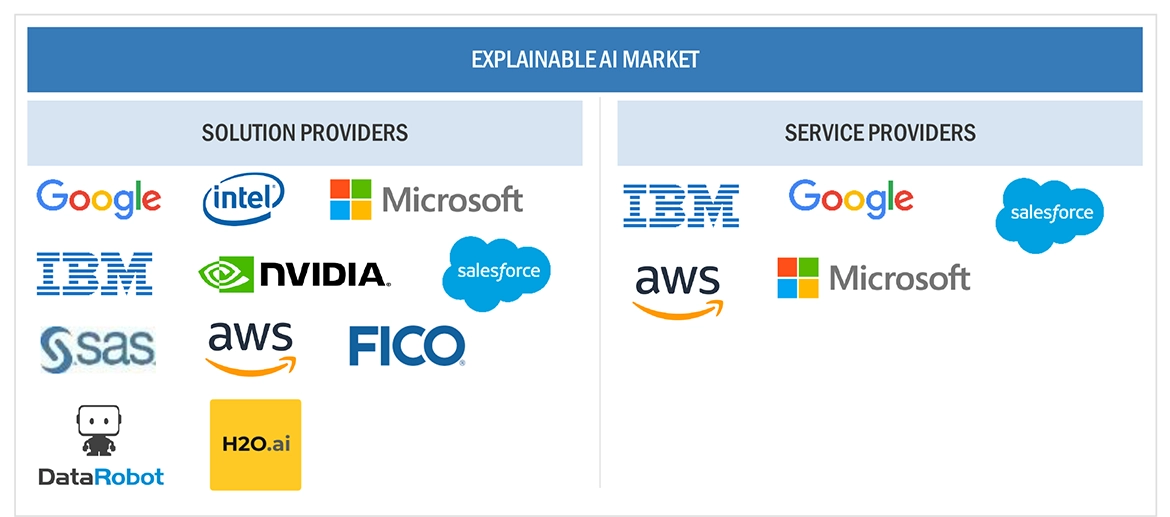
  • Explainable AI solution providers
  • Independent software vendors (ISVs)
  • Investors and venture capitalists (VCs)
  • Managed service providers
  • Support and maintenance service providers
  • System integrators (SIs)/migration service providers
  • Value-added resellers (VARs) and distributors

Report Objectives

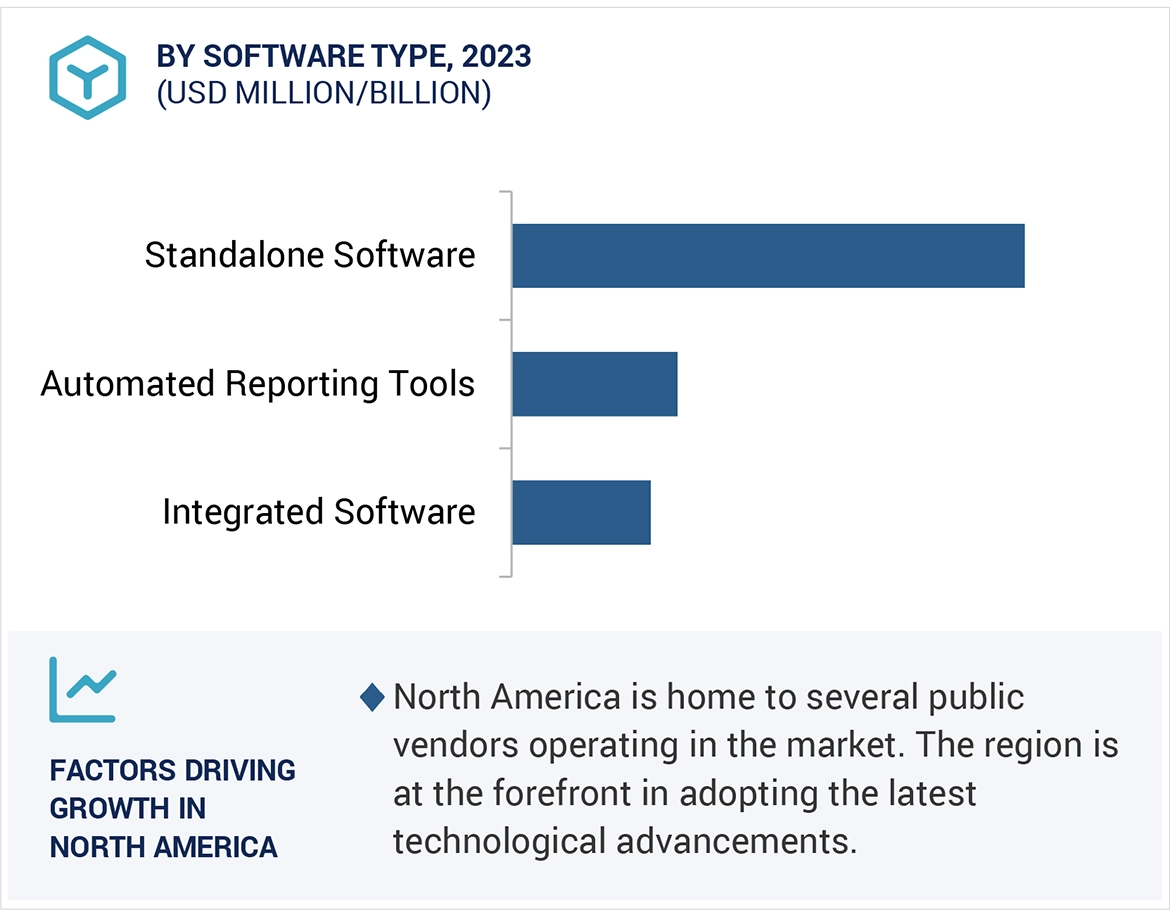
  • To determine and forecast the explainable AI market by offering, software type, methods, vertical, and region, and analyze the various macroeconomic and microeconomic factors that affect market growth.
  • To forecast the size of the market segments with respect to five main regions: North America, Europe, Asia Pacific, Middle East & Africa, and Latin America
  • To provide detailed information about the major factors influencing the growth of the market (drivers, restraints, opportunities, and challenges)
  • To analyze each submarket with respect to individual growth trends, prospects, and contributions to the overall market
  • To analyze the opportunities in the market for stakeholders by identifying the high-growth segments of the market
  • To profile the key market players and provide a comparative analysis on the basis of their business overviews, regional presence, product offerings, business strategies, and key financials, and illustrate the competitive landscape of the market
  • To track and analyze competitive developments, such as acquisitions; expansions; new product launches and product enhancements; agreements, collaborations, and partnerships; and R&D activities in the market.

Available Customizations

With the given market data, MarketsandMarkets offers customizations as per the company’s specific needs. The following customization options are available for the report:

Product Analysis

  • Product matrix provides a detailed comparison of the product portfolio of each company.

Geographic Analysis

  • Further breakup of the North American explainable AI market
  • Further breakup of the European market
  • Further breakup of the Asia Pacific market
  • Further breakup of the Latin American market
  • Further breakup of the Middle East & Africa explainable AI market

Company Information

  • Detailed analysis and profiling of additional market players up to 5
Custom Market Research Services

We will customize the research for you, in case the report listed above does not meet with your exact requirements. Our custom research will comprehensively cover the business information you require to help you arrive at strategic and profitable business decisions.

Request Customization
Report Code
TC 8851
Published ON
Nov, 2023
Choose License Type
BUY NOW
  • SHARE
X
Request Customization
Speak to Analyst
Speak to Analyst
OR FACE-TO-FACE MEETING
PERSONALIZE THIS RESEARCH
  • Triangulate with your Own Data
  • Get Data as per your Format and Definition
  • Gain a Deeper Dive on a Specific Application, Geography, Customer or Competitor
  • Any level of Personalization
REQUEST A FREE CUSTOMIZATION
LET US HELP YOU!
  • What are the Known and Unknown Adjacencies Impacting the Explainable AI Market
  • What will your New Revenue Sources be?
  • Who will be your Top Customer; what will make them switch?
  • Defend your Market Share or Win Competitors
  • Get a Scorecard for Target Partners
CUSTOMIZED WORKSHOP REQUEST
+1-888-600-6441
  • Call Us
  • +1-888-600-6441 (Corporate office hours)
  • +1-888-600-6441 (US/Can toll free)
  • +44-800-368-9399 (UK office hours)
CONNECT WITH US
ABOUT TRUST ONLINE
©2024 MarketsandMarkets Research Private Ltd. All rights reserved
DMCA.com Protection Status Website Feedback