Hydrogen Bus & Truck Market by Vehicle Type (Bus, Truck), Motor Power (Up to 200 kW, 200-400 kW, above 400 kW), Range (Up to 300 miles, 300-500 miles, above 500 miles), Tank Size, Tank Type, and Region - Global Forecast to 2035

icon1
USD 8.95 BN
MARKET SIZE, 2035
icon2
CAGR 9.9%
(2026-2035)
icon3
300
REPORT PAGES
icon4
200
MARKET TABLES

OVERVIEW

hydrogen-truck-market Overview

Source: Secondary Research, Interviews with Experts, MarketsandMarkets Analysis

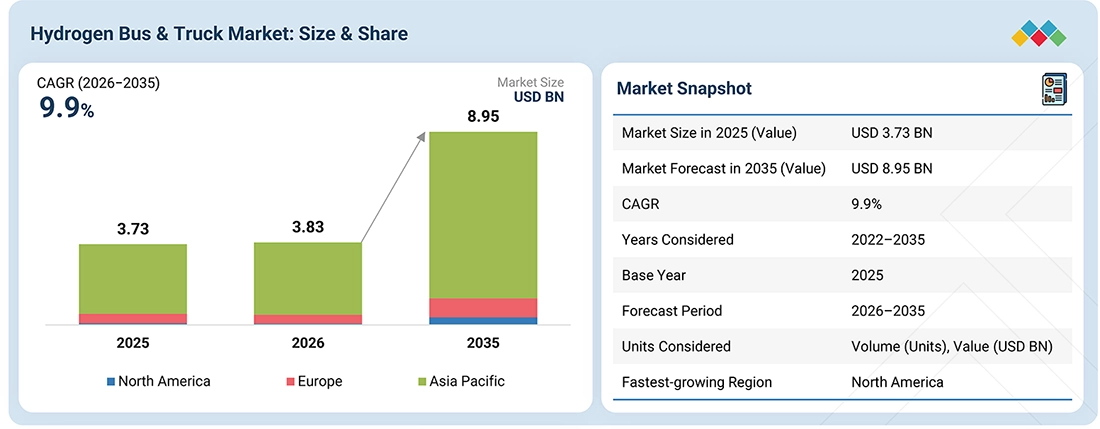
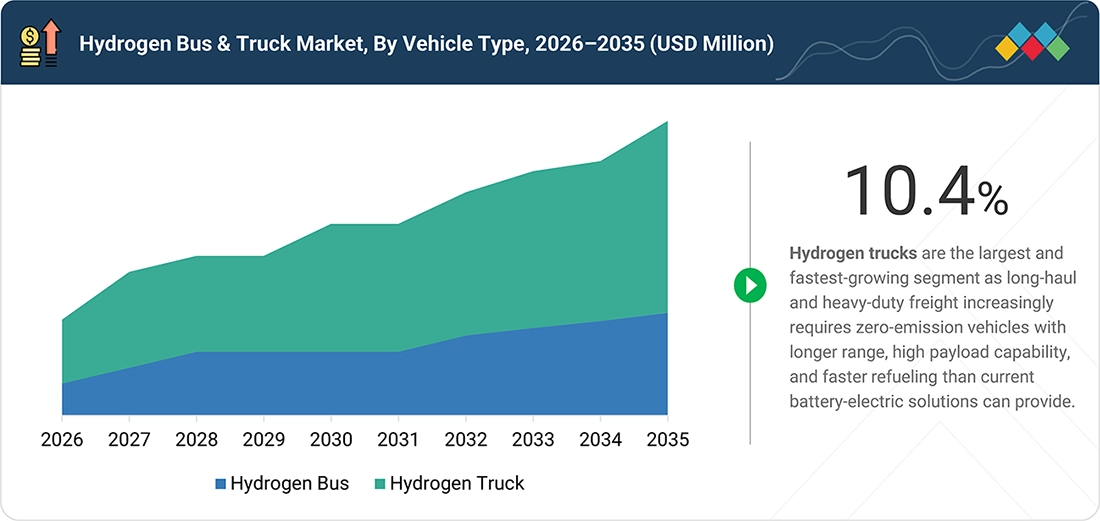
The hydrogen bus & truck market is projected to grow from USD 3.83 billion in 2026 to USD 8.95 billion in 2035, at a CAGR of 9.9%. Hydrogen commercial mobility is moving from individual vehicle commercialization toward integrated ecosystem scale-up, with OEMs increasingly linking fuel cell technology, vehicle platforms, hydrogen supply, refueling infrastructure, and fleet deployment into coordinated business models. This shift is changing the competitive basis of the market, as market participation increasingly depends on the ability to reduce total cost of ownership, improve fuel cell durability and efficiency, secure hydrogen availability, and support reliable high-utilization fleet operations. The market is therefore progressing from technology validation toward commercial scalability, creating opportunities across fuel cell systems, hydrogen storage, vehicle integration, infrastructure, fleet services, and long-term maintenance. This development supports a stronger focus on ecosystem integration and deployment readiness as key indicators of future market expansion, rather than assessing growth only through vehicle launches or production volumes. The latest IRU assessment of the H2Accelerate TRUCKS program identifies three conditions required for scale: hydrogen refueling must be available where commercial vehicles operate, vehicle approval requirements must be consistent across markets, and vehicle and hydrogen costs must decline sufficiently to support fleet investment. This aligns with the Hydrogen Council’s 2026 view that hydrogen ecosystems develop when bankable demand, cost-competitive supply, and supporting infrastructure are connected through effective policy mechanisms. The Hydrogen Council's Global Hydrogen Compass 2026 reports more than USD 130 billion of committed clean hydrogen investment across more than 570 projects, with around 90% of these projects either under construction or already operational. The association highlights the shift from hydrogen project announcements toward actual project execution, while continuing to identify policy support, infrastructure development, and demand creation as necessary to accelerate deployment.

KEY TAKEAWAYS

  • By Region
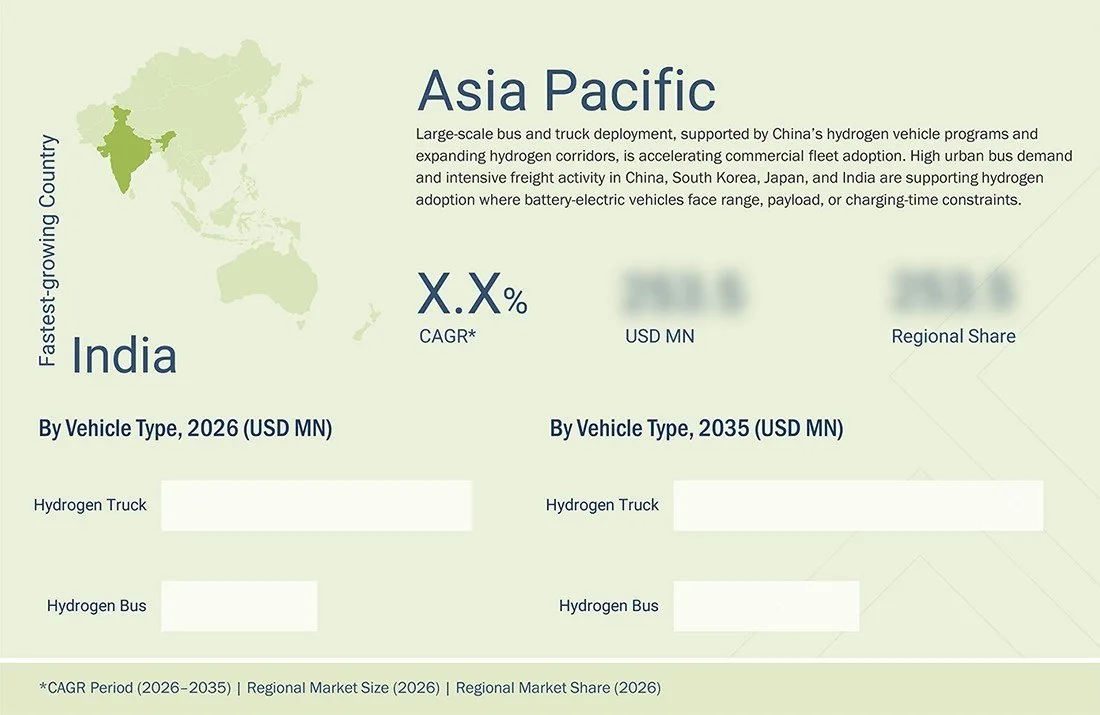
    The Asia Pacific segment is projected to grow from USD 3,365.2 million in 2026 to USD 7,721.0 million by 2035 at a CAGR of 9.7%.
  • Vehicle Type
    Hydrogen trucks are projected to grow from 7,747 units in 2026 to 19,731 units by 2035 at a CAGR of 2.5%.
  • Tank Size
    The < 30 kg segment is projected to grow at a CAGR of 8.0% during the forecast period, from 405 units in 2026 to 807 units by 2035.
  • Range
    The 300–500 miles segment is projected to lead the market during the forecast period. It is projected to grow from 5,914 units in 2026 to 16,463 units by 2035 at a CAGR of 12.0%.
  • Motor Power
    The up to 200 kW segment is projected to grow at a CAGR of 9.0% during the forecast period, from 3,180 units in 2026 to 6,889 units by 2035.
  • Competitive Landscape
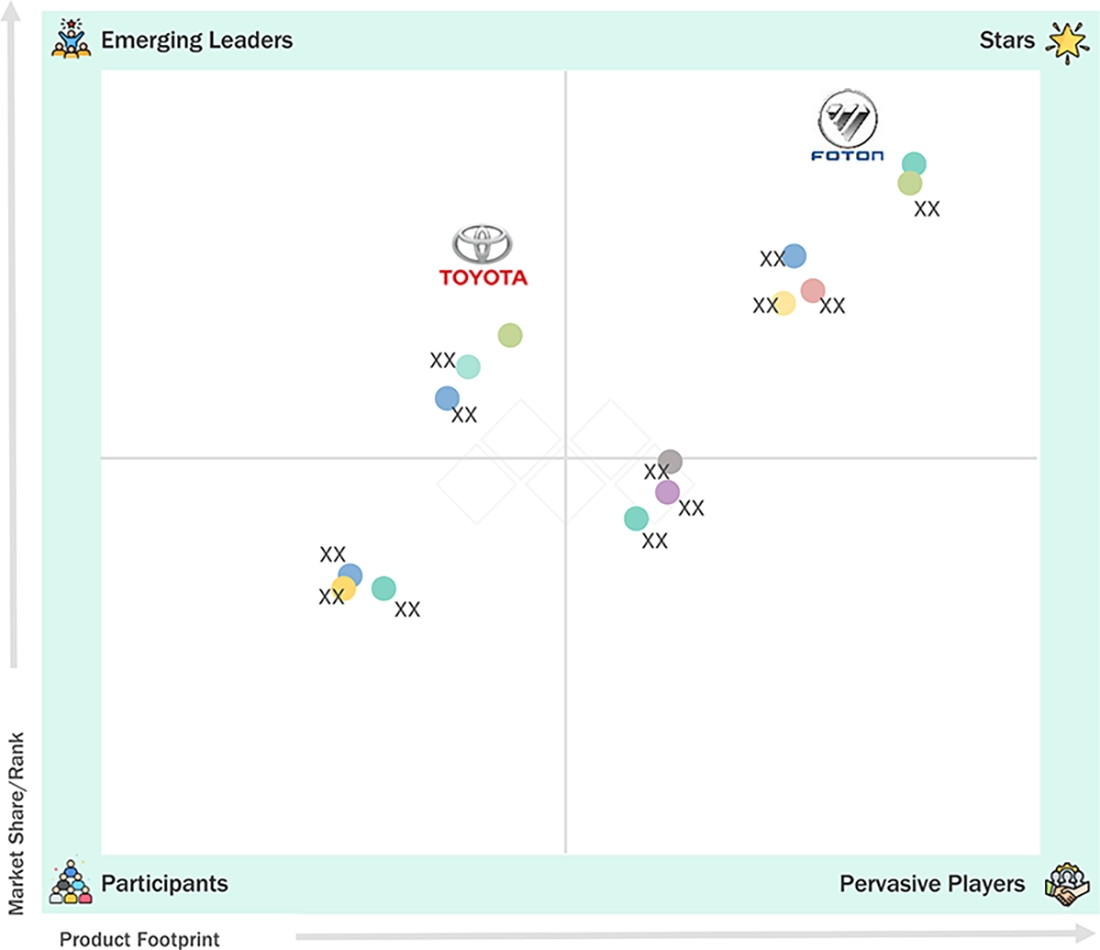
    Foton International is categorized as a Star, and Toyota Motor Corporation as an Emerging Leader.
  • Competitive Landscape
    AB Volvo is categorized as a Progressive Company and FAW Jiefang Automotive Co., Ltd. is categorized as a Responsive Company.

Hydrogen trucks are moving from pilot projects toward commercial fleet deployment, particularly in long-haul and high-utilization applications where long range, fast refueling, and sustained payload capacity can support the operating economics of fuel cell vehicles. Hydrogen infrastructure is becoming the key constraint to market scale, with the availability of production, refueling stations, and dedicated hydrogen corridors directly influencing where buses and trucks can be deployed at scale. Market growth is increasingly determined by total cost of ownership rather than vehicle technology alone, with hydrogen price, fuel cell durability, vehicle utilization, maintenance costs, infrastructure utilization, and policy support collectively determining the commercial viability of hydrogen buses and trucks.

TRENDS & DISRUPTIONS IMPACTING CUSTOMERS' CUSTOMERS

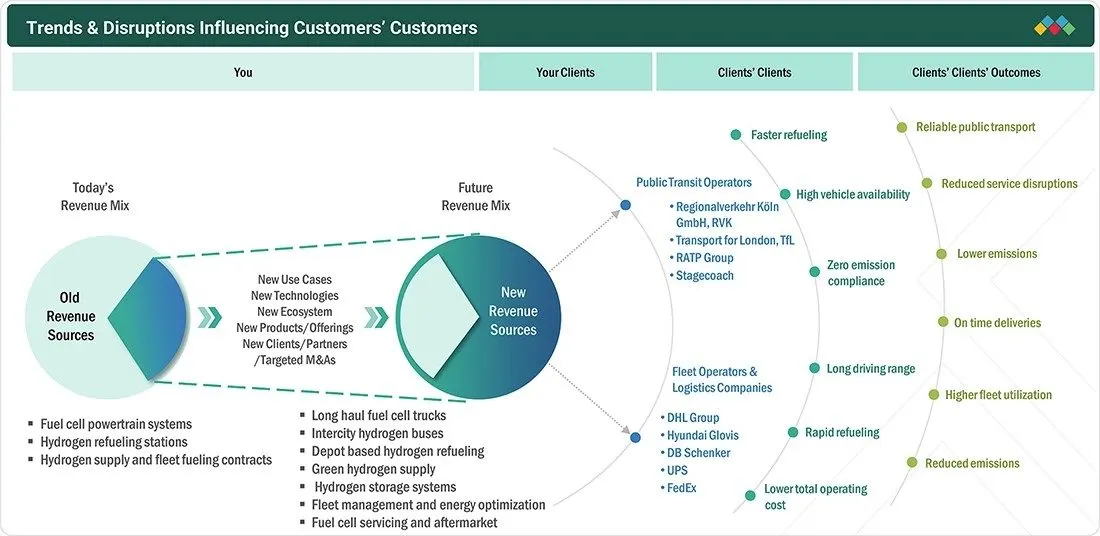
The hydrogen bus & truck market is shifting from early fleet deployments toward broader commercial adoption, supported by advances in fuel cell and hydrogen vehicle technologies, expanding refueling ecosystems, new fleet use cases, and partnerships across the value chain. Key customers include logistics and freight operators, retail and ecommerce companies, and municipalities and public fleets, which are seeking longer operating ranges, faster refueling, higher fleet utilization, lower emissions, and reliable vehicle performance. These requirements can translate into greater route flexibility, improved fleet productivity, reduced delivery and urban emissions, stronger sustainability credentials, and progress toward zero-emission fleet targets.

hydrogen-truck-market Disruptions

Source: Secondary Research, Interviews with Experts, MarketsandMarkets Analysis

MARKET DYNAMICS

Drivers
Impact
Level
  • Growing investment in ‘Green Hydrogen’ production
  • Faster refueling than EVs
RESTRAINTS
Impact
Level
  • High initial investments in hydrogen refueling infrastructure
  • Limited availability of low-cost green hydrogen
OPPORTUNITIES
Impact
Level
  • Advancements in fuel cell technology
  • Integration with renewable energy sources
CHALLENGES
Impact
Level
  • High vehicle cost compared to gasoline/electric vehicles
  • Hydrogen storage and transportation challenges

Source: Secondary Research, Interviews with Experts, MarketsandMarkets Analysis

Driver: Faster refueling than EVs

Fast refueling, typically within 5 to 10 minutes, and longer driving ranges of up to around 600 miles provide FCEVs with operational advantages for buses and trucks that require high vehicle utilization and limited downtime. However, the limited availability of hydrogen production, storage, transportation, and refueling infrastructure remains a major barrier to wider adoption. Developing a reliable hydrogen network requires significant investment in refueling stations and supporting infrastructure, with station coverage aligned with vehicle operating routes and driving ranges. Governments and industry players are therefore investing in hydrogen infrastructure, including Europe’s USD 34.2 million AFIF allocation in February 2025 for 35 new hydrogen refueling stations for cars, trucks, and buses along the TEN-T network.

Restraint: Limited availability of low-cost green hydrogen

Limited availability of low-cost green hydrogen keeps fuel costs high and creates supply uncertainty, weakening the operating economics of hydrogen buses and trucks and slowing large-scale fleet adoption. Low-emission hydrogen remains a small share of global supply, while the limited number of committed production projects creates uncertainty over future availability and pricing. Although China is rapidly expanding electrolyzer capacity and Europe expects large-scale low-emissionhydrogen projects to begin operations in 2026, regulatory delays and insufficient project commitments continue to constrain supply growth.

Opportunities: Advancements in fuel cell technology

Advancements in fuel cell efficiency, hydrogen storage, durability, control systems, and refueling technologies are improving the performance and commercial viability of FCEVs, particularly for long-distance buses and heavy-duty trucks that require longer range and shorter refueling times. Renewable-powered electrolysis is also improving the sustainability of hydrogen production, while emerging solutions such as mobile refueling and distributed hydrogen production could improve fuel accessibility for fleet operators and other users. Continued technology development, infrastructure expansion, and cost reduction are expected to support wider deployment of hydrogen vehicles in transportation and logistics.

Challenge: High vehicle cost compared to gasoline/electric vehicles

High vehicle costs remain a major barrier to FCEV adoption, driven by expensive fuel cell materials such as platinum, costly hydrogen storage systems, high hydrogen fuel costs, and limited production scale. FCEVs therefore remain more expensive than comparable BEVs and conventional vehicles, particularly in commercial applications where upfront vehicle cost strongly affects fleet investment decisions. Increasing production volumes, technological improvements, expanded hydrogen infrastructure, and government support are expected to reduce fuel cell and vehicle costs over time, improving the economic viability of hydrogen buses and trucks.

HYDROGEN BUS & TRUCK MARKET: COMMERCIAL USE CASES ACROSS INDUSTRIES

COMPANY USE CASE DESCRIPTION BENEFITS
company logo
Foton applies hydrogen fuel cell technology to heavy-duty logistics, with its Auman hydrogen trucks being deployed for zero-carbon freight operations and its new CAVAN BEACON platform targeting medium- and long-haul transport. Foton's hydrogen truck platforms provide more than 1,000 km of range in the CAVAN BEACON configuration, addressing range and refueling constraints in long-distance commercial trucking.
company logo
Yutong applies hydrogen fuel cell buses to scheduled urban public transport, including commercial operation in Zhengzhou, while extending fuel cell technology into new energy commercial vehicle platforms. Its low hydrogen consumption, long fuel cell durability, and continuous hydrogen and electrical safety monitoring support lower operating energy use and reliable fleet availability.
company logo
King Long uses hydrogen fuel cell buses for urban public transport and has also developed hydrogen vehicles for highway coaches, heavy tractors, dump trucks, and logistics applications. Its fuel cell and battery hybrid architecture, rapid hydrogen refueling and real time hydrogen safety monitoring enable longer duty cycles with reduced operational interruptions.
company logo
Solaris deploys Urbino 12 and Urbino 18 hydrogen buses on urban and high capacity public transport routes, with the articulated Urbino 18 designed for high passenger volumes and longer routes. Hydrogen enables Solaris buses to combine zero tailpipe emissions with up to 600 km range in the Urbino 18 and rapid refueling, supporting intensive routes where battery charging downtime can be restrictive.
company logo
Hyundai uses XCIENT Fuel Cell trucks for heavy-duty freight, port transportation, and medium-distance logistics, while its ELEC CITY Fuel Cell serves urban passenger transport. Hyundai's fuel cell platforms provide long operating ranges with fast hydrogen refueling, enabling high utilization of heavy trucks and buses without tailpipe emissions.

Logos and trademarks shown above are the property of their respective owners. Their use here is for informational and illustrative purposes only.

MARKET ECOSYSTEM

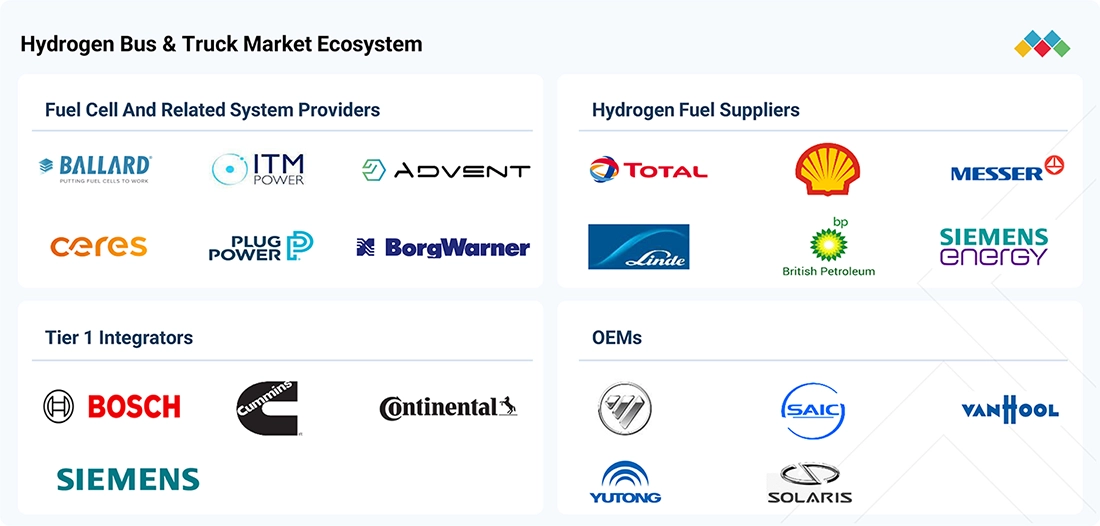
The hydrogen bus & truck ecosystem comprises OEMs, hydrogen fueling infrastructure providers, hydrogen producers, and FCEV component suppliers. OEMs such as Toyota, Hyundai, and Daimler Truck develop and commercialize hydrogen vehicles, while infrastructure providers such as Shell Hydrogen, Nel ASA, and ITM Power support refueling availability. Hydrogen producers, including Plug Power, Air Liquide, and BP, supply hydrogen, while component providers such as Ballard Power Systems, Bosch, Hexagon Composites, and Panasonic supply fuel cells, hydrogen storage systems, batteries, and power electronics that enable reliable and efficient FCEV operation.

hydrogen-truck-market Ecosystem

Logos and trademarks shown above are the property of their respective owners. Their use here is for informational and illustrative purposes only.

MARKET SEGMENTS

hydrogen-truck-market Segments

Source: Secondary Research, Interviews with Experts, MarketsandMarkets Analysis

Hydrogen Truck Market, Vehicle Type

Hydrogen trucks are gaining demand in high-utilization freight applications where long daily operating distances, high payload requirements, and limited vehicle downtime are critical. Fuel cell powertrains allow trucks to combine extended driving range with faster refueling than battery charging, making hydrogen increasingly relevant for regional haulage, heavy-duty logistics, and long-haul freight. The expansion of hydrogen freight corridors is increasing the addressable deployment opportunity for heavy-duty trucks. As hydrogen refueling infrastructure is developed around logistics routes and industrial hubs, fleet operators can deploy hydrogen trucks on predictable high-mileage routes, improving vehicle utilization while reducing dependence on diesel for intensive freight operations.

Hydrogen Truck Market, Tank Type

Type IV tanks use a lightweight composite structure that reduces the weight of onboard hydrogen storage compared with conventional metal tank designs. This is important for both buses and trucks because lower storage weight can help buses maintain passenger capacity and allow trucks to retain more usable payload. Increasing range requirements are pushing manufacturers toward higher-capacity hydrogen storage without a proportional increase in vehicle weight. Type IV technology supports this requirement through its high strength-to-weight characteristics, making it increasingly suitable for commercial hydrogen vehicle platforms.

Hydrogen Truck Market, Tank Size

The 30 to 60 kg tank range provides a practical balance between hydrogen capacity, vehicle weight, packaging requirements, and operating range for full-size buses and medium- to heavy-duty trucks. It is large enough to support extended daily operation while avoiding the additional system weight associated with very high storage capacities. This tank capacity aligns with the operating pattern of commercial fleets that require substantial daily mileage but can refuel during scheduled fleet operations. It therefore supports both buses operating multiple routes during a day and trucks undertaking regional or intercity freight operations.

Hydrogen Truck Market, Range

The demand for above 500-mile range is increasing as hydrogen vehicles move beyond fixed urban bus routes and shorter commercial applications toward intercity passenger transport and long-distance freight. Longer range allows vehicles to cover more of their operating cycle before requiring refueling. Higher range improves fleet utilization by reducing the frequency of refueling stops and minimizing operational interruptions. This is particularly relevant for long-distance buses and trucks, where additional stops can reduce vehicle availability and increase operating time.

Hydrogen Truck Market, Motor Power

The 200 to 400 kW motor power range provides sufficient propulsion output for full-size hydrogen buses and a broad range of medium- and heavy-duty trucks, including operation with high passenger loads, substantial payloads, and highway driving. This makes the range applicable across a large portion of commercial hydrogen vehicle demand. OEMs can apply similar electric drive and fuel cell architectures across multiple bus and truck configurations within this power range. This enables manufacturers to standardize key powertrain components while adapting vehicle performance to different passenger, freight, route, and payload requirements, supporting wider commercial deployment.

REGION

Asia Pacific to be the largest region in the hydrogen bus & truck market

Asia Pacific is the largest market for hydrogen buses and trucks because Chinese OEMs are increasingly combining fuel cell vehicle production, hydrogen powertrain development, fleet deployment, and localized service support, creating a stronger commercial pathway than isolated demonstration projects. Yutong Bus is expanding its new energy vehicle portfolio while developing hydrogen electric range extender powertrain systems, and its established presence across Asia Pacific gives it a platform to transfer fuel cell bus technology, service capabilities, and hydrogen mobility solutions into additional markets. Foton Motor is integrating a high-power fuel cell system into its medium- and heavy-duty vehicle portfolio, indicating that hydrogen trucks are increasingly being developed as part of broader commercial vehicle platforms rather than as standalone projects. Asia Pacific is building an OEM-led hydrogen ecosystem, where fuel cell buses, hydrogen trucks, hydrogen refueling infrastructure, and fleet service networks develop together, reducing the gap between vehicle availability and infrastructure readiness. This combination of high-volume Chinese commercial vehicle manufacturing, growing hydrogen fleet deployment, and expanding OEM participation is creating a repeatable route from pilot fleets to commercial orders.

hydrogen-truck-market Region

HYDROGEN BUS & TRUCK MARKET: COMPANY EVALUATION MATRIX

Foton International is positioned as a Star due to its established global commercial vehicle footprint, broad bus and truck portfolio, strong export growth, and active integration of hydrogen technology into its international new energy strategy. Its extensive overseas distribution and service network provides a strong platform for scaling hydrogen commercial vehicles across multiple regions. Toyota Motor Corporation is positioned as an Emerging Leader due to its advanced fuel cell technology, expanding commercial vehicle partnerships, and increasing real-world hydrogen truck and bus deployments.

hydrogen-truck-market Evaluation Metrics

Source: Secondary Research, Interviews with Experts, MarketsandMarkets Analysis

KEY MARKET PLAYERS

MARKET SCOPE

REPORT METRIC DETAILS
Market Size in 2025 (Value) USD 3.73 Billion
Market Size in 2026 (Value) USD 3.83 Billion
Market Forecast in 2035 (Value) USD 8.95 Billion
Growth Rate CAGR of 9.9% from 2026–2035
Years Considered 2022-2035
Base Year 2025
Forecast Period 2026-2035
Units Considered Volume (Units), Value (USD Million)
Report Coverage Revenue Forecast, Competitive Landscape, Company Share, Growth Factors and Trends
Segments Covered Vehicle Type (Hydrogen Buses, Hydrogen Trucks), Motor Power (Up to 200 KW, 200–400 KW, More than 400 KW), Tank Type (Type III, Type IV, Type V), Range (Up to 300 Miles, Between 300–500 Miles, Above 500 Miles), Tank Size (< 30 Kg, 30–60 Kg, > 60 Kg)
Regional Scope Asia Pacific, North America, Europe

WHAT IS IN IT FOR YOU: HYDROGEN BUS & TRUCK MARKET REPORT CONTENT GUIDE

hydrogen-truck-market Content Guide

DELIVERED CUSTOMIZATIONS

We have successfully delivered the following deep-dive customizations:

CLIENT REQUEST CUSTOMIZATION DELIVERED VALUE ADDS
Segment the hydrogen bus and truck market by key vehicle and technology parameters Developed a detailed segmentation covering vehicle type, tank type, tank size, fuel cell power, range, and end user Enables the client to assess market opportunities across specific vehicle and technology categories
Provide separate insights for hydrogen buses and hydrogen trucks Developed separate market narratives, growth drivers, and segment analysis for buses and trucks Provides a clearer view of adoption patterns and demand factors across the two vehicle applications
Identify the largest and fastest growing market segments Assessed each segment based on market size and growth rate and identified the relevant leading segments Helps prioritize high value and high growth market opportunities
Map major hydrogen vehicle manufacturers Developed a company level assessment covering Foton, Yutong, King Long, Solaris, Hyundai, and other key manufacturers Enables the client to understand competitive positioning and major market participants
Assess company strategies and recent developments Incorporated recent product launches, fleet deployments, partnerships, and hydrogen mobility initiatives Connects market estimates with actual company activities and commercialization progress
Analyze the hydrogen bus and truck ecosystem Mapped OEMs, hydrogen producers, fuel cell suppliers, tank manufacturers, infrastructure providers, and fleet operators Provides visibility into the complete market value chain and potential areas of supplier participation
Identify key market drivers and barriers Developed application specific drivers, adoption barriers, infrastructure constraints, and technology challenges Supports strategic assessment of factors influencing hydrogen vehicle adoption
Assess future applications of hydrogen mobility Identified key applications across public transit, long haul freight, regional logistics, and fleet operations Helps identify application areas with potential for higher hydrogen vehicle deployment
Provide country and regional insights Developed regional analysis covering major hydrogen mobility markets and relevant policy and infrastructure developments Enables comparison of regional adoption conditions and market development
Incorporate client specific market assumptions Adjusted segmentation, growth logic, and market estimates according to the client's defined scope and assumptions Improves alignment between the market model and the client's internal business requirements

RECENT DEVELOPMENTS

  • March 2026 : Hyundai Motor deployed eight XCIENT Fuel Cell trucks in Uruguay as part of the Kahirós Project to decarbonize timber logistics through green-hydrogen infrastructure.
  • August 2025 : Yutong Commercial Vehicle partnered with SPIC Hydrogen Technology and Hydrogen Power Technology to deliver 200 hydrogen fuel-cell logistics vehicles in Zhengzhou, expanding hydrogen-powered logistics operations beyond the companies' earlier 360-vehicle refrigerated-truck deployment.
  • May 2025 : Yutong showcased its F10 Fuel Cell Bus at the 2025 Henan Zhengzhou Hydrogen Energy and Fuel Cell Vehicle Industry Development Conference, highlighting fast hydrogen refueling, long range, low hydrogen consumption, high safety, and adaptability for urban and suburban routes. Yutong stated that the F10 can refuel in about 10 minutes and achieve a range of about 450 km.


Table of Contents

checkmarkExclusive indicates content/data unique to MarketsandMarkets and not available with any competitors.

TITLE
PAGE NO
1
INTRODUCTION


27
2
EXECUTIVE SUMMARY


33
3
PREMIUM INSIGHTS


37
4
MARKET OVERVIEW
Hydrogen's payload advantage and green investment fuel its potential in heavy-duty fleet decarbonization.


41
 
4.1
INTRODUCTION


4.2
MARKET DYNAMICS


4.2.1
DRIVERS


4.2.1.1
FLEET DECARBONIZATION MANDATES


4.2.1.2
FASTER REFUELING THAN EVS


4.2.1.3
GROWING INVESTMENT IN ‘GREEN HYDROGEN’ PRODUCTION


4.2.1.4
HIGHER PAYLOAD RETENTION STRENGTHENS HYDROGEN ADOPTION IN HEAVY DUTY FLEET


4.2.2
RESTRAINTS


4.2.2.1
HIGH INITIAL INVESTMENTS IN HYDROGEN REFUELING INFRASTRUCTURE


4.2.2.2
HIGH FLAMMABILITY AND DIFFICULT DETECTION OF FUEL LEAKAGES


4.2.3
OPPORTUNITIES


4.2.3.1
ADVANCEMENTS IN FUEL CELL TECHNOLOGY


4.2.3.1.1
FCEV COMMERCIAL FREIGHT TRUCK DEVELOPMENTS


4.2.3.2
INTEGRATION WITH RENEWABLE ENERGY SOURCES


4.2.3.3
DEPLOYMENT OF HYDROGEN CORRIDORS


4.2.4
CHALLENGES


4.2.4.1
HIGH VEHICLE COST COMPARED TO GASOLINE/ELECTRIC VEHICLES


4.2.4.2
HYDROGEN STORAGE AND TRANSPORTATION CHALLENGES


4.2.4.3
LIMITED AVAILABILITY OF LOW-COST GREEN HYDROGEN


4.3
UNMET NEEDS AND WHITE SPACES


4.3.1
LOW-COST, HIGH-UTILIZATION HYDROGEN REFUELING FOR HEAVY-DUTY FLEETS


4.3.2
HYDROGEN POWERTRAINS WITH LONGER DURABILITY AND LOWER LIFECYCLE COST


4.3.3
INTEGRATED HYDROGEN FLEET ECOSYSTEM RATHER THAN VEHICLE-ONLY SOLUTIONS


5
INDUSTRY TRENDS
Hydrogen revolutionizes heavy-duty transport with eco-friendly fleets and innovative infrastructure developments.


67
 
5.1
MACROECONOMIC INDICATORS


5.1.1
INTRODUCTION


5.1.2
GDP TRENDS AND FORECAST


5.1.3
TRENDS IN HYDROGEN BUS & TRUCK MARKET


5.2
ECOSYSTEM ANALYSIS


5.3
SUPPLY CHAIN ANALYSIS


5.4
CASE STUDY ANALYSIS


5.4.1
GREEN HYDROGEN INFRASTRUCTURE ENABLES SOUTH AMERICA’S FIRST OPERATIONAL H2 HEAVY-TRUCK FLEET


5.4.2
LONG-TERM FLEET OPERATION VALIDATES HYDROGEN FOR MULTIPLE HEAVY-DUTY APPLICATIONS


5.4.3
TRANSPORT FOR LONDON (TFL) INTRODUCED FUEL CELL BUSES TO REDUCE CARBON EMISSIONS BY 2025


5.4.4
BALLARD POWER SYSTEM AND VAN HOOL COLLABORATED TO ESTABLISH SUSTAINABLE TRANSPORTATION SOLUTION


5.4.5
DAIMLER TRUCK GENH2: REAL-WORLD TRIALS MOVE HYDROGEN TRUCKS CLOSER TO SERIES PRODUCTION


5.5
KEY OEMS: MNM INSIGHTS


5.5.1
FOTON INTERNATIONAL: FCEV STRATEGIES


5.5.2
XIAMEN KING LONG INTERNATIONAL TRADING CO., LTD.: FCEV STRATEGIES


5.5.3
YUTONG BUS CO., LTD.: FCEV STRATEGIES


5.5.4
SOLARIS BUS & COACH SP. Z.O.O.: FCEV STRATEGIES


5.5.5
HYUNDAI MOTOR COMPANY: FCEV STRATEGIES


5.6
HYDROGEN BUS & TRUCK MARKET: BUSINESS MODELS


5.7
HYDROGEN REFUELING STATION SETUP TRENDS, BY REGION: MNM INSIGHTS


5.8
EXISTING AND UPCOMING HYDROGEN COMMERCIAL VEHICLE MODELS


5.8.1
HYDROGEN TRUCKS


5.8.2
HYDROGEN BUS


5.9
H2ICE BUSES & TRUCKS: MNM INSIGHTS


5.10
COMPARISON OF BUSES BY PROMINENT OEMS: MNM INSIGHTS


5.11
PRICING ANALYSIS


5.11.1
AVERAGE SELLING PRICE TREND OF KEY PLAYERS FOR HYDROGEN BUSES


5.11.2
AVERAGE SELLING PRICE TREND OF KEY OEMS FOR HYDROGEN TRUCKS


5.11.3
AVERAGE SELLING PRICE TREND, BY REGION


5.12
TRADE ANALYSIS


5.12.1
IMPORT SCENARIO (HS CODE 8702)


5.12.2
EXPORT SCENARIO (HS CODE 8702)


5.13
KEY CONFERENCES AND EVENTS, 2026-2027


5.14
TRENDS AND DISRUPTIONS IMPACTING CUSTOMER BUSINESS


5.15
INVESTMENT AND FUNDING SCENARIO


5.16
TOTAL COST OF OWNERSHIP OF BATTERY ELECTRIC AND FUEL CELL ELECTRIC BUSES AND TRUCKS


5.17
BILL OF MATERIALS


BILL OF MATERIALS COMPARISON BETWEEN FUEL CELL ELECTRIC,


BILL OF MATERIALS COMPARISON BETWEEN FUEL CELL ELECTRIC,


5.18
EU-INDIA TRADE DEAL IMPACT ANALYSIS


5.18.1
INTRODUCTION


5.18.2
EU TARIFFS


6
TECHNOLOGICAL ADVANCEMENTS, AI-DRIVEN IMPACT, PATENTS, INNOVATIONS, AND FUTURE APPLICATIONS
AI-driven hydrogen innovations revolutionize transport with rapid refueling and extended range capabilities.


106
 
6.1
TECHNOLOGY ANALYSIS


6.1.1
INTRODUCTION


6.1.2
KEY TECHNOLOGIES


6.1.2.1
SOLID OXIDE FUEL CELL (SOFC)


6.1.2.2
POLYMER ELECTROLYTE MEMBRANE FUEL CELL (PEMFC)


6.1.2.3
DIRECT BOROHYDRIDE FUEL CELL (DBFC)


6.1.2.4
PACKAGED FUEL CELL SYSTEM MODULE


6.1.2.5
FUEL CELL HYBRID ELECTRIC VEHICLE (FCHEV)


6.1.2.6
HYDROGEN INTERNAL COMBUSTION ENGINE (H2ICE)


6.1.2.7
NON-PRECIOUS METAL CATALYST-BASED FUEL CELL


6.1.2.8
CARBONATE-SUPERSTRUCTURED SOLID FUEL CELL (CSSFC)


6.1.3
COMPLEMENTARY TECHNOLOGIES


6.1.3.1
LOW CARBON HYDROGEN


6.1.3.2
HYDROGENIOUS LIQUID ORGANIC HYDROGEN CARRIER (LOHC)


6.1.3.3
LIQUEFIED HYDROGEN TECHNOLOGY


6.1.4
ADJACENT TECHNOLOGIES


6.1.4.1
HYDROGEN SENSOR SYSTEM


6.2
TECHNOLOGY/PRODUCT ROADMAP


6.3
PATENT ANALYSIS


6.4
FUTURE APPLICATIONS


6.4.1
LONG-HAUL FREIGHT GAINS HYDROGEN ADOPTION AS RANGE AND RAPID REFUELING BECOME CRITICAL


6.4.2
INTERCITY BUS DEPLOYMENT EXPANDS AS LONGER ROUTES DEMAND EXTENDED OPERATING RANGE


6.4.3
INDUSTRIAL FLEETS ADOPT HYDROGEN AS DEDICATED OPERATIONS SUPPORT CONTROLLED REFUELING INFRASTRUCTURE


6.5
IMPACT OF AI/GENERATIVE AI ON HYDROGEN BUS & TRUCK MARKET


7
CUSTOMER LANDSCAPE AND BUYING BEHAVIOR
Uncover critical stakeholder influence and unmet needs shaping hydrogen vehicle purchasing decisions.


116
 
7.1
KEY STAKEHOLDERS & BUYING CRITERIA


7.1.1
KEY STAKEHOLDERS IN BUYING PROCESS


7.1.2
BUYING CRITERIA


7.2
ADOPTION BARRIERS & INTERNAL CHALLENGES


7.3
UNMET NEED TO VARIOUS END USERS


8
SUSTAINABILITY AND REGULATORY LANDSCAPE
Explore global hydrogen vehicle policies and key regulatory bodies shaping sustainability initiatives.


120
 
8.1
REGULATORY LANDSCAPE


REGULATORY BODIES, GOVERNMENT AGENCIES,


9
HYDROGEN BUS & TRUCK MARKET, BY MOTOR POWER
Market Size & Growth Rate Forecast Analysis to 2035 in Units | 18 Data Tables


126
 
9.1
INTRODUCTION


9.2
UP TO 200 KW


9.2.1
LAST-MILE DELIVERY SERVICES TO BOOST DEMAND FOR ENGINES WITH POWER RANGE OF UP TO 200 KW


9.2.2
UP TO 200 KW: HYDROGEN BUS MODELS


9.2.3
UP TO 200 KW: HYDROGEN TRUCK MODELS


9.3
200–400 KW


9.3.1
HIGHER PAYLOADS TO DRIVE ADOPTION OF MID-POWER PLATFORMS


9.3.2
200–400 KW: HYDROGEN BUS MODELS


9.3.3
200–400 KW: HYDROGEN TRUCK MODELS


9.4
ABOVE 400 KW


9.4.1
INCREASING DEMAND FOR HEAVY-DUTY TRANSPORTATION TO BOOST MARKET


9.4.2
ABOVE 400 KW: HYDROGEN BUS MODELS


9.4.3
ABOVE 400 KW: HYDROGEN TRUCK MODELS


9.5
KEY PRIMARY INSIGHTS


10
HYDROGEN BUS & TRUCK MARKET, BY RANGE
Market Size & Growth Rate Forecast Analysis to 2035 in Units | 18 Data Tables


136
 
10.1
INTRODUCTION


10.2
UP TO 300 MILES


10.2.1
DEMAND FOR EMISSION-FREE INTRACITY TRANSPORTATION AND LAST-MILE DELIVERY TO DRIVE SEGMENTAL GROWTH


10.2.2
UP TO 300 MILES: HYDROGEN BUS MODELS


10.2.3
UP TO 300 MILES: HYDROGEN TRUCK MODELS


10.3
300–500 MILES


10.3.1
DEMAND FOR FIELD SERVICES AND TRANSIT OPERATIONS TO DRIVE SEGMENTAL GROWTH


10.3.2
300–500 MILES: HYDROGEN BUS MODELS


10.3.3
300–500 MILES: HYDROGEN TRUCK MODELS


10.4
ABOVE 500 MILES


10.4.1
LONG HAUL OPERATIONS PRIORITIZE EFFICIENCY AND HIGH-CAPACITY STORAGE TO DRIVE MARKET


10.4.2
ABOVE 500 MILES: HYDROGEN BUS MODELS


10.4.3
ABOVE 500 MILES: HYDROGEN TRUCK MODELS


10.5
KEY PRIMARY INSIGHTS


11
HYDROGEN BUS & TRUCK MARKET, BY HYDROGEN TANK SIZE
Market Size & Growth Rate Forecast Analysis to 2035 in Units | 15 Data Tables


146
 
11.1
INTRODUCTION


11.2
< 30 KG


11.2.1
DEMAND FOR LAST-MILE DELIVERY SERVICES AND SHORT-RANGE H2 BUSES TO BOOST MARKET


11.2.2
< 30 KG: HYDROGEN BUS AND TRUCK MODELS


11.3
30–60 KG


11.3.1
EXTENDED ROUTES FAVOR BALANCED STORAGE AND PAYLOAD CAPACITY


11.3.2
30–60 KG: HYDROGEN BUS AND TRUCK MODELS


11.4
> 60 KG


11.4.1
INCREASING DEMAND FOR HEAVY-DUTY TRANSPORTATION TO BOOST GROWTH


11.4.2
> 60 KG: HYDROGEN BUS AND TRUCK MODELS


11.5
KEY PRIMARY INSIGHTS


12
HYDROGEN BUS & TRUCK MARKET, BY TYPE OF TANK
Market Size & Growth Rate Forecast Analysis to 2035 in Units | 14 Data Tables


154
 
12.1
INTRODUCTION


12.1.1
HYDROGEN TANK TYPE CLASSIFICATION FOR AUTOMOTIVE APPLICATION


12.2
TYPE III


12.2.1
CAN WITHSTAND HIGHER INTERNAL PRESSURE THAN OTHER TANKS


12.2.2
HYDROGEN BUSES WITH TYPE III HYDROGEN TANKS


12.2.3
HYDROGEN TRUCKS WITH TYPE III HYDROGEN TANKS


12.3
TYPE IV


12.3.1
NEED FOR HIGH-PRESSURE STORAGE OF HYDROGEN TO BOOST DEMAND


12.3.2
HYDROGEN BUSES WITH TYPE IV HYDROGEN TANKS


12.3.3
HYDROGEN TRUCKS WITH TYPE IV HYDROGEN TANKS


12.4
TYPE V


12.4.1
HIGHER PAYLOAD DEMANDS ACCELERATE TYPE V TANK DEVELOPMENT FOR HEAVY-DUTY HYDROGEN MOBILITY


12.5
KEY PRIMARY INSIGHTS


13
HYDROGEN BUS & TRUCK MARKET, BY VEHICLE TYPE
Market Size & Growth Rate Forecast Analysis to 2035 in USD Million and Units | 23 Data Tables


163
 
13.1
INTRODUCTION


13.2
HYDROGEN BUS


13.2.1
GOVERNMENT INITIATIVES TO BOOST DEMAND FOR HYDROGEN BUSES


13.2.2
MINIBUSES/SHUTTLES


13.2.2.1
HYDROGEN MINIBUS/SHUTTLE MODELS


13.2.3
CITY/TRANSIT BUSES


13.2.3.1
HYDROGEN CITY/TRANSIT BUS MODELS


13.3
HYDROGEN TRUCK


13.3.1
GROWING DEMAND FOR LONG-HAUL TRANSPORTATION TO DRIVE MARKET


13.3.2
MEDIUM-DUTY TRUCKS


13.3.2.1
HYDROGEN MEDIUM-DUTY TRUCK MODELS


13.3.3
HEAVY-DUTY TRUCKS


13.3.3.1
HYDROGEN HEAVY-DUTY TRUCK MODELS


13.4
KEY PRIMARY INSIGHTS


14
HYDROGEN BUS & TRUCK MARKET, BY REGION
Comprehensive coverage of 3 Regions with country-level deep-dive of 11 Countries | 49 Data Tables.


174
 
14.1
INTRODUCTION


14.2
ASIA PACIFIC


14.2.1
CHINA


14.2.1.1
RISING INVESTMENTS IN CLEAN AND RENEWABLE ENERGY TO DRIVE GROWTH


14.2.2
JAPAN


14.2.2.1
INCREASING DEMAND FOR HYDROGEN INFRASTRUCTURE TO BOOST MARKET


14.2.3
SOUTH KOREA


14.2.3.1
PUSH BY LOCAL OEMS LIKE HYUNDAI TO ENCOURAGE MARKET DEMAND AND EXPANSION


14.2.4
INDIA


14.2.4.1
INITIATIVES BY GOVERNMENT TO PROMOTE ‘GREEN TRANSPORTATION’ TO DRIVE GROWTH


14.3
EUROPE


14.3.1
FRANCE


14.3.1.1
PRESENCE OF MAJOR HYDROGEN-POWERED FLEETS TO SPUR DEMAND


14.3.2
GERMANY


14.3.2.1
DEVELOPMENTS IN HYDROGEN INFRASTRUCTURE TO BOOST GROWTH


14.3.3
ITALY


14.3.3.1
SHIFT TOWARD HYDROGEN-POWERED VEHICLES TO DRIVE MARKET


14.3.4
SPAIN


14.3.4.1
STRATEGIC PARTNERSHIPS AND INVESTMENTS TO DRIVE PRODUCTION OF HYDROGEN-POWERED VEHICLES


14.3.5
UK


14.3.5.1
DEMAND FOR ZERO-EMISSION VEHICLES TO DRIVE MARKET


14.4
NORTH AMERICA


14.4.1
CANADA


14.4.1.1
DEMAND FOR FLEET DECARBONIZATION TO PROPEL GROWTH


14.4.2
US


14.4.2.1
INCREASING DEPLOYMENT OF HYDROGEN BUSES TO SPUR POPULARITY OF HYDROGEN-POWERED VEHICLES


15
COMPETITIVE LANDSCAPE
Gain strategic insights into key players' market dominance and emerging leaders shaping 2025's landscape.


205
 
15.1
OVERVIEW


15.2
KEY PLAYER STRATEGIES/RIGHT TO WIN


15.3
MARKET SHARE ANALYSIS, 2025


15.4
REVENUE ANALYSIS


15.5
COMPANY VALUATION AND FINANCIAL METRICS


15.6
BRAND/PRODUCT COMPARISON


15.7
COMPANY EVALUATION MATRIX: KEY PLAYERS, 2025


15.7.1
STARS


15.7.2
EMERGING LEADERS


15.7.3
PERVASIVE PLAYERS


15.7.4
PARTICIPANTS


15.7.5
COMPANY FOOTPRINT: KEY PLAYERS, 2025


15.7.5.1
COMPANY FOOTPRINT


15.7.5.2
REGION FOOTPRINT


15.7.5.3
VEHICLE TYPE FOOTPRINT


15.8
COMPANY EVALUATION MATRIX: STARTUPS/SMES, 2025


15.8.1
PROGRESSIVE COMPANIES


15.8.2
RESPONSIVE COMPANIES


15.8.3
DYNAMIC COMPANIES


15.8.4
STARTING BLOCKS


15.8.5
COMPETITIVE BENCHMARKING: STARTUPS/SMES, 2026


15.8.5.1
LIST OF STARTUPS/SMES


15.8.5.2
COMPETITIVE BENCHMARKING OF STARTUPS/SMES


15.9
COMPETITIVE SCENARIO


15.9.1
PRODUCT LAUNCHES/DEVELOPMENTS


15.9.2
DEALS


15.9.3
OTHER DEVELOPMENTS


16
COMPANY PROFILES
In-depth Company Profiles of Leading Market Players with detailed Business Overview, Product and Service Portfolio, Recent Developments, and Unique Analyst Perspective (MnM View)


221
 
16.1
KEY PLAYERS


16.1.1
FOTON INTERNATIONAL


16.1.1.1
BUSINESS OVERVIEW


16.1.1.2
PRODUCTS/SOLUTIONS OFFERED


16.1.1.3
RECENT DEVELOPMENTS


16.1.1.3.1
PRODUCT LAUNCHES & ENHANCEMENTS


16.1.1.3.2
DEALS


16.1.1.3.3
EXPANSIONS


16.1.1.3.4
OTHER DEVELOPMENTS


16.1.1.4
MNM VIEW


16.1.1.4.1
RIGHT TO WIN


16.1.1.4.2
STRATEGIC CHOICES


16.1.1.4.3
WEAKNESSES & COMPETITIVE THREATS


16.1.2
YUTONG BUS CO., LTD.


16.1.3
XIAMEN KING LONG INTERNATIONAL TRADING CO., LTD.


16.1.4
SOLARIS BUS & COACH SP. Z O.O.


16.1.5
HYUNDAI MOTOR COMPANY


16.1.6
ANHUI ANKAI AUTOMOBILE CO., LTD


16.1.7
TOYOTA MOTOR CORPORATION


16.1.8
VDL GROEP


16.1.9
NFI GROUP


16.1.10
WRIGHTBUS


16.1.11
ZHONGTONG BUS HOLDING CO., LTD.


16.1.12
DAIMLER TRUCK AG


16.1.13
IVECO S.P.A.


16.2
OTHER KEY PLAYERS


16.2.1
SAIC-IVECO HONGYAN COMMERCIAL VEHICLE CO., LTD.


16.2.2
SINOTRUK (CNHTC)


16.2.3
DAYUN AUTO


16.2.4
DONGFENG MOTOR COMPANY


16.2.5
ZHEJIANG GEELY HOLDING GROUP


16.2.6
CHARIOT MOTORS


16.2.7
OTOKAR


16.2.8
KARSAN


16.2.9
RAMPINI CARLO S.P.A.


16.2.10
FIRST HYDROGEN


16.2.11
TEVVA


16.2.12
SANY GROUP


16.2.13
PACCAR INC.


16.2.14
NOVA BUS INC.


16.2.15
HYZON


16.2.16
QINGLING ISUZU MOTORS IMPORT&EXPORT CO., LTD.


16.2.17
FAW JIEFANG AUTOMOTIVE CO., LTD.


16.2.18
AB VOLVO


17
RESEARCH METHODOLOGY


297
 
17.1
RESEARCH DATA


17.1.1
SECONDARY DATA


17.1.1.1
LIST OF KEY SECONDARY SOURCES


17.1.1.2
KEY DATA FROM SECONDARY SOURCES


17.1.2
PRIMARY DATA


17.1.2.1
PRIMARY INTERVIEW PARTICIPANTS


17.1.2.2
KEY INDUSTRY INSIGHTS


17.1.2.3
BREAKDOWN OF PRIMARY INTERVIEWS


17.1.2.4
LIST OF PRIMARY PARTICIPANTS


17.2
MARKET SIZE ESTIMATION METHODOLOGY


17.2.1
BOTTOM-UP APPROACH


17.2.2
TOP-DOWN APPROACH


17.3
MARKET BREAKDOWN AND DATA TRIANGULATION


17.4
FACTOR ANALYSIS


17.5
RESEARCH ASSUMPTIONS


17.6
RESEARCH LIMITATIONS


17.7
RISK ANALYSIS


18
APPENDIX


312
 
18.1
KEY INSIGHTS BY INDUSTRY EXPERTS


18.2
DISCUSSION GUIDE


18.3
KNOWLEDGESTORE: MARKETSANDMARKETS’ SUBSCRIPTION PORTAL


18.4
CUSTOMIZATION OPTIONS


18.4.1
HYDROGEN BUS & TRUCK MARKET, BY VEHICLE CLASS AT REGIONAL LEVEL


18.4.2
HYDROGEN BUS & TRUCK MARKET, ADDITIONAL COUNTRIES (UP TO THREE)


18.4.3
PROFILING OF ADDITIONAL MARKET PLAYERS (UP TO FIVE)


18.5
RELATED REPORTS


18.6
AUTHOR DETAILS


LIST OF TABLES


TABLE 1
HYDROGEN BUS & TRUCK MARKET DEFINITION, BY MOTOR POWER


TABLE 2
HYDROGEN BUS & TRUCK MARKET DEFINITION, BY VEHICLE TYPE


TABLE 3
HYDROGEN BUS & TRUCK MARKET DEFINITION, BY RANGE


TABLE 4
HYDROGEN BUS & TRUCK MARKET DEFINITION, BY TYPE OF TANK


TABLE 5
HYDROGEN BUS & TRUCK MARKET DEFINITION, BY HYDROGEN TANK SIZE


TABLE 6
INCLUSIONS & EXCLUSIONS


TABLE 7
USD EXCHANGE RATES, 2021–2025


TABLE 8
FLEET DECARBONIZATION MANDATES IMPROVE PROCUREMENT VISIBILITY AND STRENGTHEN THE BUSINESS CASE FOR HYDROGEN FLEETS


TABLE 9
BUS FLEET PLANNING: ELECTRIC VS. HYDROGEN VS. ICE


TABLE 10
TRUCK FLEET PLANNING: ELECTRIC VS. HYDROGEN VS. ICE


TABLE 11
COMPARISON OF TRUCKS: BEV, PHEV, FCEV, AND HEV CHARGING/REFUELING


TABLE 12
COMPARISON OF TRUCKS: FCEV HYDROGEN VS. BEV CHARGING/FUELING


TABLE 13
COMPARISON OF BUSES: FCEV HYDROGEN VS. BEV CHARGING/FUELING


TABLE 14
GLOBAL: COMPARISON OF EXISTING CAPACITY/ DEPLOYMENT VS NEW INVESTMENT OR DEVELOPMENT


TABLE 15
REGIONAL: COMPARISON OF EXISTING CAPACITY/ DEPLOYMENT VS NEW INVESTMENT OR DEVELOPMENT


TABLE 16
COMPARISON OF PEMFC AND SOFC FUEL CELL TECHNOLOGIES


TABLE 17
KEY TECHNOLOGY ADVANCEMENTS DRIVING RANGE IN FCEV TRUCKS


TABLE 18
KEY TECHNOLOGY ADVANCEMENTS DRIVING RANGE IN FCEV BUS


TABLE 19
LARGE SCALE FLEET TCO LIMITS HYDROGEN BUS COMPETITIVENESS AGAINST DIESEL AND BEVS


TABLE 20
HIGH FLEET SCALE TCO LIMITS HYDROGEN COMPETITIVENESS AGAINST DIESEL AND BEVS


TABLE 21
GLOBAL COMPARISON - GREY VS. BLUE VS. GREEN HYDROGEN


TABLE 22
HYDROGEN BUS & TRUCK MARKET DYNAMICS: IMPACT ANALYSIS


TABLE 23
GDP PERCENTAGE CHANGE, BY KEY COUNTRY, 2022–2031


TABLE 24
ROLE OF PLAYERS IN ECOSYSTEM


TABLE 25
HYDROGEN BUS & TRUCK MARKET: BUSINESS MODELS


TABLE 26
US: FUEL CELL ELECTRIC BUS PROJECTS


TABLE 27
FUEL CELL BUS DEVELOPMENT AND DEPLOYMENT ANNOUNCEMENT


TABLE 28
HYDROGEN TRUCKS: EXISTING AND UPCOMING FCEV MODELS


TABLE 29
HYDROGEN BUSES: EXISTING AND UPCOMING FCEV MODELS


TABLE 30
EXISTING AND UPCOMING H2ICE MODELS


TABLE 31
AVERAGE SELLING PRICES OF KEY PLAYERS FOR HYDROGEN BUSES, 2020–2023 (USD THOUSAND)


TABLE 32
AVERAGE SELLING PRICES OF KEY OEMS FOR HYDROGEN TRUCKS, 2022–2025 (USD THOUSAND)


TABLE 33
AVERAGE SELLING PRICES OF HYDROGEN BUSES, BY REGION, 2022–2025 (USD THOUSAND)


TABLE 34
AVERAGE SELLING PRICES OF HYDROGEN TRUCKS, BY REGION, 2022–2025 (USD THOUSAND)


TABLE 35
IMPORT DATA FOR HS CODE 8702-COMPLIANT PRODUCTS, BY COUNTRY, 2022–2025 (USD MILLION)


TABLE 36
EXPORT DATA FOR HS CODE 8702-COMPLIANT PRODUCTS, BY COUNTRY, 2022–2025 (USD MILLION)


TABLE 37
KEY CONFERENCES AND EVENTS, 2026-2027


TABLE 38
BILL OF MATERIALS COMPARISON BETWEEN FUEL CELL ELECTRIC, ICE, AND BATTERY ELECTRIC BUSES (USD THOUSAND)


TABLE 39
BILL OF MATERIAL COMPARISON BETWEEN FUEL CELL ELECTRIC, ICE, AND BATTERY ELECTRIC TRUCKS (USD THOUSAND)


TABLE 40
COMPARISON OF H2ICE AND FCEV


TABLE 41
PATENT REGISTRATIONS IN HYDROGEN BUS & TRUCK MARKET, 2026


TABLE 42
INFLUENCE OF STAKEHOLDERS ON BUYING PROCESS OF HYDROGEN BUSES AND TRUCKS (%)


TABLE 43
KEY BUYING CRITERIA FOR HYDROGEN BUSES AND TRUCKS, BY VEHICLE TYPE


TABLE 44
UNMET NEEDS AND ITS MARKET IMPLICATIONS


TABLE 45
NORTH AMERICA: POLICIES AND INITIATIVES SUPPORTING HYDROGEN-POWERED VEHICLES AND INFRASTRUCTURE


TABLE 46
EUROPE: POLICIES AND INITIATIVES SUPPORTING HYDROGEN-POWERED VEHICLES AND INFRASTRUCTURE


TABLE 47
ASIA PACIFIC: POLICIES AND INITIATIVES SUPPORTING HYDROGEN-POWERED VEHICLES AND INFRASTRUCTURE


TABLE 48
NORTH AMERICA: REGULATORY BODIES, GOVERNMENT AGENCIES, AND OTHER ORGANIZATIONS


TABLE 49
EUROPE: REGULATORY BODIES, GOVERNMENT AGENCIES, AND OTHER ORGANIZATIONS


TABLE 50
ASIA PACIFIC: REGULATORY BODIES, GOVERNMENT AGENCIES, AND OTHER ORGANIZATIONS


TABLE 51
HYDROGEN BUS & TRUCK MARKET, BY MOTOR POWER, 2022–2025 (UNITS)


TABLE 52
HYDROGEN BUS & TRUCK MARKET, BY MOTOR POWER, 2026–2030 (UNITS)


TABLE 53
HYDROGEN BUS & TRUCK MARKET, BY MOTOR POWER, 2031–2035 (UNITS)


TABLE 54
UP TO 200 KW: HYDROGEN BUS MODELS


TABLE 55
UP TO 200 KW: HYDROGEN TRUCK MODELS


TABLE 56
UP TO 200 KW: HYDROGEN BUS & TRUCK MARKET, BY REGION, 2022–2025 (UNITS)


TABLE 57
UP TO 200 KW: HYDROGEN BUS & TRUCK MARKET, BY REGION, 2026–2030 (UNITS)


TABLE 58
UP TO 200 KW: HYDROGEN BUS & TRUCK MARKET, BY REGION, 2031–2035 (UNITS)


TABLE 59
200–400 KW: HYDROGEN BUS MODELS


TABLE 60
200–400 KW: HYDROGEN TRUCK MODELS


TABLE 61
200–400 KW: HYDROGEN BUS & TRUCK MARKET, BY REGION, 2022–2025 (UNITS)


TABLE 62
200–400 KW: HYDROGEN BUS & TRUCK MARKET, BY REGION, 2026–2030 (UNITS)


TABLE 63
200–400 KW: HYDROGEN BUS & TRUCK MARKET, BY REGION, 2031–2035 (UNITS)


TABLE 64
ABOVE 400 KW: HYDROGEN BUS MODELS


TABLE 65
ABOVE 400 KW: HYDROGEN TRUCK MODELS


TABLE 66
ABOVE 400 KW: HYDROGEN BUS & TRUCK MARKET, BY REGION, 2022–2025 (UNITS)


TABLE 67
ABOVE 400 KW: HYDROGEN BUS & TRUCK MARKET, BY REGION, 2026–2030 (UNITS)


TABLE 68
ABOVE 400 KW: HYDROGEN BUS & TRUCK MARKET, BY REGION, 2031–2035 (UNITS)


TABLE 69
HYDROGEN BUS & TRUCK MARKET, BY RANGE, 2022–2025 (UNITS)


TABLE 70
HYDROGEN BUS & TRUCK MARKET, BY RANGE, 2026–2030 (UNITS)


TABLE 71
HYDROGEN BUS & TRUCK MARKET, BY RANGE, 2031–2035 (UNITS)


TABLE 72
UP TO 300 MILES: HYDROGEN BUS MODELS


TABLE 73
UP TO 300 MILES: HYDROGEN TRUCK MODELS


TABLE 74
UP TO 300 MILES: HYDROGEN BUS & TRUCK MARKET, BY REGION, 2022–2025 (UNITS)


TABLE 75
UP TO 300 MILES: HYDROGEN BUS & TRUCK MARKET, BY REGION, 2026–2030 (UNITS)


TABLE 76
UP TO 300 MILES: HYDROGEN BUS & TRUCK MARKET, BY REGION, 2031–2035 (UNITS)


TABLE 77
300–500 MILES: HYDROGEN BUS MODELS


TABLE 78
300–500 MILES: HYDROGEN TRUCK MODELS


TABLE 79
300–500 MILES: HYDROGEN BUS & TRUCK MARKET, BY REGION, 2022–2025 (UNITS)


TABLE 80
300–500 MILES: HYDROGEN BUS & TRUCK MARKET, BY REGION, 2026–2030 (UNITS)


TABLE 81
300–500 MILES: HYDROGEN BUS & TRUCK MARKET, BY REGION, 2031–2035 (UNITS)


TABLE 82
ABOVE 500 MILES: HYDROGEN BUS MODELS


TABLE 83
ABOVE 500 MILES: HYDROGEN TRUCK MODELS


TABLE 84
ABOVE 500 MILES: HYDROGEN BUS & TRUCK MARKET, BY REGION, 2022–2025 (UNITS)


TABLE 85
ABOVE 500 MILES: HYDROGEN BUS & TRUCK MARKET, BY REGION, 2026–2030 (UNITS)


TABLE 86
ABOVE 500 MILES: HYDROGEN BUS & TRUCK MARKET, BY REGION, 2031–2035 (UNITS)


TABLE 87
HYDROGEN BUS & TRUCK MARKET, BY HYDROGEN TANK SIZE, 2022–2025 (UNITS)


TABLE 88
HYDROGEN BUS & TRUCK MARKET, BY HYDROGEN TANK SIZE, 2026–2030 (UNITS)


TABLE 89
HYDROGEN BUS & TRUCK MARKET, BY HYDROGEN TANK SIZE, 2031–2035 (UNITS)


TABLE 90
< 30 KG: HYDROGEN BUS AND TRUCK MODELS


TABLE 91
< 30 KG: HYDROGEN BUS & TRUCK MARKET, BY REGION, 2022–2025 (UNITS)


TABLE 92
< 30 KG: HYDROGEN BUS & TRUCK MARKET, BY REGION, 2026–2030 (UNITS)


TABLE 93
< 30 KG: HYDROGEN BUS & TRUCK MARKET, BY REGION, 2031–2035 (UNITS)


TABLE 94
30–60 KG: HYDROGEN BUS AND TRUCK MODELS


TABLE 95
30–60 KG: HYDROGEN BUS & TRUCK MARKET, BY REGION, 2022–2025 (UNITS)


TABLE 96
30–60 KG: HYDROGEN BUS & TRUCK MARKET, BY REGION, 2026–2030 (UNITS)


TABLE 97
30–60 KG: HYDROGEN BUS & TRUCK MARKET, BY REGION, 2031–2035 (UNITS)


TABLE 98
> 60 KG: HYDROGEN BUS AND TRUCK MODELS


TABLE 99
> 60 KG: HYDROGEN BUS & TRUCK MARKET, BY REGION, 2022–2025 (UNITS)


TABLE 100
> 60 KG: HYDROGEN BUS & TRUCK MARKET, BY REGION, 2026–2030 (UNITS)


TABLE 101
> 60 KG: HYDROGEN BUS & TRUCK MARKET, BY REGION, 2031–2035 (UNITS)


TABLE 102
HYDROGEN TANK TYPE CLASSIFICATION FOR AUTOMOTIVE APPLICATION


TABLE 103
HYDROGEN BUS & TRUCK MARKET, BY TYPE OF TANK, 2022–2025 (UNITS)


TABLE 104
HYDROGEN BUS & TRUCK MARKET, BY TYPE OF TANK, 2026–2030 (UNITS)


TABLE 105
HYDROGEN BUS & TRUCK MARKET, BY TYPE OF TANK, 2031–2035 (UNITS)


TABLE 106
HYDROGEN BUSES WITH TYPE III HYDROGEN TANKS


TABLE 107
HYDROGEN TRUCKS WITH TYPE III HYDROGEN TANKS


TABLE 108
TYPE III: HYDROGEN BUS & TRUCK MARKET, BY REGION, 2022–2025 (UNITS)


TABLE 109
TYPE III: HYDROGEN BUS & TRUCK MARKET, BY REGION, 2026–2030 (UNITS)


TABLE 110
TYPE III: HYDROGEN BUS & TRUCK MARKET, BY REGION, 2031–2035 (UNITS)


TABLE 111
HYDROGEN BUSES WITH TYPE IV HYDROGEN TANKS


TABLE 112
HYDROGEN TRUCKS WITH TYPE IV HYDROGEN TANKS


TABLE 113
TYPE IV: HYDROGEN BUS & TRUCK MARKET, BY REGION, 2022–2025 (UNITS)


TABLE 114
TYPE IV: HYDROGEN BUS & TRUCK MARKET, BY REGION, 2026–2030 (UNITS)


TABLE 115
TYPE IV: HYDROGEN BUS & TRUCK MARKET, BY REGION, 2031–2035 (UNITS)


TABLE 116
HYDROGEN BUS & TRUCK MARKET, BY VEHICLE TYPE, 2022–2025 (USD MILLION)


TABLE 117
HYDROGEN BUS & TRUCK MARKET, BY VEHICLE TYPE, 2026–2030 (USD MILLION)


TABLE 118
HYDROGEN BUS & TRUCK MARKET, BY VEHICLE TYPE, 2031–2035 (USD MILLION)


TABLE 119
HYDROGEN BUS & TRUCK MARKET, BY VEHICLE TYPE, 2022–2025 (UNITS)


TABLE 120
HYDROGEN BUS & TRUCK MARKET, BY VEHICLE TYPE, 2026–2030 (UNITS)


TABLE 121
HYDROGEN BUS & TRUCK MARKET, BY VEHICLE TYPE, 2031–2035 (UNITS)


TABLE 122
HYDROGEN BUS MARKET, BY REGION, 2022–2025 (USD MILLION)


TABLE 123
HYDROGEN BUS MARKET, BY REGION, 2026–2030 (USD MILLION)


TABLE 124
HYDROGEN BUS MARKET, BY REGION, 2031–2035 (USD MILLION)


TABLE 125
HYDROGEN BUS MARKET, BY REGION, 2022–2025 (UNITS)


TABLE 126
HYDROGEN BUS MARKET, BY REGION, 2026–2030 (UNITS)


TABLE 127
HYDROGEN BUS MARKET, BY REGION, 2031–2035 (UNITS)


TABLE 128
HYDROGEN MINIBUS/SHUTTLE MODELS


TABLE 129
HYDROGEN CITY/TRANSIT BUS MODELS


TABLE 130
CLASSIFICATION OF HYDROGEN TRUCKS BY GVW


TABLE 131
HYDROGEN BUS & TRUCK MARKET, BY REGION, 2022–2025 (USD MILLION)


TABLE 132
HYDROGEN BUS & TRUCK MARKET, BY REGION, 2026–2030 (USD MILLION)


TABLE 133
HYDROGEN BUS & TRUCK MARKET, BY REGION, 2031–2035 (USD MILLION)


TABLE 134
HYDROGEN BUS & TRUCK MARKET, BY REGION, 2022–2025 (UNITS)


TABLE 135
HYDROGEN BUS & TRUCK MARKET, BY REGION, 2026–2030 (UNITS)


TABLE 136
HYDROGEN BUS & TRUCK MARKET, BY REGION, 2031–2035 (UNITS)


TABLE 137
HYDROGEN MEDIUM-DUTY TRUCK MODELS


TABLE 138
HYDROGEN HEAVY-DUTY TRUCK MODELS


TABLE 139
HYDROGEN BUS & TRUCK MARKET, BY REGION, 2022–2025 (USD MILLION)


TABLE 140
HYDROGEN BUS & TRUCK MARKET, BY REGION, 2026–2030 (USD MILLION)


TABLE 141
HYDROGEN BUS & TRUCK MARKET, BY REGION, 2031–2035 (USD MILLION)


TABLE 142
HYDROGEN BUS & TRUCK MARKET, BY REGION, 2022–2025 (UNITS)


TABLE 143
HYDROGEN BUS & TRUCK MARKET, BY REGION, 2026–2030 (UNITS)


TABLE 144
HYDROGEN BUS & TRUCK MARKET, BY REGION, 2031–2035 (UNITS)


TABLE 145
INITIATIVES TAKEN BY MAJOR COUNTRIES TO PROMOTE USE OF HYDROGEN BUSES AND TRUCKS


TABLE 146
ASIA PACIFIC: HYDROGEN BUS & TRUCK MARKET, BY COUNTRY, 2022–2025 (UNITS)


TABLE 147
ASIA PACIFIC: HYDROGEN BUS & TRUCK MARKET, BY COUNTRY, 2026–2030 (UNITS)


TABLE 148
ASIA PACIFIC: HYDROGEN BUS & TRUCK MARKET, BY COUNTRY, 2031–2035 (UNITS)


TABLE 149
CHINA: HYDROGEN BUS & TRUCK MARKET, BY VEHICLE TYPE, 2022–2025 (UNITS)


TABLE 150
CHINA: HYDROGEN BUS & TRUCK MARKET, BY VEHICLE TYPE, 2026–2030 (UNITS)


TABLE 151
CHINA: HYDROGEN BUS & TRUCK MARKET, BY VEHICLE TYPE, 2031–2035 (UNITS)


TABLE 152
JAPAN: HYDROGEN BUS & TRUCK MARKET, BY VEHICLE TYPE, 2022–2025 (UNITS)


TABLE 153
JAPAN: HYDROGEN BUS & TRUCK MARKET, BY VEHICLE TYPE, 2026–2030 (UNITS)


TABLE 154
JAPAN: HYDROGEN BUS & TRUCK MARKET, BY VEHICLE TYPE, 2031–2035 (UNITS)


TABLE 155
SOUTH KOREA: HYDROGEN BUS & TRUCK MARKET, BY VEHICLE TYPE, 2022–2025 (UNITS)


TABLE 156
SOUTH KOREA: HYDROGEN BUS & TRUCK MARKET, BY VEHICLE TYPE, 2026–2030 (UNITS)


TABLE 157
SOUTH KOREA: HYDROGEN BUS & TRUCK MARKET, BY VEHICLE TYPE, 2031–2035 (UNITS)


TABLE 158
INDIA: HYDROGEN BUS & TRUCK MARKET, BY VEHICLE TYPE, 2022–2025 (UNITS)


TABLE 159
INDIA: HYDROGEN BUS & TRUCK MARKET, BY VEHICLE TYPE, 2026–2030 (UNITS)


TABLE 160
INDIA: HYDROGEN BUS & TRUCK MARKET, BY VEHICLE TYPE, 2031–2035 (UNITS)


TABLE 161
EUROPE: HYDROGEN BUS & TRUCK MARKET, BY COUNTRY, 2022–2025 (UNITS)


TABLE 162
EUROPE: HYDROGEN BUS & TRUCK MARKET, BY COUNTRY, 2026–2030 (UNITS)


TABLE 163
EUROPE: HYDROGEN BUS & TRUCK MARKET, BY COUNTRY, 2031–2035 (UNITS)


TABLE 164
FRANCE: HYDROGEN BUS & TRUCK MARKET, BY VEHICLE TYPE, 2022–2025 (UNITS)


TABLE 165
FRANCE: HYDROGEN BUS & TRUCK MARKET, BY VEHICLE TYPE, 2026–2030 (UNITS)


TABLE 166
FRANCE: HYDROGEN BUS & TRUCK MARKET, BY VEHICLE TYPE, 2031–2035 (UNITS)


TABLE 167
GERMANY: HYDROGEN BUS & TRUCK MARKET, BY VEHICLE TYPE, 2022–2025 (UNITS)


TABLE 168
GERMANY: HYDROGEN BUS & TRUCK MARKET, BY VEHICLE TYPE, 2026–2030 (UNITS)


TABLE 169
GERMANY: HYDROGEN BUS & TRUCK MARKET, BY VEHICLE TYPE, 2031–2035 (UNITS)


TABLE 170
ITALY: HYDROGEN BUS & TRUCK MARKET, BY VEHICLE TYPE, 2022–2025 (UNITS)


TABLE 171
ITALY: HYDROGEN BUS & TRUCK MARKET, BY VEHICLE TYPE, 2026–2030 (UNITS)


TABLE 172
ITALY: HYDROGEN BUS & TRUCK MARKET, BY VEHICLE TYPE, 2031–2035 (UNITS)


TABLE 173
SPAIN: HYDROGEN BUS & TRUCK MARKET, BY VEHICLE TYPE, 2022–2025 (UNITS)


TABLE 174
SPAIN: HYDROGEN BUS & TRUCK MARKET, BY VEHICLE TYPE, 2026–2030 (UNITS)


TABLE 175
SPAIN: HYDROGEN BUS & TRUCK MARKET, BY VEHICLE TYPE, 2031–2035 (UNITS)


TABLE 176
UK: HYDROGEN BUS & TRUCK MARKET, BY VEHICLE TYPE, 2022–2025 (UNITS)


TABLE 177
UK: HYDROGEN BUS & TRUCK MARKET, BY VEHICLE TYPE, 2026–2030 (UNITS)


TABLE 178
UK: HYDROGEN BUS & TRUCK MARKET, BY VEHICLE TYPE, 2031–2035 (UNITS)


TABLE 179
NORTH AMERICA: HYDROGEN BUS & TRUCK MARKET, BY COUNTRY, 2022–2025 (UNITS)


TABLE 180
NORTH AMERICA: HYDROGEN BUS & TRUCK MARKET, BY COUNTRY, 2026–2030 (UNITS)


TABLE 181
NORTH AMERICA: HYDROGEN BUS & TRUCK MARKET, BY COUNTRY, 2031–2035 (UNITS)


TABLE 182
CANADA: HYDROGEN BUS & TRUCK MARKET, BY VEHICLE TYPE, 2022–2025 (UNITS)


TABLE 183
CANADA: HYDROGEN BUS & TRUCK MARKET, BY VEHICLE TYPE, 2026–2030 (UNITS)


TABLE 184
CANADA: HYDROGEN BUS & TRUCK MARKET, BY VEHICLE TYPE, 2031–2035 (UNITS)


TABLE 185
US: HYDROGEN BUS & TRUCK MARKET, BY VEHICLE TYPE, 2022–2025 (UNITS)


TABLE 186
US: HYDROGEN BUS & TRUCK MARKET, BY VEHICLE TYPE, 2026–2030 (UNITS)


TABLE 187
US: HYDROGEN BUS & TRUCK MARKET, BY VEHICLE TYPE, 2031–2035 (UNITS)


TABLE 188
OVERVIEW OF STRATEGIES DEPLOYED BY KEY PLAYERS IN HYDROGEN BUS AND TRUCK MARKET


TABLE 189
DEGREE OF COMPETITION, 2025


TABLE 190
REGION FOOTPRINT


TABLE 191
VEHICLE TYPE FOOTPRINT


TABLE 192
LIST OF STARTUPS/SMES


TABLE 193
COMPETITIVE BENCHMARKING OF STARTUPS/SMES


TABLE 194
HYDROGEN BUS & TRUCK MARKET: PRODUCT LAUNCHES/DEVELOPMENTS, JANUARY 2023–SEPTEMBER 2026


TABLE 195
HYDROGEN BUS & TRUCK MARKET: DEALS, JANUARY 2023–SEPTEMBER 2026


TABLE 196
HYDROGEN BUS & TRUCK MARKET: OTHER DEVELOPMENTS, JANUARY 2023–SEPTEMBER 2026


TABLE 197
FOTON INTERNATIONAL: COMPANY OVERVIEW


TABLE 198
FOTON INTERNATIONAL: PRODUCTS/SOLUTIONS OFFERED


TABLE 199
FOTON INTERNATIONAL: PRODUCT LAUNCHES & ENHANCEMENTS


TABLE 200
FOTON INTERNATIONAL: DEALS


TABLE 201
FOTON INTERNATIONAL: EXPANSIONS


TABLE 202
FOTON INTERNATIONAL: OTHER DEVELOPMENTS


TABLE 203
YUTONG BUS CO., LTD.: COMPANY OVERVIEW


TABLE 204
YUTONG BUS CO., LTD.: PRODUCTS/SOLUTIONS OFFERED


TABLE 205
YUTONG BUS CO., LTD.: PRODUCT LAUNCHES & ENHANCEMENTS


TABLE 206
YUTONG BUS CO., LTD.: DEALS


TABLE 207
YUTONG BUS CO., LTD.: OTHER DEVELOPMENTS


TABLE 208
XIAMEN KING LONG INTERNATIONAL TRADING CO., LTD.: COMPANY OVERVIEW


TABLE 209
XIAMEN KING LONG INTERNATIONAL TRADING CO., LTD.: PRODUCTS/SOLUTIONS OFFERED


TABLE 210
XIAMEN KING LONG INTERNATIONAL TRADING CO., LTD.: OTHER DEVELOPMENTS


TABLE 211
SOLARIS BUS & COACH SP. Z O.O.: COMPANY OVERVIEW


TABLE 212
SOLARIS BUS & COACH SP. Z O.O.: PRODUCTS/SOLUTIONS OFFERED


TABLE 213
SOLARIS BUS & COACH SP. Z O.O.: PRODUCT LAUNCHES & ENHANCEMENTS


TABLE 214
SOLARIS BUS & COACH SP. Z O.O.: DEALS


TABLE 215
SOLARIS BUS & COACH SP. Z O.O.: OTHER DEVELOPMENTS


TABLE 216
HYUNDAI MOTOR CORPORATION: COMPANY OVERVIEW


TABLE 217
HYUNDAI MOTOR CORPORATION: PRODUCTS/SOLUTIONS OFFERED


TABLE 218
HYUNDAI MOTOR CORPORATION: PRODUCT LAUNCHES


TABLE 219
HYUNDAI MOTOR CORPORATION: DEALS


TABLE 220
HYUNDAI MOTOR CORPORATION: OTHER DEVELOPMENTS


TABLE 221
ANHUI ANKAI AUTOMOBILE CO., LTD: COMPANY OVERVIEW


TABLE 222
ANHUI ANKAI AUTOMOBILE CO., LTD: PRODUCTS/SOLUTIONS OFFERED


TABLE 223
ANHUI ANKAI AUTOMOBILE CO., LTD: PRODUCT LAUNCHES & ENHANCEMENTS


TABLE 224
ANHUI ANKAI AUTOMOBILE CO., LTD: EXPANSIONS


TABLE 225
ANHUI ANKAI AUTOMOBILE CO., LTD: OTHER DEVELOPMENTS


TABLE 226
TOYOTA MOTOR CORPORATION: COMPANY OVERVIEW


TABLE 227
TOYOTA MOTOR CORPORATION: PRODUCTS/SOLUTIONS OFFERED


TABLE 228
TOYOTA MOTOR CORPORATION: PRODUCT LAUNCHES & DEVELOPMENTS


TABLE 229
TOYOTA MOTOR CORPORATION: DEALS


TABLE 230
TOYOTA MOTOR CORPORATION: OTHER DEVELOPMENTS


TABLE 231
VDL GROEP: COMPANY OVERVIEW


TABLE 232
VDL GROEP: PRODUCTS/SOLUTIONS OFFERED


TABLE 233
VDL GROEP: PRODUCT LAUNCHES & ENHANCEMENTS


TABLE 234
VDL GROEP: DEALS


TABLE 235
VDL GROEP: EXPANSIONS


TABLE 236
VDL GROEP: OTHER DEVELOPMENTS


TABLE 237
NFI GROUP: COMPANY OVERVIEW


TABLE 238
NFI GROUP: PRODUCTS/SOLUTIONS OFFERED


TABLE 239
NFI GROUP: PRODUCT LAUNCHES & DEVELOPMENTS


TABLE 240
NFI GROUP: DEALS


TABLE 241
NFI GROUP: OTHER DEVELOPMENTS


TABLE 242
WRIGHTBUS: COMPANY OVERVIEW


TABLE 243
WRIGHTBUS: PRODUCTS/SOLUTIONS OFFERED


TABLE 244
WRIGHTBUS: PRODUCT LAUNCHES & DEVELOPMENTS


TABLE 245
WRIGHTBUS: DEALS


TABLE 246
WRIGHTBUS: EXPANSIONS


TABLE 247
WRIGHTBUS: OTHER DEVELOPMENTS


TABLE 248
ZHONGTONG BUS HOLDING CO., LTD.: COMPANY OVERVIEW


TABLE 249
ZHONGTONG BUS HOLDING CO., LTD.: PRODUCTS/SOLUTIONS OFFERED


TABLE 250
ZHONGTONG BUS HOLDING CO., LTD.: PRODUCT LAUNCHES & ENHANCEMENTS


TABLE 251
ZHONGTONG BUS HOLDING CO., LTD.: OTHER DEVELOPMENTS


TABLE 252
DAIMLER TRUCK AG: COMPANY OVERVIEW


TABLE 253
DAIMLER TRUCK AG: PRODUCTS/SOLUTIONS OFFERED


TABLE 254
DAIMLER TRUCK AG: PRODUCT LAUNCHES


TABLE 255
DAIMLER TRUCK AG: DEALS


TABLE 256
DAIMLER TRUCK AG: EXPANSIONS


TABLE 257
DAIMLER TRUCK AG: OTHER DEVELOPMENTS


TABLE 258
IVECO S.P.A.: COMPANY OVERVIEW


TABLE 259
IVECO S.P.A.: PRODUCTS/SOLUTIONS OFFERED


TABLE 260
IVECO S.P.A.: DEALS


TABLE 261
IVECO S.P.A.: CONTRACTS


TABLE 262
IVECO S.P.A.: EXPANSIONS


TABLE 263
IVECO S.P.A.: OTHER DEVELOPMENTS


LIST OF FIGURES


FIGURE 1
MARKET SCENARIO


FIGURE 2
HYDROGEN BUS & TRUCK MARKET, 2022–2035 (USD BILLION)


FIGURE 3
MAJOR STRATEGIES ADOPTED BY KEY PLAYERS IN HYDROGEN BUS & TRUCK MARKET, 2023–2026


FIGURE 4
DISRUPTIONS INFLUENCING GROWTH OF HYDROGEN BUS & TRUCK MARKET


FIGURE 5
HIGH-GROWTH SEGMENTS IN HYDROGEN BUS & TRUCK MARKET, 2026–2035


FIGURE 6
ASIA PACIFIC TO REGISTER HIGHEST CAGR IN HYDROGEN BUS & TRUCK MARKET, IN TERMS OF VALUE, DURING FORECAST PERIOD


FIGURE 7
RISING ENVIRONMENTAL CONCERNS AND EXPANSION OF HYDROGEN INFRASTRUCTURE TO DRIVE GROWTH


FIGURE 8
HYDROGEN TRUCKS LEAD AS OEMS PRIORITIZE FUEL CELL MODELS FOR HIGH UTILIZATION, LONG HAUL FREIGHT OPERATIONS


FIGURE 9
TYPE IV TANKS LEAD AS IT IS FAVORED FOR ITS LIGHTWEIGHT COMPOSITE STORAGE TO MAXIMIZE PAYLOAD AND ONBOARD HYDROGEN CAPACITY


FIGURE 10
30 TO 60 KG TANKS LEAD AS OEMS TARGET THIS CAPACITY FOR EXTENDED RANGE AND HIGH FREQUENCY FREIGHT OPERATIONS


FIGURE 11
300 TO 500 MILE RANGE LEADS AS IT ALIGNS WITH THE OPERATING DISTANCES AND ROUTE PATTERNS OF REGIONAL AND LONG HAUL FREIGHT


FIGURE 12
200 TO 400 KW MOTORS LEAD AS THIS POWER RANGE IS FOR HEAVY LOADS, HIGHWAY SPEEDS, AND SUSTAINED OPERATION


FIGURE 13
ASIA PACIFIC LEADS AS STRONG OEM PRESENCE, HYDROGEN VEHICLE DEPLOYMENT, GOVERNMENT SUPPORT, AND EXPANDING REFUELING INFRASTRUCTURE ACCELERATE ADOPTION


FIGURE 14
DRIVERS, RESTRAINTS, OPPORTUNITIES, AND CHALLENGES IN HYDROGEN BUS AND TRUCK MARKET


FIGURE 15
FLEET DECARBONIZATION PROCESS


FIGURE 16
PACIFIC NORTHWEST HYDROGEN HUB LED BY GOVERNMENT INITIATIVES


FIGURE 17
DISPENSED COST BUILD-UP FOR FUTURE TRANSPORTATION FUEL TYPES


FIGURE 18
COMPARISON OF AUTOIGNITION TEMPERATURE OF VARIOUS FUEL TYPES


FIGURE 19
COMPARISON OF MINIMUM IGNITION ENERGY FOR VARIOUS FUEL TYPES


FIGURE 20
HYDROGEN PRODUCTION WITH INTEGRATION OF RENEWABLE ENERGY


FIGURE 21
HYDROGEN CORRIDORS: INFRASTRUCTURE COMPANIES


FIGURE 22
HYDROGEN STORAGE AND TRANSPORTATION


FIGURE 23
ECOSYSTEM ANALYSIS


FIGURE 24
HYDROGEN BUS & TRUCK MARKET: SUPPLY CHAIN ANALYSIS


FIGURE 25
GEOLOGICAL HYDROGEN PROJECTS BY DEVELOPMENT STAGE, 2026


FIGURE 26
TIMELINE OF H2ICE TECHNOLOGY, 2017−2030


FIGURE 27
COMPARISON OF BUSES, BY OEM


FIGURE 28
AVERAGE SELLING PRICES OF KEY PLAYERS FOR HYDROGEN BUSES, 2022–2025 (USD THOUSAND)


FIGURE 29
AVERAGE SELLING PRICES OF KEY OEMS FOR HYDROGEN TRUCKS, 2022–2025 (USD THOUSAND)


FIGURE 30
HYDROGEN BUSES MARKET: AVERAGE SELLING PRICE TREND, BY REGION, 2022–2025 (USD THOUSAND)


FIGURE 31
HYDROGEN TRUCKS MARKET: AVERAGE SELLING PRICE TREND, BY REGION


FIGURE 32
IMPORT DATA FOR HS CODE 8702-COMPLIANT PRODUCTS, BY COUNTRY, 2022–2025 (USD MILLION)


FIGURE 33
EXPORT DATA FOR HS CODE 8702-COMPLIANT PRODUCTS, BY COUNTRY, 2022–2025 (USD MILLION)


FIGURE 34
TRENDS AND DISRUPTIONS IMPACTING CUSTOMER BUSINESS


FIGURE 35
INVESTMENT SCENARIO, 2022-2026 (USD MILLION)


FIGURE 36
BATTERY ELECTRIC TRUCKS VS. FUEL CELL ELECTRIC TRUCKS: 10-YEAR TOTAL COST OF OWNERSHIP BREAKDOWN


FIGURE 37
BATTERY ELECTRIC BUSES VS. FUEL CELL ELECTRIC BUSES: 10-YEAR TOTAL COST OF OWNERSHIP BREAKDOWN


FIGURE 38
BILL OF MATERIALS COMPARISON BETWEEN FUEL CELL ELECTRIC, ICE, AND BATTERY ELECTRIC BUSES (USD THOUSAND)


FIGURE 39
BILL OF MATERIAL COMPARISON BETWEEN FUEL CELL ELECTRIC, ICE, AND BATTERY ELECTRIC TRUCKS (USD THOUSAND)


FIGURE 40
SECTORS IMPACTED BY EU-INDIA FTA


FIGURE 41
IMPACT ON IMPORT DUTY FOR EUROPEAN VEHICLES DUE TO EU-INDIA FTA


FIGURE 42
IMPACT ON OEMS AND SUPPLIERS IN INDIA DUE TO EU-INDIA FTA


FIGURE 43
IMPACT ON AUTOMOTIVE COMPONENT TRADE DUE TO EU-INDIA FTA


FIGURE 44
HYDROGEN TRUCK & BUS DEVELOPMENT ROADMAP


FIGURE 45
PATENT ANALYSIS, 2016-2026


FIGURE 46
INFLUENCE OF STAKEHOLDERS ON BUYING PROCESS OF HYDROGEN BUSES AND TRUCKS


FIGURE 47
KEY BUYING CRITERIA FOR HYDROGEN BUSES AND TRUCKS, BY VEHICLE TYPE


FIGURE 48
200–400 KW SEGMENT TO LEAD MARKET DURING FORECAST PERIOD


FIGURE 49
300–500 MILES SEGMENT TO LEAD MARKET DURING FORECAST PERIOD


FIGURE 50
30–60 KG SEGMENT TO LEAD MARKET DURING FORECAST PERIOD


FIGURE 51
TYPE IV SEGMENT TO LEAD MARKET DURING FORECAST PERIOD


FIGURE 52
HYDROGEN TRUCK SEGMENT TO LEAD MARKET DURING FORECAST PERIOD


FIGURE 53
WORKING PRINCIPLE OF HYDROGEN BUSES


FIGURE 54
HYDROGEN BUS & TRUCK MARKET, BY REGION, 2026 VS. 2035 (USD MILLION)


FIGURE 55
ASIA PACIFIC: HYDROGEN BUS & TRUCK MARKET SNAPSHOT


FIGURE 56
CHINA: ROADMAP AND STRATEGY FOR HYDROGEN-POWERED VEHICLES, 2020–2030


FIGURE 57
JAPAN: ROADMAP AND STRATEGY FOR HYDROGEN-POWERED VEHICLES, 2020–2030


FIGURE 58
SOUTH KOREA: ROADMAP AND STRATEGY FOR HYDROGEN GENERATION, 2020–2035


FIGURE 59
EUROPE: HYDROGEN BUS & TRUCK MARKET SNAPSHOT


FIGURE 60
UK: HYDROGEN NET ZERO INVESTMENT ROADMAP, 2021–2035


FIGURE 61
NORTH AMERICA: HYDROGEN BUS & TRUCK MARKET SNAPSHOT


FIGURE 62
MARKET SHARE ANALYSIS OF KEY PLAYERS, 2025


FIGURE 63
REVENUE ANALYSIS OF KEY PLAYERS, 2021-2025


FIGURE 64
COMPANY VALUATION OF KEY PLAYERS, 2026


FIGURE 65
FINANCIAL METRICS OF KEY PLAYERS, 2026


FIGURE 66
BRAND/PRODUCT COMPARISON


FIGURE 67
HYDROGEN BUS AND TRUCK MARKET: COMPANY EVALUATION MATRIX (KEY PLAYERS), 2025


FIGURE 68
COMPANY FOOTPRINT


FIGURE 69
HYDROGEN BUS AND TRUCK MARKET: COMPANY EVALUATION MATRIX (STARTUPS/SMES), 2025


FIGURE 70
FOTON INTERNATIONAL: COMPANY SNAPSHOT


FIGURE 71
YUTONG BUS CO., LTD.: COMPANY SNAPSHOT


FIGURE 72
XIAMEN KING LONG INTERNATIONAL TRADING CO., LTD.: COMPANY SNAPSHOT


FIGURE 73
SOLARIS BUS & COACH SP. Z O.O.: COMPANY SNAPSHOT


FIGURE 74
HYUNDAI MOTOR CORPORATION: COMPANY SNAPSHOT


FIGURE 75
ANHUI ANKAI AUTOMOBILE CO., LTD: COMPANY SNAPSHOT


FIGURE 76
TOYOTA MOTOR CORPORATION: COMPANY SNAPSHOT


FIGURE 77
VDL GROEP: COMPANY SNAPSHOT


FIGURE 78
NFI GROUP: COMPANY SNAPSHOT


FIGURE 79
ZHONGTONG BUS HOLDING CO., LTD.: COMPANY SNAPSHOT


FIGURE 80
DAIMLER TRUCK AG: COMPANY SNAPSHOT


FIGURE 81
IVECO S.P.A.: COMPANY SNAPSHOT


FIGURE 82
RESEARCH DESIGN


FIGURE 83
RESEARCH PROCESS FLOW


FIGURE 84
BREAKDOWN OF PRIMARY INTERVIEWS: BY COMPANY TYPE, DESIGNATION, AND REGION


FIGURE 85
RESEARCH METHODOLOGY: HYPOTHESIS BUILDING


FIGURE 86
MARKET SIZE ESTIMATION METHODOLOGY FOR HYDROGEN BUS & TRUCK MARKET: BOTTOM-UP APPROACH


FIGURE 87
MARKET SIZE ESTIMATION METHODOLOGY FOR HYDROGEN BUS & TRUCK MARKET: TOP-DOWN APPROACH


FIGURE 88
DATA TRIANGULATION


FIGURE 89
MARKET GROWTH PROJECTIONS FROM DEMAND-SIDE DRIVERS


FIGURE 90
DEMAND AND SUPPLY-SIDE FACTOR ANALYSIS


Methodology

The study involved four major activities in estimating the current size of the hydrogen bus & truck market. Exhaustive secondary research was done to collect information on the market, the peer market, and the parent market. The next step was to validate these findings, assumptions, and sizing with industry experts across value chains through primary research. The top-down and bottom-up approaches were employed to estimate the complete market size. Thereafter, market breakdown and data triangulation processes were used to estimate the market size of segments and subsegments.

Secondary Research

Secondary sources referred to for this research study included hydrogen bus & truck industry organizations; corporate filings such as annual reports, investor presentations, and financial statements; trade and business whitepapers and databases; and articles from recognized associations and government publishing sources. The secondary data was collected and analyzed to arrive at the overall market size, which was further validated by primary research.

Primary Research

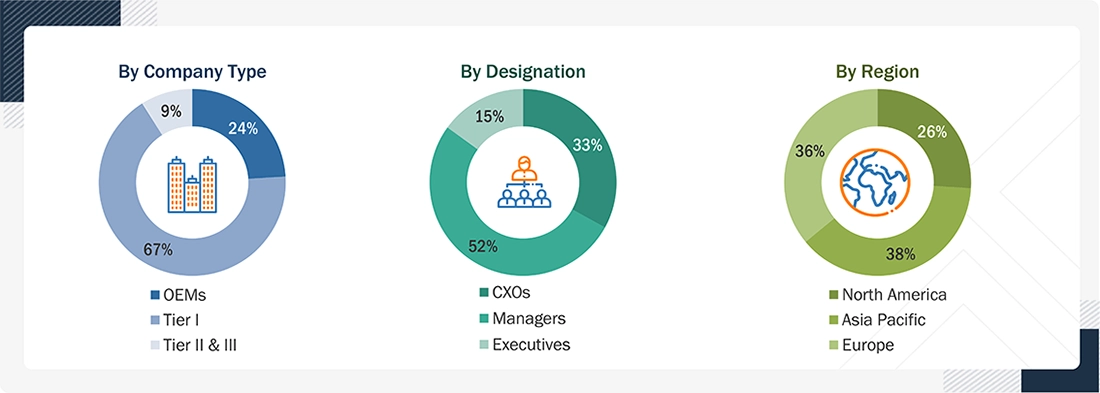
Extensive primary research was conducted after acquiring an understanding of this market scenario through secondary research. Several primary interviews were conducted with market experts from the demand- and supply-side OEMs (in terms of component supply, country-level government associations, and trade associations) and component manufacturers across four major regions, namely, Asia Pacific, Europe, and North America. Approximately 25% and 75% of primary interviews were conducted with the demand and supply sides, respectively. Primary data was collected through questionnaires, emails, LinkedIn, and telephonic interviews. In the canvassing of primary data, various departments within organizations, such as sales, operations, and administration, were covered to provide a holistic viewpoint in the report.

Brief sessions with highly experienced independent consultants were conducted to reinforce findings from primaries after interacting with industry experts. This, along with in-house subject matter experts’ opinions, led to the findings described in the remainder of this report.

In the primary research process, various primary sources from the supply and demand sides were interviewed to obtain qualitative and quantitative information for the report. The primary sources from the supply side included industry experts, such as Vice Presidents (VPs), marketing directors, technology and innovation directors, and related key executives from various key companies and organizations. The primary sources from the demand side included end users, such as Chief Information Officers (CIOs), consultants, service professionals, technicians and technologists, and managers at public and investor-owned utilities.

Breakdown of Primary Interviews

Hydrogen Bus & Truck Market 
 Size, and Share

Note: Others include purchase and sales managers, marketing managers, and product managers.

To know about the assumptions considered for the study, download the pdf brochure

Market Size Estimation

  • Bottom-up Approach

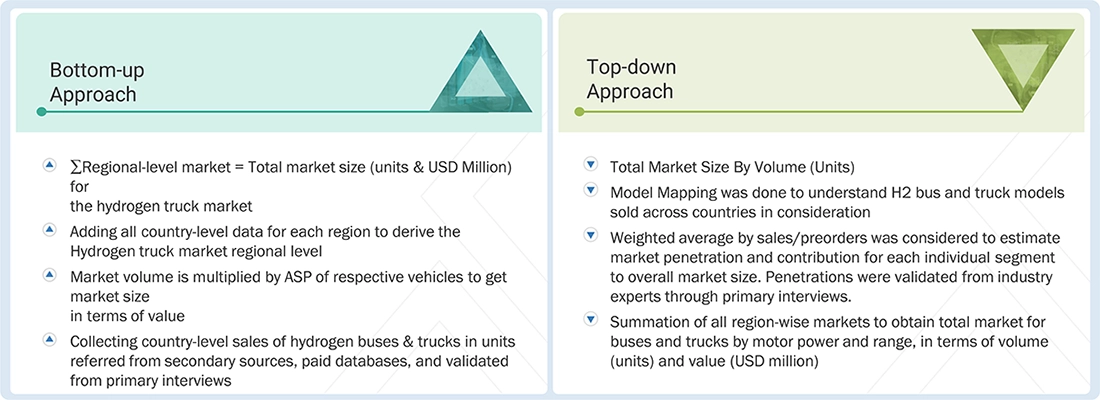
The bottom-up approach was used to estimate and validate the size of the hydrogen bus & truck market. In this approach, the vehicle sales statistics for each vehicle type (buses and trucks) were considered at a country level. A model mapping of fuel cell vehicles was carried out for each country and vehicle type to determine the market size in terms of volume. The number of FCEV models varied from country to country. After analyzing the models, the segments were classified further into power output type, component, and region. From the model mapping, the market penetration of the automotive fuel cell segments was multiplied by the country-level FCEV sales considered in the study, giving the volume of each segment type. The country-level data were summed up to arrive at the region-level data in terms of volume. The summation of the country-level market sizes gave the regional market size, and further summation provided the global hydrogen bus & truck market size.

  • Top-Down Approach

The top-down approach was used to estimate and validate the size of the hydrogen bus & truck market at the global level by range, motor power, tank type, and hydrogen tank size, in terms of volume. This approach identifies key range, motor power, tank type, and hydrogen tank size segments of the hydrogen bus & truck market at the regional level. The penetration of each identified segment was multiplied by the volume of each vehicle at the regional level to derive the total segment volume.

The hydrogen bus & truck market for tank types was derived using a top-down approach to estimate the subsegments, namely type III and type IV tanks. This method derived the market size, in terms of volume, at the regional level for each segment. The total volume of the hydrogen bus & truck market was multiplied by the adoption rate break-up percentage of these segments at the regional level (range, motor power, hydrogen tank size, tank type, fuel cell type).

Hydrogen Bus & Truck Market Top Down and Bottom Up Approach

Data Triangulation

After arriving at the overall market size using the market size estimation processes as explained above, the market was split into several segments and subsegments. To complete the overall market engineering process and arrive at the exact statistics of each market segment and subsegment, data triangulation and market breakdown procedures were employed, wherever applicable. The data were triangulated by studying various factors and trends from both the demand and supply sides.

Market Definition

Hydrogen buses and trucks are medium and heavy-duty vehicles powered by hydrogen fuel cells. A hydrogen fuel cell generates electricity through a chemical reaction between hydrogen and oxygen, which powers the vehicle’s electric motor. Hydrogen buses & trucks offer zero-emission transportation, helping to reduce air pollution in urban areas. These buses can be quickly refueled and provide a range comparable to or better than traditional diesel buses. Hydrogen buses are used for long-haul and short-distance commercial and passenger travel. Hydrogen trucks are designed for various applications, such as long-haul transportation, construction, and delivery services. They provide the benefits of zero emissions and can be refueled quickly.

Key Stakeholders

  • Automobile OEMs
  • Automotive fuel cell raw material suppliers
  • Automotive fuel cell suppliers
  • Environmental Protection Agency (EPA)
  • Government departments
  • Hydrogen gas suppliers
  • Hydrogen station service providers
  • Industry associations
  • Transit agencies

Report Objectives

  • To analyze and forecast the hydrogen bus & truck market in terms of value (USD million) and volume (thousand units) from 2026 to 2035
  • To segment the market by vehicle type, motor power, range, hydrogen tank size, type of tank, and region
  • To provide detailed information about the factors influencing market growth (drivers, challenges, restraints, and opportunities)
  • To strategically analyze the market for individual growth trends, prospects, and contributions to the total market
  • To study the following with respect to the market:
  • Value Chain Analysis
  • Ecosystem Analysis
  • Technology Analysis
  • Trade Analysis
  • Pricing Analysis
  • Case Study Analysis
  • Patent Analysis
  • Tariff and Regulatory Landscape
  • Key Stakeholders and Buying Criteria
  • MNM Insights on key OEMs
  • Hydrogen Refueling Station Setup Trends, By Region
  • Hydrogen Commercial Vehicles’ Fuel Capacity and Range
  • Country-Level Targets of Hydrogen Buses/Trucks and Refueling Stations
  • H2ICE Buses & Trucks
  • Total Cost of Ownership Comparison of ICE and FCEV Buses and Trucks
  • Bill of Material Comparison Between FCEVs, ICE Vehicles, and BEVs    
  • OEMs Vs. Existing and Upcoming Hydrogen Vehicle Models
  • Regulatory Landscape
  • Key Conferences and Events
  • Investment and Funding Scenario
  • To strategically profile the key players and comprehensively analyze their market share and core competencies
  • To analyze the opportunities for stakeholders and the competitive landscape for market leaders
  • To track and analyze competitive developments, such as deals, product launches/developments, expansions, and other activities undertaken by the key industry participants

Available customizations:

With the given market data, MarketsandMarkets offers customizations in line with company-specific needs.

  • Hydrogen bus & truck market, by vehicle class at the regional level
  • Hydrogen bus & truck market in additional countries (up to three)
  • Profiling of additional market players (up to five)


Personalize This Research

  • Triangulate with your Own Data
  • Get Data as per your Format and Definition
  • Gain a Deeper Dive on a Specific Application, Geography, Customer or Competitor
  • Any level of Personalization
Request A Free Customisation

Let Us Help You

  • What are the Known and Unknown Adjacencies Impacting the Hydrogen Bus & Truck Market

  • What will your New Revenue Sources be?
  • Who will be your Top Customer; what will make them switch?
  • Defend your Market Share or Win Competitors
  • Get a Scorecard for Target Partners
Customized Workshop Request

Custom Market Research Services

We Will Customise The Research For You, In Case The Report Listed Above Does Not Meet With Your Requirements

Get 10% Free Customisation

TESTIMONIALS

Growth opportunities and latent adjacency in Hydrogen Bus & Truck Market

DMCA.com Protection Status
popup img