Hydrogen Valve Market Size, Trends & Growth Share

Hydrogen Valve Market by Type (Ball, Needle, Check, Pressure Relief, Globe, Flow Control), Size, Material (Steel, Aluminum), Pressure, Implementation, Application (Production, Fueling Station, Storage, Transportation, Fuel Sell) - Global Forecast to 2030

Report Code: SE 9118 Aug, 2024, by marketsandmarkets.com

Updated on : Sep 13, 2024

Hydrogen Valve Market Size & Share

[236 Pages Report] The global hydrogen valve market size was worth USD 331 million in 2024 and is anticipated to reach USD 507 million by 2030. The market is estimated to grow at a CAGR of 7.4% during the forecast period.

Hydrogen is considered the future’s fuel, and thus, the importance of hydrogen production, transportation, and storage has increased in recent years and may also grow in the future. This hydrogen can be at low-pressure, high-pressure, or cryogenic levels. The system that handles hydrogen at various levels requires a Valve system, apart from other components or equipment. So, the demand for hydrogen valves is expected to increase in the future with the increase in the demand for hydrogen.

Besides applying valves in various industries at various levels, hydrogen valves are also used to produce hydrogen-based IC engines. It has been observed that electric vehicles are not going to sustain much in the future, and they may be replaced by hydrogen IC (internal combustion) based vehicles. Recently, Kawasaki tested hydrogen-powered internal combustion engines for motorcycles, and they are expecting this to be commercialized by 2023.

Impact of Artificial Intelligence on Hydrogen Valve

Artificial intelligence (AI) is a new trend in the market that impacts every industrial manufacturing aspect. Companies related to valves are also trying to implement artificial intelligence at various levels of valve development and its operation in the real world. AI can be used to improve the design, material selection, and other specifications of hydrogen valves.

While in operation, AI can help identify any deviation in the valve operation during the production process. Early detection of such deviations using AI will help ensure the smooth and efficient operation of the production process. AI can have various uses; however, some typical use cases for implementing AI in valve systems can be predictive maintenance, design optimization, failure detection, real-time monitoring, and customer specification analysis.

Hydrogen Valve Market

Attractive opportunities in the hydrogen valve market

Hydrogen Valve Market

Hydrogen Valve Market

Hydrogen Valve Market Forecast to 2029

To know about the assumptions considered for the study, Request for Free Sample Report

Hydrogen Valve Market Trends:

Driver: Increasing Demand for Hydrogen Valves Driven by Clean Energy Adoption and Ammonia Production

The global market for hydrogen valves is poised for significant growth, driven by the increased adoption of hydrogen as a clean energy source and the escalating demand for hydrogen in ammonia production. As the hydrogen infrastructure expands globally, including developing production facilities, storage systems, and distribution networks, there is a growing need for specialized valves designed to manage hydrogen's unique properties.

These valves are essential for preventing leaks, withstanding high pressures, and ensuring the safe and efficient handling of hydrogen across its supply chain. The transportation, industrial, and residential energy sectors are witnessing heightened demand for these crucial components. In particular, the production of green ammonia, which uses hydrogen derived from renewable sources, is becoming increasingly prevalent as industries shift towards sustainable practices.

This transition requires advanced hydrogen valves capable of handling high-purity hydrogen and maintaining stringent operational standards, ensuring safety and efficiency in production processes. Consequently, manufacturers invest heavily in innovative valve technologies to meet these requirements, fostering substantial market growth.

Restraint: Hydrogen Embrittlement and the Need for Standardization in Hydrogen Valves

One of the major problems in the hydrogen industry is hydrogen embrittlement, particularly in metals like steel. This is a process that, under pressure, involves the diffusing of hydrogen molecules into the metal lattice structure to cause hydrogen-induced fracturing. This significantly lowers tensile strength and ductility, leading to their cracking and failure under very low stress levels. An increase in density for hydrogen atoms at imperfections such as grain boundaries or dislocations accelerates the degradation of mechanical properties.

Material selection, surface treatments, design strategies—all these critical choices industries using high-strength steels excel in with great relevance to hydrogen-rich environments, such as storage tanks and pipes. Proper handling and operating procedures must be followed to reduce exposure as much as possible and avoid embrittlement-related risks to the safety and reliability of hydrogen infrastructure and components. Another major challenge facing the hydrogen industry is the lack of universal standards related to design and specifications for hydrogen valves.

This inconsistency thus brings about compatibility problems, operational inefficiencies, and safety concerns. Indeed, the fragmented market requires manufacturers and users alike to deal with several different specifications, thus complicating production and maintenance. Industry groups and regulatory agencies are trying to develop and implement industry-wide standards, but that is quite a heavy and time-consuming process to achieve a high level of adoption. Until these standards are universal, the lack of uniformity will continue to stunt growth and efficiency in the hydrogen sector.

Opportunity: Growing Adoption of Hydrogen Fuel Cell Systems and Strategic Partnerships in the Hydrogen Valve Market

Increasing application of hydrogen fuel cell systems opens up huge potential in the valve market. As automotive manufacturers invest in hydrogen fuel cell technology to advance zero-emission vehicle production, the demand has been building up for specialized valves within fuel cell vehicles that would ensure efficient hydrogen gas flow into the fuel cell stack. During the growth of hydrogen refueling infrastructure, growth opportunities include valves developed by manufacturers to be dispensed at high pressure and comply with rigorous safety standards.

Stationary fuel cell applications require backup power and distributed energy generation with valves optimized for reliability and varying operating conditions. Hydrogen fuel cells integrated with energy storage systems increase the valves needed to transfer hydrogen between storage tanks, fuel cells, and electrolyzers. Upgrades and expansions in hydrogen infrastructure entail the addition of new production plant distribution pipelines, which, in turn, create demand for valves resilient to hydrogen embrittlement compatible with high-pressure conditions.

That implies that new valve technologies developed for hydrogen service conditions can make a big case for growth potential in this emerging market. Strategic collaboration is needed between hydrogen manufacturers and valve manufacturers to spur innovation and accelerate market growth. 

Such partnerships pool skills and resources for developing standardized hydrogen valves, whose compatibility and reliability have become very advanced across the industry. Valve manufacturers design and build components capable of withstanding hydrogen systems. In contrast, hydrogen infrastructure developers and fuel cell vehicle OEMs provide the holistic framework for producing, storing, distributing, and using hydrogen in transport.

Challenge: Hydrogen System Integrity Challenges and High Valve Cost

The handling of hydrogen comes with peculiar challenges due to its lightness, which makes it highly prone to leak through packings and joints; this calls for extra careful design considerations in order not only to assure the integrity of the system but also to eliminate safety risks. Another problem with hydrogen lies in its small molecules, which makes them easily diffuse through the materials, affecting the valves' size and efficiency and calling for special engineering solutions.

Tight sealing at all the interfaces is essential, especially during refueling, as it prevents leakage and maximizes the safety aspect related to the flammability factor of hydrogen. Not only safety but leakage also causes loss in the economy. The high initial cost of hydrogen valves adds to the woes. These valves require special materials—stainless steel and nickel alloys—to prevent embrittlement and leakage, as well as precision engineering, close tolerance, and advanced machining.

Moreover, adding tests for pressure resistance, leak detection, and durability increases their complexity and, thus, cost, with safety features such as redundant seals and pressure relief mechanisms. High costs, therefore, result from continuous research and development aimed at bettering materials and manufacturing processes, creating a barrier for any new market entrants; this definitely slows down the diffusion of hydrogen technology. Key reductions in these areas must thus be achieved through material innovations, economies of scale, and improved manufacturing techniques to realize the broader use of hydrogen as a clean energy source.

Hydrogen Valve Market Ecosystem

Prominent companies in this market include well-established, financially stable hydrogen valve providers such as Emerson Electric Co. (US), IMI (UK), SLB (US), Valmet (Finland), and Crane Company (US). These companies have been operating in the market for several years and possess a diversified product portfolio and strong global sales and marketing networks. Along with the well-established companies, many small and medium companies operate in this market, such as Hartmann Valves GmbH (Germany) and Vexve Oy (Finland).

Hydrogen Valve Market
 by Ecosystem

Hydrogen Valve Industry Segmentation

Ball Valve to hold largest market share among valve type of hydrogen valve market in 2023

The hydrogen ball valve market is growing on the back of a growing hydrogen economy across energy, automotive, and industrial applications. Some of the key drivers include technological development, government policy, and deep investments in hydrogen infrastructure. Innovation in these products comes from some leading regions like North America, Europe, and Asia-Pacific to ensure efficient and reliable hydrogen distribution. This means that these developments are fueling the growth of the market and creating sustainable energy solutions, and the need for hydrogen ball valves will be of increased priority to the development of future energy systems.

The new installment is expected to have a larger market share by implementation in 2023.

The hydrogen valve market for new installations has a high market share driven by various factors. The latest installation segment holds a significant market share in the market due to the rising adoption of hydrogen technologies and substantial investments in clean energy infrastructure.

This segment is marked by considerable capital expenditure and long-term contracts essential for developing hydrogen economies. One of the major reasons is the growing projects of hydrogen production globally. The market for new installations is also driven partly by substantial government funding to advance hydrogen infrastructure.

By material, stainless steel is expected to grow with the highest CAGR in the forecast period (2024 – 2030).

In 2023, stainless steel hydrogen valves held the largest market share and are expected to grow at the highest CAGR. Stainless steel is a material of choice for hydrogen valves because it resists hydrogen embrittlement. Since stainless steel resists corrosion, it should work fine in service involving hydrogen production, storage, and transport, where safety and reliability are critical. Regarding pressure rating and temperature tolerance, stainless steel is more robust than other metals such as cast iron, ductile iron, brass, and copper. The property of resisting corrosion has made stainless steel mostly preferred in many applications.

Hydrogen Valve in Hydrogen storage to hold largest market share in 2023

There is vast potential for hydrogen storage in the hydrogen valve market because of the increased demand, which will require efficient, safe, and scalable storage solutions. With the development of advanced storage technologies and infrastructure, it becomes necessary to have valves that can sustain heavy pressures without leaking a single drop. Development in storage systems—compressed hydrogen tanks, cryogenic storage, and others—pushes the demand for trustworthy hydrogen valves.

Hydrogen Valve Industry Regional Analysis

In 2023, Asia Pacific will have the largest market share of the overall hydrogen valve market.

Hydrogen Valve Market by Region

Hydrogen Valve Market by Region

To know about the assumptions considered for the study, download the pdf brochure

Asia Pacific held the largest share, approximately 34.8% of the hydrogen valve market 2023. Rapid population growth and urbanization in developing economies such as China, Japan, and India have led to the development of the energy & power, water & wastewater treatment, chemicals, pharmaceuticals, and oil & gas industries.

The Asia Pacific region has witnessed a significant increase in the market due to expanding industrial sectors such as power generation, as hydrogen is primarily used in industrial applications. Asia Pacific emerges as a promising region for hydrogen valves due to its significant potential for both hydrogen production and consumption.

Top Hydrogen Valve Companies - Key Market Players

Hydrogen Valve Market Report Scope

Report Metric

Details

Estimated Market Size  USD 331 million in 2024
Projected Market Size USD 507 million by 2030
Growth Rate CAGR of 7.4%

Market Size Availability for Years

2021–2030

Base Year

2023

Forecast Period

2024–2030

Forecast Units

Value (USD Million/Billion)

Segments Covered

By valve type, material, size, pressure range, implementation, application, end-user industry, and region

Geographies Covered

North America, Europe, Asia Pacific, and RoW

Companies Covered

Emerson Electric Co. (US), IMI (UK), SLB (US), Valmet (Finland), Crane Company (US), Westport Fuel Systems Inc. (Canada),  KITZ Corporation (US),  PARKER HANNIFIN CORP (US), Baker Hughes Company (US), Swagelok Company (US) are some of the key players in the hydrogen valve market.

Hydrogen Valve Market Highlights

This research report categorizes the hydrogen valve market based on by valve type, material. size, pressure range, implementation, application, end-user industry, and region.
Hydrogen valve market:

Segment

Subsegment

By Valve Type

  • Introduction
  • Needle Valve
  • Ball Valve
  • Check valve
  • Pressure Relief Valve
  • Globe Valve
  • Flow control Valve
  • Others

By Material

  • Introduction
  • Stainless steel
  • Aluminum
  • Others

By Pressure Range

  • Introduction
  • Upto 50 bar
  • 50-350 bar
  • 350-700 bar
  • 700-1500
  • More than 1500 bar

By Size

  • Introduction
  • Below 1 Inch
  • 1-6 Inch
  • 6-12 Inch
  • 12-20 Inch
  • More than 20 Inch

By Implementation Type

  • Introduction
  • New Installation
  • Retrofit Installation

By Application

  • Introduction
  • Hydrogen Production
  • Hydrogen Fueling Station
  • Hydrogen Storage
  • Hydrogen Transportation
  • Hydrogen Fuel Cells

By End Use Industry

  • Introduction
  • Oil & Gas
  • Energy & Power
  • Pharmaceutical
  • Chemical
  • Metals & Mining
  • Food & Beverage
  • Automotive
  • Others

By Region

  • Introduction
  • North America
    • Impact of Recession
    • US
    • Canada
    • Mexico
  • Europe
    • Impact of Recession
    • UK
    • Germany
    • France
    • Italy
    • Rest of Europe
  • Asia Pacific
    • Impact of Recession
    • China
    • Japan
    • India
    • South Korea
    • Rest of Asia Pacific
  • RoW
    • Impact of Recession
    • Middle East
      • GCC Countries
      • Rest of Middle East
    • Africa
    • South America

Recent Developments in Hydrogen Valve Industry

  • In May 2024, Crane Company announced its acquisition of CryoWorks Inc., a leading manufacturer specializing in storing, distributing, and transferring cryogenic fluids. This strategic move aims to strengthen Crane’s position in the energy transition and cryogenic sectors. CryoWorks Inc. is renowned for its expertise in vacuum-insulated pipe systems and overcoming cryogenics and hydrogen industry challenges.
  • In February 2024, Valmet introduces the Neles XH series ball valve for hydrogen applications. Along with its emission control capabilities, the new XH series enables raw material savings, resulting in a weight reduction of up to 30 percent. Enhanced material efficiency also boosts the efficiency and sustainability of related processes, from transportation and logistics to installation and commissioning.
  • In February 2024, Westport Fuel Systems Inc. announced an investment of up to $10 million in a manufacturing facility in Changzhou, China. According to the investment agreement, the City of Changzhou will construct a new hydrogen innovation center and manufacturing facility in the Changzhou Hydrogen Valley. The new Westport facility will support Westport’s current and expanding customer base by providing key hydrogen components for various applications, including commercial vehicles, material handling, and stationary power generation.
  • In November 2023, Parker Hannifin Corp's Instrumentation Products Division announced the launch of Hi-Pro Series ball valves and HNV Series needle valves with fully integrated O-LOK O-Ring Face Seal (ORFS) fitting connections. This addition enhances the company's already successful valve lineup, which features A-LOK two-ferrule connections.

Frequently Asked Questions (FAQ’s):

To speak to our analyst for a discussion on the above findings, click Speak to Analyst

TABLE OF CONTENTS
 
1 INTRODUCTION (Page No. - 23)
    1.1 STUDY OBJECTIVES 
    1.2 MARKET DEFINITION AND SCOPE 
           1.2.1 INCLUSIONS AND EXCLUSIONS
    1.3 STUDY SCOPE 
           1.3.1 MARKETS COVERED
           1.3.2 YEARS CONSIDERED
    1.4 CURRENCY CONSIDERED 
    1.5 LIMITATIONS 
    1.6 MARKET STAKEHOLDERS 
    1.7 SUMMARY OF CHANGES 
 
2 RESEARCH METHODOLOGY (Page No. - 28)
    2.1 INTRODUCTION 
           2.1.1 SECONDARY DATA
                    2.1.1.1 List of major secondary sources
                    2.1.1.2 Key data from secondary sources
           2.1.2 PRIMARY DATA
                    2.1.2.1 Breakdown of primaries
                    2.1.2.2 Key data from primary sources
           2.1.3 SECONDARY AND PRIMARY RESEARCH
                    2.1.3.1 Key industry insights
    2.2 MARKET SIZE ESTIMATION 
           2.2.1 BOTTOM-UP APPROACH
                    2.2.1.1 Approach for arriving at market size using bottom-up approach
           2.2.2 TOP-DOWN APPROACH
                    2.2.2.1 Approach for arriving at market size using top-down approach
    2.3 MARKET BREAKDOWN AND DATA TRIANGULATION 
    2.4 RESEARCH ASSUMPTIONS 
    2.5 RISK ASSESSMENT 
 
3 EXECUTIVE SUMMARY (Page No. - 39)
 
4 PREMIUM INSIGHTS (Page No. - 44)
    4.1 ATTRACTIVE GROWTH OPPORTUNITIES FOR HYDROGEN VALVE MARKET 
    4.2 MARKET, BY VALVE TYPE 
    4.3 MARKET, BY MATERIAL 
    4.4 MARKET, BY IMPLEMENTATION 
    4.5 MARKET, BY APPLICATION 
    4.6 MARKET, BY END-USE INDUSTRY 
    4.7 ASIA PACIFIC HYDROGEN VALVE MARKET, BY APPLICATION AND COUNTRY 
    4.8 MARKET, BY COUNTRY 
 
5 MARKET OVERVIEW (Page No. - 49)
    5.1 INTRODUCTION 
    5.2 MARKET DYNAMICS 
           5.2.1 DRIVERS
                    5.2.1.1 Increased adoption of hydrogen as clean energy source
                    5.2.1.2 Increase in demand for hydrogen valves in ammonia production
                    5.2.1.3 Government regulations and policies to promote hydrogen production and use
           5.2.2 RESTRAINTS
                    5.2.2.1 Hydrogen embrittlement on certain metals
                    5.2.2.2 Lack of standardization
           5.2.3 OPPORTUNITIES
                    5.2.3.1 Growing adoption of hydrogen in IC engine vehicles
                    5.2.3.2 Strategic partnerships between hydrogen manufacturers and valve manufacturers
           5.2.4 CHALLENGES
                    5.2.4.1 Possibility of leaks in packings and joints
                    5.2.4.2 Higher initial costs
    5.3 VALUE CHAIN ANALYSIS 
    5.4 MARKET ECOSYSTEM 
    5.5 INVESTMENT AND FUNDING SCENARIO 
    5.6 PRICING ANALYSIS 
           5.6.1 AVERAGE SELLING PRICE OF HYDROGEN VALVE TYPES OFFERED BY MAJOR PLAYERS
           5.6.2 PRICES OF HYDROGEN VALVES ACCORDING TO PRESSURE & SIZE
    5.7 TRENDS/DISRUPTIONS IMPACTING CUSTOMER BUSINESS 
    5.8 PORTER’S FIVE FORCES ANALYSIS 
           5.8.1 THREAT OF NEW ENTRANTS
           5.8.2 THREAT OF SUBSTITUTES
           5.8.3 BARGAINING POWER OF SUPPLIERS
           5.8.4 BARGAINING POWER OF BUYERS
           5.8.5 INTENSITY OF COMPETITIVE RIVALRY
    5.9 CASE STUDY ANALYSIS 
           5.9.1 A. HOCK PROVIDES HYDROGEN VALVES FOR BATTOLYSER SYSTEMS
           5.9.2 PARKER HANNIFIN OFFERS SPECIFICALLY DESIGNED VALVES FOR HIGH-PRESSURE HYDROGEN APPLICATIONS TO AIR LIQUIDE
           5.9.3 PARKER HANNIFIN’S VALVES CONTROL HYDROGEN CONSUMPTION IN DOW CHEMICALS MANUFACTURING PROCESSES
    5.10 TECHNOLOGY TRENDS 
           5.10.1 KEY TECHNOLOGY
                    5.10.1.1 Artificial Intelligence
           5.10.2 COMPLEMENTARY TECHNOLOGY
                    5.10.2.1 SCADA System
           5.10.3 ADJACENT TECHNOLOGY
                    5.10.3.1 Internet of Things (IoT)
    5.11 KEY STAKEHOLDERS AND BUYING CRITERIA 
           5.11.1 KEY STAKEHOLDERS IN BUYING PROCESS
           5.11.2 BUYING CRITERIA
    5.12 TRADE ANALYSIS 
           5.12.1 TRADE ANALYSIS FOR HS CODE 848110
    5.13 PATENT ANALYSIS 
           5.13.1 MAJOR PATENTS
    5.14 KEY CONFERENCES AND EVENTS, 2024–2025 
    5.15 TARIFF, REGULATIONS, AND STANDARDS 
           5.15.1 REGULATORY BODIES, GOVERNMENT AGENCIES, AND OTHER ORGANIZATIONS
    5.16 STANDARDS 
    5.17 IMPACT OF AI ON HYDROGEN VALVE MARKET 
           5.17.1 INTRODUCTION
           5.17.2 AI-SPECIFIC USE CASES
           5.17.3 FUTURE OF AI IN VALVE ECOSYSTEM
 
6 HYDROGEN VALVE MARKET, BY VALVE TYPE (Page No. - 81)
    6.1 INTRODUCTION 
    6.2 BALL VALVES 
           6.2.1 INVESTMENT IN ADVANCED TECHNOLOGY TO DRIVE MARKET
    6.3 NEEDLE VALVES 
           6.3.1 ADOPTION OF HYDROGEN AS CLEAN ENERGY SOURCE TO DRIVE DEMAND
    6.4 CHECK VALVES 
           6.4.1 INCREASED NEED TO PREVENT BACKFLOW AND ENSURE SAFE STORAGE
    6.5 PRESSURE RELIEF VALVES 
           6.5.1 CRUCIAL TO CONTROL AND REGULATE PRESSURE WITHIN HYDROGEN STORAGE TANKS AND PIPELINES
    6.6 GLOBE VALVES 
           6.6.1 ADVANCEMENTS IN HYDROGEN STORAGE INFRASTRUCTURE – KEY DRIVER
    6.7 FLOW CONTROL VALVES 
           6.7.1 LOW VISCOSITY AND HIGH DIFFUSIVITY LEAD TO HIGH DEMAND
    6.8 OTHER VALVES 
           6.8.1 EXPANSION IN HYDROGEN SECTOR TO DRIVE DEMAND
 
7 HYDROGEN VALVE MARKET, BY MATERIAL (Page No. - 95)
    7.1 INTRODUCTION 
    7.2 STAINLESS STEEL 
           7.2.1 STRENGTH AND CORROSION RESISTANCE TO DRIVE DEMAND
    7.3 ALUMINUM 
           7.3.1 RESILIENCE AGAINST EXTREME TEMPERATURES TO BOOST GROWTH
    7.4 OTHERS 
 
8 HYDROGEN VALVE MARKET, BY PRESSURE RANGE (Page No. - 100)
    8.1 INTRODUCTION 
    8.2 <50 BAR 
           8.2.1 SEGMENT TO EXHIBIT HIGHEST CAGR DURING FORECAST PERIOD
    8.3 >50–350 BAR 
           8.3.1 WIDELY USED IN FUEL CELL ELECTRIC VEHICLES
    8.4 >350–700 BAR 
           8.4.1 SEGMENT TO HOLD LARGEST SHARE IN MARKET
    8.5 >700–1,000 BAR 
           8.5.1 HIGH DEMAND IN HIGH-PRESSURE APPLICATIONS
    8.6 >1,000 BAR 
           8.6.1 HIGH DEMAND DUE TO EXCELLENT SAFETY AND RELIABILITY
 
9 HYDROGEN VALVE MARKET, BY SIZE (Page No. - 108)
    9.1 INTRODUCTION 
    9.2 <1" 
           9.2.1 SEGMENT TO GROW FASTEST DURING FORECAST PERIOD
    9.3 >1"–6" 
           9.3.1 WIDELY USED IN HYDROGEN FUEL CELLS
    9.4 >6”–12” 
           9.4.1 TO BE WIDELY USED IN HYDROGEN PRODUCTION DURING FORECAST PERIOD
    9.5 >12”–20” 
           9.5.1 WIDELY USED FOR HYDROGEN STORAGE
    9.6 >20” 
           9.6.1 MOSTLY USED IN HYDROGEN PRODUCTION AND STORAGE
 
10 HYDROGEN VALVE MARKET, BY IMPLEMENTATION (Page No. - 116)
     10.1 INTRODUCTION 
     10.2 NEW INSTALLATION 
             10.2.1 HOLDS LARGEST MARKET SHARE DUE TO INCREASE IN HYDROGEN PROJECTS
     10.3 RETROFIT INSTALLATION 
             10.3.1 REGULATORY REQUIREMENTS FOR GREEN ENERGY TO BOOST SEGMENT
 
11 HYDROGEN VALVE MARKET, BY APPLICATION (Page No. - 120)
     11.1 INTRODUCTION 
     11.2 HYDROGEN PRODUCTION 
             11.2.1 SEGMENT DRIVEN BY NEED FOR CLEAN ENERGY SOURCES
             11.2.2 MARKET, BY HYDROGEN PRODUCTION
                        11.2.2.1 Grey Hydrogen
                        11.2.2.2 Blue, Brown, and Black Hydrogen
                        11.2.2.3 Green Hydrogen
     11.3 HYDROGEN FUEL CELLS 
             11.3.1 EFFICIENT, ZERO-EMISSION ENERGY FOR TRANSPORTATION AND INFRASTRUCTURE – KEY SEGMENT DRIVER
             11.3.2 HYDROGEN IC ENGINES
     11.4 HYDROGEN FUELING STATIONS 
             11.4.1 INCREASING NEED FOR ENERGY IN DEVELOPING COUNTRIES TO ACCELERATE DEMAND
     11.5 HYDROGEN TRANSPORTATION 
             11.5.1 SPECIFIC TRANSPORTATION REQUIREMENTS OF HYDROGEN TO BOOST DEMAND
     11.6 HYDROGEN STORAGE 
             11.6.1 INCREASING DEMAND FOR ROBUST VALVES FOR SAFE STORAGE
 
12 HYDROGEN VALVE MARKET, BY END-USE INDUSTRY (Page No. - 136)
     12.1 INTRODUCTION 
     12.2 OIL & GAS 
             12.2.1 KEY ROLE IN REFINERIES TO BOOST DEMAND
     12.3 ENERGY & POWER 
             12.3.1 GROWTH DRIVEN BY DECARBONIZATION GOALS AND INFRASTRUCTURE INVESTMENT
     12.4 PHARMACEUTICAL 
             12.4.1 HYDROGEN USE IN PHARMACEUTICALS TO BOOST DEMAND FOR APPLICATION-SPECIFIC VALVES
     12.5 FOOD & BEVERAGES 
             12.5.1 WIDELY USED IN FOOD PROCESSING TO IMPROVE SAFETY AND EFFICIENCY
     12.6 CHEMICAL 
             12.6.1 RISING USE IN CARBON FOOTPRINT MANAGEMENT TO INCREASE NEED FOR SPECIALIZED VALVES
     12.7 METALS & MINING 
             12.7.1 ADOPTION IN MINING TO INCREASE DEMAND FOR ADVANCED, RELIABLE VALVES
     12.8 AUTOMOTIVE 
             12.8.1 PREVALENCE OF HYDROGEN FUEL CELLS AND IC ENGINES TO DRIVE SEGMENT
     12.9 OTHERS 
 
13 HYDROGEN VALVE MARKET, BY REGION (Page No. - 150)
     13.1 INTRODUCTION 
     13.2 NORTH AMERICA 
             13.2.1 MACROECONOMIC OUTLOOK FOR NORTH AMERICA
             13.2.2 US
                        13.2.2.1 Market expansion due to focus of industrial sectors on hydrogen-related applications
             13.2.3 CANADA
                        13.2.3.1 Market growth propelled by hydrogen use in refineries and fertilizers
             13.2.4 MEXICO
                        13.2.4.1 Public-private collaborations fuel growth of market
     13.3 EUROPE 
             13.3.1 MACROECONOMIC OUTLOOK FOR EUROPE
             13.3.2 UK
                        13.3.2.1 Government initiatives and industrial collaboration to drive market
             13.3.3 GERMANY
                        13.3.3.1 Research funding initiatives to drive market
             13.3.4 FRANCE
                        13.3.4.1 Cross-border hydrogen trade and infrastructure development to boost market
             13.3.5 REST OF EUROPE
     13.4 ASIA PACIFIC 
             13.4.1 MACROECONOMIC OUTLOOK FOR ASIA PACIFIC
             13.4.2 CHINA
                        13.4.2.1 Market to be driven by substantial hydrogen production capacity
             13.4.3 JAPAN
                        13.4.3.1 Investment in renewable energy sources and power generation to boost demand
             13.4.4 SOUTH KOREA
                        13.4.4.1 Development plans for hydrogen industry to drive market
             13.4.5 INDIA
                        13.4.5.1 Government push to increase renewable energy capacity – key driver
             13.4.6 REST OF ASIA PACIFIC
     13.5 REST OF THE WORLD 
             13.5.1 MACROECONOMIC OUTLOOK FOR ROW
             13.5.2 GCC COUNTRIES
                        13.5.2.1 Collaborations for hydrogen supply chain to fuel demand
             13.5.3 AFRICA
                        13.5.3.1 Market driven by growing industrialization and infrastructure
             13.5.4 SOUTH AMERICA
                        13.5.4.1 Increasing industrial expansion to boost market
 
14 COMPETITIVE LANDSCAPE (Page No. - 170)
     14.1 INTRODUCTION 
     14.2 REVENUE ANALYSIS OF TOP FIVE COMPANIES 
     14.3 MARKET SHARE ANALYSIS OF TOP PLAYERS, 2023 
     14.4 COMPANY VALUATION AND FINANCIAL METRICS, 2023 
     14.5 BRAND/PRODUCT COMPARISON 
     14.6 COMPETITIVE EVALUATION QUADRANT, 2023 
             14.6.1 STARS
             14.6.2 EMERGING LEADERS
             14.6.3 PERVASIVE PLAYERS
             14.6.4 PARTICIPANTS
             14.6.5 HYDROGEN VALVE MARKET: COMPANY FOOTPRINT
                        14.6.5.1 Company footprint
                        14.6.5.2 Type footprint
                        14.6.5.3 End-use industry footprint
                        14.6.5.4 Region footprint
     14.7 HYDROGEN VALVE MARKET: COMPANY EVALUATION MATRIX (SMES), 2023 
             14.7.1 PROGRESSIVE COMPANIES
             14.7.2 RESPONSIVE COMPANIES
             14.7.3 DYNAMIC COMPANIES
             14.7.4 STARTING BLOCKS
     14.8 COMPETITIVE BENCHMARKING 
             14.8.1 MARKET: KEY STARTUPS
             14.8.2 MARKET: COMPETITIVE BENCHMARKING OF KEY SMES
     14.9 COMPETITIVE SITUATIONS AND TRENDS 
             14.9.1 PRODUCT LAUNCHES
             14.9.2 EXPANSIONS
             14.9.3 DEALS
 
15 COMPANY PROFILES (Page No. - 188)
     15.1 KEY PLAYERS 
             15.1.1 EMERSON ELECTRIC CO.
                        15.1.1.1 Business overview
                        15.1.1.2 Products/Solutions/Services offered
                        15.1.1.3 Recent developments
                                     15.1.1.3.1 Product launches
                                     15.1.1.3.2 Deals
                        15.1.1.4 MnM view
                                     15.1.1.4.1 Right to win
                                     15.1.1.4.2 Strategic choices
                                     15.1.1.4.3 Weaknesses/Competitive threats
             15.1.2 SLB
                        15.1.2.1 Business overview
                        15.1.2.2 Products/Solutions/Services offered
                        15.1.2.3 MnM view
                                     15.1.2.3.1 Right to win
                                     15.1.2.3.2 Strategic choices
                                     15.1.2.3.3 Weaknesses/Competitive threats
             15.1.3 VALMET
                        15.1.3.1 Business overview
                        15.1.3.2 Products/Solutions/Services offered
                        15.1.3.3 Recent developments
                                     15.1.3.3.1 Product launches
                        15.1.3.4 MnM view
                                     15.1.3.4.1 Right to win
                                     15.1.3.4.2 Strategic choices
                                     15.1.3.4.3 Weaknesses/Competitive threats
             15.1.4 IMI
                        15.1.4.1 Business overview
                        15.1.4.2 Products/Solutions/Services offered
                        15.1.4.3 MnM view
                                     15.1.4.3.1 Right to win
                                     15.1.4.3.2 Strategic choices
                                     15.1.4.3.3 Weaknesses/Competitive threats
             15.1.5 CRANE COMPANY
                        15.1.5.1 Business overview
                        15.1.5.2 Products/Solutions/Services offered
                        15.1.5.3 Recent developments
                                     15.1.5.3.1 Deals
                        15.1.5.4 MnM view
                                     15.1.5.4.1 Right to win
                                     15.1.5.4.2 Strategic choices
                                     15.1.5.4.3 Weaknesses/Competitive threats
             15.1.6 PARKER HANNIFIN CORP
                        15.1.6.1 Business overview
                        15.1.6.2 Products/Solutions/Services offered
                        15.1.6.3 Recent developments
                                     15.1.6.3.1 Product launches
             15.1.7 BAKER HUGHES COMPANY
                        15.1.7.1 Business overview
                        15.1.7.2 Products/Solutions/Services offered
             15.1.8 WESTPORT FUEL SYSTEMS INC.
                        15.1.8.1 Business overview
                        15.1.8.2 Products/Solutions/Services offered
                        15.1.8.3 Recent developments
                                     15.1.8.3.1 Expansions
             15.1.9 KITZ CORPORATION
                        15.1.9.1 Business overview
                        15.1.9.2 Products/Solutions/Services offered
             15.1.10 SWAGELOK COMPANY
                        15.1.10.1 Business overview
                        15.1.10.2 Products/Solutions/Services offered
                        15.1.10.3 Recent developments
                                     15.1.10.3.1 Expansions
     15.2 OTHER PLAYERS 
             15.2.1 GSR VENTILTECHNIK GMBH & CO. KG
             15.2.2 HIGH PRESSURE EQUIPMENT COMPANY
             15.2.3 VELAN INC.
             15.2.4 ROTAREX
             15.2.5 MAXIMATOR GMBH
             15.2.6 KEVIN STEEL
             15.2.7 JAKSA D.O.O.
             15.2.8 VEXVE OY
             15.2.9 CAM S.P.A.
             15.2.10 OLIVER VALVES LTD.
             15.2.11 ADAMS ARMATUREN GMBH
             15.2.12 HARTMANN VALVES GMBH
             15.2.13 OMB SALERI S.P.A.
             15.2.14 GEFA PROCESSTECHNIK GMBH
             15.2.15 HABONIM
 
16 ADJACENT & RELATED MARKETS (Page No. - 225)
     16.1 INTRODUCTION 
     16.2 LIMITATION 
     16.3 BALL VALVES MARKET, BY TYPE 
             16.3.1 INTRODUCTION
     16.4 TRUNNION-MOUNTED 
             16.4.1 INCREASING USE IN HIGH-PRESSURE LOW-TORQUE OPERATIONS TO DRIVE MARKET
     16.5 FLOATING 
             16.5.1 RISING IMPLEMENTATION IN MEDIUM-/LOW-PRESSURE APPLICATIONS TO FUEL MARKET GROWTH
     16.6 RISING STEM 
             16.6.1 SURGING DEMAND FROM CHEMICAL INDUSTRY TO DRIVE MARKET
 
17 APPENDIX (Page No. - 228)
     17.1 INSIGHTS OF INDUSTRY EXPERTS 
     17.2 DISCUSSION GUIDE 
     17.3 KNOWLEDGESTORE: MARKETSANDMARKETS’ SUBSCRIPTION PORTAL 
     17.4 CUSTOMIZATION OPTIONS 
     17.5 RELATED REPORTS 
     17.6 AUTHOR DETAILS 
 
LIST OF TABLES (160 TABLES)
 
TABLE 1 HYDROGEN VALVE: RISK ASSESSMENT
TABLE 2 ROLE OF PLAYERS IN ECOSYSTEM
TABLE 3 AVERAGE SELLING PRICE OF HYDROGEN VALVE TYPES PROVIDED BY KEY PLAYERS (USD)
TABLE 4 AVERAGE SELLING PRICE OF HYDROGEN VALVES, BY REGION (USD)
TABLE 5 IMPACT OF PORTER’S FIVE FORCES ON HYDROGEN VALVE MARKET
TABLE 6 INFLUENCE OF STAKEHOLDERS FROM TOP THREE END-USE INDUSTRIES ON BUYING HYDROGEN VALVE SYSTEMS
TABLE 7 KEY BUYING CRITERIA OF TOP THREE END-USE INDUSTRIES
TABLE 8 HYDROGEN VALVE MARKET: KEY PATENTS
TABLE 9 MARKET: KEY CONFERENCES AND EVENTS, 2024–2025
TABLE 10 TARIFF FOR HS CODE 848110: PRESSURE-REDUCING VALVES
TABLE 11 NORTH AMERICA: REGULATORY BODIES, GOVERNMENT AGENCIES, AND OTHER ORGANIZATIONS
TABLE 12 EUROPE: REGULATORY BODIES, GOVERNMENT AGENCIES, AND OTHER ORGANIZATIONS
TABLE 13 ASIA PACIFIC: REGULATORY BODIES, GOVERNMENT AGENCIES, AND OTHER ORGANIZATIONS
TABLE 14 REST OF THE WORLD: REGULATORY BODIES, GOVERNMENT AGENCIES, AND OTHER ORGANIZATIONS
TABLE 15 STANDARDS FOLLOWED BY MANUFACTURERS OF HYDROGEN VALVES
TABLE 16 HYDROGEN VALVE MARKET, BY TYPE, 2021–2023 (USD MILLION)
TABLE 17 MARKET, BY TYPE, 2024–2030 (USD MILLION)
TABLE 18 HYDROGEN BALL VALVE MARKET, BY END-USE INDUSTRY, 2021–2023 (USD MILLION)
TABLE 19 HYDROGEN BALL VALVE MARKET, BY END-USE INDUSTRY, 2024–2030 (USD MILLION)
TABLE 20 HYDROGEN NEEDLE VALVE MARKET, BY END-USE INDUSTRY, 2021–2023 (USD MILLION)
TABLE 21 HYDROGEN NEEDLE VALVE MARKET, BY END-USE INDUSTRY, 2024–2030 (USD MILLION)
TABLE 22 HYDROGEN CHECK VALVE MARKET, BY END-USE INDUSTRY, 2021–2023 (USD MILLION)
TABLE 23 HYDROGEN CHECK VALVE MARKET, BY END-USE INDUSTRY, 2024–2030 (USD MILLION)
TABLE 24 HYDROGEN PRESSURE RELIEF VALVE MARKET, BY END-USE INDUSTRY, 2021–2023 (USD MILLION)
TABLE 25 HYDROGEN PRESSURE RELIEF VALVE MARKET, BY END-USE INDUSTRY, 2024–2030 (USD MILLION)
TABLE 26 HYDROGEN GLOBE VALVE MARKET, BY END-USE INDUSTRY, 2021–2023 (USD MILLION)
TABLE 27 HYDROGEN GLOBE VALVE MARKET, BY END-USE INDUSTRY, 2024–2030 (USD MILLION)
TABLE 28 HYDROGEN FLOW CONTROL VALVE MARKET, BY END-USE INDUSTRY, 2021–2023 (USD MILLION)
TABLE 29 HYDROGEN FLOW CONTROL VALVE MARKET, BY END-USE INDUSTRY, 2024–2030 (USD MILLION)
TABLE 30 OTHER HYDROGEN VALVES MARKET, BY END-USE INDUSTRY, 2021–2023 (USD MILLION)
TABLE 31 OTHER HYDROGEN VALVES MARKET, BY END-USE INDUSTRY, 2024–2030 (USD MILLION)
TABLE 32 HYDROGEN VALVE MARKET, BY MATERIAL, 2021–2023 (USD MILLION)
TABLE 33 MARKET, BY MATERIAL, 2024–2030 (USD MILLION)
TABLE 34 MARKET, BY PRESSURE RANGE, 2021–2023 (USD MILLION)
TABLE 35 MARKET, BY PRESSURE RANGE, 2024–2030 (USD MILLION)
TABLE 36 <50 BAR: HYDROGEN VALVE MARKET, BY APPLICATION, 2021–2023 (USD MILLION)
TABLE 37 <50 BAR: MARKET, BY APPLICATION, 2024–2030 (USD MILLION)
TABLE 38 >50–350 BAR: MARKET, BY APPLICATION, 2021–2023 (USD MILLION)
TABLE 39 >50–350 BAR: MARKET, BY APPLICATION, 2024–2030 (USD MILLION)
TABLE 40 > 350–700 BAR: MARKET, BY APPLICATION, 2021–2023 (USD MILLION)
TABLE 41 >350–700 BAR: MARKET, BY APPLICATION, 2024–2030 (USD MILLION)
TABLE 42 >700–1,000 BAR: MARKET, BY APPLICATION, 2021–2023 (USD MILLION)
TABLE 43 >700–1,000 BAR: MARKET, BY APPLICATION, 2024–2030 (USD MILLION)
TABLE 44 >1,000 BAR: MARKET, BY APPLICATION, 2021–2023 (USD MILLION)
TABLE 45 >1,000 BAR: MARKET, BY APPLICATION, 2024–2030 (USD MILLION)
TABLE 46 HYDROGEN VALVE MARKET, BY SIZE, 2021–2023 (USD MILLION)
TABLE 47 MARKET, BY SIZE, 2024–2030 (USD MILLION)
TABLE 48 <1”: MARKET, BY APPLICATION, 2021–2023 (USD MILLION)
TABLE 49 <1”: MARKET, BY APPLICATION, 2024–2030 (USD MILLION)
TABLE 50 >1"–6": MARKET, BY APPLICATION, 2021–2023 (USD MILLION)
TABLE 51 >1"–6": MARKET, BY APPLICATION, 2024–2030 (USD MILLION)
TABLE 52 >6"–12": MARKET, BY APPLICATION, 2021–2023 (USD MILLION)
TABLE 53 6"–12": MARKET, BY APPLICATION, 2024–2030 (USD MILLION)
TABLE 54 >12"–20": MARKET, BY APPLICATION, 2021–2023 (USD MILLION)
TABLE 55 >12"–20": MARKET, BY APPLICATION, 2024–2030 (USD MILLION)
TABLE 56 >20”: MARKET, BY APPLICATION, 2021–2023 (USD MILLION)
TABLE 57 >20”: MARKET, BY APPLICATION, 2024–2030 (USD MILLION)
TABLE 58 HYDROGEN VALVE MARKET, BY IMPLEMENTATION, 2021–2023 (USD MILLION)
TABLE 59 MARKET, BY IMPLEMENTATION, 2024–2030 (USD MILLION)
TABLE 60 MARKET, BY APPLICATION, 2021–2023 (USD MILLION)
TABLE 61 MARKET, BY APPLICATION, 2024–2030 (USD MILLION)
TABLE 62 MARKET, BY APPLICATION, 2021–2023 (THOUSAND UNITS)
TABLE 63 MARKET, BY APPLICATION, 2024–2030 (THOUSAND UNITS)
TABLE 64 HYDROGEN PRODUCTION: HYDROGEN VALVE MARKET, BY PRESSURE RANGE, 2021–2023 (USD MILLION)
TABLE 65 HYDROGEN PRODUCTION: MARKET, BY PRESSURE RANGE, 2024–2030 (USD MILLION)
TABLE 66 HYDROGEN PRODUCTION: MARKET, BY SIZE, 2021–2023 (USD MILLION)
TABLE 67 HYDROGEN PRODUCTION: MARKET, BY SIZE, 2024–2030 (USD MILLION)
TABLE 68 HYDROGEN FUEL CELLS: MARKET, BY PRESSURE RANGE, 2021–2023 (USD MILLION)
TABLE 69 HYDROGEN FUEL CELLS: MARKET, BY PRESSURE RANGE, 2024–2030 (USD MILLION)
TABLE 70 HYDROGEN FUEL CELLS: MARKET, BY SIZE, 2021–2023 (USD MILLION)
TABLE 71 HYDROGEN FUEL CELLS: MARKET, BY SIZE, 2024–2030 (USD MILLION)
TABLE 72 HYDROGEN FUELING STATIONS: HYDROGEN VALVE MARKET, BY PRESSURE RANGE, 2021–2023 (USD MILLION)
TABLE 73 HYDROGEN FUELING STATIONS: MARKET, BY PRESSURE RANGE, 2024–2030 (USD MILLION)
TABLE 74 HYDROGEN FUELING STATIONS: MARKET, BY SIZE, 2021–2023 (USD MILLION)
TABLE 75 HYDROGEN FUELING STATIONS: MARKET, BY SIZE, 2024–2030 (USD MILLION)
TABLE 76 HYDROGEN TRANSPORTATION: MARKET, BY PRESSURE RANGE, 2021–2023 (USD MILLION)
TABLE 77 HYDROGEN TRANSPORTATION:  MARKET, BY PRESSURE RANGE, 2024–2030 (USD MILLION)
TABLE 78 HYDROGEN TRANSPORTATION: MARKET, BY SIZE, 2021–2023 (USD MILLION)
TABLE 79 HYDROGEN TRANSPORTATION: MARKET, BY SIZE, 2024–2030 (USD MILLION)
TABLE 80 HYDROGEN STORAGE: HYDROGEN VALVE MARKET, BY PRESSURE RANGE, 2021–2023 (USD MILLION)
TABLE 81 HYDROGEN STORAGE: MARKET, BY PRESSURE RANGE, 2024–2030 (USD MILLION)
TABLE 82 HYDROGEN STORAGE: MARKET, BY SIZE, 2021–2023 (USD MILLION)
TABLE 83 HYDROGEN STORAGE: MARKET, BY SIZE, 2024–2030 (USD MILLION)
TABLE 84 HYDROGEN VALVE MARKET, BY END-USE INDUSTRY, 2021–2023 (USD MILLION)
TABLE 85 MARKET, BY END-USE INDUSTRY, 2024–2030 (USD MILLION)
TABLE 86 OIL & GAS: HYDROGEN VALVE MARKET, BY VALVE TYPE, 2021–2023 (USD MILLION)
TABLE 87 OIL & GAS: MARKET, BY VALVE TYPE, 2024–2030 (USD MILLION)
TABLE 88 ENERGY & POWER: MARKET, BY VALVE TYPE, 2021–2023 (USD MILLION)
TABLE 89 ENERGY & POWER: MARKET, BY VALVE TYPE, 2024–2030 (USD MILLION)
TABLE 90 PHARMACEUTICAL: MARKET, BY VALVE TYPE, 2021–2023 (USD MILLION)
TABLE 91 PHARMACEUTICAL: MARKET, BY VALVE TYPE, 2024–2030 (USD MILLION)
TABLE 92 FOOD & BEVERAGES: HYDROGEN VALVE MARKET, BY VALVE TYPE, 2021–2023 (USD MILLION)
TABLE 93 FOOD & BEVERAGES: MARKET, BY VALVE TYPE, 2024–2030 (USD MILLION)
TABLE 94 CHEMICAL: MARKET, BY VALVE TYPE, 2021–2023 (USD MILLION)
TABLE 95 CHEMICAL: MARKET, BY VALVE TYPE, 2024–2030 (USD MILLION)
TABLE 96 METALS & MINING: HYDROGEN VALVE MARKET, BY VALVE TYPE, 2021–2023 (USD MILLION)
TABLE 97 METALS & MINING: MARKET, BY VALVE TYPE, 2024–2030 (USD MILLION)
TABLE 98 AUTOMOTIVE: MARKET, BY VALVE TYPE, 2021–2023 (USD MILLION)
TABLE 99 AUTOMOTIVE: MARKET, BY VALVE TYPE, 2024–2030 (USD MILLION)
TABLE 100 OTHER END-USE INDUSTRIES: HYDROGEN VALVE MARKET, BY VALVE TYPE, 2021–2023 (USD MILLION)
TABLE 101 OTHER END-USE INDUSTRIES: MARKET, BY VALVE TYPE, 2024–2030 (USD MILLION)
TABLE 102 HYDROGEN VALVE MARKET, BY REGION, 2021–2023 (USD MILLION)
TABLE 103 MARKET, BY REGION, 2024–2030 (USD MILLION)
TABLE 104 NORTH AMERICA: MARKET, BY COUNTRY, 2021–2023 (USD MILLION)
TABLE 105 NORTH AMERICA: MARKET, BY COUNTRY, 2024–2030 (USD MILLION)
TABLE 106 NORTH AMERICA: MARKET, BY APPLICATION, 2021–2023 (USD MILLION)
TABLE 107 NORTH AMERICA: MARKET, BY APPLICATION, 2024–2030 (USD MILLION)
TABLE 108 EUROPE: HYDROGEN VALVE MARKET, BY COUNTRY, 2021–2023 (USD MILLION)
TABLE 109 EUROPE: MARKET, BY COUNTRY, 2024–2030 (USD MILLION)
TABLE 110 EUROPE: MARKET, BY APPLICATION, 2021–2023 (USD MILLION)
TABLE 111 EUROPE: MARKET, BY APPLICATION, 2024–2030 (USD MILLION)
TABLE 112 ASIA PACIFIC: HYDROGEN VALVE MARKET, BY COUNTRY, 2021–2023 (USD MILLION)
TABLE 113 ASIA PACIFIC: MARKET, BY COUNTRY, 2024–2030 (USD MILLION)
TABLE 114 ASIA PACIFIC: MARKET, BY APPLICATION, 2021–2023 (USD MILLION)
TABLE 115 ASIA PACIFIC: MARKET, BY APPLICATION, 2024–2030 (USD MILLION)
TABLE 116 REST OF THE WORLD: MARKET, BY REGION, 2021–2023 (USD MILLION)
TABLE 117 REST OF THE WORLD: MARKET, BY REGION, 2024–2030 (USD MILLION)
TABLE 118 MIDDLE EAST: HYDROGEN VALVE MARKET, REGION, 2021–2023 (USD MILLION)
TABLE 119 MIDDLE EAST: MARKET, BY REGION, 2024–2030 (USD MILLION)
TABLE 120 REST OF THE WORLD: MARKET, BY APPLICATION, 2021–2023 (USD MILLION)
TABLE 121 REST OF THE WORLD: MARKET, BY APPLICATION, 2024–2030 (USD MILLION)
TABLE 122 KEY DEVELOPMENTS IN MARKET, 2023–2024
TABLE 123 HYDROGEN VALVE MARKET: DEGREE OF COMPETITION
TABLE 124 MARKET: TYPE FOOTPRINT
TABLE 125 MARKET: END-USE INDUSTRY FOOTPRINT
TABLE 126 MARKET: REGION FOOTPRINT
TABLE 127 MARKET: KEY STARTUPS
TABLE 128 MARKET: COMPETITIVE BENCHMARKING OF KEY SMES
TABLE 129 MARKET: PRODUCT LAUNCHES, 2022–2024
TABLE 130 MARKET: EXPANSIONS, 2022–2024
TABLE 131 MARKET: DEALS, 2022–2024
TABLE 132 EMERSON ELECTRIC CO.: COMPANY OVERVIEW
TABLE 133 EMERSON ELECTRIC CO.: PRODUCTS/SOLUTIONS/SERVICES OFFERED
TABLE 134 EMERSON ELECTRIC CO.: PRODUCT LAUNCHES
TABLE 135 EMERSON ELECTRIC CO.: DEALS
TABLE 136 SLB: COMPANY OVERVIEW
TABLE 137 SLB: PRODUCTS/SOLUTIONS/SERVICES OFFERED
TABLE 138 VALMET: COMPANY OVERVIEW
TABLE 139 VALMET: PRODUCTS/SOLUTIONS/SERVICES OFFERED
TABLE 140 VALMET: PRODUCT LAUNCHES
TABLE 141 IMI: COMPANY OVERVIEW
TABLE 142 IMI: PRODUCTS/SOLUTIONS/SERVICES OFFERED
TABLE 143 CRANE COMPANY: COMPANY OVERVIEW
TABLE 144 CRANE COMPANY: PRODUCTS/SOLUTIONS/SERVICES OFFERED
TABLE 145 CRANE COMPANY: DEALS
TABLE 146 PARKER HANNIFIN CORP: COMPANY OVERVIEW
TABLE 147 PARKER HANNIFIN CORP: PRODUCTS/SOLUTIONS/SERVICES OFFERED
TABLE 148 PARKER HANNIFIN CORPORATION: PRODUCT LAUNCHES
TABLE 149 BAKER HUGHES COMPANY: COMPANY OVERVIEW
TABLE 150 BAKER HUGHES COMPANY: PRODUCTS/SOLUTIONS/SERVICES OFFERED
TABLE 151 WESTPORT FUEL SYSTEMS INC.: COMPANY OVERVIEW
TABLE 152 WESTPORT FUEL SYSTEMS INC.: PRODUCTS/SOLUTIONS/SERVICES OFFERED
TABLE 153 WESTPORT FUEL SYSTEMS INC.: EXPANSIONS
TABLE 154 KITZ CORPORATION: BUSINESS OVERVIEW
TABLE 155 KITZ CORPORATION: PRODUCTS/SOLUTIONS/SERVICES OFFERED
TABLE 156 SWAGELOK COMPANY: COMPANY OVERVIEW
TABLE 157 SWAGELOK COMPANY: PRODUCTS/SOLUTIONS/SERVICES OFFERED
TABLE 158 SWAGELOK COMPANY: EXPANSIONS
TABLE 159 BALL VALVES MARKET, BY TYPE, 2019–2022 (USD MILLION)
TABLE 160 BALL VALVES MARKET, BY TYPE, 2023–2028 (USD MILLION)
 
 
LIST OF FIGURES (82 FIGURES)
 
FIGURE 1 HYDROGEN VALVE MARKET SEGMENTATION
FIGURE 2 MARKET: RESEARCH DESIGN
FIGURE 3 MARKET SIZE ESTIMATION METHODOLOGY (SUPPLY SIDE): REVENUE FROM MARKET
FIGURE 4 MARKET SIZE ESTIMATION METHODOLOGY: BOTTOM-UP APPROACH
FIGURE 5 MARKET SIZE ESTIMATION METHODOLOGY: TOP-DOWN APPROACH
FIGURE 6 MARKET BREAKDOWN AND DATA TRIANGULATION
FIGURE 7 ASSUMPTIONS FOR RESEARCH STUDY
FIGURE 8 BALL VALVES SEGMENT TO CAPTURE LARGEST SHARE IN 2024
FIGURE 9 STAINLESS STEEL TO DOMINATE HYDROGEN VALVE MARKET, BY MATERIAL, 2023
FIGURE 10 >350–700 BAR TO HOLD LARGEST MARKET SHARE BY 2030
FIGURE 11 <1" HYDROGEN VALES TO CAPTURE LARGEST MARKET SHARE IN 2024
FIGURE 12 NEW INSTALLATION SEGMENT TO COMMAND MARKET BY 2030
FIGURE 13 HYDROGEN STORAGE TO LEAD MARKET DURING FORECAST PERIOD
FIGURE 14 OIL & GAS SEGMENT TO HOLD LARGEST MARKET SHARE IN 2024
FIGURE 15 ASIA PACIFIC TO BE FASTEST-GROWING MARKET DURING FORECAST PERIOD
FIGURE 16 EXPANSION OF OIL & GAS INDUSTRY TO CREATE LUCRATIVE OPPORTUNITIES FOR ASIA PACIFIC MARKET
FIGURE 17 BALL VALVES SEGMENT TO COMMAND MARKET IN 2023
FIGURE 18 STAINLESS STEEL SEGMENT TO CAPTURE MAJORITY OF MARKET BY 2030
FIGURE 19 NEW INSTALLATION SEGMENT TO COMMAND MARKET SHARE DURING FORECAST PERIOD
FIGURE 20 HYDROGEN STORAGE TO DOMINATE MARKET IN 2024
FIGURE 21 OIL & GAS SEGMENT TO HOLD LARGEST MARKET SHARE
FIGURE 22 HYDROGEN STORAGE AND CHINA – MAJOR SEGMENTS IN ASIA PACIFIC MARKET
FIGURE 23 SOUTH KOREA TO RECORD HIGHEST CAGR IN MARKET FROM 2024 TO 2030
FIGURE 24 HYDROGEN VALVE MARKET DYNAMICS
FIGURE 25 DRIVERS FOR MARKET AND THEIR IMPACT
FIGURE 26 RESTRAINTS FOR MARKET AND THEIR IMPACT
FIGURE 27 OPPORTUNITIES FOR MARKET AND THEIR IMPACT
FIGURE 28 CHALLENGES FOR MARKET AND THEIR IMPACT
FIGURE 29 HYDROGEN VALVE: VALUE CHAIN ANALYSIS
FIGURE 30 HYDROGEN VALVE MARKET: ECOSYSTEM
FIGURE 31 HYDROGEN VALVE COMPANIES: FUNDING
FIGURE 32 AVERAGE SELLING PRICE TREND (USD)
FIGURE 33 AVERAGE SELLING PRICE OF HYDROGEN VALVE TYPES OFFERED BY KEY PLAYERS
FIGURE 34 TRENDS/DISRUPTION IMPACTING CUSTOMER BUSINESS
FIGURE 35 MARKET: PORTER’S FIVE FORCES ANALYSIS
FIGURE 36 INFLUENCE OF STAKEHOLDERS FROM TOP THREE END-USE INDUSTRIES ON BUYING PROCESS
FIGURE 37 BUYING CRITERIA OF TOP THREE END-USE INDUSTRIES
FIGURE 38 IMPORT DATA FOR HS CODE 848110, BY KEY COUNTRY, 2019–2023 (USD MILLION)
FIGURE 39 EXPORT DATA FOR HS CODE 8536, BY KEY COUNTRY, 2019–2023 (USD MILLION)
FIGURE 40 TOP 10 COMPANIES WITH HIGHEST NUMBER OF PATENT APPLICATIONS IN LAST 10 YEARS
FIGURE 41 PATENT ANALYSIS RELATED TO MARKET
FIGURE 42 AI USE CASE IN VALVE INDUSTRY
FIGURE 43 IMPACT OF AI ON MARKET: USE CASE
FIGURE 44 HYDROGEN VALVE MARKET, BY TYPE
FIGURE 45 BALL VALVES TO DOMINATE MARKET DURING 2024–2030
FIGURE 46 MARKET, BY MATERIAL
FIGURE 47 STAINLESS STEEL HYDROGEN VALVES TO HOLD LARGEST MARKET SIZE BY 2030
FIGURE 48 MARKET, BY PRESSURE RANGE
FIGURE 49 >350–750 BAR SEGMENT EXPECTED TO HOLD LARGEST MARKET SIZE BY 2030
FIGURE 50 MARKET, BY SIZE
FIGURE 51 HYDROGEN VALVES SIZED BELOW 1" EXPECTED TO HOLD LARGEST MARKET SIZE BY 2030
FIGURE 52 MARKET, BY IMPLEMENTATION
FIGURE 53 NEW INSTALLATION SEGMENT EXPECTED TO HOLD LARGEST MARKET SIZE BY 2030
FIGURE 54 MARKET, BY APPLICATION
FIGURE 55 HYDROGEN STORAGE TO HOLD LARGEST SHARE IN MARKET DURING FORECAST PERIOD
FIGURE 56 MARKET, BY HYDROGEN PRODUCTION TYPE
FIGURE 57 GREY HYDROGEN TO COMMAND HYDROGEN PRODUCTION MARKET
FIGURE 58 HYDROGEN VALVE MARKET, BY END-USE INDUSTRY
FIGURE 59 OIL & GAS TO CONTINUE TO DOMINATE MARKET DURING FORECAST PERIOD
FIGURE 60 MARKET, BY REGION
FIGURE 61 MARKET IN ASIA PACIFIC TO REGISTER HIGHEST CAGR FROM 2024 TO 2030
FIGURE 62 NORTH AMERICA: HYDROGEN VALVE MARKET SNAPSHOT
FIGURE 63 EUROPE: MARKET SNAPSHOT
FIGURE 64 ASIA PACIFIC: MARKET SNAPSHOT
FIGURE 65 REST OF THE WORLD: MARKET SNAPSHOT
FIGURE 66 MARKET: REVENUE ANALYSIS
FIGURE 67 MARKET SHARE ANALYSIS, 2023
FIGURE 68 MARKET: COMPANY VALUATION, 2023 (USD MILLION)
FIGURE 69 MARKET: FINANCIAL METRICS (EV/EBITDA), 2023
FIGURE 70 BRAND/PRODUCT COMPARISON
FIGURE 71 MARKET: COMPANY EVALUATION MATRIX (KEY PLAYERS), 2023
FIGURE 72 MARKET: COMPANY FOOTPRINT
FIGURE 73 MARKET: COMPANY EVALUATION MATRIX (SMES), 2023
FIGURE 74 EMERSON ELECTRIC CO.: COMPANY SNAPSHOT
FIGURE 75 SLB: COMPANY SNAPSHOT
FIGURE 76 VALMET: COMPANY SNAPSHOT
FIGURE 77 IMI: COMPANY SNAPSHOT
FIGURE 78 CRANE COMPANY: COMPANY SNAPSHOT
FIGURE 79 PARKER HANNIFIN CORPORATION: COMPANY SNAPSHOT
FIGURE 80 BAKER HUGHES COMPANY: COMPANY SNAPSHOT
FIGURE 81 WESTPORT FUEL SYSTEMS INC.: COMPANY SNAPSHOT
FIGURE 82 KITZ CORPORATION: COMPANY SNAPSHOT


The study involved four major activities in estimating the size of the hydrogen valve market. Exhaustive secondary research has been carried out to collect information on the market, the peer markets, and the parent market. Both top-down and bottom-up approaches have been employed to estimate the total market size. Market breakdown and data triangulation methods have also been used to estimate the market for segments and subsegments.

Secondary Research

Revenues of companies offering hydrogen valve have been obtained from the secondary data available through paid and unpaid sources. The revenues have also been derived by analyzing the product portfolio of key companies, and these companies have been rated according to the performance and quality of their products.

In the secondary research process, various sources have been referred to for identifying and collecting information for this study on the hydrogen valve market. Secondary sources considered for this research study include government sources, corporate filings, and trade, business, and professional associations. Secondary data has been collected and analyzed to arrive at the overall market size, which has been further validated through primary research.    

Secondary research has been mainly used to obtain key information about the supply chain of data center accelerator systems to identify key players based on their products and prevailing industry trends in the hydrogen market by processor, type, application, end-user, and region. Secondary research also helped obtain market information- and technology-oriented key developments undertaken by market players to expand their presence and increase their market share.  

Primary Research

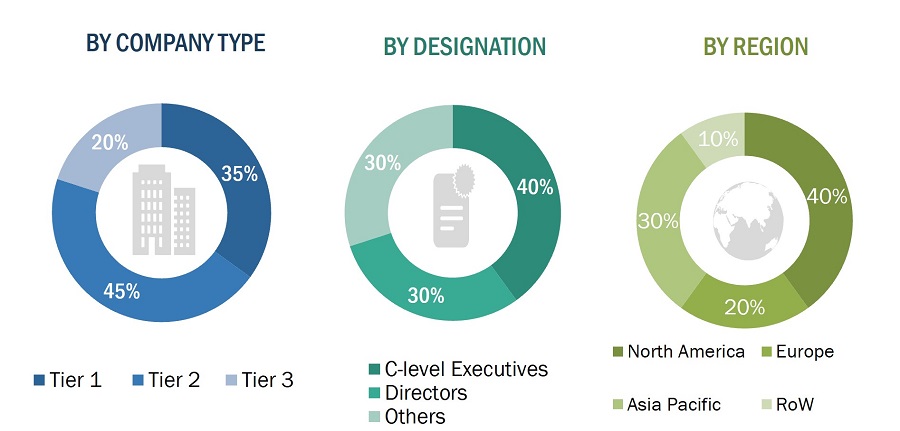
Extensive primary research has been conducted after understanding and analyzing the current scenario of the hydrogen valve market through secondary research. Several primary interviews have been conducted with the key opinion leaders from the demand and supply sides across four main regions—North America, Europe, Asia Pacific, and the Rest of Europe. Approximately 25% of the primary interviews were conducted with the demand-side respondents, while approximately 75% were conducted with the supply-side respondents. The primary data has been collected through questionnaires, emails, and telephone interviews.

After interacting with industry experts, brief sessions were conducted with highly experienced independent consultants to reinforce the findings from our primary. This, along with the in-house subject matter experts’ opinions, has led us to the findings as described in the remainder of this report. The breakdown of primary respondents is as follows:
Hydrogen Valve Market
 Size, and Share

To know about the assumptions considered for the study, download the pdf brochure

Market Size Estimation

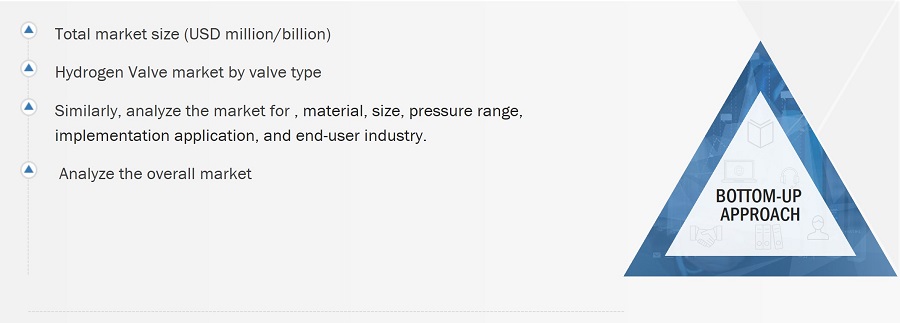
The bottom-up procedure has been employed to arrive at the overall size of the hydrogen valve market.

  • Initially, more than 35 companies offering hydrogen valves were identified. Their offerings were mapped based on valve type, material, application, size, pressure range, implementation, and end user application.
  • After understanding the different types of hydrogen valve offered by various manufacturers, based on the data gathered through primary and secondary sources, the market was categorized into different segments.
  • To derive the global hydrogen valve market, global valve shipments of top players for each valve type that were considered in the scope of the report were tracked.
  • A suitable penetration rate was assigned for the shipment of each of these device types to derive the shipments of hydrogen valves.
  • Using the average selling price (ASP) at which a particular company offers its devices, we derived the hydrogen valve market based on different device types. The ASP of each device was identified based on secondary sources and validated from primaries.
  • For the projected market values of each of the device types, the Y-o-Y projections showed a steep growth initially until 2023. The market is expected to witness a sharp ascent, considering the demand for hydrogen market valve for different applications.
  • For the CAGR, the market trend analysis was carried out by understanding the industry penetration rate and the demand and supply of hydrogen valve in different applications.
  • We also tracked the hydrogen valve market through the data sanity method. The revenues of more than 25 key providers were analyzed through annual reports and press releases and summed to derive the overall market.
  • For each company, a percentage is assigned to its overall revenue or, in a few cases, segmental revenue, to derive its revenue for the data center accelerator. This percentage for each company is assigned based on the company’s product portfolio and its range of data center accelerator offerings.
  • Verifying and crosschecking the estimates at every level by discussing with key opinion leaders, including CXOs, directors, and operation managers, and then finally with the domain experts at MarketsandMarkets
  • Studying various paid and unpaid sources of information, such as annual reports, press releases, white papers, and databases
Hydrogen Valve Market
 Size, and Bottom-up Approach

The top-down approach has been used to estimate and validate the total size of hydrogen valve market.

  • The global market size of hydrogen valves was estimated through the data sanity of 35 major companies.
  • The growth of the hydrogen valve market witnessed an upward slope trend during the studied period, as it is currently in the initial stage of the product cycle, with major players beginning to expand their business into various application areas of the market.
  • Types of hydrogen valves, their features and properties, geographical presence, and key applications served by all players in the hydrogen valve market were studied to estimate and arrive at the percentage split of the segments.
  • Different types of hydrogen valves and their penetration for the end-use applications were also studied.
  • The market split for hydrogen valve by valve type, implementation, application, size, pressure range, end user industry, and application based on secondary research was estimated.
  • The demand generated by companies operating in different application segments of the end-use application was analyzed.
  • Multiple discussions with key opinion leaders across major companies involved in the development of hydrogen valve and related components were conducted to validate the market split of type, product, and application.
  • The regional splits were estimated using secondary sources, based on factors such as the number of players in a specific country and region and the adoption and use cases of each implementation type with respect to applications in the region

Hydrogen Valve Market
 Size, and Top- Down Approach

Data Triangulation

After arriving at the overall market size-using the market size estimation processes as explained above—the market has been split into several segments and subsegments. To complete the entire market engineering process and arrive at the exact statistics of each market segment and subsegment, data triangulation and market breakdown procedures have been employed, wherever applicable. The data has been triangulated by studying various factors and trends from the demand and supply sides in the hydrogen valve market.

Market Definition

A hydrogen valve is a specialized device designed to control the flow and pressure of hydrogen gas within a system. These valves are critical components in various applications, particularly within the hydrogen economy, including hydrogen production, storage, transportation, and utilization in fuel cells and refineries. Due to hydrogen's small molecular size and high diffusivity, hydrogen valves must be constructed from materials that prevent leakage and ensure safety under high-pressure conditions. Hydrogen valves are essential for the safe and efficient handling of hydrogen in various industrial and energy applications. Their design, material selection, and adherence to safety standards are critical factors that ensure the effective control of hydrogen flow and pressure, minimizing risks associated with hydrogen's highly flammable nature.

Key Stakeholders

  •  NGOs, Governments, Investment Banks, Venture Capitalists, and Private Equity Firms
  • Telecom Services Providers
  • Original Equipment Manufacturers
  • Value-added Service Providers
  • Data Center Operators
  • Software Developers
  • Data Center Colocation Service Providers
  • System Integrators
  • Cloud Service Providers
  • Colocation Service Providers

Report Objectives

  • To define, describe, segment, and forecast the hydrogen valve market, by valve type, size, pressure range, material, implementation, application, and end-user industry, in terms of value
  • To describe and forecast the market for various segments, with respect to four main regions, namely, North America, Europe, Asia Pacific, and the Rest of the World (RoW), in terms of value
  • To forecast and compare the market size of pre-recession with that of the post-recession at the regional level
  • To provide detailed information regarding drivers, restraints, opportunities, and challenges influencing the growth of the hydrogen valve market
  • To provide a detailed overview of the hydrogen valve market market’s supply chain, along with the ecosystem, technology trends, use cases, regulatory environment, and Porter’s five forces analysis for the market
  • To analyze industry trends, pricing data, patents and innovations, and trade data (export and import data) related to the hydrogen valves.
  • To strategically analyze the micromarkets1 with respect to individual growth trends, prospects, and contributions to the total market
  • To strategically profile the key players and comprehensively analyze their market share and core competencies2
  • To analyze opportunities for stakeholders and provide a detailed competitive landscape of the market
  • To analyze competitive developments, such as product launches/developments, collaborations, partnerships, acquisitions, and research & development (R&D) activities, carried out by players in the hydrogen valve market
  • To profile key players in the hydrogen valve market and comprehensively analyze their market ranking based on their revenue, market share, and core competencies2

Available customizations:

With the given market data, MarketsandMarkets offers customizations according to the specific requirements of companies. The following customization options are available for the report:

  • Detailed analysis and profiling of additional market players based on various blocks of the supply chain
Custom Market Research Services

We will customize the research for you, in case the report listed above does not meet with your exact requirements. Our custom research will comprehensively cover the business information you require to help you arrive at strategic and profitable business decisions.

Request Customization
Report Code
SE 9118
Published ON
Aug, 2024
Choose License Type
BUY NOW
  • SHARE
X
Request Customization
Speak to Analyst
Speak to Analyst
OR FACE-TO-FACE MEETING
PERSONALIZE THIS RESEARCH
  • Triangulate with your Own Data
  • Get Data as per your Format and Definition
  • Gain a Deeper Dive on a Specific Application, Geography, Customer or Competitor
  • Any level of Personalization
REQUEST A FREE CUSTOMIZATION
LET US HELP YOU!
  • What are the Known and Unknown Adjacencies Impacting the Hydrogen Valve Market
  • What will your New Revenue Sources be?
  • Who will be your Top Customer; what will make them switch?
  • Defend your Market Share or Win Competitors
  • Get a Scorecard for Target Partners
CUSTOMIZED WORKSHOP REQUEST
  • Call Us
  • +1-888-600-6441 (Corporate office hours)
  • +1-888-600-6441 (US/Can toll free)
  • +44-800-368-9399 (UK office hours)
CONNECT WITH US
ABOUT TRUST ONLINE
©2024 MarketsandMarkets Research Private Ltd. All rights reserved
DMCA.com Protection Status Website Feedback