Hypersonic Flight Market

Hypersonic Flight Market by Vehicle Type (Hypersonic Aircraft, Hypersonic Spacecraft), Industry (Military, Space, Commercial), Component ( Propulsion, Aerostructure, Avionics) and Region (North America, Europe, APAC, RoW) - Global forecast to 2030

Report Code: AS 8833 Oct, 2023, by marketsandmarkets.com

[194 Pages Report] The Hypersonic Flight Market is estimated to be USD 782 Million in 2023 and is projected to reach USD 1,154 Million by 2030, at a CAGR of 5.7% from 2023 to 2030. The primary key driving factor for the growth of the Hypersonic Flight Industry is the potential for dramatically reduced travel times for passengers. Hypersonic passenger aircraft can significantly shorten intercontinental flight durations, making long-distance travel more time-efficient and convenient.  Hypersonic technology can make space exploration more efficient by reducing travel times for crewed and uncrewed missions. Shorter transit durations lower mission risks, cut operational costs, and allow for more frequent missions additionally hypersonic technology offers military forces the capability for rapid response and precision strike capabilities. These attributes are crucial in modern warfare scenarios where agility and accuracy are paramount.

Hypersonic Flight Market

Hypersonic Flight Market

Hypersonic Flight Market Forecast to 2028

To know about the assumptions considered for the study, Request for Free Sample Report

Hypersonic Flight Market Dynamics:

Drivers: Rising demand for fast and efficient air travel

Fast and efficient transportation serves as a compelling driver for the hypersonic flight market, as the demand for rapid travel and seamless connectivity grows in our increasingly interconnected world. Hypersonic flight, with its ability to achieve speeds exceeding Mach 5, promises to revolutionize transportation by significantly reducing travel times and increasing accessibility to distant destinations.

For commercial aviation, hypersonic flight offers the potential for transformative point-to-point travel. Traditional long-haul flights, which can take hours or even days, could be replaced by hypersonic journeys that span continents in a matter of hours. Such time-saving capabilities not only enhance passenger convenience but also boost productivity for businesses operating on a global scale. The ability to reach distant markets quickly and efficiently opens up new possibilities for trade and economic growth.

Additionally, hypersonic flight presents exciting prospects for space tourism and suborbital travel. With hypersonic spaceplanes, travellers can experience the thrill of space exploration without leaving the Earth's atmosphere. In the defense sector, the importance of fast and efficient transportation cannot be overstated. Hypersonic vehicles hold the potential to revolutionize military operations, offering rapid deployment of troops and assets to remote regions and crisis zones. The ability to respond swiftly to emerging threats and conduct prompt global strike missions is a game-changer in modern warfare.

Restraints: Cost and Complexity of manufacturing

Cost and complexity of manufacturing pose significant restraints for the hypersonic flight market, presenting challenges to the widespread adoption and commercialization of hypersonic technologies. The development and deployment of hypersonic vehicles and systems demand substantial financial investment, advanced engineering expertise, and intricate testing and validation processes. As a result, the cost of research, design, and manufacturing for hypersonic flight is notably higher compared to traditional aviation or rocketry.

The complexity of hypersonic flight arises from the extreme conditions and forces involved during high-speed travel. Hypersonic vehicles experience intense heat due to air friction, placing tremendous stress on the materials and structures. Designing materials capable of withstanding these extreme conditions is a significant engineering challenge. Additionally, the intricate aerodynamics of hypersonic flight require meticulous analysis and computational modeling to ensure stability, maneuverability, and safety. One key challenges in manufacturing hypersonic vehicles is the use of advanced materials. Hypersonic vehicles must be able to withstand the extreme temperatures and stresses of hypersonic flight, which requires the use of materials such as ceramic composites and carbon nanotubes. These materials are difficult to manufacture and are often expensive. Another challenge in manufacturing hypersonic vehicles is the need for precise tolerances. Hypersonic vehicles must be manufactured to very precise tolerances in order to achieve the aerodynamic performance required for hypersonic flight. This requires the use of advanced manufacturing techniques and equipment.

The development of hypersonic vehicles often requires advanced and specialized technologies, making the supply chain more complex and potentially introducing dependencies on specific suppliers. Delays in the availability of critical components or materials can lead to cost overruns and project delays. Additionally, the safety considerations associated with hypersonic flight are paramount. Ensuring the well-being of passengers and payload during hypersonic travel requires rigorous testing and validation, with an emphasis on redundancy and fault tolerance.

Opportunities: Space Tourism

Space tourism is a potential opportunity for the hypersonic flight market. Hypersonic vehicles could be used to transport tourists to the edge of space or into low Earth orbit. This would provide a unique and thrilling experience for tourists, and it could also generate significant revenue for the hypersonic flight industry.

There are a number of advantages to using hypersonic vehicles for space tourism. First, hypersonic vehicles can travel much faster than traditional aircraft, which means that tourists could reach space in a matter of minutes.  Additionally hypersonic vehicles are reusable, which means that the cost of space tourism could be reduced over time.

Hypersonic spaceplanes can take off and land horizontally, similar to conventional aircraft, presenting an appealing option for suborbital space tourism ventures. Passengers can experience a brief but exhilarating journey of space. The reusability of hypersonic vehicles enables multiple missions, reducing launch costs and making space tourism more accessible to a broader audience. Companies such as Blue Origin (US) have invested in development of hypersonic spaceplane for commercial usage.   

In addition to space tourism, hypersonic flight offers advantages in satellite deployment. The ability to rapidly transport payloads to various orbits allows for more frequent and efficient satellite launches. Hypersonic vehicles can provide on-demand satellite placement, reducing the lead time for satellite operators and increasing the availability of space-based services.

The commercial space market focuses on cost efficiency and accessibility, which aligns with the potential of hypersonic flight. As commercial space ventures proliferate, the demand for rapid, reliable, and affordable space transportation solutions will continue to rise. Hypersonic flight can make space tourism more accessible and economically viable.

Challenges: Lack of infrastructure

Lack of infrastructure hinders the widespread adoption and commercialization of this revolutionary technology. Hypersonic flight requires specialized facilities, ground support equipment, and launch infrastructure to handle extreme speeds and temperatures. However, compared to traditional aviation and rocketry, the infrastructure required for hypersonic flight is still in its early stages of development.

One of the primary infrastructure challenges is the need for specialized launch facilities. Hypersonic vehicles demand unique launch platforms capable of accommodating the high speeds and forces involved in takeoff. The development of these launch facilities requires substantial investment and careful engineering to ensure safety and operational efficiency. Hypersonic flight necessitates dedicated landing sites equipped with appropriate technology to handle high-speed landings. The landing phase is particularly challenging due to the vehicle's high velocity and the need for precise control during descent. Without suitable landing infrastructure, the potential for accidents or damage to the vehicle increases significantly.

The lack of fueling infrastructure is another major infrastructure challenge for the hypersonic flight market. Hypersonic vehicles require specialized fuels that are not currently widely available. These fuels are typically exotic blends of hydrocarbons and oxygen that are designed to burn efficiently at high speeds and temperatures. One of the main challenges in developing fueling infrastructure for hypersonic flight is the need to store and transport these fuels safely. Hypersonic fuels are highly volatile and flammable, and they must be handled with extreme care. This means that fueling facilities for hypersonic vehicles must be specially designed and equipped to safely store and handle these fuels.

Hypersonic Flight  Market Ecosystem

Raytheon Technologies Corporation (US), Northrop Grumman Corporation (US), L3Harris Technologies, Inc. (US), SpaceX (US), GE Group (US), Rolls-Royce (UK), The Boeing Company (US), BAE Systems Plc (UK), DLR (Germany), Leidos (US), Dassault Aviation (France), Rocket Lab USA (US), Blue Origin (US), Hermeus Corporation (US), are some of the leading companies in the hypersonic flight market. 

Hypersonic Flight Market by Ecosystem

Based on Propulsion, the propulsion segment accounts for the highest market share in hypersonic flight market during the forecast period.

Propulsion systems are expected to account for the highest market share during the forecast period in the field of hypersonic flight due to their central role in the success and performance of hypersonic vehicles. propulsion technologies for hypersonic flight are diverse, including scramjet engines, rocket engines, and combined cycle engines. These systems require continuous innovation and development to optimize performance, reduce fuel consumption, and extend the operational lifespan, all of which are critical to meeting the demands of this evolving market. Moreover, the advancements in propulsion systems directly impact the feasibility and practicality of hypersonic technology for both military and civilian applications. More efficient and reliable propulsion systems translate into safer and more cost-effective hypersonic missions, enhancing their attractiveness for various stakeholders.

Based on Industry, the military segment accounts for the highest CAGR in hypersonic flight market during the forecast period.

The military sector is anticipated to account for the highest growth rate  in hypersonic flight market during the forecast period due  to several key factors:

First and foremost, hypersonic military aircraft offer an unprecedented advantage in terms of speed, agility, and precision. Their ability to traverse vast distances in minimal time provides military forces with rapid response capabilities, reducing reaction times in critical situations. Hypersonic military aircraft can deliver time-sensitive payloads, such as strike capabilities and reconnaissance, more swiftly and with remarkable accuracy, making them highly attractive for defense applications.

Second, the global geopolitical landscape has become increasingly complex, with heightened security concerns and a focus on enhancing military capabilities. Hypersonic military aircraft, including unmanned vehicles and weapons, are viewed as essential assets for maintaining a competitive edge in national security. As a result, significant investments are being made by nations and defense organizations to develop, test, and deploy hypersonic military platforms.

Based on Vehicle type , hypersonic aircraft segment is projected to grow at the highest CAGR during the forecast period.

Hypersonic aircraft are projected to experience the CAGR within the aerospace industry for several compelling reasons. Firstly, they represent a paradigm shift in aviation and space exploration, offering unprecedented speed and efficiency. The allure of cutting intercontinental travel times drastically, reducing hours to minutes, has caught the attention of both commercial and military sectors.

In the commercial realm, the promise of high-speed, point-to-point travel opens up new possibilities for global connectivity and economic opportunities. Passengers could reach their destinations faster, and the aviation industry could revolutionize itself with a new category of travel. On the military front, hypersonic aircraft offer game-changing capabilities in terms of rapid response, precision strikes, and enhanced deterrence.

North America is expected to lead the hypersonic flight market in 2023.

Hypersonic Flight market in the North America region are experiencing significant growth due to several key factors.

  • Commercial Ventures: North America is actively exploring commercial applications of hypersonic technology. Companies like SpaceX (US), Blue Origin (US), and The Boeing Company (US) are investing in the development of commercial hypersonic aircraft. The potential for hypersonic passenger travel, significantly reducing intercontinental flight times, has captured the interest of both aerospace companies and travelers, driving market expansion.
  • Technological Advancements: Advances in materials science, propulsion systems, and avionics are making hypersonic technology more feasible and reliable. North America is at the forefront of these technological breakthroughs, reducing barriers and enhancing the safety and reliability of hypersonic systems.
  • Access to Capital and Funding: The region benefits from access to substantial capital and funding sources, including venture capital, government grants, and private investments. These financial resources are crucial for the development and commercialization of hypersonic technologies.

Hypersonic Flight Market by Region

Hypersonic Flight Market by Region

To know about the assumptions considered for the study, download the pdf brochure

Hypersonic Flight Industry Companies: Top Key Market Players

The Hypersonic Flight Companies is dominated by globally established players such as Lockheed Martin Corporation (US), Raytheon Technologies Corporation (US), Northrop Grumman Corporation (US), L3Harris Technologies, Inc. (US), SpaceX (US), GE Group (US), Rolls-Royce (UK), The Boeing Company (US), BAE Systems Plc (UK), DLR (Germany), Leidos (US), Dassault Aviation (France), Rocket Lab USA (US), Blue Origin (US), Hermeus Corporation (US). These companies have well-equipped manufacturing facilities and strong distribution networks across North America, Europe, Asia Pacific, Latin America, and Middle East & Africa.

Get online access to the report on the World's First Market Intelligence Cloud

  • Easy to Download Historical Data & Forecast Numbers
  • Company Analysis Dashboard for high growth potential opportunities
  • Research Analyst Access for customization & queries
  • Competitor Analysis with Interactive dashboard
  • Latest News, Updates & Trend analysis
Request Sample

Scope of the Report

Report Metric

Details

Estimated Market Size

$782 Million in 2023

Projected Market Size

$1,154 Million by 2030

Growth Rate

CAGR of 5.7%

Market Size Available for Years

2019–2030

Base Year Considered

2022

Forecast Period

2023–2030

Forecast Units

Value (USD million)

Segments Covered

Vehicle Type, Component, Industry, and Region

Geographies Covered

North America, Europe, Asia Pacific, Rest of the World

Companies Covered

Lockheed Martin Corporation (US), Raytheon Technologies Corporation (US), Northrop Grumman Corporation (US), L3harris Technologies, Inc. (US), SpaceX (US), GE Group (US), Rolls Royce (UK), The Boeing Company  (US), BAE Systems Plc (UK), DLR (Germany), Leidos (US), Dassault Aviation (France), Rocket Lab USA (US), Blue Origin (US), Hermeus Corporation (US), Kratos Defense & Security Solutions, Inc. (US), Reaction Engines (UK), Stratolaunch (US), Hypersonix Launch Systems (Australia), Hyperspace Propulsion (US), Venus Aerospace (US), Destinus (Switzerland), Sierra Nevada Corporation (US), Velontra (US), China Aerospace Science and Technology Corporation (China).

Hypersonic Flight Market Highlights

This research report categorizes Hypersonic Flight market based on Vehicle Type, Component, Industry, and Region.

Segment

Subsegment

By Industry:

  • Military
  • Space
  • Commercial

By Vehicle Type:

  • Hypersonic Aircraft
    • Military Jet
    • Commercial Plane
  • Hypersonic Spacecraft
    • Spaceplane
    • Airbreathing Hypersonic Vehicle
    • Hypersonic Testbed and Demonstrator

By Range:

  • Propulsion
    • Ramjet Engine
    • Scramjet Engine
    • Rocket Engine
    • Hybrid Engine
  • Aerostructure
    • Airframe Structure
    • Wing and Control Surface
    • Nose Cone and Leading Edge
  • Avionics
    • Flight Control System
    • Navigation System
    • Communication System
    • Thermal Protection System
    • Sensor Suit

By Region:

  • North America
  • Europe
  • Asia Pacific
  • Rest of the World

Recent Developments

  • In January 2023 , US Department of Defense (DoD) awarded a contract USD 334 million as part of its project mayhem Leidos (US) to develop both hypersonic weapon and hypersonic aircraft. The Contract is awarded for a duration of 6 years.
  • In August 2021, Hermeus (US) received an investment worth USD 60 million for the development of hypersonic military aircraft.  
  • In July 2019 Rolls-Royce was awarded a  contract from UK Ministry of defense to develop hypersonic propulsion systems for hypersonic military aircraft under the HVX programme.

Key Questions Addressed by the Report :

To speak to our analyst for a discussion on the above findings, click Speak to Analyst

TABLE OF CONTENTS
 
1 INTRODUCTION (Page No. - 25)
    1.1 STUDY OBJECTIVES 
    1.2 MARKET DEFINITION 
    1.3 MARKET SCOPE 
           1.3.1 MARKETS COVERED
                    FIGURE 1 HYPERSONIC FLIGHT MARKET SEGMENTATION
           1.3.2 REGIONAL SCOPE
           1.3.3 YEARS CONSIDERED
    1.4 INCLUSIONS AND EXCLUSIONS 
           TABLE 1 INCLUSIONS AND EXCLUSIONS
    1.5 CURRENCY CONSIDERED 
           TABLE 2 USD EXCHANGE RATES
    1.6 STAKEHOLDERS 
    1.7 SUMMARY OF CHANGES 
 
2 RESEARCH METHODOLOGY (Page No. - 29)
    2.1 RESEARCH DATA 
           FIGURE 2 RESEARCH PROCESS FLOW
           FIGURE 3 RESEARCH DESIGN
           2.1.1 SECONDARY DATA
                    2.1.1.1 Key data from secondary sources
           2.1.2 PRIMARY DATA
                    2.1.2.1 Key insights from industry experts
                    2.1.2.2 Key data from primary sources
                    2.1.2.3 List of primary sources
                    2.1.2.4 Breakdown of primaries
                               FIGURE 4 BREAKDOWN OF PRIMARY INTERVIEWS: BY COMPANY TYPE, DESIGNATION, AND REGION
           2.1.3 RECESSION IMPACT ANALYSIS
    2.2 FACTOR ANALYSIS 
           2.2.1 INTRODUCTION
           2.2.2 DEMAND-SIDE INDICATORS
                    2.2.2.1 Space access
                    2.2.2.2 Global connectivity
                    2.2.2.3 National security
                    2.2.2.4 Reduced travel time
           2.2.3 SUPPLY-SIDE INDICATORS
                    2.2.3.1 Financial trend of major defense contractors
    2.3 MARKET SIZE ESTIMATION AND METHODOLOGY 
           2.3.1 BOTTOM-UP APPROACH
                    2.3.1.1 Market size estimation
                               FIGURE 5 MARKET SIZE ESTIMATION METHODOLOGY: BOTTOM-UP APPROACH
           2.3.2 TOP-DOWN APPROACH
                    FIGURE 6 MARKET SIZE ESTIMATION METHODOLOGY: TOP-DOWN APPROACH
    2.4 MARKET BREAKDOWN AND DATA TRIANGULATION 
           FIGURE 7 DATA TRIANGULATION
    2.5 GROWTH RATE ASSUMPTIONS 
    2.6 RESEARCH ASSUMPTIONS 
           FIGURE 8 RESEARCH ASSUMPTIONS
    2.7 RESEARCH LIMITATIONS 
    2.8 RISK ASSESSMENT 
 
3 EXECUTIVE SUMMARY (Page No. - 41)
    FIGURE 9 MILITARY SEGMENT TO GROW AT HIGHEST CAGR FROM 2023 TO 2030
    FIGURE 10 PROPULSION SEGMENT TO HAVE LARGEST MARKET SHARE IN 2023
    FIGURE 11 HYPERSONIC AIRCRAFT SEGMENT TO HAVE HIGHER CAGR DURING FORECAST PERIOD
    FIGURE 12 NORTH AMERICA TO REGISTER HIGHEST MARKET SHARE DURING FORECAST PERIOD
 
4 PREMIUM INSIGHTS (Page No. - 44)
    4.1 ATTRACTIVE GROWTH OPPORTUNITIES FOR PLAYERS IN HYPERSONIC FLIGHT MARKET 
           FIGURE 13 RISING DEMAND FOR SPACE TOURISM AND INCREASED RESPONSE TIME IN MILITARY OPERATIONS TO DRIVE MARKET
    4.2 HYPERSONIC FLIGHT MARKET, BY INDUSTRY 
           FIGURE 14 SPACE SEGMENT TO LEAD MARKET SHARE DURING FORECAST PERIOD
    4.3 HYPERSONIC FLIGHT MARKET, BY VEHICLE TYPE 
           FIGURE 15 HYPERSONIC AIRCRAFT SEGMENT TO ACCOUNT FOR LARGEST MARKET SHARE DURING FORECAST PERIOD
    4.4 HYPERSONIC FLIGHT MARKET, BY END USER 
           FIGURE 16 PROPULSION SEGMENT TO BE DOMINANT DURING FORECAST PERIOD
    4.5 HYPERSONIC FLIGHT MARKET, BY REGION 
           FIGURE 17 NORTH AMERICA TO HAVE LARGEST MARKET SHARE DURING FORECAST PERIOD
    4.6 HYPERSONIC FLIGHT MARKET, BY COUNTRY 
           FIGURE 18 CHINA TO BE FASTEST-GROWING MARKET FROM 2023 TO 2030
 
5 MARKET OVERVIEW (Page No. - 47)
    5.1 INTRODUCTION 
    5.2 MARKET DYNAMICS 
           FIGURE 19 HYPERSONIC FLIGHT MARKET: DRIVERS, RESTRAINTS, OPPORTUNITIES, AND CHALLENGES
           5.2.1 DRIVERS
                    5.2.1.1 Rising demand for fast and efficient air travel
                    5.2.1.2 Increasing focus on military modernization
                    5.2.1.3 Technological advancements in propulsion systems and aerodynamics
                    5.2.1.4 Growing investments to improve hypersonic technology
                    5.2.1.5 Rising competition in aerospace industry
           5.2.2 RESTRAINTS
                    5.2.2.1 Costly and complex manufacturing process of hypersonic vehicles
                    5.2.2.2 Complicated operational protocols
                    5.2.2.3 Lack of established regulations and policies
           5.2.3 OPPORTUNITIES
                    5.2.3.1 International collaboration for research and development projects
                    5.2.3.2 Space tourism
           5.2.4 CHALLENGES
                    5.2.4.1 Material and heat management
                    5.2.4.2 Lack of fueling infrastructure and specialized launch facilities
                    5.2.4.3 Limited availability of qualified experts on hypersonic technology
    5.3 TRENDS AND DISRUPTIONS IMPACTING CUSTOMER BUSINESS 
           FIGURE 20 REVENUE SHIFT FOR PLAYERS IN HYPERSONIC FLIGHT MARKET
    5.4 ECOSYSTEM ANALYSIS 
           5.4.1 PROMINENT COMPANIES
           5.4.2 PRIVATE AND SMALL ENTERPRISES
           5.4.3 END USERS
                    FIGURE 21 ECOSYSTEM MAPPING
                    TABLE 3 ROLE OF COMPANIES IN MARKET ECOSYSTEM
    5.5 VALUE CHAIN ANALYSIS 
           FIGURE 22 VALUE CHAIN ANALYSIS
    5.6 USE CASE ANALYSIS 
           5.6.1 IMPROVED ATMOSPHERIC REENTRY FOR HYPERSONIC SPACECRAFT
                    TABLE 4 IMPROVED ATMOSPHERIC REENTRY FOR HYPERSONIC SPACECRAFT
           5.6.2 EFFICIENT AND RAPID CARGO DELIVERY IN SPACE
                    TABLE 5 EFFICIENT AND RAPID CARGO DELIVERY IN SPACE
    5.7 PORTER’S FIVE FORCES ANALYSIS 
           TABLE 6 IMPACT OF PORTER’S FIVE FORCES
           FIGURE 23 PORTER’S FIVE FORCES ANALYSIS
           5.7.1 THREAT OF NEW ENTRANTS
           5.7.2 THREAT OF SUBSTITUTES
           5.7.3 BARGAINING POWER OF SUPPLIERS
           5.7.4 BARGAINING POWER OF BUYERS
           5.7.5 INTENSITY OF COMPETITIVE RIVALRY
    5.8 KEY STAKEHOLDERS AND BUYING CRITERIA 
           5.8.1 KEY STAKEHOLDERS IN BUYING PROCESS
                    FIGURE 24 INFLUENCE OF STAKEHOLDERS ON BUYING PROCESS, BY INDUSTRY
                    TABLE 7 INFLUENCE OF STAKEHOLDERS ON BUYING PROCESS, BY INDUSTRY (%)
           5.8.2 BUYING CRITERIA
                    FIGURE 25 KEY BUYING CRITERIA, BY INDUSTRY
                    TABLE 8 KEY BUYING CRITERIA, BY INDUSTRY
    5.9 TARIFF AND REGULATORY LANDSCAPE 
           TABLE 9 NORTH AMERICA: REGULATORY BODIES, GOVERNMENT AGENCIES, AND OTHER AGENCIES
           TABLE 10 EUROPE: REGULATORY BODIES, GOVERNMENT AGENCIES, AND OTHER AGENCIES
           TABLE 11 ASIA PACIFIC: REGULATORY BODIES, GOVERNMENT AGENCIES, AND OTHER AGENCIES
           TABLE 12 MIDDLE EAST: REGULATORY BODIES, GOVERNMENT AGENCIES, AND OTHER AGENCIES
           TABLE 13 REST OF THE WORLD: REGULATORY BODIES, GOVERNMENT AGENCIES, AND OTHER AGENCIES
    5.10 KEY CONFERENCES AND EVENTS 
           TABLE 14 KEY CONFERENCES AND EVENTS, 2022−2023
 
6 INDUSTRY TRENDS (Page No. - 68)
    6.1 INTRODUCTION 
    6.2 TECHNOLOGY TRENDS 
           6.2.1 ADVANCED PROPULSION SYSTEMS
           6.2.2 THERMAL PROTECTION SYSTEMS
           6.2.3 MATERIAL SCIENCE
           6.2.4 AERODYNAMICS AND DESIGN OPTIMIZATION
           6.2.5 COMPUTATIONAL MODELING AND SIMULATION
           6.2.6 AUTONOMY AND CONTROL SYSTEMS
           6.2.7 HYPERSONIC WIND TUNNEL TESTING
           6.2.8 INTEGRATED AVIONICS AND SENSORS
           6.2.9 REUSABILITY AND SUSTAINABILITY
    6.3 IMPACT OF MEGATRENDS 
           6.3.1 GLOBAL GEOPOLITICAL SHIFTS
           6.3.2 SPACE EXPLORATION AND RESEARCH
           6.3.3 SOCIETAL ACCEPTANCE AND SAFETY
    6.4 INNOVATION AND PATENT ANALYSIS 
           TABLE 15 INNOVATIONS AND PATENT REGISTRATIONS, 2019–2023
 
7 HYPERSONIC FLIGHT MARKET, BY INDUSTRY (Page No. - 83)
    7.1 INTRODUCTION 
           FIGURE 26 HYPERSONIC FLIGHT MARKET, BY INDUSTRY (2023–2030)
           TABLE 16 HYPERSONIC FLIGHT MARKET, BY INDUSTRY, 2019–2022 (USD MILLION)
           TABLE 17 HYPERSONIC FLIGHT MARKET, BY INDUSTRY, 2023–2030 (USD MILLION)
    7.2 MILITARY 
           7.2.1 RISING INVESTMENT FOR DEVELOPING HYPERSONIC AIRCRAFT TO DRIVE MARKET
    7.3 SPACE 
           7.3.1 REUSABILITY AND SHORTER RESPONSE TIME OF HYPERSONIC FLIGHTS TO DRIVE MARKET
    7.4 COMMERCIAL 
           7.4.1 INCREASING DEMAND FOR REDUCED TRAVEL TIME AND ADVANCED CONNECTIVITY TO DRIVE MARKET
 
8 HYPERSONIC FLIGHT MARKET, BY VEHICLE TYPE (Page No. - 87)
    8.1 INTRODUCTION 
           FIGURE 27 HYPERSONIC FLIGHT MARKET, BY VEHICLE TYPE, 2023–2030
           TABLE 18 HYPERSONIC FLIGHT MARKET, BY VEHICLE TYPE, 2019–2022 (USD MILLION)
           TABLE 19 HYPERSONIC FLIGHT MARKET, BY VEHICLE TYPE, 2023–2030 (USD MILLION)
    8.2 HYPERSONIC AIRCRAFT 
           8.2.1 MILITARY JET
                    8.2.1.1 Rapid response capabilities to drive market
           8.2.2 COMMERCIAL PLANE
                    8.2.2.1 Increasing air traffic to drive market
    8.3 HYPERSONIC SPACECRAFT 
           8.3.1 SPACEPLANE
                    8.3.1.1 Demand for space tourism and rapid access to space to drive market
           8.3.2 AIR-BREATHING HYPERSONIC VEHICLE
                    8.3.2.1 Increased applications in cargo transport to drive market
           8.3.3 HYPERSONIC TESTBED AND DEMONSTRATOR
                    8.3.3.1 Applications in commercial, space, and military sectors to drive market
 
9 HYPERSONIC FLIGHT MARKET, BY COMPONENT (Page No. - 92)
    9.1 INTRODUCTION 
           FIGURE 28 HYPERSONIC FLIGHT MARKET, BY COMPONENT, 2023–2030
           TABLE 20 HYPERSONIC FLIGHT MARKET, BY COMPONENT, 2019–2022 (USD MILLION)
           TABLE 21 HYPERSONIC FLIGHT MARKET, BY COMPONENT, 2023–2030 (USD MILLION)
    9.2 PROPULSION 
           9.2.1 RAMJET ENGINE
                    9.2.1.1 Sustained high-speed operation to drive market
           9.2.2 SCRAMJET ENGINE
                    9.2.2.1 Ability to operate under extremely high temperatures to drive market
           9.2.3 ROCKET ENGINE
                    9.2.3.1 Higher thrust capability to drive market
           9.2.4 HYBRID ENGINE
                    9.2.4.1 Dual benefits of air-breathing and rocket propulsion to drive market
    9.3 AEROSTRUCTURE 
           9.3.1 AIRFRAME STRUCTURE
                    9.3.1.1 Ability to withstand aerodynamic forces and mechanical loads to drive market
           9.3.2 WING AND CONTROL SURFACE
                    9.3.2.1 Crucial role in stabilizing lift and drag forces to drive market
           9.3.3 NOSE CONE AND LEADING EDGE
                    9.3.3.1 Improved aerodynamic performance to drive market
    9.4 AVIONICS 
           9.4.1 FLIGHT CONTROL SYSTEM
                    9.4.1.1 Fault tolerance and trajectory control capabilities to drive market
           9.4.2 NAVIGATION SYSTEM
                    9.4.2.1 Essential role in precision targeting and payload delivery to drive market
           9.4.3 COMMUNICATION SYSTEM
                    9.4.3.1 Need for real-time transmission of critical data to drive market
           9.4.4 THERMAL PROTECTION SYSTEM
                    9.4.4.1 Key role in protecting structural integrity to drive market
           9.4.5 SENSOR SUIT
                    9.4.5.1 Data collection capabilities to drive market
 
10 HYPERSONIC FLIGHT MARKET, BY REGION (Page No. - 99)
     10.1 INTRODUCTION 
     10.2 REGIONAL RECESSION IMPACT ANALYSIS 
             TABLE 22 REGIONAL RECESSION IMPACT ANALYSIS
             TABLE 23 HYPERSONIC FLIGHT MARKET, BY REGION, 2019–2022 (USD MILLION)
             TABLE 24 HYPERSONIC FLIGHT MARKET, BY REGION, 2023–2030 (USD MILLION)
     10.3 NORTH AMERICA 
             10.3.1 NORTH AMERICA: PESTLE ANALYSIS
             10.3.2 NORTH AMERICA: RECESSION IMPACT ANALYSIS
                        FIGURE 29 NORTH AMERICA: HYPERSONIC FLIGHT MARKET SNAPSHOT
                        TABLE 25 NORTH AMERICA: HYPERSONIC FLIGHT MARKET, BY INDUSTRY, 2019–2022 (USD MILLION)
                        TABLE 26 NORTH AMERICA: HYPERSONIC FLIGHT MARKET, BY INDUSTRY, 2023–2030 (USD MILLION)
                        TABLE 27 NORTH AMERICA: HYPERSONIC FLIGHT MARKET, BY VEHICLE TYPE, 2019–2022 (USD MILLION)
                        TABLE 28 NORTH AMERICA: HYPERSONIC FLIGHT MARKET, BY VEHICLE TYPE, 2023–2030 (USD MILLION)
                        TABLE 29 NORTH AMERICA: HYPERSONIC FLIGHT MARKET, BY COMPONENT, 2019–2022 (USD MILLION)
                        TABLE 30 NORTH AMERICA: HYPERSONIC FLIGHT MARKET, BY COMPONENT, 2023–2030 (USD MILLION)
                        TABLE 31 NORTH AMERICA: HYPERSONIC FLIGHT MARKET, BY COUNTRY, 2019–2022 (USD MILLION)
                        TABLE 32 NORTH AMERICA: HYPERSONIC FLIGHT MARKET, BY COUNTRY, 2023–2030 (USD MILLION)
             10.3.3 US
                        10.3.3.1 CHINA: HYPERSONIC FLIGHT MARKET, BY INDUSTRY, 2019–2022 (USD MILLION)
                                     TABLE 33 US: HYPERSONIC FLIGHT MARKET, BY INDUSTRY, 2019–2022 (USD MILLION)
                                     TABLE 34 US: HYPERSONIC FLIGHT MARKET, BY INDUSTRY, 2023–2030 (USD MILLION)
                                     TABLE 35 US: HYPERSONIC FLIGHT MARKET, BY VEHICLE TYPE, 2019–2022 (USD MILLION)
                                     TABLE 36 US: HYPERSONIC FLIGHT MARKET, BY VEHICLE TYPE, 2023–2030 (USD MILLION)
             10.3.4 CANADA
                        10.3.4.1 JAPAN: HYPERSONIC FLIGHT MARKET, BY INDUSTRY, 2019–2022 (USD MILLION)
                                     TABLE 37 CANADA: HYPERSONIC FLIGHT MARKET, BY INDUSTRY, 2019–2022 (USD MILLION)
                                     TABLE 38 CANADA: HYPERSONIC FLIGHT MARKET, BY INDUSTRY, 2023–2030 (USD MILLION)
                                     TABLE 39 CANADA: HYPERSONIC FLIGHT MARKET, BY VEHICLE TYPE, 2019–2022 (USD MILLION)
                                     TABLE 40 CANADA: HYPERSONIC FLIGHT MARKET, BY VEHICLE TYPE, 2023–2030 (USD MILLION)
     10.4 EUROPE 
             10.4.1 EUROPE: PESTLE ANALYSIS
             10.4.2 EUROPE: RECESSION IMPACT ANALYSIS
                        FIGURE 30 EUROPE: HYPERSONIC FLIGHT MARKET SNAPSHOT
                        TABLE 41 EUROPE: HYPERSONIC FLIGHT MARKET, BY INDUSTRY, 2019–2022 (USD MILLION)
                        TABLE 42 EUROPE: HYPERSONIC FLIGHT MARKET, BY INDUSTRY, 2023–2030 (USD MILLION)
                        TABLE 43 EUROPE: HYPERSONIC FLIGHT MARKET, BY VEHICLE TYPE, 2019–2022 (USD MILLION)
                        TABLE 44 EUROPE: HYPERSONIC FLIGHT MARKET, BY VEHICLE TYPE, 2023–2030 (USD MILLION)
                        TABLE 45 EUROPE: HYPERSONIC FLIGHT MARKET, BY COMPONENT, 2019–2022 (USD MILLION)
                        TABLE 46 EUROPE: HYPERSONIC FLIGHT MARKET, BY COMPONENT, 2023–2030 (USD MILLION)
                        TABLE 47 EUROPE: HYPERSONIC FLIGHT MARKET, BY COUNTRY, 2019–2022 (USD MILLION)
                        TABLE 48 EUROPE: HYPERSONIC FLIGHT MARKET, BY COUNTRY, 2023–2030 (USD MILLION)
             10.4.3 UK
                        10.4.3.1 MIDDLE EAST & AFRICA
                                     TABLE 49 UK: HYPERSONIC FLIGHT MARKET, BY INDUSTRY, 2019–2022 (USD MILLION)
                                     TABLE 50 UK: HYPERSONIC FLIGHT MARKET, BY INDUSTRY, 2023–2030 (USD MILLION)
                                     TABLE 51 UK: HYPERSONIC FLIGHT MARKET, BY VEHICLE TYPE, 2019–2022 (USD MILLION)
                                     TABLE 52 UK: HYPERSONIC FLIGHT MARKET, BY VEHICLE TYPE, 2023–2030 (USD MILLION)
             10.4.4 FRANCE
                        10.4.4.1 LATIN AMERICA
                                     TABLE 53 FRANCE: HYPERSONIC FLIGHT MARKET, BY INDUSTRY, 2019–2022 (USD MILLION)
                                     TABLE 54 FRANCE: HYPERSONIC FLIGHT MARKET, BY INDUSTRY, 2023–2030 (USD MILLION)
                                     TABLE 55 FRANCE: HYPERSONIC FLIGHT MARKET, BY VEHICLE TYPE, 2019–2022 (USD MILLION)
                                     TABLE 56 FRANCE: HYPERSONIC FLIGHT MARKET, BY VEHICLE TYPE, 2023–2030 (USD MILLION)
             10.4.5 GERMANY
                        10.4.5.1 COMPETITIVE LANDSCAPE
                                     TABLE 57 GERMANY: HYPERSONIC FLIGHT MARKET, BY INDUSTRY, 2019–2022 (USD MILLION)
                                     TABLE 58 GERMANY: HYPERSONIC FLIGHT MARKET, BY INDUSTRY, 2023–2030 (USD MILLION)
                                     TABLE 59 GERMANY: HYPERSONIC FLIGHT MARKET, BY VEHICLE TYPE, 2019–2022 (USD MILLION)
                                     TABLE 60 GERMANY: HYPERSONIC FLIGHT MARKET, BY VEHICLE TYPE, 2023–2030 (USD MILLION)
             10.4.6 REST OF EUROPE
                        TABLE 61 REST OF EUROPE: HYPERSONIC FLIGHT MARKET, BY INDUSTRY, 2019–2022 (USD MILLION)
                        TABLE 62 REST OF EUROPE: HYPERSONIC FLIGHT MARKET, BY INDUSTRY, 2023–2030 (USD MILLION)
                        TABLE 63 REST OF EUROPE: HYPERSONIC FLIGHT MARKET, BY VEHICLE TYPE, 2019–2022 (USD MILLION)
                        TABLE 64 REST OF EUROPE: HYPERSONIC FLIGHT MARKET, BY VEHICLE TYPE, 2023–2030 (USD MILLION)
     10.5 ASIA PACIFIC 
             10.5.1 ASIA PACIFIC: PESTLE ANALYSIS
             10.5.2 ASIA PACIFIC: RECESSION IMPACT ANALYSIS
                        FIGURE 31 ASIA PACIFIC: HYPERSONIC FLIGHT MARKET SNAPSHOT
                        TABLE 65 ASIA PACIFIC: HYPERSONIC FLIGHT MARKET, BY INDUSTRY, 2019–2022 (USD MILLION)
                        TABLE 66 ASIA PACIFIC: HYPERSONIC FLIGHT MARKET, BY INDUSTRY, 2023–2030 (USD MILLION)
                        TABLE 67 ASIA PACIFIC: HYPERSONIC FLIGHT MARKET, BY VEHICLE TYPE, 2019–2022 (USD MILLION)
                        TABLE 68 ASIA PACIFIC: HYPERSONIC FLIGHT MARKET, BY VEHICLE TYPE, 2023–2030 (USD MILLION)
                        TABLE 69 ASIA PACIFIC: HYPERSONIC FLIGHT MARKET, BY COMPONENT, 2019–2022 (USD MILLION)
                        TABLE 70 ASIA PACIFIC: HYPERSONIC FLIGHT MARKET, BY COMPONENT, 2023–2030 (USD MILLION)
                        TABLE 71 ASIA PACIFIC: HYPERSONIC FLIGHT MARKET, BY COUNTRY, 2019–2022 (USD MILLION)
                        TABLE 72 ASIA PACIFIC: HYPERSONIC FLIGHT MARKET, BY COUNTRY, 2023–2030 (USD MILLION)
             10.5.3 CHINA
                        10.5.3.1 DETAILED LIST OF KEY STARTUPS/SMES
                                     TABLE 73 CHINA: HYPERSONIC FLIGHT MARKET, BY INDUSTRY, 2019–2022 (USD MILLION)
                                     TABLE 74 CHINA: HYPERSONIC FLIGHT MARKET, BY INDUSTRY, 2023–2030 (USD MILLION)
                                     TABLE 75 CHINA: HYPERSONIC FLIGHT MARKET, BY VEHICLE TYPE, 2019–2022 (USD MILLION)
                                     TABLE 76 CHINA: HYPERSONIC FLIGHT MARKET, BY VEHICLE TYPE, 2023–2030 (USD MILLION)
             10.5.4 JAPAN
                        10.5.4.1 COMPANY PROFILES
                                     TABLE 77 JAPAN: HYPERSONIC FLIGHT MARKET, BY INDUSTRY, 2019–2022 (USD MILLION)
                                     TABLE 78 JAPAN: HYPERSONIC FLIGHT MARKET, BY INDUSTRY, 2023–2030 (USD MILLION)
                                     TABLE 79 JAPAN: HYPERSONIC FLIGHT MARKET, BY VEHICLE TYPE, 2019–2022 (USD MILLION)
                                     TABLE 80 JAPAN: HYPERSONIC FLIGHT MARKET, BY VEHICLE TYPE, 2023–2030 (USD MILLION)
             10.5.5 REST OF ASIA PACIFIC
                        TABLE 81 REST OF ASIA PACIFIC: HYPERSONIC FLIGHT MARKET, BY INDUSTRY, 2019–2022 (USD MILLION)
                        TABLE 82 REST OF ASIA PACIFIC: HYPERSONIC FLIGHT MARKET, BY INDUSTRY, 2023–2030 (USD MILLION)
                        TABLE 83 REST OF ASIA PACIFIC: HYPERSONIC FLIGHT MARKET, BY VEHICLE TYPE, 2019–2022 (USD MILLION)
                        TABLE 84 REST OF ASIA PACIFIC: HYPERSONIC FLIGHT MARKET, BY VEHICLE TYPE, 2023–2030 (USD MILLION)
     10.6 REST OF THE WORLD 
             TABLE 85 REST OF THE WORLD: HYPERSONIC FLIGHT MARKET, BY INDUSTRY, 2019–2022 (USD MILLION)
             TABLE 86 REST OF THE WORLD: HYPERSONIC FLIGHT MARKET, BY INDUSTRY, 2023–2030 (USD MILLION)
             TABLE 87 REST OF THE WORLD: HYPERSONIC FLIGHT MARKET, BY VEHICLE TYPE, 2019–2022 (USD MILLION)
             TABLE 88 REST OF THE WORLD: HYPERSONIC FLIGHT MARKET, BY VEHICLE TYPE, 2023–2030 (USD MILLION)
             TABLE 89 REST OF THE WORLD: HYPERSONIC FLIGHT MARKET, BY COMPONENT, 2019–2022 (USD MILLION)
             TABLE 90 REST OF THE WORLD: HYPERSONIC FLIGHT MARKET, BY COMPONENT, 2023–2030 (USD MILLION)
             TABLE 91 REST OF THE WORLD: HYPERSONIC FLIGHT MARKET, BY REGION, 2019–2022 (USD MILLION)
             TABLE 92 REST OF THE WORLD: HYPERSONIC FLIGHT MARKET, BY REGION, 2023–2030 (USD MILLION)
             10.6.1 MIDDLE EAST & AFRICA
                        10.6.1.1 NORTHROP GRUMMAN CORPORATION: PRODUCTS/SOLUTIONS/SERVICES OFFERED
                                     TABLE 93 MIDDLE EAST & AFRICA: HYPERSONIC FLIGHT MARKET, BY INDUSTRY, 2019–2022 (USD MILLION)
                                     TABLE 94 MIDDLE EAST & AFRICA: HYPERSONIC FLIGHT MARKET, BY INDUSTRY, 2023–2030 (USD MILLION)
                                     TABLE 95 MIDDLE EAST & AFRICA: HYPERSONIC FLIGHT MARKET, BY VEHICLE TYPE, 2019–2022 (USD MILLION)
                                     TABLE 96 MIDDLE EAST & AFRICA: HYPERSONIC FLIGHT MARKET, BY VEHICLE TYPE, 2023–2030 (USD MILLION)
             10.6.2 LATIN AMERICA
                        10.6.2.1 LOCKHEED MARTIN CORPORATION: COMPANY OVERVIEW
                                     TABLE 97 LATIN AMERICA: HYPERSONIC FLIGHT MARKET, BY INDUSTRY, 2019–2022 (USD MILLION)
                                     TABLE 98 LATIN AMERICA: HYPERSONIC FLIGHT MARKET, BY INDUSTRY, 2023–2030 (USD MILLION)
                                     TABLE 99 LATIN AMERICA: HYPERSONIC FLIGHT MARKET, BY VEHICLE TYPE, 2019–2022 (USD MILLION)
                                     TABLE 100 LATIN AMERICA: HYPERSONIC FLIGHT MARKET, BY VEHICLE TYPE, 2023–2030 (USD MILLION)
 
11 COMPETITIVE LANDSCAPE (Page No. - 133)
     11.1 INTRODUCTION 
             TABLE 101 KEY DEVELOPMENTS IN HYPERSONIC FLIGHT MARKET, 2019–2022
     11.2 RANKING ANALYSIS, 2022 
             FIGURE 32 RANKING ANALYSIS, 2022
     11.3 COMPANY EVALUATION MATRIX 
             11.3.1 STARS
             11.3.2 EMERGING LEADERS
             11.3.3 PERVASIVE PLAYERS
             11.3.4 PARTICIPANTS
                        FIGURE 33 COMPANY EVALUATION MATRIX, 2022
             11.3.5 COMPANY FOOTPRINT
                        TABLE 102 COMPANY FOOTPRINT
                        TABLE 103 COMPANY FOOTPRINT, BY INDUSTRY
                        TABLE 104 COMPANY FOOTPRINT, BY COMPONENT
                        TABLE 105 COMPANY FOOTPRINT, BY REGION
     11.4 STARTUP/SME EVALUATION MATRIX 
             11.4.1 PROGRESSIVE COMPANIES
             11.4.2 RESPONSIVE COMPANIES
             11.4.3 DYNAMIC COMPANIES
             11.4.4 STARTING BLOCKS
                        FIGURE 34 STARTUP/SME EVALUATION MATRIX, 2022
             11.4.5 COMPETITIVE BENCHMARKING
                        TABLE 106 DETAILED LIST OF KEY STARTUPS/SMES
                        TABLE 107 COMPETITIVE BENCHMARKING OF KEY STARTUPS/SMES
     11.5 COMPETITIVE SCENARIO 
             11.5.1 DEALS
                        TABLE 108 HYPERSONIC FLIGHT MARKET: DEALS, JANUARY 2019–DECEMBER 2023
 
12 COMPANY PROFILES (Page No. - 149)
(Business overview, Products/Services/Solutions offered, Recent Developments, MNM view)*  
     12.1 KEY PLAYERS 
             12.1.1 LEIDOS
                        TABLE 109 LEIDOS: COMPANY OVERVIEW
                        FIGURE 35 LEIDOS: COMPANY SNAPSHOT
                        TABLE 110 LEIDOS: PRODUCTS/SOLUTIONS/SERVICES OFFERED
                        TABLE 111 LEIDOS: DEALS
             12.1.2 ROLLS-ROYCE
                        TABLE 112 ROLLS-ROYCE: COMPANY OVERVIEW
                        FIGURE 36 ROLLS-ROYCE: COMPANY SNAPSHOT
                        TABLE 113 ROLLS-ROYCE: PRODUCTS/SOLUTIONS/SERVICES OFFERED
                        TABLE 114 ROLLS-ROYCE: DEALS
             12.1.3 HERMEUS CORPORATION
                        TABLE 115 HERMEUS CORPORATION: COMPANY OVERVIEW
                        TABLE 116 HERMEUS CORPORATION: PRODUCTS/SOLUTIONS/SERVICES OFFERED
                        TABLE 117 HERMEUS CORPORATION: DEALS
             12.1.4 NORTHROP GRUMMAN CORPORATION
                        TABLE 118 NORTHROP GRUMMAN CORPORATION: COMPANY OVERVIEW
                        FIGURE 37 NORTHROP GRUMMAN CORPORATION: COMPANY SNAPSHOT
                        TABLE 119 NORTHROP GRUMMAN CORPORATION: PRODUCTS/SOLUTIONS/SERVICES OFFERED
             12.1.5 RAYTHEON TECHNOLOGIES CORPORATION
                        TABLE 120 RAYTHEON TECHNOLOGIES CORPORATION: COMPANY OVERVIEW
                        FIGURE 38 RAYTHEON TECHNOLOGIES CORPORATION: COMPANY SNAPSHOT
                        TABLE 121 RAYTHEON TECHNOLOGIES CORPORATION: PRODUCTS/SOLUTIONS/SERVICES OFFERED
             12.1.6 LOCKHEED MARTIN CORPORATION
                        TABLE 122 LOCKHEED MARTIN CORPORATION: COMPANY OVERVIEW
                        FIGURE 39 LOCKHEED MARTIN CORPORATION: COMPANY SNAPSHOT
                        TABLE 123 LOCKHEED MARTIN CORPORATION: PRODUCTS/SOLUTIONS/SERVICES OFFERED
             12.1.7 BAE SYSTEMS PLC
                        TABLE 124 BAE SYSTEMS PLC: COMPANY OVERVIEW
                        FIGURE 40 BAE SYSTEMS PLC: COMPANY SNAPSHOT
                        TABLE 125 BAE SYSTEMS PLC: PRODUCTS/SOLUTIONS/SERVICES OFFERED
                        TABLE 126 BAE SYSTEMS PLC: DEALS
             12.1.8 L3HARRIS TECHNOLOGIES, INC.
                        TABLE 127 L3HARRIS TECHNOLOGIES, INC.: COMPANY OVERVIEW
                        FIGURE 41 L3HARRIS TECHNOLOGIES, INC.: COMPANY SNAPSHOT
                        TABLE 128 L3HARRIS TECHNOLOGIES, INC.: PRODUCTS/SOLUTIONS/SERVICES OFFERED
             12.1.9 KRATOS DEFENSE & SECURITY SOLUTIONS, INC.
                        TABLE 129 KRATOS DEFENSE & SECURITY SOLUTIONS, INC.: COMPANY OVERVIEW
                        FIGURE 42 KRATOS DEFENSE & SECURITY SOLUTIONS, INC.: COMPANY SNAPSHOT
                        TABLE 130 KRATOS DEFENSE & SECURITY SOLUTIONS, INC.: PRODUCTS/SOLUTIONS/ SERVICES OFFERED
                        TABLE 131 KRATOS DEFENSE & SECURITY SOLUTIONS, INC.: DEALS
             12.1.10 THE BOEING COMPANY
                        TABLE 132 THE BOEING COMPANY: COMPANY OVERVIEW
                        FIGURE 43 THE BOEING COMPANY: COMPANY SNAPSHOT
                        TABLE 133 THE BOEING COMPANY: PRODUCTS/SOLUTIONS/SERVICES OFFERED
             12.1.11 SPACEX
                        TABLE 134 SPACEX: COMPANY OVERVIEW
                        TABLE 135 SPACEX: PRODUCTS/SOLUTIONS/SERVICES OFFERED
             12.1.12 ROCKET LAB USA
                        TABLE 136 ROCKET LAB USA: COMPANY OVERVIEW
                        TABLE 137 ROCKET LAB USA: PRODUCTS/SOLUTIONS/SERVICES OFFERED
                        TABLE 138 ROCKET LAB USA: DEALS
             12.1.13 DASSAULT AVIATION
                        TABLE 139 DASSAULT AVIATION: COMPANY OVERVIEW
                        TABLE 140 DASSAULT AVIATION: PRODUCTS/SOLUTIONS/SERVICES OFFERED
             12.1.14 DLR
                        TABLE 141 DLR: COMPANY OVERVIEW
                        TABLE 142 DLR: PRODUCTS/SOLUTIONS/SERVICES OFFERED
             12.1.15 BLUE ORIGIN
                        TABLE 143 BLUE ORIGIN: COMPANY OVERVIEW
                        TABLE 144 BLUE ORIGIN: PRODUCTS/SOLUTIONS/SERVICES OFFERED
                        TABLE 145 BLUE ORIGIN: DEALS
             12.1.16 GENERAL ELECTRIC GROUP
                        TABLE 146 GENERAL ELECTRIC GROUP: COMPANY OVERVIEW
                        FIGURE 44 GENERAL ELECTRIC GROUP: COMPANY SNAPSHOT
                        TABLE 147 GENERAL ELECTRIC GROUP: PRODUCTS/SOLUTIONS/SERVICES OFFERED
     12.2 OTHER PLAYERS 
             12.2.1 REACTION ENGINES
                        TABLE 148 REACTION ENGINES: COMPANY OVERVIEW
             12.2.2 STRATOLAUNCH
                        TABLE 149 STRATOLAUNCH: COMPANY OVERVIEW
             12.2.3 HYPERSONIX LAUNCH SYSTEMS
                        TABLE 150 HYPERSONIX LAUNCH SYSTEMS: COMPANY OVERVIEW
             12.2.4 HYPERSPACE PROPULSION
                        TABLE 151 HYPERSPACE PROPULSION: COMPANY OVERVIEW
             12.2.5 VENUS AEROSPACE
                        TABLE 152 VENUS AEROSPACE: COMPANY OVERVIEW
             12.2.6 DESTINUS
                        TABLE 153 DESTINUS: COMPANY OVERVIEW
             12.2.7 SIERRA NEVADA CORPORATION
                        TABLE 154 SIERRA NEVADA CORPORATION: COMPANY OVERVIEW
             12.2.8 CHINA AEROSPACE SCIENCE AND TECHNOLOGY CORPORATION
                        TABLE 155 CHINA AEROSPACE SCIENCE AND TECHNOLOGY CORPORATION: COMPANY OVERVIEW
             12.2.9 VELONTRA
                        TABLE 156 VELONTRA: COMPANY OVERVIEW
*Details on Business overview, Products/Services/Solutions offered, Recent Developments, MNM view might not be captured in case of unlisted companies.  
 
13 APPENDIX (Page No. - 188)
     13.1 DISCUSSION GUIDE 
     13.2 KNOWLEDGESTORE: MARKETSANDMARKETS’  SUBSCRIPTION PORTAL 
     13.3 CUSTOMIZATION OPTIONS 
     13.4 RELATED REPORTS 
     13.5 AUTHOR DETAILS 


The research study conducted on the hypersonic flight market involved extensive use of secondary sources, including directories, databases of articles, journals on hypersonic flight, company newsletters, and information portals such as Hoover’s, Bloomberg, and Factiva to identify and collect information useful for this extensive, technical, market-oriented study of the hypersonic flight market. Primary sources are several industry experts from the core and related industries, alliances, organizations, Original Equipment Manufacturers (OEMs), vendors, suppliers, and technology developers. These sources relate to all segments of the value chain of the hypersonic flight market.

In-depth interviews were conducted with various primary respondents, including key industry participants, subject-matter experts, C-level executives of key market players, and industry consultants, among others, to obtain and verify critical qualitative and quantitative information and to assess future prospects of the market.

Secondary Research

In the secondary research process, various secondary sources were referred to identify and collect information for this study on the hypersonic flight market. Secondary sources included annual reports, press releases, and investor presentations of companies; white papers and certified publications; articles from recognized authors; manufacturer's associations; directories; and databases. Secondary research was mainly used to obtain key information about the supply chain of the hypersonic flight industry, the monetary chain of the market, the total pool of key players, market classification and segmentation according to the industry trends to the bottom-most level, regional markets, and key developments from both market- and technology-oriented perspectives.

Primary Research

Extensive primary research was conducted to obtain qualitative and quantitative information for this report on the hypersonic flight market. Several primary interviews were conducted with the market experts from both demand- and supply-side across major regions, namely, North America, Europe, Asia Pacific, Middle East & Africa, and Latin America. Primary sources from the supply side included industry experts such as business development managers, sales heads, technology and innovation directors, and related key executives from various key companies and organizations operating in the hypersonic flight market.

Hypersonic Flight Market Size, and Share

To know about the assumptions considered for the study, download the pdf brochure

Market Size Estimation

Both the top-down and bottom-up approaches were used to estimate and validate the size of the hypersonic flight market. The following figure represents the overall market size estimation process employed for this study on the market.

The research methodology used to estimate the market size included the following details:

  • Secondary research identified key players in the hypersonic flight market, and their market share was determined through primary and secondary research. This included a study of annual and financial reports of top market players and extensive interviews of leaders such as Chief Executive Officers (CEOs), directors, and marketing executives of leading companies operating in the market.
  • All percentage shares, splits, and breakdowns were determined using secondary sources and verified through primary sources.
  • All possible parameters that affect the markets covered in this research study were accounted for, viewed in extensive detail, verified through primary research, and analyzed to obtain the final quantitative and qualitative data on the rocket and missile market.

This data was consolidated, enhanced with detailed inputs, analyzed by MarketsandMarkets, and presented in this report.

Bottom-Up Approach

The study analyzed the hypersonic flight programs of multiple countries to understand various schemes and funding allocations for hypersonic flight. After this, each program and its spending on procurement were tracked.

For Instance Hermeus (US) received an investment worth USD 60 million for development of hypersonic aircraft.

The above data was further refined by tracking various developments, such as contracts related to the upgradation of existing fleets, procurement of new platforms, and product development issued by the various defense departments. The data sources considered for the market estimation and forecasting include the US DoD budget hypersonic development and integration, defense program publications, defense insights and data by Stockholm International Peace Research Institute (SIPRI), defense expenditure of countries, and conflicts & geopolitical factors were considered.

Bottom-Up Approach

The bottom-up approach was employed to arrive at the overall size of the hypersonic flight market from the revenues of key players and their shares in the market. Calculations based on the revenues of key players identified in the market led to the overall market size. The bottom-up approach was also implemented for data extracted from secondary research to validate the market segment revenues obtained. The market shares were then estimated for each company to verify the revenue shares used earlier in the bottom-up approach. With the data triangulation procedure and validation of data through primaries, the overall parent market size and each individual market size were determined and confirmed in this study.

Market size estimation

The bottom-up approach, employed to determine the overall size of the hypersonic weapons market, is delineated below.

  • Step 1:
  • Identified top countries based on hypersonic flight program and budget spending.
  • Identified hypersonic flight investment for top countries.
  • Step 2:
  • Identified whether hypersonic flight considered in the scope is used or not for the top countries
  • Identified the use of hypersonic flight by various industries.
  • Step 3:
  • Selected the top countries based on their TRL  levels of hypersonic flight technology.
  • Countries were clubbed based on an overall rating synergy for correlation analysis.
  • Step 4
  • After calculating the market size for the selected top countries, the data was added to the matrix.
  • A relation of the derived market size was established with the program spending and development of the respective countries to arrive
  • Step 5
  • Validate the data with the supply-side analysis by identifying the product revenue during the last five years. For instance, in December 2022 the US Department of Defense awarded a contract worth USD 334 million to develop both hypersonic missile and hypersonic bomber aircraft.

Market Size Estimation Methodology: Bottom-Up Approach

Hypersonic Flight Market Size, and Bottom-Up Approach

Top-Down Approach

In the top-down approach, the overall size of the hypersonic flight market was used to estimate the size of individual markets (mentioned in the market segmentation) through percentage splits obtained from secondary and primary research.

The size of the most appropriate, immediate parent market was used to implement the top-down approach to calculate the sizes of specific market segments. The approach was also implemented to validate the revenues obtained for various market segments.

Market share was estimated for each company to verify the revenue share used earlier in the bottom-up approach. With the data triangulation procedure and data validation through primaries, this study determined and confirmed the overall size of the parent market and each market segment. The following figure shows the overall market size estimation process employed for this study.

Market Size Estimation Methodology: Top-Down Approach

Hypersonic Flight Market Size, and Top-Down Approach

Data Triangulation

After arriving at the overall size of the hypersonic flight market from the market size estimation process explained above, the total market was split into several segments and subsegments. The data triangulation and market breakdown procedures explained below were implemented, wherever applicable, to complete the overall market engineering process and arrive at the estimated sizes of different market segments and subsegments. The data was triangulated by studying various factors and trends from both the demand and supply sides. Additionally, the market size was validated using both the top-down and bottom-up approaches.

The following figure indicates the market breakdown structure and the data triangulation procedure implemented in the market engineering process used to develop this report.

Hypersonic Flight Market Size, and Data Triangulation

The figure above demonstrates the core data triangulation procedure used in this report for every market, submarket, and subsegment. The percentage splits of various market segments, including vehicle type, component, were used to determine the size of hypersonic flight market.

Market Definition

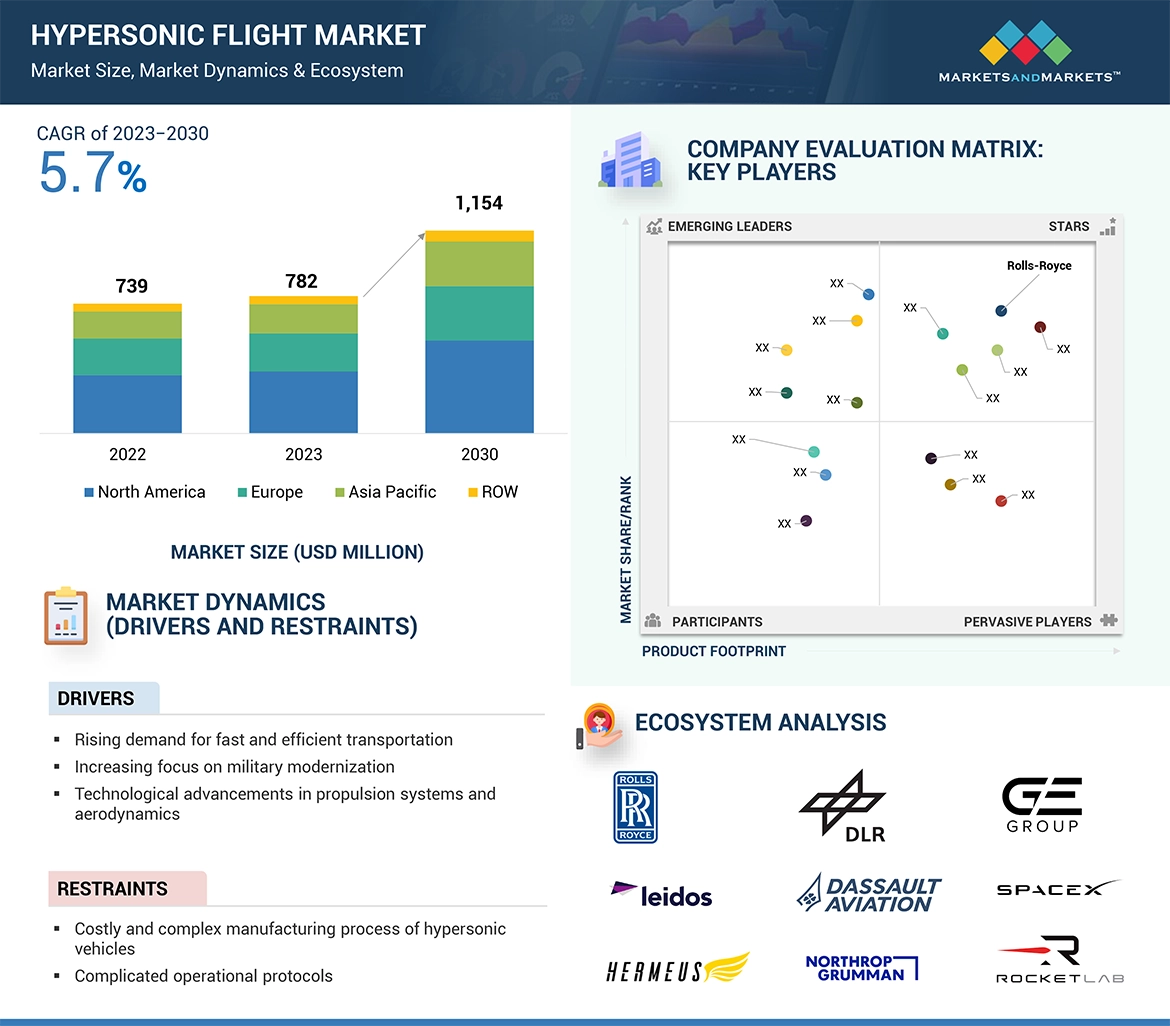
  • Hypersonic flight is an aerospace technology characterized by the rapid movement of objects, vehicles, or aircraft at extremely high speeds, typically exceeding Mach 5, or five times the speed of sound. At these velocities, hypersonic vehicles travel at least 3,836 miles per hour (6,174 kilometers per hour) or faster, making them significantly faster than supersonic and subsonic counterparts. The term "Mach" is used to denote the ratio of an object's speed to the speed of sound, with Mach 1 being the speed of sound in each medium.
  • Hypersonic flight is a field that encompasses both atmospheric and space environments. Hypersonic aircraft and spacecraft navigate through the Earth's atmosphere at these extraordinary speeds, encountering a unique set of challenges due to the extreme conditions they face. These challenges include intense aerodynamic heating, shockwaves, and the need for advanced materials to withstand the extreme temperatures and stresses.
  • The primary distinction between hypersonic flight and other forms of high-speed travel, such as supersonic flight (where speeds exceed Mach 1 but are generally less than Mach 3) or subsonic flight, lies in the velocity and the aerodynamic characteristics involved. Hypersonic vehicles often rely on advanced propulsion systems, like scramjets, which efficiently compress and ignite air to produce thrust at hypersonic speeds.

Key Stakeholders

  • Aerospace & Defense Companies
  • Space Industry Players
  • Research Institutions and Universities
  • Testing and Certification Organizations
  • Material and Technology Providers
  • Investors and Financial Institutions
  • Regulatory Bodies

Report Objectives

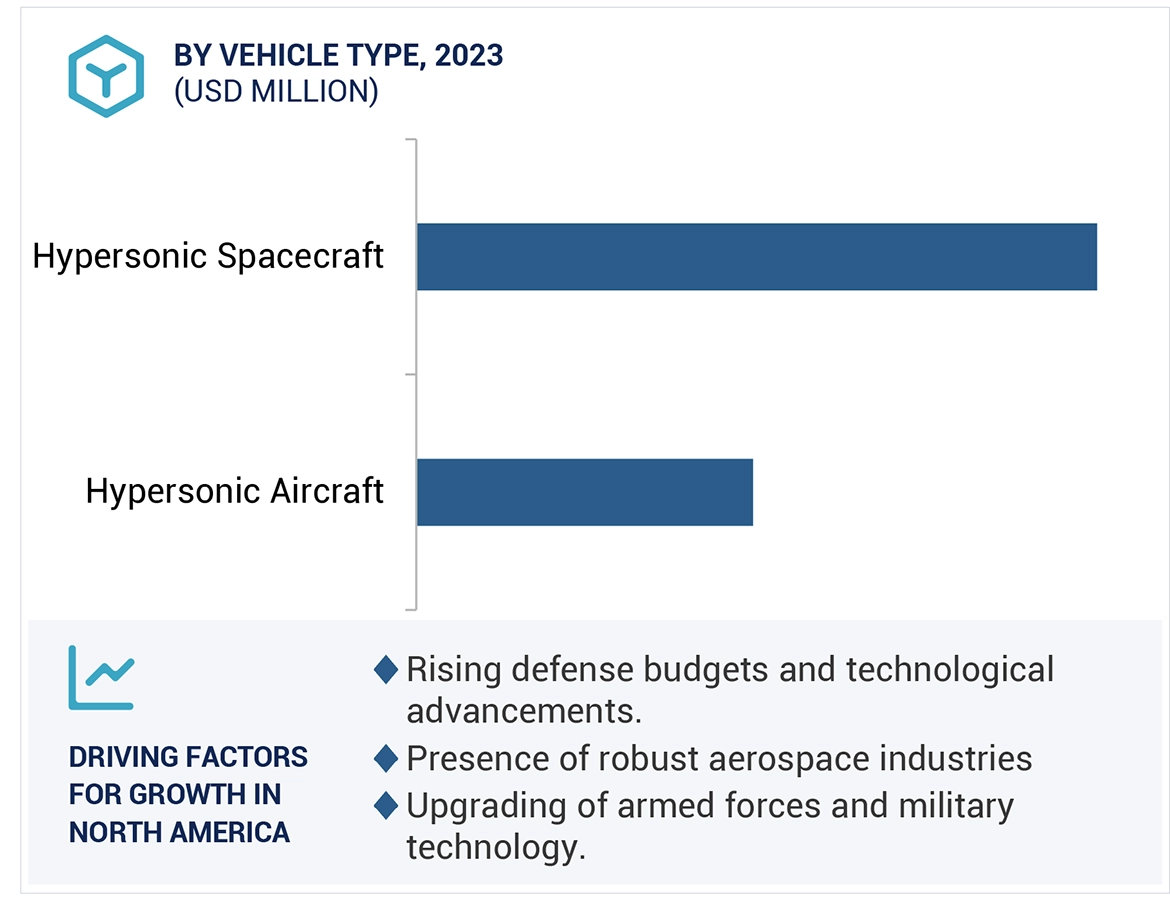
  • To define, describe, and forecast the size of the hypersonic flight market based on Industry, Vehicle type, component, and region from 2023 to 2030
  • To forecast the size of various segments of the market with respect to major regions, namely, North America, Europe, Asia Pacific and the rest of the world
  • To identify and analyze key drivers, restraints, opportunities, and challenges influencing the growth of the hypersonic flight market across the globe
  • To strategically analyze micromarkets1 with respect to individual growth trends, prospects, and their contribution to the hypersonic flight market
  • To analyze opportunities for stakeholders in the market by identifying key market trends
  • To analyze competitive developments such as contracts, acquisitions and expansions, agreements, joint ventures and partnerships, new product launches, and Research & Development (R&D) activities in the hypersonic flight market
  • To provide a detailed competitive landscape of the market, in addition to an analysis of business and corporate strategies adopted by leading market players

To strategically profile key market players and comprehensively analyze their core competencies2

1. Micro markets refer to further segments and subsegments of the hypersonic flight market included in the report.

2. Core competencies of the companies were captured in terms of their key developments and strategies adopted by them to sustain their position in the market.

Available customizations

Along with the market data, MarketsandMarkets offers customizations as per the specific needs of companies. The following customization options are available for the report:

Product Analysis

  • Product matrix, which gives a detailed comparison of the product portfolio of each company

Regional Analysis

  • Further breakdown of the market segments at the country level

Company Information

  • Detailed analysis and profiling of additional market players (up to 5)
Custom Market Research Services

We will customize the research for you, in case the report listed above does not meet with your exact requirements. Our custom research will comprehensively cover the business information you require to help you arrive at strategic and profitable business decisions.

Request Customization
Report Code
AS 8833
Published ON
Oct, 2023
Choose License Type
BUY NOW
  • SHARE
X
Request Customization
Speak to Analyst
Speak to Analyst
OR FACE-TO-FACE MEETING
PERSONALIZE THIS RESEARCH
  • Triangulate with your Own Data
  • Get Data as per your Format and Definition
  • Gain a Deeper Dive on a Specific Application, Geography, Customer or Competitor
  • Any level of Personalization
REQUEST A FREE CUSTOMIZATION
LET US HELP YOU!
  • What are the Known and Unknown Adjacencies Impacting the Hypersonic Flight Market
  • What will your New Revenue Sources be?
  • Who will be your Top Customer; what will make them switch?
  • Defend your Market Share or Win Competitors
  • Get a Scorecard for Target Partners
CUSTOMIZED WORKSHOP REQUEST
+1-888-600-6441
  • Call Us
  • +1-888-600-6441 (Corporate office hours)
  • +1-888-600-6441 (US/Can toll free)
  • +44-800-368-9399 (UK office hours)
CONNECT WITH US
ABOUT TRUST ONLINE
©2024 MarketsandMarkets Research Private Ltd. All rights reserved
DMCA.com Protection Status Website Feedback