In-Plant Logistics Market

In-Plant Logistics Market Size, Share, Statistics and Industry Growth Analysis Report by Product (Robots, ASRS, Conveyors & Sortation Systems, Cranes, AGVs, WMS, RTLS), Location (Receiving & Delivery Docks, Assembly/Production Lines, Storage Facilities, Packaging Workstations), Industry - Global Forecast to 2028

Report Code: SE 8879 Dec, 2023, by marketsandmarkets.com

[254 Pages Report] The In-Plant Logistics Market Size is estimated to be worth USD 12.3 Billion in 2023 and is projected to reach USD 19.5 Billion by 2028 at a CAGR of 9.7% during the forecast period.

The integration of cutting-edge technologies, including automation, robotics, and real-time tracking systems, is reshaping the landscape by providing unprecedented levels of precision and control in material flow. As businesses strive to stay competitive in a rapidly evolving market, the imperative for cost optimization and the need to navigate complexities in supply chain management are propelling the growth of the in-plant logistics market share, making it a pivotal component in the evolution of modern manufacturing and distribution operations.

In-Plant Logistics Market

In-Plant Logistics Market

In-Plant Logistics Market Forecast to 2028

To know about the assumptions considered for the study, Request for Free Sample Report

In-plant Logistics Market Trends

Driver: Rising demand for in-plant logistics solutions in various industries

The in-plant logistics market growth is experiencing a surge in demand across various industries, emerging as a pivotal driver for the sector's. The increasing reliance on efficient and streamlined supply chain processes within manufacturing plants is a key factor propelling the demand for in-plant logistics solutions. Industries such as automotive, electronics, pharmaceuticals, and consumer goods are recognizing the significance of optimizing their internal logistics to enhance productivity and reduce operational costs. As businesses strive for leaner and more agile operations, the demand for in-plant logistics solutions has intensified, fostering a dynamic market landscape. Moreover, the rising complexity of modern production processes and the need for real-time inventory management have further fueled the adoption of in-plant logistics solutions. Manufacturers are seeking advanced technologies and tailored logistics strategies to seamlessly integrate material handling, inventory control, and distribution within their facilities. This growing awareness of the operational benefits associated with in-plant logistics solutions is steering industries towards investing in these services. As a result, the market is witnessing a positive trajectory, driven by the compelling need for enhanced efficiency and precision in internal logistics operations across diverse industrial sectors.

Restraint: High cost related to deployment and maintenance of In-plant logistics system

The in-plant logistics market faces a significant restraint in the form of the high costs associated with the deployment and maintenance of sophisticated logistics systems. The initial investment required for implementing advanced technologies such as automation, robotics, and state-of-the-art warehouse management systems can be substantial. Companies often encounter challenges in allocating budgets for these upfront expenses, especially for small and medium-sized enterprises (SMEs), which may have more limited financial resources. The high deployment costs act as a deterrent for some businesses, hindering their ability to adopt modern in-plant logistics solutions and benefit from the operational efficiencies these technologies can offer. In addition to the initial deployment costs, the ongoing expenses related to system maintenance and upgrades contribute to the overall financial burden for organizations utilizing in-plant logistics solutions. As technology continues to evolve rapidly, companies may face the need for frequent updates and enhancements to remain competitive and keep pace with industry standards.

Opportunity: Integration of emerging technologies such as AI, Industry 4.0, and IoT with In-plant logistics system

The integration of emerging technologies, including Artificial Intelligence (AI), Industry 4.0, and the Internet of Things (IoT), presents a significant opportunity for the in-plant logistics market. These cutting-edge technologies offer the potential to revolutionize how internal logistics operations are managed and optimized within manufacturing facilities. AI enables predictive analytics and machine learning algorithms that can enhance demand forecasting, route optimization, and overall decision-making processes. By harnessing AI capabilities, in-plant logistics systems can become more adaptive and responsive, leading to improved efficiency and reduced operational costs. Industry 4.0, characterized by the digitization and interconnectivity of manufacturing processes, opens up new possibilities for in-plant logistics. The seamless integration of sensors and smart devices through IoT enables real-time monitoring and data-driven insights into the movement of goods within a facility.

Challenge: Production and revenue losses attributed to unwanted equipment downtime

The malfunction or breakdown of in-plant logistics systems can greatly affect companies' overall earnings. Such issues lead to delays in the entire production process, causing production losses and a decrease in plant performance. In industries with high capital investments, such as automotive, metals & heavy machinery, and food & beverages, downtimes can result in an average cost of USD 22,000 per minute for the company.. Unplanned downtime, whether due to equipment failures, logistical bottlenecks, or inefficiencies, can disrupt the entire production process, leading to delays, increased costs, and revenue loss. The repercussions of such interruptions extend beyond the immediate financial impact, affecting customer satisfaction, contractual obligations, and the overall competitiveness of businesses. In response to this challenge, in-plant logistics providers need to focus on implementing preventive maintenance strategies, adopting predictive analytics, and leveraging advanced technologies to minimize the risk of equipment failures and optimize the reliability of logistics systems. Addressing the issue of unwanted downtime is crucial for the in-plant logistics market to enhance its value proposition and ensure the seamless functioning of internal logistics operations within manufacturing facilities.

In-Plant Logistics Market Ecosystem

In-Plant Logistics Market by Ecosystem

In-plant Logistics Market: Key Trends

Daifuku Co., Ltd. (Japan), JBT (US), KION GROUP AG (Germany), KUKA AG (Germany), and Toyota Industries Corporation (Japan) are the top players in the in-plant logistics market. These in-plant logistics companies boast in-plant logistics trends with a comprehensive product portfolio and solid geographic footprint.

Robots to grow at the highest CAGR during 2023-2028.

The increasing demand for automation, coupled with advancements in robotic technologies, is driving industries to deploy robots for a myriad of in-plant logistics tasks. From automated guided vehicles (AGVs) facilitating the movement of materials to robotic arms handling intricate assembly processes, robots offer unprecedented levels of efficiency, precision, and adaptability. The evolution of collaborative robots, or cobots, that can work alongside human operators further contributes to the versatility of robotic solutions within manufacturing facilities. As industries increasingly prioritize lean and agile operations, the versatile applications of robots in optimizing material flow, minimizing errors, and improving overall productivity position them at the forefront of growth in the in-plant logistics market, marking a paradigm shift in the way industries approach internal logistics and production processes.

Semiconductor and electronics industries grow at the highest CAGR during the forecast period.

As the demand for semiconductor products and electronic components continues to surge globally, there is a heightened emphasis on optimizing internal logistics for efficient material handling, inventory management, and streamlined production workflows. The integration of advanced in-plant logistics solutions, including automated guided vehicles (AGVs), conveyor systems, and real-time tracking technologies, addresses the intricate requirements of these industries. Precision and speed are critical in semiconductor and electronics manufacturing, making advanced logistics technologies indispensable for minimizing lead times and ensuring the swift and accurate movement of sensitive components. As the Semiconductor and electronics industries evolve to meet the demands of a rapidly changing market, the adoption of innovative in-plant logistics solutions is expected to propel them to the forefront of growth in this dynamic market segment.

Asia Pacific is expected to grow at the highest CAGR in the in-plant logistics market during the forecast period.

Asia Pacific is a powerhouse in manufacturing and production. This has led to increased investments in advanced technologies and automation, aimed at improving operational efficiency. Across diverse industries such as automotive, electronics, and consumer goods, there is a proactive embrace of innovative in-plant logistics solutions. This is driven by the need to meet growing production demands and effectively navigate the complexities of modern supply chain management. The proactive adoption of cutting-edge logistics solutions solidifies its position as a significant contributor to the growth and evolution of the in-plant logistics market. As industries in the region continue to expand and prioritize productivity enhancement, Asia Pacific is poised to take the lead in driving innovation and shaping the trajectory of the in-plant logistics industry.

In-Plant Logistics Market by Region

In-Plant Logistics Market Statistics by Region

To know about the assumptions considered for the study, download the pdf brochure

Key Market Players

The major companies in the in-plant logistics companies include Daifuku Co., Ltd. (Japan), JBT (US), KION GROUP AG (Germany), KUKA AG (Germany), and Toyota Industries Corporation (Japan). These companies have used both organic and inorganic growth strategies such as product launches, acquisitions, and partnerships to strengthen their position in the in-plant logistics market.

In-Plant Logistics Market Report Scope

Report Metric

Details

Estimated Market Size in 2023

USD 12.3 Billion

Projected Market Size in 2028

USD 19.5 Billion

Growth Rate

CAGR of 9.7%

Market size available for years

2020—2028

Base year

2022

Forecast period

2023—2028

Forecast Units

USD Millions/USD Billions and Million Units

Segments Covered

Product, Location, and Industry

Geographic regions covered

North America, Asia Pacific, Europe, and Rest of the World

Companies covered

Daifuku Co., Ltd. (Japan), JBT (US), KION GROUP AG (Germany), KUKA AG (Germany), and Toyota Industries Corporation (Japan).

A total of 25 players are covered.

In-plant Logistics Market Highlights

In this report, the overall in-plant logistics market has been segmented based on product, location, industry and region.

Segment

Subsegment

By Product

  • Robots
  • ASRS
  • Conveyors & Sortation Systems
  • Cranes
  • AGVs
  • WMS
  • RTLS

By Location

  • Receiving and Delivery Docks
  • Assembly/Production Lines
  • Storage Facilities
  • Packaging Workstations

By Industry

  • Automotive
  • Metals & Heavy Machinery 
  • Food & Beverages
  • Healthcare
  • Semiconductor & Electronics
  • ;Aviation
  • Other Industries

By Region

  • North America
    • US
    • Canada
    • Mexico
  • Europe
    • Germany
    • UK
    • France
    • Rest of Europe
  • Asia Pacific
    • China
    • Japan
    • South Korea
    • Rest of Asia Pacific
  • Rest of the World
    • South America
    •  GCC
    •  Africa & Rest of Middle East
    • Africa

Recent Developments

  • In May 2023, the BEUMER GROUP acquired Hendrik Group Inc., one of the leading companies for air-supported belt conveyors. With this acquisition, BEUMER GROUP could expand its portfolio in the field of bulk material transport.
  • In March 2023, KUKA introduced an upgraded version of its KMP 600-S diffDrive, extending the company's range of mobile platforms. The KUKA KMP 600-S diffDrive mobile platform presents an advanced automated guided vehicle system, offering high-speed capabilities for production intralogistics. With a maximum payload capacity of 600 kg, it is perfectly suited for the demanding industrial production environment.
  • In September 2022, Toyota Material Handling Japan, a sector under Toyota Industries Corporation, introduced an autonomous lift truck equipped with AI-based technology. This technology enables the lift truck to autonomously identify the location and positioning of trucks and loads, generating automated travel routes for efficient loading operations.. This makes it possible to automate loading operations even in situations where the truck's stopping location and load position are not fixed, in addition to conventional fixed-position loading.

Frequently Asked Questions (FAQs):

To speak to our analyst for a discussion on the above findings, click Speak to Analyst

TABLE OF CONTENTS
 
1 INTRODUCTION (Page No. - 29)
    1.1 STUDY OBJECTIVES 
    1.2 MARKET DEFINITION 
    1.3 STUDY SCOPE 
           1.3.1 MARKETS COVERED
                    FIGURE 1 IN-PLANT LOGISTICS MARKET: SEGMENTATION
           1.3.2 REGIONAL SCOPE
           1.3.3 YEARS CONSIDERED
           1.3.4 INCLUSIONS AND EXCLUSIONS
    1.4 CURRENCY CONSIDERED 
    1.5 STAKEHOLDERS 
           1.5.1 RECESSION IMPACT
 
2 RESEARCH METHODOLOGY (Page No. - 33)
    2.1 RESEARCH DATA 
           FIGURE 2 IN-PLANT LOGISTICS MARKET: RESEARCH DESIGN
           2.1.1 SECONDARY DATA
                    2.1.1.1 List of major secondary sources
                    2.1.1.2 Key data from secondary sources
           2.1.2 PRIMARY DATA
                    2.1.2.1 Primary interviews with experts
                    2.1.2.2 Breakdown of primaries
                    2.1.2.3 Key data from primary sources
           2.1.3 SECONDARY AND PRIMARY RESEARCH
                    2.1.3.1 Key industry insights
    2.2 MARKET SIZE ESTIMATION 
           2.2.1 BOTTOM-UP APPROACH
                    2.2.1.1 Approach to derive market size using bottom-up analysis
                               FIGURE 3 MARKET SIZE ESTIMATION METHODOLOGY: BOTTOM-UP APPROACH
           2.2.2 TOP-DOWN APPROACH
                    2.2.2.1 Approach to derive market size using top-down analysis
                               FIGURE 4 MARKET SIZE ESTIMATION METHODOLOGY: TOP-DOWN APPROACH
                               FIGURE 5 MARKET SIZE ESTIMATION METHODOLOGY (SUPPLY SIDE): REVENUE GENERATED BY KEY PLAYERS FROM AGV BUSINESS
    2.3 MARKET BREAKDOWN AND DATA TRIANGULATION 
           FIGURE 6 MARKET BREAKDOWN AND DATA TRIANGULATION
    2.4 RESEARCH ASSUMPTIONS 
    2.5 PARAMETERS CONSIDERED TO ANALYZE IMPACT OF RECESSION ON IN-PLANT LOGISTICS MARKET 
    2.6 LIMITATIONS 
    2.7 RISK ASSESSMENT 
 
3 EXECUTIVE SUMMARY (Page No. - 45)
    FIGURE 7 IN-PLANT LOGISTICS MARKET, 2019−2028 (USD MILLION)
    FIGURE 8 CRANES SEGMENT ACCOUNTED FOR LARGEST MARKET SHARE IN 2022
    FIGURE 9 ASSEMBLY/PRODUCTION LINES SEGMENT TO ACCOUNT FOR LARGEST MARKET SIZE FROM 2023 TO 2028
    FIGURE 10 AUTOMOTIVE SEGMENT CAPTURED LARGEST MARKET SIZE IN 2022
    FIGURE 11 ASIA PACIFIC ACCOUNTED FOR LARGEST MARKET SHARE IN 2022
 
4 PREMIUM INSIGHTS (Page No. - 49)
    4.1 ATTRACTIVE OPPORTUNITIES FOR PLAYERS IN IN-PLANT LOGISTICS MARKET 
           FIGURE 12 GROWING DEMAND FOR AUTOMATION IN MANUFACTURING PLANTS TO DRIVE MARKET
    4.2 IN-PLANT LOGISTICS MARKET, BY LOCATION 
           FIGURE 13 ASSEMBLY/PRODUCTION LINES SEGMENT ACCOUNTED FOR LARGEST MARKET SIZE IN 2022
    4.3 IN-PLANT LOGISTICS MARKET, BY PRODUCT 
           FIGURE 14 CRANES SEGMENT TO ACCOUNT FOR LARGEST MARKET SIZE DURING FORECAST PERIOD
    4.4 IN-PLANT LOGISTICS MARKET, BY INDUSTRY 
           FIGURE 15 AUTOMOTIVE SEGMENT TO COMMAND LARGEST MARKET SHARE IN 2023
    4.5 IN-PLANT LOGISTICS MARKET, BY REGION 
           FIGURE 16 IN-PLANT LOGISTICS MARKET IN CHINA TO REGISTER HIGHEST CAGR FROM 2023 TO 2028
 
5 MARKET OVERVIEW (Page No. - 52)
    5.1 INTRODUCTION 
    5.2 MARKET DYNAMICS 
           FIGURE 17 IN-PLANT LOGISTICS MARKET: DRIVERS, RESTRAINTS, OPPORTUNITIES, AND CHALLENGES
           5.2.1 DRIVERS
                    5.2.1.1 Rising need for efficient supply chain processes in various industries
                    5.2.1.2 Strong focus on lean manufacturing and sustainability initiatives
                               FIGURE 18 ANALYSIS OF IMPACT OF DRIVERS ON IN-PLANT LOGISTICS MARKET
           5.2.2 RESTRAINTS
                    5.2.2.1 High costs related to deployment and maintenance of in-plant logistics systems
                    5.2.2.2 Need for technically sound experts to operate in-plant logistics solutions
                               FIGURE 19 ANALYSIS OF IMPACT OF RESTRAINTS ON IN-PLANT LOGISTICS MARKET
           5.2.3 OPPORTUNITIES
                    5.2.3.1 Integration of emerging technologies such as AI, Industry 4.0, and IoT with in-plant logistics systems
                    5.2.3.2 Substantial industrial growth in emerging economies
                               FIGURE 20 ANALYSIS OF IMPACT OF OPPORTUNITIES ON IN-PLANT LOGISTICS MARKET
           5.2.4 CHALLENGES
                    5.2.4.1 Risk of production and revenue losses due to unwanted equipment downtime
                    5.2.4.2 Technical challenges related to sensing elements
                               FIGURE 21 ANALYSIS OF IMPACT OF CHALLENGES ON IN-PLANT LOGISTICS MARKET
    5.3 TRENDS/DISRUPTIONS IMPACTING CUSTOMER BUSINESS 
           FIGURE 22 TRENDS/DISRUPTIONS IMPACTING CUSTOMER BUSINESS
    5.4 PRICING ANALYSIS 
           5.4.1 AVERAGE SELLING PRICE (ASP) OF AUTOMATED STORAGE AND RETRIEVAL SYSTEMS (ASRS) OFFERED BY KEY PLAYERS, BY TYPE
                    FIGURE 23 AVERAGE PROJECT COST OF DIFFERENT TYPES OF ASRS, BY COMPANY
                    TABLE 1 AVERAGE PROJECT COST OF DIFFERENT TYPES OF ASRS, BY COMPANY (USD)
           5.4.2 ASP OF COLLABORATIVE ROBOTS OFFERED BY KEY PLAYERS, BY PAYLOAD
                    FIGURE 24 ASP OF COLLABORATIVE ROBOTS OFFERED BY KEY PLAYERS, BY PAYLOAD
                    TABLE 2 ASP OF COLLABORATIVE ROBOTS OFFERED BY KEY PLAYERS, BY PAYLOAD
           5.4.3 AVERAGE SELLING PRICE TREND
                    TABLE 3 ASP OF AUTOMATED GUIDED VEHICLES (AGVS), BY TYPE
                    TABLE 4 ASP OF AGVS, BY REGION
                    FIGURE 25 AVERAGE SELLING PRICE OF AGVS, 2019−2028
                    TABLE 5 ASP OF SORTATION SYSTEMS, BY TYPE
                    TABLE 6 ASP OF CONVEYOR SYSTEMS, BY BELT WIDTH
                    TABLE 7 ASP OF CRANES, BY TYPE
                    TABLE 8 PRICING OF WAREHOUSE MANAGEMENT SYSTEMS
                    TABLE 9 ASP OF RTLS TAGS, BY TECHNOLOGY
    5.5 SUPPLY CHAIN ANALYSIS 
           FIGURE 26 IN-PLANT LOGISTICS MARKET: SUPPLY CHAIN ANALYSIS
    5.6 ECOSYSTEM/MARKET MAP 
           FIGURE 27 IN-PLANT LOGISTICS MARKET: ECOSYSTEM ANALYSIS
           TABLE 10 IN-PLANT LOGISTICS MARKET: ROLE OF KEY PLAYERS IN ECOSYSTEM
    5.7 TECHNOLOGY ANALYSIS 
           5.7.1 WEARABLE TECHNOLOGY
           5.7.2 PREDICTIVE ANALYTICS
           5.7.3 MACHINE LEARNING PLATFORMS
           5.7.4 DIGITAL TWIN MODEL BUILDER
           5.7.5 VOICE RECOGNITION TECHNOLOGY
           5.7.6 5G
           5.7.7 IOT
           5.7.8 INDUSTRY 4.0
           5.7.9 ROBOTIC PROCESS AUTOMATION
    5.8 PATENT ANALYSIS 
           FIGURE 28 TOP 10 COMPANIES WITH HIGHEST NUMBER OF PATENT APPLICATIONS IN LAST 10 YEARS
           TABLE 11 TOP 20 PATENT OWNERS IN US IN LAST 10 YEARS
           FIGURE 29 NUMBER OF PATENTS GRANTED PER YEAR FROM 2012 TO 2022
           TABLE 12 LIST OF PATENTS RELATED TO IN-PLANT LOGISTICS MARKET
    5.9 TRADE ANALYSIS 
           5.9.1 IMPORT SCENARIO
                    FIGURE 30 IMPORT DATA FOR HS CODE 8428, BY COUNTRY, 2018–2022 (USD MILLION)
           5.9.2 EXPORT SCENARIO
                    FIGURE 31 EXPORT DATA FOR HS CODE 8428, BY COUNTRY, 2018–2022 (USD MILLION)
    5.10 KEY CONFERENCES AND EVENTS, 2023–2025 
           TABLE 13 IN-PLANT LOGISTICS MARKET: CONFERENCES AND EVENTS
    5.11 CASE STUDY ANALYSIS 
           TABLE 14 DEMATIC PROVIDED REITAN DISTRIBUTION WITH HIGH-PERFORMANCE AUTOMATED SOLUTION FOR INCREASED DELIVERY FREQUENCY AND SERVICE LEVELS
           TABLE 15 TRANSBOTICS OFFERED CUSTOM-ENGINEERED AGVS TO FOOD AND BEVERAGE INDUSTRY CLIENT
           TABLE 16 VOLKSWAGEN AUTOEUROPA DEPLOYED RTLS TO MANAGE MOVING ASSETS
    5.12 REGULATORY LANDSCAPE 
           5.12.1 REGULATORY BODIES, GOVERNMENT AGENCIES, AND OTHER ORGANIZATIONS
                    TABLE 17 NORTH AMERICA: LIST OF REGULATORY BODIES, GOVERNMENT AGENCIES, AND OTHER ORGANIZATIONS
                    TABLE 18 EUROPE: LIST OF REGULATORY BODIES, GOVERNMENT AGENCIES, AND OTHER ORGANIZATIONS
                    TABLE 19 ASIA PACIFIC: LIST OF REGULATORY BODIES, GOVERNMENT AGENCIES, AND OTHER ORGANIZATIONS
                    TABLE 20 ROW: LIST OF REGULATORY BODIES, GOVERNMENT AGENCIES, AND OTHER ORGANIZATIONS
           5.12.2 STANDARDS AND REGULATIONS RELATED TO IN-PLANT LOGISTICS MARKET
           5.12.3 SAFETY STANDARDS FOR ASRS
                    TABLE 21 SAFETY STANDARDS FOR ASRS
           5.12.4 SAFETY STANDARDS FOR AGVS
                    TABLE 22 SAFETY STANDARDS FOR AGVS
    5.13 PORTER’S FIVE FORCES ANALYSIS 
           TABLE 23 IMPACT OF PORTER’S FIVE FORCES ON RTLS MARKET, 2022
           FIGURE 32 RTLS MARKET: PORTER’S FIVE FORCES ANALYSIS
           5.13.1 BARGAINING POWER OF SUPPLIERS
           5.13.2 BARGAINING POWER OF BUYERS
           5.13.3 INTENSITY OF COMPETITIVE RIVALRY
           5.13.4 THREAT OF NEW ENTRANTS
           5.13.5 THREAT OF SUBSTITUTES
    5.14 KEY STAKEHOLDERS AND BUYING CRITERIA 
           5.14.1 KEY STAKEHOLDERS IN BUYING PROCESS
                    FIGURE 33 INFLUENCE OF STAKEHOLDERS ON BUYING PROCESS FOR TOP THREE INDUSTRIES
                    TABLE 24 INFLUENCE OF STAKEHOLDERS ON BUYING PROCESS FOR TOP THREE INDUSTRIES
           5.14.2 BUYING CRITERIA
                    FIGURE 34 KEY BUYING CRITERIA FOR TOP THREE INDUSTRIES
                    TABLE 25 KEY BUYING CRITERIA FOR TOP THREE INDUSTRIES
 
6 SERVICES INVOLVED IN IN-PLANT LOGISTICS (Page No. - 86)
    6.1 INTRODUCTION 
    6.2 IN-PLANT WAREHOUSING 
    6.3 LINE-FEED FEEDING 
    6.4 PACKING 
    6.5 OTHER SERVICES 
 
7 IN-PLANT LOGISTICS MARKET, BY PRODUCT (Page No. - 88)
    7.1 INTRODUCTION 
           FIGURE 35 IN-PLANT LOGISTICS MARKET, BY PRODUCT
           FIGURE 36 CRANES SEGMENT TO HOLD LARGEST SHARE OF IN-PLANT LOGISTICS MARKET DURING FORECAST PERIOD
           TABLE 26 IN-PLANT LOGISTICS MARKET, BY PRODUCT, 2019–2022 (USD MILLION)
           TABLE 27 IN-PLANT LOGISTICS MARKET, BY PRODUCT, 2023–2028 (USD MILLION)
    7.2 ROBOTS 
           TABLE 28 ROBOTS: IN-PLANT LOGISTICS MARKET, BY INDUSTRY, 2019–2022 (USD MILLION)
           TABLE 29 ROBOTS: IN-PLANT LOGISTICS MARKET, BY INDUSTRY, 2023–2028 (USD MILLION)
           TABLE 30 ROBOTS: IN-PLANT LOGISTICS MARKET, BY REGION, 2019–2022 (USD MILLION)
           TABLE 31 ROBOTS: IN-PLANT LOGISTICS MARKET, BY REGION, 2023–2028 (USD MILLION)
           TABLE 32 ROBOTS: IN-PLANT LOGISTICS MARKET, BY TYPE, 2019–2022 (USD MILLION)
           TABLE 33 ROBOTS: IN-PLANT LOGISTICS MARKET, BY TYPE, 2023–2028 (USD MILLION)
           7.2.1 COLLABORATIVE ROBOTS
                    7.2.1.1 Ability to work alongside humans safely and efficiently to drive adoption of cobots in-plant logistics operations
           7.2.2 AUTONOMOUS MOBILE ROBOTS (AMRS)
                    7.2.2.1 Ability to navigate dynamically changing environments with minimum errors to propel adoption of autonomous mobile robots
                               TABLE 34 AMRS: IN-PLANT LOGISTICS MARKET, 2019–2022 (THOUSAND UNITS)
                               TABLE 35 AMRS: IN-PLANT LOGISTICS MARKET, 2023–2028 (THOUSAND UNITS)
    7.3 AUTOMATED STORAGE AND RETRIEVAL SYSTEM (ASRS) 
           TABLE 36 ASRS: IN-PLANT LOGISTICS MARKET, BY INDUSTRY, 2019–2022 (USD MILLION)
           TABLE 37 ASRS: IN-PLANT LOGISTICS MARKET, BY INDUSTRY, 2023–2028 (USD MILLION)
           TABLE 38 ASRS: IN-PLANT LOGISTICS MARKET, BY REGION, 2019–2022 (USD MILLION)
           TABLE 39 ASRS: IN-PLANT LOGISTICS MARKET, BY REGION, 2023–2028 (USD MILLION)
           FIGURE 37 UNIT LOAD SEGMENT TO ACCOUNT FOR LARGEST SHARE OF IN-PLANT LOGISTICS MARKET FOR ASRS DURING FORECAST PERIOD
           TABLE 40 ASRS: IN-PLANT LOGISTICS MARKET, BY TYPE, 2019–2022 (USD MILLION)
           TABLE 41 ASRS: IN-PLANT LOGISTICS MARKET, BY TYPE, 2023–2028 (USD MILLION)
           7.3.1 UNIT LOAD
                    7.3.1.1 Ability to store large quantities of goods in small spaces to drive segmental growth
           7.3.2 MINI LOAD
                    7.3.2.1 Ability to fit into space-constrained facilities to propel demand for mini-load ASRS
           7.3.3 VERTICAL LIFT MODULE (VLM)
                    7.3.3.1 Rising adoption of VLM ASRS in order picking, kitting, and inventory storage applications to drive segment
           7.3.4 CAROUSEL
                    7.3.4.1 Vertical carousel
                               7.3.4.1.1 Ability to optimize floor space to boost demand for vertical carousel ASRS
                    7.3.4.2 Horizontal carousel
                               7.3.4.2.1 Potential to ensure consistent and long-term operational safety to spur adoption of horizontal carousel ASRS
           7.3.5 MID LOAD
                    7.3.5.1 Low installation footprint to propel demand for mid-load ASRS in multiple applications
    7.4 CONVEYORS & SORTATION SYSTEMS 
           7.4.1 BELT CONVEYORS
                    7.4.1.1 Need to transport various items quickly over long distances to speed up adoption of belt conveyors
           7.4.2 ROLLER CONVEYORS
                    7.4.2.1 Easy integration with other material handling equipment to accelerate adoption of roller conveyors
           7.4.3 OVERHEAD CONVEYORS
                    7.4.3.1 Ability to optimize floor space in industrial settings to spur demand for overhead conveyors
           7.4.4 SCREW CONVEYORS
                    7.4.4.1 Rising demand from food & beverages and chemical industries to substantiate segmental growth
                               TABLE 42 CONVEYORS & SORTATION SYSTEMS: IN-PLANT LOGISTICS MARKET, BY INDUSTRY, 2019–2022 (USD MILLION)
                               TABLE 43 CONVEYORS & SORTATION SYSTEMS: IN-PLANT LOGISTICS MARKET, BY INDUSTRY, 2023–2028 (USD MILLION)
                               TABLE 44 CONVEYORS & SORTATION SYSTEMS: IN-PLANT LOGISTICS MARKET, BY REGION, 2019–2022 (USD MILLION)
                               TABLE 45 CONVEYORS & SORTATION SYSTEMS: IN-PLANT LOGISTICS MARKET, BY REGION, 2023–2028 (USD MILLION)
                               TABLE 46 CONVEYORS & SORTATION SYSTEMS: IN-PLANT LOGISTICS MARKET, BY TYPE, 2019–2022 (USD MILLION)
                               TABLE 47 CONVEYORS & SORTATION SYSTEMS: IN-PLANT LOGISTICS MARKET, BY TYPE, 2023–2028 (USD MILLION)
    7.5 CRANES 
           7.5.1 NEED TO REDUCE LOAD DAMAGE AND INJURIES IN VARIOUS INDUSTRIES TO FUEL DEMAND FOR CRANES
                    FIGURE 38 AUTOMOTIVE SEGMENT TO HOLD LARGEST SHARE OF IN-PLANT LOGISTICS MARKET FOR CRANES DURING FORECAST PERIOD
                    TABLE 48 CRANES: IN-PLANT LOGISTICS MARKET, BY INDUSTRY, 2019–2022 (USD MILLION)
                    TABLE 49 CRANES: IN-PLANT LOGISTICS MARKET, BY INDUSTRY, 2023–2028 (USD MILLION)
                    TABLE 50 CRANES: IN-PLANT LOGISTICS MARKET, BY REGION, 2019–2022 (USD MILLION)
                    TABLE 51 CRANES: IN-PLANT LOGISTICS MARKET, BY REGION, 2023–2028 (USD MILLION)
    7.6 AUTOMATED GUIDED VEHICLES (AGVS) 
           TABLE 52 AGVS: IN-PLANT LOGISTICS MARKET, 2019–2022 (THOUSAND UNITS)
           TABLE 53 AGVS: IN-PLANT LOGISTICS MARKET, 2023–2028 (THOUSAND UNITS)
           TABLE 54 AGVS: IN-PLANT LOGISTICS MARKET, BY INDUSTRY, 2019–2022 (USD MILLION)
           TABLE 55 AGVS: IN-PLANT LOGISTICS MARKET, BY INDUSTRY, 2023–2028 (USD MILLION)
           TABLE 56 AGVS: IN-PLANT LOGISTICS MARKET, BY REGION, 2019–2022 (USD MILLION)
           TABLE 57 AGVS: IN-PLANT LOGISTICS MARKET, BY REGION, 2023–2028 (USD MILLION)
           TABLE 58 AGVS: IN-PLANT LOGISTICS MARKET, BY TYPE, 2019–2022 (USD MILLION)
           TABLE 59 AGVS: IN-PLANT LOGISTICS MARKET, BY TYPE, 2023–2028 (USD MILLION)
           7.6.1 TOW VEHICLES
                    7.6.1.1 Heavy load-carrying capacity to boost uptake of tow vehicles
           7.6.2 UNIT LOAD CARRIERS
                    7.6.2.1 Suitability to handle large volumes of load to contribute to demand for unit load carriers
           7.6.3 PALLET TRUCKS
                    7.6.3.1 Rising focus on streamlining material handling to induce demand for pallet trucks
           7.6.4 ASSEMBLY LINE VEHICLES
                    7.6.4.1 Flexibility of parallel operations in manufacturing offered by assembly line vehicles to drive segment
           7.6.5 FORKLIFT TRUCKS
                    7.6.5.1 Increasing adoption of forklift trucks in floor-to-floor and floor-to-racking operations to drive segment
           7.6.6 OTHER TYPES
                    TABLE 60 LIST OF MAJOR AGV VENDORS
           7.6.7 AUTOMATIC GUIDED VEHICLES (AGV) MARKET, BY NAVIGATION TECHNOLOGY
                    TABLE 61 AGVS: IN-PLANT LOGISTICS MARKET, BY NAVIGATION TECHNOLOGY, 2019–2022 (USD MILLION)
                    TABLE 62 AGVS: IN-PLANT LOGISTICS MARKET, BY NAVIGATION TECHNOLOGY, 2023–2028 (USD MILLION)
                    7.6.7.1 Laser guidance
                               7.6.7.1.1 High level of positioning accuracy and obstacle-free navigation facilitated by laser-guided AGVs to drive market
                    7.6.7.2 Magnetic guidance
                               7.6.7.2.1 Ability to operate without interruptions and human intervention to drive demand for magnetic-guided AGVs
                    7.6.7.3 Inductive guidance
                               7.6.7.3.1 Suitability in harsh environments to accelerate demand for inductive guided systems
                    7.6.7.4 Optical tape guidance
                               7.6.7.4.1 Flexibility offered over other AGVs to contribute to segmental growth
                    7.6.7.5 Vision guidance
                               7.6.7.5.1 Reliability and maneuverability offered in dynamic environments to augment demand for vision-guided vehicles
                    7.6.7.6 Other navigation technologies
    7.7 WAREHOUSE MANAGEMENT SYSTEMS (WMS) 
           TABLE 63 WMS: IN-PLANT LOGISTICS MARKET, BY INDUSTRY, 2019–2022 (USD MILLION)
           TABLE 64 WMS: IN-PLANT LOGISTICS MARKET, BY INDUSTRY, 2023–2028 (USD MILLION)
           TABLE 65 WMS: IN-PLANT LOGISTICS MARKET, BY REGION, 2019–2022 (USD MILLION)
           TABLE 66 WMS: IN-PLANT LOGISTICS MARKET, BY REGION, 2023–2028 (USD MILLION)
           7.7.1 WAREHOUSE MANAGEMENT SYSTEMS (WMS) MARKET, BY DEPLOYMENT TYPE
                    7.7.1.1 On premises
                               7.7.1.1.1 Need for better control over data flow and sensitive information sharing to boost adoption of in-premises WMS
                    7.7.1.2 Cloud
                               7.7.1.2.1 Scalability, flexibility, and mobility offered by cloud-based WMS to drive market
                                            TABLE 67 WMS: IN-PLANT LOGISTICS MARKET, BY DEPLOYMENT TYPE, 2019–2022 (USD MILLION)
                                            TABLE 68 WMS: IN-PLANT LOGISTICS MARKET, BY DEPLOYMENT TYPE, 2023–2028 (USD MILLION)
    7.8 REAL-TIME LOCATION SYSTEMS (RTLS) 
           7.8.1 ABILITY TO PROVIDE REAL-TIME INFORMATION ON ASSET LOCATION TO FUEL DEMAND FOR RTLS IN IN-PLANT LOGISTICS OPERATIONS
                    TABLE 69 RTLS: IN-PLANT LOGISTICS MARKET, BY INDUSTRY, 2019–2022 (USD MILLION)
                    TABLE 70 RTLS: IN-PLANT LOGISTICS MARKET, BY INDUSTRY, 2023–2028 (USD MILLION)
                    TABLE 71 RTLS: IN-PLANT LOGISTICS MARKET, BY REGION, 2019–2022 (USD MILLION)
                    TABLE 72 RTLS: IN-PLANT LOGISTICS MARKET, BY REGION, 2023–2028 (USD MILLION)
 
8 IN-PLANT LOGISTICS MARKET, BY LOCATION (Page No. - 122)
    8.1 INTRODUCTION 
           FIGURE 39 ASSEMBLY/PRODUCTION LINES SEGMENT TO ACCOUNT FOR LARGEST MARKET SIZE IN 2023
           TABLE 73 IN-PLANT LOGISTICS MARKET, BY LOCATION, 2019–2022 (USD MILLION)
           TABLE 74 IN-PLANT LOGISTICS MARKET, BY LOCATION, 2023–2028 (USD MILLION)
    8.2 RECEIVING AND DELIVERY DOCKS 
           8.2.1 NEED FOR TIMELY MATERIAL MOVEMENT IN DOCKS TO BOOST DEPLOYMENT OF IN-PLANT LOGISTICS SOLUTIONS
    8.3 ASSEMBLY/PRODUCTION LINES 
           8.3.1 NEED TO ENSURE EFFICIENT FLOW OF MATERIALS AND COMPONENTS IN PRODUCTION LINES TO DRIVE MARKET
    8.4 STORAGE FACILITIES 
           8.4.1 NEED TO OPTIMIZE SPACE UTILIZATION IN STORAGE FACILITIES TO BOOST ADOPTION OF IN-PLANT LOGISTICS SOLUTIONS
    8.5 PACKAGING WORKSTATIONS 
           8.5.1 NEED TO OPTIMIZE EFFICIENCY AND REDUCE ERRORS TO BOOST ADOPTION OF IN-PLANT LOGISTICS SOLUTIONS
 
9 IN-PLANT LOGISTICS MARKET, BY INDUSTRY (Page No. - 127)
    9.1 INTRODUCTION 
           FIGURE 40 IN-PLANT LOGISTICS MARKET, BY INDUSTRY
           FIGURE 41 AUTOMOTIVE SEGMENT TO HOLD LARGEST MARKET SHARE FROM 2023 TO 2028
           TABLE 75 IN-PLANT LOGISTICS MARKET, BY INDUSTRY, 2019–2022 (USD MILLION)
           TABLE 76 IN-PLANT LOGISTICS MARKET, BY INDUSTRY, 2023–2028 (USD MILLION)
    9.2 AUTOMOTIVE 
           9.2.1 NEED TO MANAGE COMPLEX AND DYNAMIC AUTOMOTIVE SUPPLY CHAINS TO FUEL ADOPTION OF IN-PLANT LOGISTICS SOLUTIONS
                    TABLE 77 AUTOMOTIVE: IN-PLANT LOGISTICS MARKET, BY PRODUCT, 2019–2022 (USD MILLION)
                    TABLE 78 AUTOMOTIVE: IN-PLANT LOGISTICS MARKET, BY PRODUCT, 2023–2028 (USD MILLION)
    9.3 METALS & HEAVY MACHINERY 
           9.3.1 RISING FOCUS ON EASING WORKFLOW IN METALS & HEAVY MACHINERY INDUSTRIES TO DRIVE SEGMENT
                    FIGURE 42 RTLS SEGMENT TO REGISTER HIGHEST CAGR IN MARKET FOR METALS & HEAVY MACHINERY INDUSTRY DURING FORECAST PERIOD
                    TABLE 79 METALS & HEAVY MACHINERY: IN-PLANT LOGISTICS MARKET, BY PRODUCT, 2019–2022 (USD MILLION)
                    TABLE 80 METALS & HEAVY MACHINERY: IN-PLANT LOGISTICS MARKET, BY PRODUCT, 2023–2028 (USD MILLION)
    9.4 FOOD & BEVERAGES 
           9.4.1 INCREASING FOCUS ON TRACEABILITY AND COMPLIANCE IN FOOD & BEVERAGES INDUSTRY TO PROPEL MARKET
                    TABLE 81 FOOD & BEVERAGES: IN-PLANT LOGISTICS MARKET, BY PRODUCT, 2019–2022 (USD MILLION)
                    TABLE 82 FOOD & BEVERAGES: IN-PLANT LOGISTICS MARKET, BY PRODUCT, 2023–2028 (USD MILLION)
    9.5 HEALTHCARE 
           9.5.1 RISING EMPHASIS ON RISK AND CONTAMINATION REDUCTION TO SPUR ADOPTION OF IN-PLANT LOGISTICS SYSTEMS IN HEALTHCARE
                    FIGURE 43 CRANES SEGMENT TO ACCOUNT FOR LARGEST SIZE OF IN-PLANT LOGISTICS MARKET FOR HEALTHCARE INDUSTRY IN 2023
                    TABLE 83 HEALTHCARE: IN-PLANT LOGISTICS MARKET, BY PRODUCT, 2019–2022 (USD MILLION)
                    TABLE 84 HEALTHCARE: IN-PLANT LOGISTICS MARKET, BY PRODUCT, 2023–2028 (USD MILLION)
    9.6 SEMICONDUCTOR & ELECTRONICS 
           9.6.1 GROWING NEED FOR ACCURACY IN SEMICONDUCTOR AND ELECTRONICS MANUFACTURING TO PROPEL MARKET
                    TABLE 85 SEMICONDUCTOR & ELECTRONICS: IN-PLANT LOGISTICS MARKET, BY PRODUCT, 2019–2022 (USD MILLION)
                    TABLE 86 SEMICONDUCTOR & ELECTRONICS: IN-PLANT LOGISTICS MARKET, BY PRODUCT, 2023–2028 (USD MILLION)
    9.7 AVIATION 
           9.7.1 GROWING REQUIREMENT FOR SYSTEMATIC MANUFACTURING AND ASSEMBLY OPERATIONS IN AVIATION INDUSTRY TO DRIVE MARKET
                    FIGURE 44 CRANES TO ACCOUNT FOR LARGEST SIZE OF IN-PLANT LOGISTICS MARKET FOR AVIATION INDUSTRY FROM 2023 TO 2028
                    TABLE 87 AVIATION: IN-PLANT LOGISTICS MARKET, BY PRODUCT, 2019–2022 (USD MILLION)
                    TABLE 88 AVIATION: IN-PLANT LOGISTICS MARKET, BY PRODUCT, 2023–2028 (USD MILLION)
    9.8 OTHER INDUSTRIES 
           TABLE 89 OTHER INDUSTRIES: IN-PLANT LOGISTICS MARKET, BY PRODUCT, 2019–2022 (USD MILLION)
           TABLE 90 OTHER INDUSTRIES: IN-PLANT LOGISTICS MARKET, BY PRODUCT, 2023–2028 (USD MILLION)
 
10 IN-PLANT LOGISTICS MARKET, BY REGION (Page No. - 141)
     10.1 INTRODUCTION 
             FIGURE 45 CHINA TO REGISTER HIGHEST CAGR IN IN-PLANT LOGISTICS MARKET FROM 2023 TO 2028
             TABLE 91 IN-PLANT LOGISTICS MARKET, BY REGION, 2019–2022 (USD MILLION)
             TABLE 92 IN-PLANT LOGISTICS MARKET, BY REGION, 2023–2028 (USD MILLION)
     10.2 NORTH AMERICA 
             10.2.1 NORTH AMERICA: RECESSION IMPACT
                        FIGURE 46 NORTH AMERICA: IN-PLANT LOGISTICS MARKET SNAPSHOT
                        TABLE 93 NORTH AMERICA: IN-PLANT LOGISTICS MARKET, BY PRODUCT, 2019–2022 (USD MILLION)
                        TABLE 94 NORTH AMERICA: IN-PLANT LOGISTICS MARKET, BY PRODUCT, 2023–2028 (USD MILLION)
                        TABLE 95 NORTH AMERICA: IN-PLANT LOGISTICS MARKET, BY INDUSTRY, 2019–2022 (USD MILLION)
                        TABLE 96 NORTH AMERICA: IN-PLANT LOGISTICS MARKET, BY INDUSTRY, 2023–2028 (USD MILLION)
                        TABLE 97 NORTH AMERICA: IN-PLANT LOGISTICS MARKET, BY COUNTRY, 2019–2022 (USD MILLION)
                        TABLE 98 NORTH AMERICA: IN-PLANT LOGISTICS MARKET, BY COUNTRY, 2023–2028 (USD MILLION)
             10.2.2 US
                        10.2.2.1 Presence of robust manufacturing sector to boost market growth
             10.2.3 CANADA
                        10.2.3.1 Expanding automotive industry to contribute to market growth
             10.2.4 MEXICO
                        10.2.4.1 Rapid industrial development to foster market growth
     10.3 EUROPE 
             10.3.1 EUROPE: RECESSION IMPACT
                        FIGURE 47 EUROPE: IN-PLANT LOGISTICS MARKET SNAPSHOT
                        TABLE 99 EUROPE: IN-PLANT LOGISTICS MARKET, BY PRODUCT, 2019–2022 (USD MILLION)
                        TABLE 100 EUROPE: IN-PLANT LOGISTICS MARKET, BY PRODUCT, 2023–2028 (USD MILLION)
                        TABLE 101 EUROPE: IN-PLANT LOGISTICS MARKET, BY INDUSTRY, 2019–2022 (USD MILLION)
                        TABLE 102 EUROPE: IN-PLANT LOGISTICS MARKET, BY INDUSTRY, 2023–2028 (USD MILLION)
                        TABLE 103 EUROPE: IN-PLANT LOGISTICS MARKET, BY COUNTRY, 2019–2022 (USD MILLION)
                        TABLE 104 EUROPE: IN-PLANT LOGISTICS MARKET, BY COUNTRY, 2023–2028 (USD MILLION)
             10.3.2 GERMANY
                        10.3.2.1 Presence of strong industrial base to create conducive environment for market growth
             10.3.3 UK
                        10.3.3.1 Increasing investments in automation and robotics to propel market
             10.3.4 FRANCE
                        10.3.4.1 Rising emphasis on sustainability in manufacturing to boost adoption of in-plant logistics solutions
             10.3.5 REST OF EUROPE
     10.4 ASIA PACIFIC 
             10.4.1 ASIA PACIFIC: RECESSION IMPACT
                        FIGURE 48 ASIA PACIFIC: IN-PLANT LOGISTICS MARKET SNAPSHOT
                        TABLE 105 ASIA PACIFIC: IN-PLANT LOGISTICS MARKET, BY PRODUCT, 2019–2022 (USD MILLION)
                        TABLE 106 ASIA PACIFIC: IN-PLANT LOGISTICS MARKET, BY PRODUCT, 2023–2028 (USD MILLION)
                        TABLE 107 ASIA PACIFIC: IN-PLANT LOGISTICS MARKET, BY INDUSTRY, 2019–2022 (USD MILLION)
                        TABLE 108 ASIA PACIFIC: IN-PLANT LOGISTICS MARKET, BY INDUSTRY, 2023–2028 (USD MILLION)
                        TABLE 109 ASIA PACIFIC: IN-PLANT LOGISTICS MARKET, BY COUNTRY, 2019–2022 (USD MILLION)
                        TABLE 110 ASIA PACIFIC: IN-PLANT LOGISTICS MARKET, BY COUNTRY, 2023–2028 (USD MILLION)
             10.4.2 CHINA
                        10.4.2.1 Expanding automotive, electronics, and manufacturing verticals to create opportunities for in-plant logistics solution providers
             10.4.3 JAPAN
                        10.4.3.1 Thriving manufacturing sector to boost market growth
             10.4.4 SOUTH KOREA
                        10.4.4.1 Focus on increasing share of robotics and automation in manufacturing and warehousing facilities to drive market
             10.4.5 REST OF ASIA PACIFIC
     10.5 REST OF THE WORLD (ROW) 
             10.5.1 ROW: RECESSION IMPACT
                        TABLE 111 ROW: IN-PLANT LOGISTICS MARKET, BY PRODUCT, 2019–2022 (USD MILLION)
                        TABLE 112 ROW: IN-PLANT LOGISTICS MARKET, BY PRODUCT, 2023–2028 (USD MILLION)
                        TABLE 113 ROW: IN-PLANT LOGISTICS MARKET, BY INDUSTRY, 2019–2022 (USD MILLION)
                        TABLE 114 ROW: IN-PLANT LOGISTICS MARKET, BY INDUSTRY, 2023–2028 (USD MILLION)
                        TABLE 115 ROW: IN-PLANT LOGISTICS MARKET, BY REGION, 2019–2022 (USD MILLION)
                        TABLE 116 ROW: IN-PLANT LOGISTICS MARKET, BY REGION, 2023–2028 (USD MILLION)
             10.5.2 SOUTH AMERICA
                        10.5.2.1 Rising adoption of advanced technologies and sustainability practices to boost market growth
             10.5.3 GCC
                        10.5.3.1 Booming manufacturing industries to create opportunities for market players
             10.5.4 AFRICA & REST OF MIDDLE EAST
                        10.5.4.1 Inflow of investments from major global economies to boost market growth
 
11 COMPETITIVE LANDSCAPE (Page No. - 162)
     11.1 OVERVIEW 
     11.2 STRATEGIES ADOPTED BY KEY PLAYERS 
             TABLE 117 OVERVIEW OF STRATEGIES ADOPTED BY IN-PLANT LOGISTICS VENDORS
     11.3 REVENUE ANALYSIS OF TOP COMPANIES 
             FIGURE 49 FIVE-YEAR REVENUE ANALYSIS OF TOP FIVE PLAYERS IN AGV MARKET
             FIGURE 50 FIVE-YEAR REVENUE ANALYSIS OF TOP PLAYERS IN ASRS MARKET
     11.4 MARKET SHARE ANALYSIS 
             TABLE 118 AGV MARKET: DEGREE OF COMPETITION, 2022
             FIGURE 51 AGV MARKET: INDUSTRY CONCENTRATION
             TABLE 119 ASRS MARKET: DEGREE OF COMPETITION, 2022
             FIGURE 52 ASRS MARKET: INDUSTRY CONCENTRATION
     11.5 COMPANY EVALUATION MATRIX 
             11.5.1 STARS
             11.5.2 EMERGING LEADERS
             11.5.3 PERVASIVE PLAYERS
             11.5.4 PARTICIPANTS
                        FIGURE 53 AGV MARKET (GLOBAL): COMPANY EVALUATION MATRIX, 2022
                        FIGURE 54 ASRS MARKET (GLOBAL): COMPANY EVALUATION MATRIX, 2022
             11.5.5 COMPANY FOOTPRINT
                        TABLE 120 COMPANY FOOTPRINT
                        TABLE 121 PRODUCT: COMPANY FOOTPRINT
                        TABLE 122 INDUSTRY: COMPANY FOOTPRINT
                        TABLE 123 REGION: COMPANY FOOTPRINT
     11.6 START-UP/SME EVALUATION MATRIX 
             11.6.1 PROGRESSIVE COMPANIES
             11.6.2 RESPONSIVE COMPANIES
             11.6.3 DYNAMIC COMPANIES
             11.6.4 STARTING BLOCKS
                        FIGURE 55 AGV MARKET (GLOBAL): START-UP/SME EVALUATION MATRIX, 2022
                        FIGURE 56 ASRS MARKET (GLOBAL): START-UP/SME EVALUATION MATRIX, 2022
             11.6.5 COMPETITIVE BENCHMARKING
                        TABLE 124 IN-PLANT LOGISTICS MARKET: LIST OF KEY START-UPS/SMES
                        TABLE 125 IN-PLANT LOGISTICS MARKET: COMPETITIVE BENCHMARKING OF KEY START-UPS/SMES
     11.7 COMPETITIVE SCENARIOS AND TRENDS 
             TABLE 126 IN-PLANT LOGISTICS MARKET: PRODUCT LAUNCHES, 2021−2022
             TABLE 127 IN-PLANT LOGISTICS MARKET: DEALS, 2020−2022
             TABLE 128 IN-PLANT LOGISTICS MARKET: OTHERS, 2022
 
12 COMPANY PROFILES (Page No. - 186)
     12.1 KEY PLAYERS 
(Business Overview, Products/Solutions/Services Offered, Recent Developments, MnM view (Key strengths/Right to win, Strategic choices made, Weakness/competitive threats)*  
             12.1.1 DAIFUKU CO., LTD.
                        TABLE 129 DAIFUKU CO., LTD.: COMPANY OVERVIEW
                        FIGURE 57 DAIFUKU CO., LTD.: COMPANY SNAPSHOT
                        TABLE 130 DAIFUKU CO., LTD.: PRODUCTS OFFERED
                        TABLE 131 DAIFUKU CO., LTD.: DEALS
                        TABLE 132 DAIFUKU CO., LTD.: OTHERS
             12.1.2 JBT
                        TABLE 133 JBT: COMPANY OVERVIEW
                        FIGURE 58 JBT: COMPANY SNAPSHOT
                        TABLE 134 JBT: PRODUCTS OFFERED
                        TABLE 135 JBT: PRODUCT LAUNCHES
             12.1.3 KION GROUP AG
                        TABLE 136 KION GROUP AG: COMPANY OVERVIEW
                        FIGURE 59 KION GROUP AG: COMPANY SNAPSHOT
                        TABLE 137 KION GROUP AG: PRODUCTS OFFERED
                        TABLE 138 KION GROUP AG: PRODUCT LAUNCHES
                        TABLE 139 KION GROUP AG: DEALS
                        TABLE 140 KION GROUP AG: OTHERS
             12.1.4 KUKA AG
                        TABLE 141 KUKA AG: COMPANY OVERVIEW
                        FIGURE 60 KUKA AG: COMPANY SNAPSHOT
                        TABLE 142 KUKA AG: PRODUCTS OFFERED
                        TABLE 143 KUKA: PRODUCT LAUNCHES
                        TABLE 144 KUKA AG: DEALS
                        TABLE 145 KUKA AG: OTHERS
             12.1.5 TOYOTA INDUSTRIES CORPORATION
                        TABLE 146 TOYOTA INDUSTRIES CORPORATION: COMPANY OVERVIEW
                        FIGURE 61 TOYOTA INDUSTRIES CORPORATION: COMPANY SNAPSHOT
                        TABLE 147 TOYOTA INDUSTRIES CORPORATION: PRODUCTS OFFERED
                        TABLE 148 TOYOTA INDUSTRIES CORPORATION: PRODUCT LAUNCHES
                        TABLE 149 TOYOTA INDUSTRIES CORPORATION: DEALS
                        TABLE 150 TOYOTA INDUSTRIES CORPORATION: OTHERS
             12.1.6 HYSTER-YALE MATERIALS HANDLING, INC.
                        TABLE 151 HYSTER-YALE MATERIALS HANDLING, INC.: COMPANY OVERVIEW
                        FIGURE 62 HYSTER-YALE MATERIALS HANDLING, INC.: COMPANY SNAPSHOT
                        TABLE 152 HYSTER-YALE MATERIALS HANDLING, INC.: PRODUCTS OFFERED
                        TABLE 153 HYSTER-YALE MATERIALS HANDLING, INC.: PRODUCT LAUNCHES
                        TABLE 154 HYSTER-YALE MATERIALS HANDLING, INC.: OTHERS
             12.1.7 SSI SCHAEFER
                        TABLE 155 SSI SCHAEFER: COMPANY OVERVIEW
                        TABLE 156 SSI SCHAEFER: PRODUCTS OFFERED
                        TABLE 157 SSI SCHAEFER: OTHERS
             12.1.8 BEUMER GROUP
                        TABLE 158 BEUMER GROUP: COMPANY OVERVIEW
                        TABLE 159 BEUMER GROUP: PRODUCTS OFFERED
                        TABLE 160 BEUMER GROUP: PRODUCT LAUNCHES
                        TABLE 161 BEUMER GROUP: DEALS
                        TABLE 162 BEUMER GROUP: OTHERS
             12.1.9 HONEYWELL INTERNATIONAL INC.
                        TABLE 163 HONEYWELL INTERNATIONAL INC.: COMPANY OVERVIEW
                        FIGURE 63 HONEYWELL INTERNATIONAL INC.: COMPANY SNAPSHOT
                        TABLE 164 HONEYWELL INTERNATIONAL: PRODUCTS OFFERED
                        TABLE 165 HONEYWELL INTERNATIONAL INC.: PRODUCT LAUNCHES
             12.1.10 MURATA MACHINERY, LTD.
                        TABLE 166 MURATA MACHINERY, LTD.: COMPANY OVERVIEW
                        TABLE 167 MURATA MACHINERY, LTD.: PRODUCTS OFFERED
                        TABLE 168 MURATA MACHINERY, LTD.: DEALS
                        TABLE 169 MURATA MACHINERY, LTD.: OTHERS
     12.2 OTHER PLAYERS 
             12.2.1 ADDVERB TECHNOLOGIES LIMITED
                        TABLE 170 ADDVERB TECHNOLOGIES LIMITED: COMPANY OVERVIEW
             12.2.2 AUTOMATION LOGISTICS CORPORATION
                        TABLE 171 AUTOMATION LOGISTICS CORPORATION: COMPANY OVERVIEW
             12.2.3 AUTOCRIB
                        TABLE 172 AUTOCRIB: COMPANY OVERVIEW
             12.2.4 AVANCON SA
                        TABLE 173 AVANCON SA: COMPANY OVERVIEW
             12.2.5 FERRETTO GROUP S.P.A.
                        TABLE 174 FERRETTO GROUP S.P.A.: COMPANY OVERVIEW
             12.2.6 GRABIT
                        TABLE 175 GRABIT: COMPANY OVERVIEW
             12.2.7 HÄNEL GMBH & CO. KG
                        TABLE 176 HÄNEL GMBH & CO. KG: COMPANY OVERVIEW
             12.2.8 INVATA INTRALOGISTICS
                        TABLE 177 INVATA INTRALOGISTICS: COMPANY OVERVIEW
             12.2.9 MIAS
                        TABLE 178 MIAS: COMPANY OVERVIEW
             12.2.10 INVIA ROBOTICS, INC.
                        TABLE 179 INVIA ROBOTICS, INC.: COMPANY OVERVIEW
             12.2.11 SENCORPWHITE, INC
                        TABLE 180 SENCORPWHITE, INC: COMPANY OVERVIEW
             12.2.12 VIASTORE SYSTEMS GMBH
                        TABLE 181 VIASTORE SYSTEMS GMBH: COMPANY OVERVIEW
             12.2.13 VIDMAR
                        TABLE 182 VIDMAR: COMPANY OVERVIEW
             12.2.14 WESTFALIA TECHNOLOGIES, INC.
                        TABLE 183 WESTFALIA TECHNOLOGIES, INC.: COMPANY OVERVIEW
             12.2.15 WITRON LOGISTIK + INFORMATIK GMBH
                        TABLE 184 WITRON LOGISTIK + INFORMATIK GMBH: COMPANY OVERVIEW
*Details on Business Overview, Products/Solutions/Services Offered, Recent Developments, MnM view (Key strengths/Right to win, Strategic choices made, Weakness/competitive threats)* might not be captured in case of unlisted companies.  
 
13 ADJACENT MARKET (Page No. - 240)
     13.1 RFID MARKET 
     13.2 INTRODUCTION 
             FIGURE 64 RFID MARKET, BY OFFERING
             TABLE 185 RFID MARKET, BY OFFERING, 2019–2022 (USD MILLION)
             FIGURE 65 TAGS SEGMENT TO ACCOUNT FOR LARGEST SHARE OF RFID MARKET IN 2023
             TABLE 186 RFID MARKET, BY OFFERING, 2023–2032 (USD MILLION)
     13.3 TAGS 
             13.3.1 RISING USE OF TAGS TO IDENTIFY, TRACK, AND LOCATE ASSETS IN REAL TIME TO FUEL MARKET GROWTH
     13.4 READERS 
             13.4.1 GROWING ADOPTION OF RFID READERS IN LOGISTICS AND SUPPLY CHAIN APPLICATIONS TO FOSTER MARKET GROWTH
             13.4.2 FIXED READERS
             13.4.3 HANDHELD READERS
     13.5 SOFTWARE AND SERVICES 
             13.5.1 INCREASING ADOPTION OF CLOUD-BASED DATA STORAGE SOLUTIONS TO DRIVE MARKET
 
14 APPENDIX (Page No. - 247)
     14.1 INSIGHTS FROM INDUSTRY EXPERTS 
     14.2 DISCUSSION GUIDE 
     14.3 KNOWLEDGESTORE: MARKETSANDMARKETS’ SUBSCRIPTION PORTAL 
     14.4 CUSTOMIZATION OPTIONS 
     14.5 RELATED REPORTS 
     14.6 AUTHOR DETAILS 
 

The study involves four major activities that estimate the size of the in-plant logistics market. Exhaustive secondary research was conducted to collect information related to the market. Following this was validating these findings, assumptions, and sizing with the industry experts across the value chain through primary research. Both top-down and bottom-up approaches were employed to estimate the overall size of the in-plant logistics market. Subsequently, market breakdown and data triangulation procedures were used to determine the extent of different segments and subsegments of the market.

Secondary Research

Secondary sources in this research study include corporate filings (such as annual reports, investor presentations, and financial statements); trade, business, and professional associations; white papers, certified publications, articles from recognized authors; directories; and databases. The secondary data were collected and analyzed to estimate the overall market size, further validated by primary research.

Primary Research

In the primary research process, numerous sources from both the supply and demand sides were interviewed to obtain qualitative and quantitative information about this report. The primary sources from the supply side included various industry experts such as Chief X Officers (CXOs), Vice Presidents (VPs), and Directors from business development, marketing, product development/innovation teams, and related key executives from in-plant logistics providers, such as Daifuku Co., Ltd. (Japan), JBT (US), KION GROUP AG (Germany), KUKA AG (Germany), and Toyota Industries Corporation (Japan); research organizations, distributors, professional and managed service providers, industry associations, and key opinion leaders. Approximately 25% of the primary interviews were conducted with the demand side and 75% with the supply side. These data were collected mainly through questionnaires, emails, and telephonic interviews, accounting for 80% of the primary interviews.

In-Plant Logistics Market Size, and Share

To know about the assumptions considered for the study, download the pdf brochure

Market Size Estimation

In the market engineering process, both top-down and bottom-up approaches were implemented, along with several data triangulation methods, to estimate and validate the size of the market and other dependent submarkets listed in this report.

  • The key players in the industry and markets were identified through extensive secondary research.
  • Both the supply chain of the industry and the market size, in terms of value, were determined through primary and secondary research.
  • All percentage shares, splits, and breakdowns were determined using secondary sources and verified through primary sources.
  • Market Size Estimation Methodology-Bottom-up Approach and Top-down Approach

In-Plant Logistics Market Size, and Bottom-up Approach

In-Plant Logistics Market Size, and Top-Down Approach

Data Triangulation

After estimating the overall market size, the total market was split into several segments. The market breakdown and data triangulation procedures were employed wherever applicable to complete the overall market engineering process and gauge exact statistics for all segments. The data were triangulated by studying various factors and trends from both the demand and supply sides. The market was also validated using both top-down and bottom-up approaches.

Market Definition

In-plant logistics refers to the management and coordination of material flow, storage, and distribution within a manufacturing or production facility. It involves optimizing the movement of raw materials, components, and finished products within the confines of the plant, aiming to enhance efficiency and reduce operational costs. This specialized branch of logistics focuses on streamlining processes such as inventory management, order fulfillment, and transportation within the facility to ensure a smooth and timely production cycle. In-plant logistics plays a crucial role in minimizing lead times, preventing bottlenecks, and maximizing the utilization of resources within the manufacturing environment.

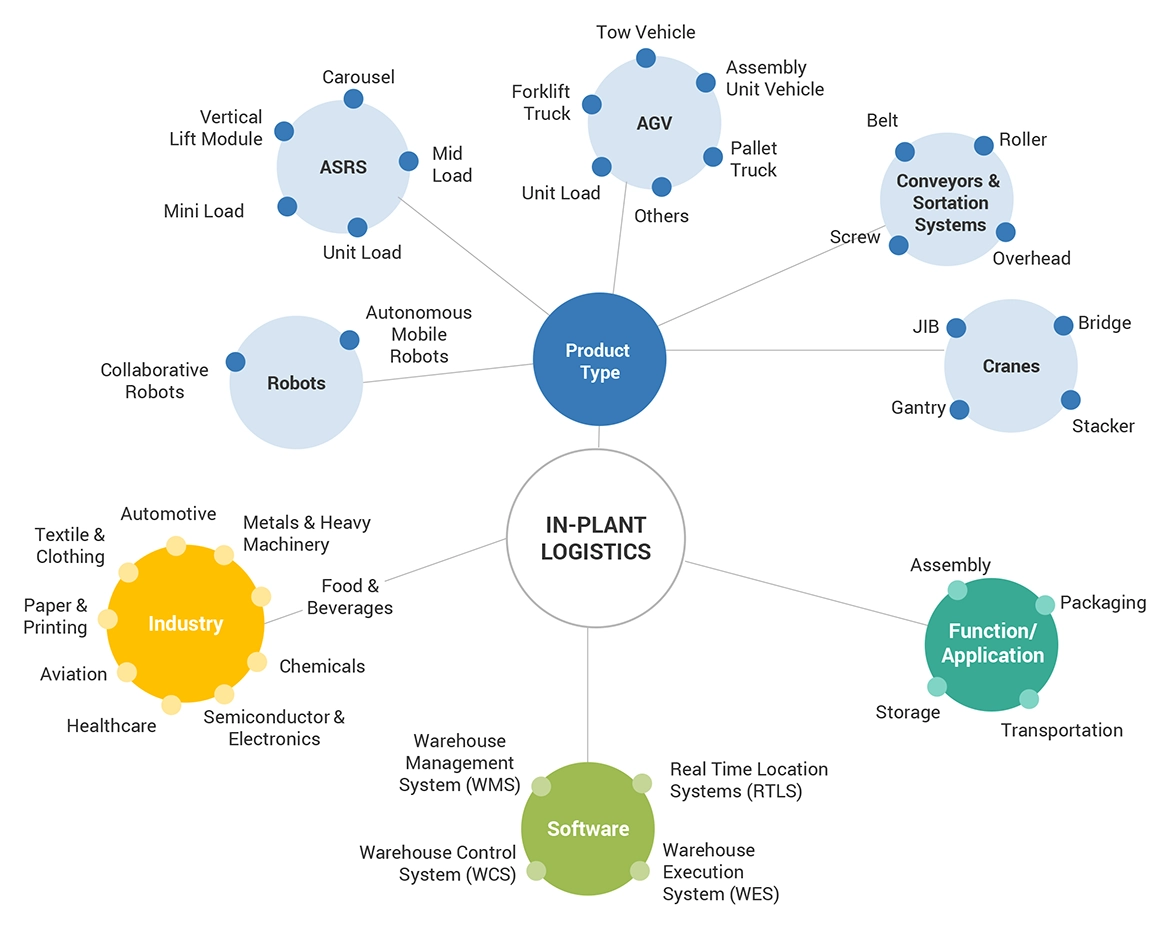
The key objectives of in-plant logistics include minimizing idle time for both labor and equipment, optimizing storage space, and ensuring that the right materials are available at the right place and time for the production process. This involves the use of advanced technologies, such as warehouse management systems (WMS) and automated guided vehicles (AGVs), to facilitate efficient material handling and tracking. By focusing on the internal movements of goods within a facility, in-plant logistics contributes to overall supply chain effectiveness, enhancing the competitiveness of the manufacturing operation in terms of cost, speed, and responsiveness to market demands. We are considering only the products used for logistics activities related to manufacturing plant plants for production and storage.

Stakeholders

  • Integrators of material handling systems
  • Warehousing companies
  • Government bodies, venture capitalists, and private equity firms
  • Original device manufacturers (ODMs)
  • Original equipment manufacturers (OEMs)
  • Manufacturers of automated material handling equipment
  • Research organizations, forums, alliances, and associations
  • Software and service providers

The main objectives of this study are as follows:

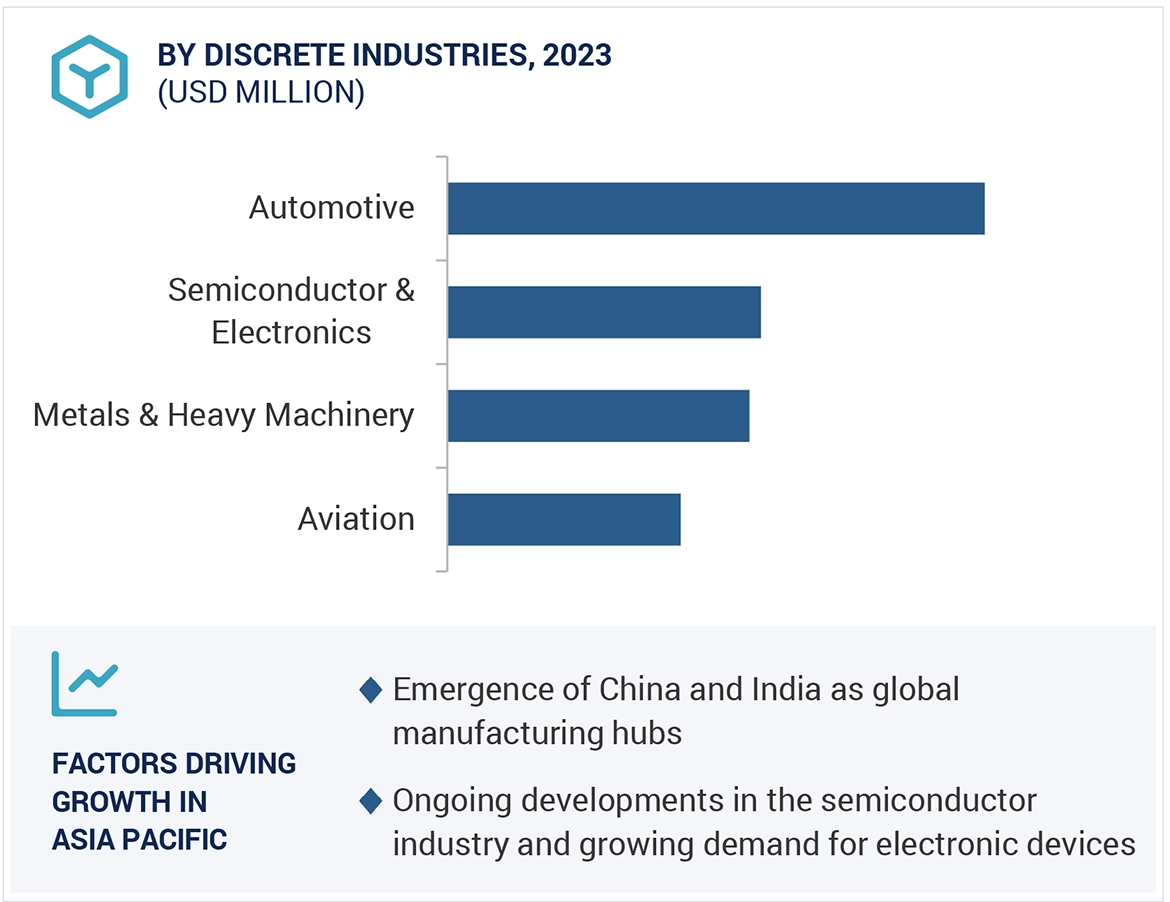
  • To describe and forecast the in-plant logistics market, by product, location, and industry, in terms of value
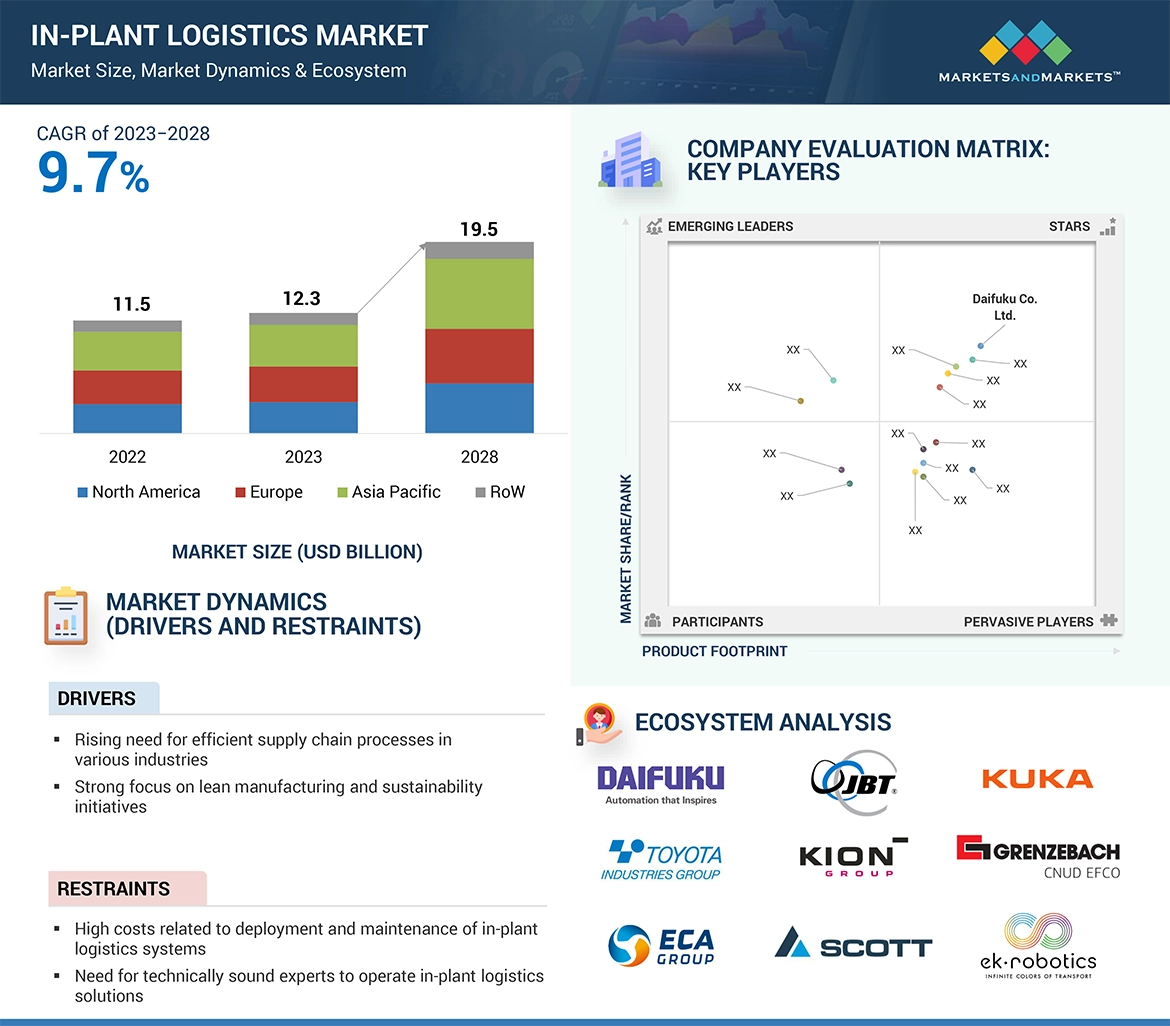
  • To forecast the market size, in terms of value, for four main regions, namely, North America, Europe, Asia Pacific, and Rest of the World (RoW)
  • To provide information on the services involved in in-plant logistics system
  • To provide detailed information regarding the drivers, restraints, opportunities, and challenges influencing the growth of the market
  • To analyze the probable impact of the recession on the market in the future
  • To provide a comprehensive overview of the value chain of the in-plant logistics ecosystem
  • To analyze competitive developments, such as product launches, acquisitions, collaborations, agreements, and partnerships, in the in-plant logistics market
  • To strategically analyze micromarkets1 with respect to individual growth trends, prospects, and contributions to the total market
  • To strategically profile key players and comprehensively analyze their market positions in terms of ranking and core competencies2, and provide a detailed competitive landscape of the market

Available Customizations:

With the given market data, MarketsandMarkets offers customizations according to the specific requirements of companies. The following customization options are available for the report:

Country-wise Information:

  • Analysis for additional countries (up to five)

Company Information:

  • Detailed analysis and profiling of different market players (up to five)
Custom Market Research Services

We will customize the research for you, in case the report listed above does not meet with your exact requirements. Our custom research will comprehensively cover the business information you require to help you arrive at strategic and profitable business decisions.

Request Customization
Report Code
SE 8879
Published ON
Dec, 2023
Choose License Type
BUY NOW
  • SHARE
X
Request Customization
Speak to Analyst
Speak to Analyst
OR FACE-TO-FACE MEETING
PERSONALIZE THIS RESEARCH
  • Triangulate with your Own Data
  • Get Data as per your Format and Definition
  • Gain a Deeper Dive on a Specific Application, Geography, Customer or Competitor
  • Any level of Personalization
REQUEST A FREE CUSTOMIZATION
LET US HELP YOU!
  • What are the Known and Unknown Adjacencies Impacting the In-Plant Logistics Market
  • What will your New Revenue Sources be?
  • Who will be your Top Customer; what will make them switch?
  • Defend your Market Share or Win Competitors
  • Get a Scorecard for Target Partners
CUSTOMIZED WORKSHOP REQUEST
+1-888-600-6441
  • Call Us
  • +1-888-600-6441 (Corporate office hours)
  • +1-888-600-6441 (US/Can toll free)
  • +44-800-368-9399 (UK office hours)
CONNECT WITH US
ABOUT TRUST ONLINE
©2024 MarketsandMarkets Research Private Ltd. All rights reserved
DMCA.com Protection Status Website Feedback