LEO Terminals Market

LEO Terminals Market by Vertical (Commercial, Government & Defense), Platform (Fixed, Portable, Mobile), Frequency (C-Band, L&S-Band, X-Band, Ka-Band, Ku-Band, VHF/UHF-Band, EHF/SHF-Band, Multi-Band,Q- Band) and Region - Global Forecast to 2028

Report Code: AS 8859 Nov, 2023, by marketsandmarkets.com

[256 Pages Report] Projections indicate that the LEO Terminals Market is poised for significant growth, with an estimated increase from USD 6.0 billion in 2023 to USD 17.7 billion by 2028, demonstrating a noteworthy compound annual growth rate (CAGR) of 23.9% during this period.

The LEO (Low Earth Orbit) terminals market is an evolving sector within the broader satellite communication industry. LEO satellites operate in orbits closer to the Earth compared to traditional geostationary satellites, enabling lower latency and higher data transfer rates for communication.

In terms of market segmentation, LEO terminals are categorized by vertical, by frequency and by platform, platform further divided into fixed, portable and mobile.

The market report segments the LEO terminals  industry across five key regions: North America, Europe, Asia Pacific, the Middle East & Africa, and Latin America, with a focus on their key countries.

In 2023, North America is expected to hold the largest share of the LEO terminals  market.

The emergence of Low Earth Orbit (LEO) terminals has revolutionized connectivity solutions, rapidly replacing traditional satellite communication methods in various sectors. These terminals offer unparalleled advantages, including swift and reliable internet access in remote regions, enhanced global connectivity, and increased bandwidth for data transmission.

The widespread adoption of LEO terminals across multiple industries stems from their unique capabilities. They enable extended and uninterrupted connectivity, catering to diverse needs such as residential internet access, enterprise-level communications, emergency services, and IoT applications. Their ability to facilitate high-speed data transfer and communication has positioned them as crucial components in bridging the digital divide.

LEO Terminals Market

LEO Terminals Market

LEO Terminals Market Forecast to 2028

To know about the assumptions considered for the study, Request for Free Sample Report

LEO terminals Market Dynamics:

Drivers : Increasing demand for cost-effective, high-speed connectivity

Connectivity plays a crucial role in today’s digital age. Individuals, businesses, and governments rely on robust communications networks to transmit data, access services, and interact in real time. However, traditional communication infrastructure often fails to meet the increasing demand for cost-effective, high-speed connectivity. To address this challenge, LEO satellites offer a groundbreaking solution. Their proximity to Earth ensures reduced signal travel time, resulting in significantly lower latency than geostationary satellites. This low latency, combined with high data transmission speeds, makes LEO satellites suitable for applications requiring real-time interactions, such as video streaming, online gaming, and remote telemedicine. Additionally, the low cost of LEO terminals makes them economically viable for expanding access to high-quality communications services across diverse regions, including underserved and remote areas.

Restraints: Availability of other broadband technologies

LEO terminals face stiff competition from other broadband technologies, particularly fiber optic cables and 5G networks. The maturity and widespread adoption of fiber optic cables, as well as the rapid growth of 5G networks, give them an advantage over LEO terminal networks, which are still in their early stages of development. Furthermore, fiber optic cables and 5G networks offer comparable performance and affordability to LEO terminals. Fiber optic cables have the highest bandwidth and the lowest latency among broadband technologies, while 5G networks are rapidly catching up in various areas. Additionally, as fiber optic and 5G services become more widely accepted, the associated costs are decreasing.

Opportunity: Growing demand for connectivity from developing countries

The market for LEO terminals holds immense potential, especially in developing countries where the demand for internet connectivity is increasing rapidly. Traditional satellite solutions are often expensive for these countries due to their limited resources, making these terminals a more affordable and viable solution for global coverage. By offering cost-effective connectivity solutions, LEO terminals play a crucial role in driving socioeconomic progress in developing countries. These terminals can unlock a wide range of applications, such as education, healthcare, agriculture, and e-commerce, that can help stimulate economic growth. For example, in education, LEO terminals can provide high-quality educational resources to students in remote areas, while in healthcare, they enable remote medical consultations and telemedicine services, bringing essential healthcare to underserved regions. In agriculture, these terminals can provide farmers with information on weather conditions, crop prices, and market trends, enhancing their productivity and profitability.

Challenges: Threat of data interception, unauthorized access, and cyberattacks

Securing data transmitted through LEO satellites poses a significant challenge due to the susceptibility of LEO terminals to various security threats, including data interception, unauthorized access, and cyberattacks. To address these risks, robust protective measures are essential. Data interception is a significant concern, given the long-distance transmission through LEO satellites, which makes data vulnerable to malicious interception. To combat this, LEO terminals must utilize strong encryption protocols to scramble data in a way that only authorized individuals can decipher it.

Unauthorized access is another issue that can be prevented by incorporating secure authentication mechanisms that identify users and devices before allowing access to data or services. Cyberattacks, including malware and denial-of-service attacks, are potential threats to LEO terminals. Preventing such attacks requires multiple security measures, such as firewalls, intrusion detection systems, and timely security patches. These precautions help strengthen the security and privacy of data transmitted over LEO satellites.

Based on Vertical , The Government & defence segment is expected to witness the highest growth during the forecast period enabling secure and real-time communications between military command centers and field units.

 Based on Vertical, Low Earth Orbit (LEO) terminals are of utmost importance in government and defense sectors. They provide crucial communication and connectivity solutions. Governments and defense organizations heavily rely on LEO terminals for various critical applications. These include secure and real-time communication between military command centers and field units, collecting and analyzing intelligence data for informed decision-making, and ensuring smooth communication on the battlefield. LEO terminals are also vital in remote deployments and emergency response situations, offering reliable connectivity in challenging environments.

Based on Platform,Mobile LEO terminals segment is projected to record the highest  market share growth

Mobile terminals are expected to witness substantial growth, driven by factors such as the expanding availability of LEO satellite networks offering high-speed broadband connectivity, the rising demand for mobile satellite services in remote and underserved regions, and the ongoing development of innovative mobile satellite terminal technologies. This segment comprises handheld terminals for individual users, vehicle terminals primarily for transportation and monitoring, and fixed terminals for stable broadband access. Among these, handheld terminals are expected to experience the most significant growth due to heightened demand from individual users, particularly in remote areas. Vehicle terminals will also see substantial growth, primarily in the transportation and logistics sectors, while fixed terminals, though essential, are anticipated to grow at a comparatively slower rate due to cost considerations. The market is being shaped by the proliferation of LEO satellite networks, the increasing need for reliable mobile satellite services in remote areas, and advancements in mobile terminal technology, all of which present significant growth opportunities in the years ahead.

North America is expected to hold the highest market share in 2023.

North America, which includes the US and Canada, is set to be a big player in the market for LEO terminals. This is because it's a hub for the satellite industry, with major companies investing in LEO satellite networks. The region's demand for fast internet is growing, especially in rural areas. LEO terminals are seen as a cost-effective solution to provide reliable internet in these areas.

LEO Terminals Market by Region

LEO Terminals Market by Region

To know about the assumptions considered for the study, download the pdf brochure

Key Market Players

The LEO terminals companies is dominated by a few globally established players such as SpaceX (US), EchoStar Corporation (US), L3Harris Technologies, Inc. (US), Thales (France), Raytheon Technologies (US), and Kymeta Corporation (US) among others, are the key manufacturers that secured LEO terminals.

Get online access to the report on the World's First Market Intelligence Cloud

  • Easy to Download Historical Data & Forecast Numbers
  • Company Analysis Dashboard for high growth potential opportunities
  • Research Analyst Access for customization & queries
  • Competitor Analysis with Interactive dashboard
  • Latest News, Updates & Trend analysis
Request Sample

Scope of the Report

Report Metric

Details

Market size available for years

2020-2028

Base year considered

2022

Forecast period

2023-2028

Forecast units

Value (USD)

Segments covered

By platform, vertical, and frequency.


Geographies covered

North America, Europe, Asia Pacific, the Middle East & Africa, and Latin America

Companies covered

SpaceX (US), Kymeta Corporation (US), L3harris Technologies, Inc. (US), EchoStar Corporation (US), and Thales (France), among others.

LEO Terminals Market Highlights

This research report categorizes the LEO terminals markets based on platform, vertical, and frequency

Segment

Subsegment

By Platform

  • Fixed
  • Platform             
  • Mobile

By Vertical

  • Commercial
  • Government & defence

By Frequency

  • C-band
  • L- & S-band
  • X-band
  • Ka-band
  • Ku-band
  • VHF/UHF-band
  • EHF/SHF-band
  • Q-band
  • Multi-band

By Region

  • North America
  •  Europe
  • Asia Pacific
  • Middle East & Africa
  • Latin America

Recent Developments

  • In August 2023, Hughes Network Systems, an EchoStar company, has secured a five-year Indefinite Delivery Indefinite Quantity (IDIQ) contract with the US Space Force. This contract allows the US Department of Defense, federal agencies, and international coalition partners to access Hughes’ fully managed, low-latency LEO satellite-based services.
  • In July 2023 , L3Harris Technologies is set to finalize its USD 4.7 billion acquisition of Aerojet Rocketdyne following clearance from the US Federal Trade Commission. The purchase, aimed at bolstering L3Harris’s presence in the defense contracting sector, had faced scrutiny from some lawmakers concerned about competition and innovation.
  • In June 2023, The US government is paying SpaceX’s Starlink satellite unit to offer equipment and services to Ukrainian soldiers. The terminals will most likely be purchased through the Ukraine Security Assistance Initiative.

Frequently Asked Questions (FAQ’s):

To speak to our analyst for a discussion on the above findings, click Speak to Analyst

TABLE OF CONTENTS
 
1 INTRODUCTION (Page No. - 30)
    1.1 STUDY OBJECTIVES 
    1.2 MARKET DEFINITION 
    1.3 INCLUSIONS AND EXCLUSIONS 
           TABLE 1 INCLUSIONS AND EXCLUSIONS
    1.4 STUDY SCOPE 
           1.4.1 MARKETS COVERED
                    FIGURE 1 LEO TERMINALS MARKET SEGMENTATION
           1.4.2 REGIONS COVERED
           1.4.3 YEARS CONSIDERED
    1.5 CURRENCY CONSIDERED 
           TABLE 2 USD EXCHANGE RATES
    1.6 STAKEHOLDERS 
 
2 RESEARCH METHODOLOGY (Page No. - 34)
    2.1 RESEARCH DATA 
           FIGURE 2 RESEARCH PROCESS FLOW
           FIGURE 3 RESEARCH DESIGN
           2.1.1 SECONDARY DATA
                    2.1.1.1 Secondary sources
           2.1.2 PRIMARY DATA
                    2.1.2.1 Primary respondents
                    2.1.2.2 Key data from primary sources
                               FIGURE 4 KEY INDUSTRY INSIGHTS
                               FIGURE 5 BREAKDOWN OF PRIMARY INTERVIEWS
    2.2 FACTOR ANALYSIS 
           2.2.1 INTRODUCTION
           2.2.2 DEMAND-SIDE INDICATORS
           2.2.3 SUPPLY-SIDE INDICATORS
           2.2.4 RECESSION IMPACT
    2.3 MARKET SIZE ESTIMATION 
           2.3.1 BOTTOM-UP APPROACH
                    FIGURE 6 BOTTOM-UP APPROACH
           2.3.2 TOP-DOWN APPROACH
                    FIGURE 7 TOP-DOWN APPROACH
    2.4 DATA TRIANGULATION 
           FIGURE 8 DATA TRIANGULATION
    2.5 RESEARCH ASSUMPTIONS 
           FIGURE 9 RESEARCH ASSUMPTIONS
    2.6 RESEARCH LIMITATIONS 
    2.7 RISK ASSESSMENT 
 
3 EXECUTIVE SUMMARY (Page No. - 45)
    FIGURE 10 MOBILE SEGMENT TO SECURE LARGEST MARKET SHARE IN 2028
    FIGURE 11 COMMERCIAL SEGMENT TO REGISTER HIGHEST CAGR DURING FORECAST PERIOD
    FIGURE 12 KU-BAND SEGMENT TO DOMINATE LEO TERMINALS MARKET DURING FORECAST PERIOD
    FIGURE 13 NORTH AMERICA TO BE LARGEST MARKET DURING FORECAST PERIOD
 
4 PREMIUM INSIGHTS (Page No. - 48)
    4.1 ATTRACTIVE OPPORTUNITIES FOR PLAYERS IN LEO TERMINALS MARKET 
           FIGURE 14 INCREASING USE OF LEO TERMINALS FOR LOW-LATENCY, HIGH-BANDWIDTH CONNECTIVITY
    4.2 LEO TERMINALS MARKET, BY PLATFORM 
           FIGURE 15 MOBILE SEGMENT TO LEAD MARKET DURING FORECAST PERIOD
    4.3 LEO TERMINALS MARKET, BY VERTICAL 
           FIGURE 16 COMMERCIAL TO BE FASTEST-GROWING SEGMENT DURING FORECAST PERIOD
    4.4 LEO TERMINALS MARKET, BY COMMERCIAL VERTICAL 
           FIGURE 17 RETAIL & CONSUMER SEGMENT TO RECORD HIGHEST CAGR DURING FORECAST PERIOD
    4.5 LEO TERMINALS MARKET, BY FREQUENCY 
           FIGURE 18 KU-BAND SEGMENT TO SHOW HIGHEST MARKET GROWTH DURING FORECAST PERIOD
 
5 MARKET OVERVIEW (Page No. - 51)
    5.1 INTRODUCTION 
    5.2 MARKET DYNAMICS 
           FIGURE 19 LEO TERMINALS MARKET DYNAMICS
           5.2.1 DRIVERS
                    5.2.1.1 Increasing demand for cost-effective, high-speed connectivity
                    5.2.1.2 Rapid integration of Internet of Things
                    5.2.1.3 Expansion of LEO satellite constellations
                    5.2.1.4 Government initiatives for development of LEO terminals
           5.2.2 RESTRAINTS
                    5.2.2.1 High cost of LEO terminals
                    5.2.2.2 Availability of other broadband technologies
           5.2.3 OPPORTUNITIES
                    5.2.3.1 Widescale applications of LEO terminals
                    5.2.3.2 Growing demand for connectivity from emerging countries
           5.2.4 CHALLENGES
                    5.2.4.1 Technical constraints associated with development and launch of LEO satellites
                    5.2.4.2 Threat of data interception, unauthorized access, and cyberattacks
                    5.2.4.3 Rise in environmental concerns
    5.3 VALUE CHAIN ANALYSIS 
           FIGURE 20 VALUE CHAIN ANALYSIS
    5.4 TRENDS AND DISRUPTIONS IMPACTING CUSTOMERS’ BUSINESSES 
           FIGURE 21 TRENDS AND DISRUPTIONS IMPACTING CUSTOMERS’ BUSINESSES
    5.5 ECOSYSTEM MAPPING 
           5.5.1 PROMINENT COMPANIES
           5.5.2 PRIVATE AND SMALL ENTERPRISES
           5.5.3 END USERS
                    FIGURE 22 ECOSYSTEM MAPPING
                    TABLE 3 ROLE OF COMPANIES IN ECOSYSTEM
    5.6 PRICING ANALYSIS 
           5.6.1 AVERAGE SELLING PRICE TREND OF LEO TERMINALS, BY KEY PLAYER
                    FIGURE 23 AVERAGE SELLING PRICE TREND OF LEO TERMINALS, BY KEY PLAYER, 2022 (USD/UNIT)
                    TABLE 4 AVERAGE SELLING PRICE TREND OF LEO TERMINALS, BY KEY PLAYER (USD/UNIT)
           5.6.2 AVERAGE SELLING PRICE TREND OF LEO TERMINALS, BY VERTICAL
                    FIGURE 24 AVERAGE SELLING PRICE TREND OF LEO TERMINALS, BY VERTICAL, 2022 (USD/UNIT)
                    TABLE 5 AVERAGE SELLING PRICE TREND OF LEO TERMINALS, BY VERTICAL, 2022 (USD/UNIT)
                    FIGURE 25 AVERAGE SELLING PRICE TREND OF LEO TERMINALS, BY REGION, 2022 (USD/UNIT)
           5.6.3 AVERAGE SELLING PRICE TREND OF LEO TERMINALS, BY REGION
                    TABLE 6 AVERAGE SELLING PRICE TREND OF LEO TERMINALS, BY REGION, 2022 (USD/UNIT)
           5.6.4 AVERAGE SELLING PRICE TREND OF LEO TERMINALS FOR COMMERCIAL VERTICAL, BY REGION
                    TABLE 7 AVERAGE SELLING PRICE TREND OF LEO TERMINALS FOR COMMERCIAL VERTICAL, BY REGION, 2022 (USD/UNIT)
           5.6.5 AVERAGE SELLING PRICE TREND OF LEO TERMINALS FOR GOVERNMENT & DEFENSE VERTICAL, BY REGION
                    TABLE 8 AVERAGE SELLING PRICE TREND OF LEO TERMINALS FOR GOVERNMENT & DEFENSE VERTICAL, BY REGION, 2022 (USD/UNIT)
    5.7 PORTER’S FIVE FORCES ANALYSIS 
           FIGURE 26 PORTER’S FIVE FORCES ANALYSIS
           TABLE 9 IMPACT OF PORTER’S FIVE FORCES ANALYSIS
           5.7.1 THREAT OF NEW ENTRANTS
           5.7.2 THREAT OF SUBSTITUTES
           5.7.3 BARGAINING POWER OF SUPPLIERS
           5.7.4 BARGAINING POWER OF BUYERS
           5.7.5 INTENSITY OF COMPETITIVE RIVALRY
    5.8 VOLUME DATA 
    5.9 REGULATORY LANDSCAPE 
           TABLE 10 NORTH AMERICA: REGULATORY BODIES, GOVERNMENT AGENCIES, AND OTHER ORGANIZATIONS
           TABLE 11 EUROPE: REGULATORY BODIES, GOVERNMENT AGENCIES, AND OTHER ORGANIZATIONS
           TABLE 12 ASIA PACIFIC: REGULATORY BODIES, GOVERNMENT AGENCIES, AND OTHER ORGANIZATIONS
           TABLE 13 REST OF THE WORLD: REGULATORY BODIES, GOVERNMENT AGENCIES, AND OTHER ORGANIZATIONS
    5.10 KEY STAKEHOLDERS AND BUYING CRITERIA 
           5.10.1 KEY STAKEHOLDERS IN BUYING PROCESS
                    FIGURE 27 INFLUENCE OF STAKEHOLDERS ON BUYING LEO TERMINALS, BY VERTICAL
                    TABLE 14 INFLUENCE OF STAKEHOLDERS ON BUYING LEO TERMINALS, BY VERTICAL (%)
           5.10.2 BUYING CRITERIA
                    FIGURE 28 KEY BUYING CRITERIA FOR LEO TERMINALS, BY VERTICAL
                    TABLE 15 KEY BUYING CRITERIA FOR LEO TERMINALS, BY VERTICAL
    5.11 ROADMAP OF LEO TERMINALS MARKET 
           FIGURE 29 TECHNOLOGICAL EVOLUTION OF LEO TERMINALS
    5.12 TRADE ANALYSIS 
           TABLE 16 COUNTRY-WISE IMPORTS, 2019–2021 (USD THOUSAND)
           TABLE 17 COUNTRY-WISE EXPORTS, 2019–2021 (USD THOUSAND)
    5.13 KEY CONFERENCES AND EVENTS, 2023–2024 
           TABLE 18 KEY CONFERENCES AND EVENTS, 2023–2024
 
6 INDUSTRY TRENDS (Page No. - 74)
    6.1 INTRODUCTION 
    6.2 TECHNOLOGY TRENDS 
           6.2.1 SOFTWARE-DEFINED RADIOS
           6.2.2 MASSIVE MULTIPLE-INPUT MULTIPLE-OUTPUT TECHNOLOGY
           6.2.3 SOFTWARE-CENTRIC DESIGN
           6.2.4 ADAPTIVE COMMITTED BANDWIDTH
           6.2.5 USE OF LARGE REFLECTORS FOR HIGH-SPEED TRANSMISSION
           6.2.6 ADVANCES IN USER TERMINAL UP/DOWN CONVERTERS
    6.3 IMPACT OF MEGATRENDS 
           6.3.1 INTERNET OF THINGS
           6.3.2 MULTI-BAND MULTI-MISSION ANTENNAS
           6.3.3 AUTONOMOUS AIRCRAFT
           6.3.4 SMART ANTENNAS
    6.4 SUPPLY CHAIN ANALYSIS 
           FIGURE 30 SUPPLY CHAIN ANALYSIS
    6.5 USE CASE ANALYSIS 
           6.5.1 LEO SATELLITE COMMUNICATIONS
           6.5.2 EVALUATION OF ALL-USER TERMINALS IN LEO SATELLITE COMMUNICATIONS NETWORKS
           6.5.3 UTILIZATION OF LEO TERMINALS
           6.5.4 SATELLITE-BASED IOT NETWORKS
           6.5.5 KU-KA BAND VSATS
    6.6 PATENT ANALYSIS 
           FIGURE 31 TOP PATENT APPLICANTS
           FIGURE 32 REGIONAL PATENT ANALYSIS
           TABLE 19 REGIONAL PATENT ANALYSIS
           TABLE 20 MAJOR PATENTS
 
7 LEO TERMINALS MARKET, BY VERTICAL (Page No. - 86)
    7.1 INTRODUCTION 
           FIGURE 33 LEO TERMINALS MARKET, BY VERTICAL, 2023–2028
           TABLE 21 LEO TERMINALS MARKET, BY VERTICAL, 2020–2022 (USD MILLION)
           TABLE 22 LEO TERMINALS MARKET, BY VERTICAL, 2023–2028 (USD MILLION)
    7.2 COMMERCIAL 
           7.2.1 DIVERSE APPLICATIONS OF LEO TERMINALS TO DRIVE GROWTH
                    TABLE 23 COMMERCIAL: LEO TERMINALS MARKET, BY TYPE, 2020–2022 (USD MILLION)
                    TABLE 24 COMMERCIAL: LEO TERMINALS MARKET, BY TYPE, 2023–2028 (USD MILLION)
                    7.2.1.1 Telecommunications & Cellular Backhaul
                    7.2.1.2 Media & Entertainment
                    7.2.1.3 Business & Enterprise
                    7.2.1.4 Transportation & Logistics
                    7.2.1.5 Scientific Research & Development
                    7.2.1.6 Aviation
                    7.2.1.7 Marine
                    7.2.1.8 Retail & Consumer
                    7.2.1.9 Others
    7.3 GOVERNMENT & DEFENSE 
           7.3.1 NEED FOR SECURE COMMUNICATIONS SOLUTIONS TO DRIVE GROWTH
                    TABLE 25 GOVERNMENT & DEFENSE: LEO TERMINALS MARKET, BY TYPE, 2020–2022 (USD MILLION)
                    TABLE 26 GOVERNMENT & DEFENSE: LEO TERMINALS MARKET, BY TYPE, 2023–2028 (USD MILLION)
                    7.3.1.1 Military
                    7.3.1.2 Homeland Security & Emergency Management
 
8 LEO TERMINALS MARKET, BY PLATFORM (Page No. - 93)
    8.1 INTRODUCTION 
           FIGURE 34 LEO TERMINALS MARKET, BY PLATFORM, 2023–2028
           TABLE 27 LEO TERMINALS MARKET, BY PLATFORM, 2020–2022 (USD MILLION)
           TABLE 28 LEO TERMINALS MARKET, BY PLATFORM, 2023–2028 (USD MILLION)
    8.2 FIXED 
           8.2.1 RISING DEMAND FOR HIGH-SPEED INTERNET FROM REMOTE AREAS TO DRIVE GROWTH
    8.3 PORTABLE 
           8.3.1 INCREASING PREFERENCE FOR ON-THE-GO CONNECTIVITY TO DRIVE GROWTH
    8.4 MOBILE 
           8.4.1 ADVANCEMENTS IN MOBILE TERMINAL TECHNOLOGY TO DRIVE GROWTH
 
9 LEO TERMINALS MARKET, BY FREQUENCY (Page No. - 96)
    9.1 INTRODUCTION 
           FIGURE 35 LEO TERMINALS MARKET, BY FREQUENCY, 2023–2028
           TABLE 29 LEO TERMINALS MARKET, BY FREQUENCY, 2020–2022 (USD MILLION)
           TABLE 30 LEO TERMINALS MARKET, BY FREQUENCY, 2023–2028 (USD MILLION)
    9.2 C-BAND 
    9.3 L- & S-BAND 
    9.4 X-BAND 
    9.5 KA-BAND 
    9.6 KU-BAND 
    9.7 VHF/UHF-BAND 
    9.8 EHF/SHF-BAND 
    9.9 Q-BAND 
    9.1 MULTI-BAND 
 
10 LEO TERMINALS MARKET, BY REGION (Page No. - 102)
     10.1 INTRODUCTION 
           FIGURE 36 LEO TERMINALS MARKET, BY REGION, 2023–2028
           TABLE 31 LEO TERMINALS MARKET, BY REGION, 2020–2022 (USD MILLION)
           TABLE 32 LEO TERMINALS MARKET, BY REGION, 2023–2028 (USD MILLION)
     10.2 REGIONAL RECESSION IMPACT ANALYSIS 
           TABLE 33 REGIONAL RECESSION IMPACT ANALYSIS
     10.3 NORTH AMERICA 
             10.3.1 INTRODUCTION
             10.3.2 PESTLE ANALYSIS
                        FIGURE 37 NORTH AMERICA: LEO TERMINALS MARKET SNAPSHOT
                        TABLE 34 NORTH AMERICA: LEO TERMINALS MARKET, BY PLATFORM, 2020–2022 (USD MILLION)
                        TABLE 35 NORTH AMERICA: LEO TERMINALS MARKET, BY PLATFORM, 2023–2028 (USD MILLION)
                        TABLE 36 NORTH AMERICA: LEO TERMINALS MARKET, BY VERTICAL, 2020–2022 (USD MILLION)
                        TABLE 37 NORTH AMERICA: LEO TERMINALS MARKET, BY VERTICAL, 2023–2028 (USD MILLION)
                        TABLE 38 NORTH AMERICA: LEO TERMINALS MARKET, BY COUNTRY, 2020–2022 (USD MILLION)
                        TABLE 39 NORTH AMERICA: LEO TERMINALS MARKET, BY COUNTRY, 2023–2028 (USD MILLION)
             10.3.3 US
                        10.3.3.1 Development of new LEO satellite constellations to drive growth
                                     TABLE 40 US: LEO TERMINALS MARKET, BY PLATFORM, 2020–2022 (USD MILLION)
                                     TABLE 41 US: LEO TERMINALS MARKET, BY PLATFORM, 2023–2028 (USD MILLION)
                                     TABLE 42 US: LEO TERMINALS MARKET, BY VERTICAL, 2020–2022 (USD MILLION)
                                     TABLE 43 US: LEO TERMINALS MARKET, BY VERTICAL, 2023–2028 (USD MILLION)
             10.3.4 CANADA
                        10.3.4.1 Need for high-speed connectivity to drive growth
                                     TABLE 44 CANADA: LEO TERMINALS MARKET, BY PLATFORM, 2020–2022 (USD MILLION)
                                     TABLE 45 CANADA: LEO TERMINALS MARKET, BY PLATFORM, 2023–2028 (USD MILLION)
                                     TABLE 46 CANADA: LEO TERMINALS MARKET, BY VERTICAL, 2020–2022 (USD MILLION)
                                     TABLE 47 CANADA: LEO TERMINALS MARKET, BY VERTICAL, 2023–2028 (USD MILLION)
     10.4 EUROPE 
             10.4.1 INTRODUCTION
             10.4.2 PESTLE ANALYSIS
                        FIGURE 38 EUROPE: LEO TERMINALS MARKET SNAPSHOT
                        TABLE 48 EUROPE: LEO TERMINALS MARKET, BY PLATFORM, 2020–2022 (USD MILLION)
                        TABLE 49 EUROPE: LEO TERMINALS MARKET, BY PLATFORM, 2023–2028 (USD MILLION)
                        TABLE 50 EUROPE: LEO TERMINALS MARKET, BY VERTICAL, 2020–2022 (USD MILLION)
                        TABLE 51 EUROPE: LEO TERMINALS MARKET, BY VERTICAL, 2023–2028 (USD MILLION)
                        TABLE 52 EUROPE: LEO TERMINALS MARKET, BY COUNTRY, 2020–2022 (USD MILLION)
                        TABLE 53 EUROPE: LEO TERMINALS MARKET, BY COUNTRY, 2023–2028 (USD MILLION)
             10.4.3 RUSSIA
                        10.4.3.1 Prevalence of remote working and learning to drive growth
                                     TABLE 54 RUSSIA: LEO TERMINALS MARKET, BY PLATFORM, 2020–2022 (USD MILLION)
                                     TABLE 55 RUSSIA: LEO TERMINALS MARKET, BY PLATFORM, 2023–2028 (USD MILLION)
                                     TABLE 56 RUSSIA: LEO TERMINALS MARKET, BY VERTICAL, 2020–2022 (USD MILLION)
                                     TABLE 57 RUSSIA: LEO TERMINALS MARKET, BY VERTICAL, 2023–2028 (USD MILLION)
             10.4.4 GERMANY
                        10.4.4.1 Increasing demand for connectivity from rural areas to drive growth
                                     TABLE 58 GERMANY: LEO TERMINALS MARKET, BY PLATFORM, 2020–2022 (USD MILLION)
                                     TABLE 59 GERMANY: LEO TERMINALS MARKET, BY PLATFORM, 2023–2028 (USD MILLION)
                                     TABLE 60 GERMANY: LEO TERMINALS MARKET, BY VERTICAL, 2020–2022 (USD MILLION)
                                     TABLE 61 GERMANY: LEO TERMINALS MARKET, BY VERTICAL, 2023–2028 (USD MILLION)
             10.4.5 FRANCE
                        10.4.5.1 Rising adoption of connected devices to drive growth
                                     TABLE 62 FRANCE: LEO TERMINALS MARKET, BY PLATFORM, 2020–2022 (USD MILLION)
                                     TABLE 63 FRANCE: LEO TERMINALS MARKET, BY PLATFORM, 2023–2028 (USD MILLION)
                                     TABLE 64 FRANCE: LEO TERMINALS MARKET, BY VERTICAL, 2020–2022 (USD MILLION)
                                     TABLE 65 FRANCE: LEO TERMINALS MARKET, BY VERTICAL, 2023–2028 (USD MILLION)
             10.4.6 UK
                        10.4.6.1 Booming IoT applications to drive growth
                                     TABLE 66 UK: LEO TERMINALS MARKET, BY PLATFORM, 2020–2022 (USD MILLION)
                                     TABLE 67 UK: LEO TERMINALS MARKET, BY PLATFORM, 2023–2028 (USD MILLION)
                                     TABLE 68 UK: LEO TERMINALS MARKET, BY VERTICAL, 2020–2022 (USD MILLION)
                                     TABLE 69 UK: LEO TERMINALS MARKET, BY VERTICAL, 2023–2028 (USD MILLION)
             10.4.7 ITALY
                        10.4.7.1 High demand for satellite services to drive growth
                                     TABLE 70 ITALY: LEO TERMINALS MARKET, BY PLATFORM, 2020–2022 (USD MILLION)
                                     TABLE 71 ITALY: LEO TERMINALS MARKET, BY PLATFORM, 2023–2028 (USD MILLION)
                                     TABLE 72 ITALY: LEO TERMINALS MARKET, BY VERTICAL, 2020–2022 (USD MILLION)
                                     TABLE 73 ITALY: LEO TERMINALS MARKET, BY VERTICAL, 2023–2028 (USD MILLION)
             10.4.8 REST OF EUROPE
                        TABLE 74 REST OF EUROPE: LEO TERMINALS MARKET, BY PLATFORM, 2020–2022 (USD MILLION)
                        TABLE 75 REST OF EUROPE: LEO TERMINALS MARKET, BY PLATFORM, 2023–2028 (USD MILLION)
                        TABLE 76 REST OF EUROPE: LEO TERMINALS MARKET, BY VERTICAL, 2020–2022 (USD MILLION)
                        TABLE 77 REST OF EUROPE: LEO TERMINALS MARKET, BY VERTICAL, 2023–2028 (USD MILLION)
     10.5 ASIA PACIFIC 
             10.5.1 INTRODUCTION
             10.5.2 PESTLE ANALYSIS
                        FIGURE 39 ASIA PACIFIC: LEO TERMINALS MARKET SNAPSHOT
                        TABLE 78 ASIA PACIFIC: LEO TERMINALS MARKET, BY PLATFORM, 2020–2022 (USD MILLION)
                        TABLE 79 ASIA PACIFIC: LEO TERMINALS MARKET, BY PLATFORM, 2023–2028 (USD MILLION)
                        TABLE 80 ASIA PACIFIC: LEO TERMINALS MARKET, BY VERTICAL, 2020–2022 (USD MILLION)
                        TABLE 81 ASIA PACIFIC: LEO TERMINALS MARKET, BY VERTICAL, 2023–2028 (USD MILLION)
                        TABLE 82 ASIA PACIFIC: LEO TERMINALS MARKET, BY COUNTRY, 2020–2022 (USD MILLION)
                        TABLE 83 ASIA PACIFIC: LEO TERMINALS MARKET, BY COUNTRY, 2023–2028 (USD MILLION)
             10.5.3 CHINA
                        10.5.3.1 Rigorous development of LEO terminals to drive growth
                                     TABLE 84 CHINA: LEO TERMINALS MARKET, BY PLATFORM, 2020–2022 (USD MILLION)
                                     TABLE 85 CHINA: LEO TERMINALS MARKET, BY PLATFORM, 2023–2028 (USD MILLION)
                                     TABLE 86 CHINA: LEO TERMINALS MARKET, BY VERTICAL, 2020–2022 (USD MILLION)
                                     TABLE 87 CHINA: LEO TERMINALS MARKET, BY VERTICAL, 2023–2028 (USD MILLION)
             10.5.4 INDIA
                        10.5.4.1 Rising security concerns to drive growth
                                     TABLE 88 INDIA: LEO TERMINALS MARKET, BY PLATFORM, 2020–2022 (USD MILLION)
                                     TABLE 89 INDIA: LEO TERMINALS MARKET, BY PLATFORM, 2023–2028 (USD MILLION)
                                     TABLE 90 INDIA: LEO TERMINALS MARKET, BY VERTICAL, 2020–2022 (USD MILLION)
                                     TABLE 91 INDIA: LEO TERMINALS MARKET, BY VERTICAL, 2023–2028 (USD MILLION)
             10.5.5 JAPAN
                        10.5.5.1 Widespread use of satellites in surveillance activities to drive growth
                                     TABLE 92 JAPAN: LEO TERMINALS MARKET, BY PLATFORM, 2020–2022 (USD MILLION)
                                     TABLE 93 JAPAN: LEO TERMINALS MARKET, BY PLATFORM, 2023–2028 (USD MILLION)
                                     TABLE 94 JAPAN: LEO TERMINALS MARKET, BY VERTICAL, 2020–2022 (USD MILLION)
                                     TABLE 95 JAPAN: LEO TERMINALS MARKET, BY VERTICAL, 2023–2028 (USD MILLION)
             10.5.6 SOUTH KOREA
                        10.5.6.1 Growing popularity of online gaming and streaming services to drive growth
                                     TABLE 96 SOUTH KOREA: LEO TERMINALS MARKET, BY PLATFORM, 2020–2022 (USD MILLION)
                                     TABLE 97 SOUTH KOREA: LEO TERMINALS MARKET, BY PLATFORM, 2023–2028 (USD MILLION)
                                     TABLE 98 SOUTH KOREA: LEO TERMINALS MARKET, BY VERTICAL, 2020–2022 (USD MILLION)
                                     TABLE 99 SOUTH KOREA: LEO TERMINALS MARKET, BY VERTICAL, 2023–2028 (USD MILLION)
             10.5.7 REST OF ASIA PACIFIC
                        TABLE 100 REST OF ASIA PACIFIC: LEO TERMINALS MARKET, BY PLATFORM, 2020–2022 (USD MILLION)
                        TABLE 101 REST OF ASIA PACIFIC: LEO TERMINALS MARKET, BY PLATFORM, 2023–2028 (USD MILLION)
                        TABLE 102 REST OF ASIA PACIFIC: LEO TERMINALS MARKET, BY VERTICAL, 2020–2022 (USD MILLION)
                        TABLE 103 REST OF ASIA PACIFIC: LEO TERMINALS MARKET, BY VERTICAL, 2023–2028 (USD MILLION)
     10.6 MIDDLE EAST & AFRICA 
             10.6.1 INTRODUCTION
             10.6.2 PESTLE ANALYSIS
                        FIGURE 40 MIDDLE EAST & AFRICA: LEO TERMINALS MARKET SNAPSHOT
                        TABLE 104 MIDDLE EAST & AFRICA: LEO TERMINALS MARKET, BY PLATFORM, 2020–2022 (USD MILLION)
                        TABLE 105 MIDDLE EAST & AFRICA: LEO TERMINALS MARKET, BY PLATFORM, 2023–2028 (USD MILLION)
                        TABLE 106 MIDDLE EAST & AFRICA: LEO TERMINALS MARKET, BY VERTICAL, 2020–2022 (USD MILLION)
                        TABLE 107 MIDDLE EAST & AFRICA: LEO TERMINALS MARKET, BY VERTICAL, 2023–2028 (USD MILLION)
                        TABLE 108 MIDDLE EAST & AFRICA: LEO TERMINALS MARKET, BY COUNTRY, 2020–2022 (USD MILLION)
                        TABLE 109 MIDDLE EAST & AFRICA: LEO TERMINALS MARKET, BY COUNTRY, 2023–2028 (USD MILLION)
             10.6.3 SAUDI ARABIA
                        10.6.3.1 Rapid development of LEO networks to drive growth
                                     TABLE 110 SAUDI ARABIA: LEO TERMINALS MARKET, BY PLATFORM, 2020–2022 (USD MILLION)
                                     TABLE 111 SAUDI ARABIA: LEO TERMINALS MARKET, BY PLATFORM, 2023–2028 (USD MILLION)
                                     TABLE 112 SAUDI ARABIA: LEO TERMINALS MARKET, BY VERTICAL, 2020–2022 (USD MILLION)
                                     TABLE 113 SAUDI ARABIA: LEO TERMINALS MARKET, BY VERTICAL, 2023–2028 (USD MILLION)
             10.6.4 ISRAEL
                        10.6.4.1 Presence of key players to drive growth
                                     TABLE 114 ISRAEL: LEO TERMINALS MARKET, BY PLATFORM, 2020–2022 (USD MILLION)
                                     TABLE 115 ISRAEL: LEO TERMINALS MARKET, BY PLATFORM, 2023–2028 (USD MILLION)
                                     TABLE 116 ISRAEL: LEO TERMINALS MARKET, BY VERTICAL, 2020–2022 (USD MILLION)
                                     TABLE 117 ISRAEL: LEO TERMINALS MARKET, BY VERTICAL, 2023–2028 (USD MILLION)
             10.6.5 SOUTH AFRICA
                        10.6.5.1 Improving telecommunications infrastructure to drive growth
                                     TABLE 118 SOUTH AFRICA: LEO TERMINALS MARKET, BY PLATFORM, 2020–2022 (USD MILLION)
                                     TABLE 119 SOUTH AFRICA: LEO TERMINALS MARKET, BY PLATFORM, 2023–2028 (USD MILLION)
                                     TABLE 120 SOUTH AFRICA: LEO TERMINALS MARKET, BY VERTICAL, 2020–2022 (USD MILLION)
                                     TABLE 121 SOUTH AFRICA: LEO TERMINALS MARKET, BY VERTICAL, 2023–2028 (USD MILLION)
             10.6.6 REST OF MIDDLE EAST & AFRICA
                        TABLE 122 REST OF MIDDLE EAST & AFRICA: LEO TERMINALS MARKET, BY PLATFORM, 2020–2022 (USD MILLION)
                        TABLE 123 REST OF MIDDLE EAST & AFRICA: LEO TERMINALS MARKET, BY PLATFORM, 2023–2028 (USD MILLION)
                        TABLE 124 REST OF MIDDLE EAST & AFRICA: LEO TERMINALS MARKET, BY VERTICAL, 2020–2022 (USD MILLION)
                        TABLE 125 REST OF MIDDLE EAST & AFRICA: LEO TERMINALS MARKET, BY VERTICAL, 2023–2028 (USD MILLION)
     10.7 LATIN AMERICA 
             10.7.1 INTRODUCTION
             10.7.2 PESTLE ANALYSIS
                        FIGURE 41 LATIN AMERICA: LEO TERMINALS MARKET SNAPSHOT
                        TABLE 126 LATIN AMERICA: LEO TERMINALS MARKET, BY PLATFORM, 2020–2022 (USD MILLION)
                        TABLE 127 LATIN AMERICA: LEO TERMINALS MARKET, BY PLATFORM, 2023–2028 (USD MILLION)
                        TABLE 128 LATIN AMERICA: LEO TERMINALS MARKET, BY VERTICAL, 2020–2022 (USD MILLION)
                        TABLE 129 LATIN AMERICA: LEO TERMINALS MARKET, BY VERTICAL, 2023–2028 (USD MILLION)
                        TABLE 130 LATIN AMERICA: LEO TERMINALS MARKET, BY COUNTRY, 2020–2022 (USD MILLION)
                        TABLE 131 LATIN AMERICA: LEO TERMINALS MARKET, BY COUNTRY, 2023–2028 (USD MILLION)
             10.7.3 BRAZIL
                        10.7.3.1 Poor internet connectivity to drive growth
                                     TABLE 132 BRAZIL: LEO TERMINALS MARKET, BY PLATFORM, 2020–2022 (USD MILLION)
                                     TABLE 133 BRAZIL: LEO TERMINALS MARKET, BY PLATFORM, 2023–2028 (USD MILLION)
                                     TABLE 134 BRAZIL: LEO TERMINALS MARKET, BY VERTICAL, 2020–2022 (USD MILLION)
                                     TABLE 135 BRAZIL: LEO TERMINALS MARKET, BY VERTICAL, 2023–2028 (USD MILLION)
             10.7.4 MEXICO
                        10.7.4.1 Government investments for development of LEO satellite networks to drive growth
                                     TABLE 136 MEXICO: LEO TERMINALS MARKET, BY PLATFORM, 2020–2022 (USD MILLION)
                                     TABLE 137 MEXICO: LEO TERMINALS MARKET, BY PLATFORM, 2023–2028 (USD MILLION)
                                     TABLE 138 MEXICO: LEO TERMINALS MARKET, BY VERTICAL, 2020–2022 (USD MILLION)
                                     TABLE 139 MEXICO: LEO TERMINALS MARKET, BY VERTICAL, 2023–2028 (USD MILLION)
             10.7.5 ARGENTINA
                        10.7.5.1 Rising deployment of LEO terminals to drive growth
                                     TABLE 140 ARGENTINA: LEO TERMINALS MARKET, BY PLATFORM, 2020–2022 (USD MILLION)
                                     TABLE 141 ARGENTINA: LEO TERMINALS MARKET, BY PLATFORM, 2023–2028 (USD MILLION)
                                     TABLE 142 ARGENTINA: LEO TERMINALS MARKET, BY VERTICAL, 2020–2022 (USD MILLION)
                                     TABLE 143 ARGENTINA: LEO TERMINALS MARKET, BY VERTICAL, 2023–2028 (USD MILLION)
 
11 COMPETITIVE LANDSCAPE (Page No. - 150)
     11.1 INTRODUCTION 
     11.2 STRATEGIES ADOPTED BY KEY PLAYERS, 2020–2022 
             TABLE 144 STRATEGIES ADOPTED BY KEY PLAYERS, 2020–2022
     11.3 MARKET RANKING ANALYSIS, 2022 
             FIGURE 42 MARKET RANKING OF KEY PLAYERS, 2022
     11.4 REVENUE ANALYSIS, 2022 
             FIGURE 43 REVENUE ANALYSIS OF KEY PLAYERS, 2022
     11.5 MARKET SHARE ANALYSIS, 2022 
             FIGURE 44 MARKET SHARE OF KEY COMPANIES, 2022
             TABLE 145 LEO TERMINALS MARKET: DEGREE OF COMPETITION
     11.6 COMPANY EVALUATION MATRIX, 2022 
             11.6.1 STARS
             11.6.2 EMERGING LEADERS
             11.6.3 PERVASIVE PLAYERS
             11.6.4 PARTICIPANTS
                        FIGURE 45 COMPANY EVALUATION MATRIX, 2022
             11.6.5 COMPANY FOOTPRINT
                        TABLE 146 REGION FOOTPRINT
                        TABLE 147 PLATFORM FOOTPRINT
                        TABLE 148 COMPANY FOOTPRINT
     11.7 START-UP/SME EVALUATION MATRIX, 2022 
             11.7.1 PROGRESSIVE COMPANIES
             11.7.2 RESPONSIVE COMPANIES
             11.7.3 DYNAMIC COMPANIES
             11.7.4 STARTING BLOCKS
                        FIGURE 46 START-UP/SME EVALUATION MATRIX, 2022
             11.7.5 COMPETITIVE BENCHMARKING
                        TABLE 149 KEY START-UPS/SMES
                        TABLE 150 COMPETITIVE BENCHMARKING OF KEY START-UPS/SMES
     11.8 COMPETITIVE SCENARIO 
             11.8.1 MARKET EVALUATION FRAMEWORK
             11.8.2 PRODUCT LAUNCHES
                        TABLE 151 LEO TERMINALS MARKET: PRODUCT LAUNCHES, SEPTEMBER 2021–MARCH 2023
             11.8.3 DEALS
                        TABLE 152 LEO TERMINALS MARKET: DEALS, NOVEMBER 2021–AUGUST 2023
             11.8.4 OTHERS
                        TABLE 153 LEO TERMINALS MARKET:  OTHERS, NOVEMBER 2021–APRIL 2023
 
12 COMPANY PROFILES (Page No. - 181)
(Business overview, Products/Services/Solutions offered, Recent Developments, MNM view)*  
     12.1 KEY PLAYERS 
             12.1.1 SPACEX
                        TABLE 154 SPACEX: COMPANY OVERVIEW
                        TABLE 155 SPACEX: PRODUCTS/SOLUTIONS/SERVICES OFFERED
                        TABLE 156 SPACEX: PRODUCT LAUNCHES
                        TABLE 157 SPACEX: DEALS
                        TABLE 158 SPACEX: OTHERS
             12.1.2 L3HARRIS TECHNOLOGIES, INC.
                        TABLE 159 L3HARRIS TECHNOLOGIES, INC.: COMPANY OVERVIEW
                        FIGURE 47 L3HARRIS TECHNOLOGIES, INC.: COMPANY SNAPSHOT
                        TABLE 160 L3HARRIS TECHNOLOGIES, INC.: PRODUCTS/SOLUTIONS/SERVICES OFFERED
                        TABLE 161 L3HARRIS TECHNOLOGIES, INC.: DEALS
             12.1.3 KYMETA CORPORATION
                        TABLE 162 KYMETA CORPORATION: COMPANY OVERVIEW
                        TABLE 163 KYMETA CORPORATION: PRODUCTS/SOLUTIONS/SERVICES OFFERED
                        TABLE 164 KYMETA CORPORATION: PRODUCT LAUNCHES
                        TABLE 165 KYMETA CORPORATION: DEALS
             12.1.4 ECHOSTAR CORPORATION
                        TABLE 166 ECHOSTAR CORPORATION: COMPANY OVERVIEW
                        FIGURE 48 ECHOSTAR CORPORATION: COMPANY SNAPSHOT
                        TABLE 167 ECHOSTAR CORPORATION: PRODUCTS/SOLUTIONS/SERVICES OFFERED
                        TABLE 168 ECHOSTAR CORPORATION: DEALS
             12.1.5 THALES
                        TABLE 169 THALES: COMPANY OVERVIEW
                        FIGURE 49 THALES: COMPANY SNAPSHOT
                        TABLE 170 THALES: PRODUCTS/SOLUTIONS/SERVICES OFFERED
                        TABLE 171 THALES: DEALS
             12.1.6 RAYTHEON TECHNOLOGIES
                        TABLE 172 RAYTHEON TECHNOLOGIES: COMPANY OVERVIEW
                        FIGURE 50 RAYTHEON TECHNOLOGIES: COMPANY SNAPSHOT
                        TABLE 173 RAYTHEON TECHNOLOGIES: PRODUCTS/SOLUTIONS/SERVICES OFFERED
                        TABLE 174 RAYTHEON TECHNOLOGIES: DEALS
             12.1.7 GENERAL DYNAMICS CORPORATION
                        TABLE 175 GENERAL DYNAMICS CORPORATION: COMPANY OVERVIEW
                        FIGURE 51 GENERAL DYNAMICS CORPORATION: COMPANY SNAPSHOT
                        TABLE 176 GENERAL DYNAMICS CORPORATION: PRODUCTS/SOLUTIONS/SERVICES OFFERED
                        TABLE 177 GENERAL DYNAMICS CORPORATION: DEALS
             12.1.8 HONEYWELL INTERNATIONAL INC.
                        TABLE 178 HONEYWELL INTERNATIONAL INC.: COMPANY OVERVIEW
                        FIGURE 52 HONEYWELL INTERNATIONAL INC.: COMPANY SNAPSHOT
                        TABLE 179 HONEYWELL INTERNATIONAL INC.: PRODUCTS/SOLUTIONS/SERVICES OFFERED
                        TABLE 180 HONEYWELL INTERNATIONAL INC.: DEALS
             12.1.9 ASELSAN A.S.
                        TABLE 181 ASELSAN A.S.: COMPANY OVERVIEW
                        FIGURE 53 ASELSAN A.S.: COMPANY SNAPSHOT
                        TABLE 182 ASELSAN A.S.: PRODUCTS/SOLUTIONS/SERVICES OFFERED
                        TABLE 183 ASELSAN A.S.: DEALS
             12.1.10 INTELLIAN TECHNOLOGIES, INC.
                        TABLE 184 INTELLIAN TECHNOLOGIES, INC.: COMPANY OVERVIEW
                        FIGURE 54 INTELLIAN TECHNOLOGIES, INC.: COMPANY SNAPSHOT
                        TABLE 185 INTELLIAN TECHNOLOGIES, INC.: PRODUCTS/SOLUTIONS/SERVICES OFFERED
                        TABLE 186 INTELLIAN TECHNOLOGIES, INC.: PRODUCT LAUNCHES
                        TABLE 187 INTELLIAN TECHNOLOGIES, INC.: DEALS
                        TABLE 188 INTELLIAN TECHNOLOGIES, INC.: OTHERS
             12.1.11 ST ENGINEERING
                        TABLE 189 ST ENGINEERING: COMPANY OVERVIEW
                        FIGURE 55 ST ENGINEERING: COMPANY SNAPSHOT
                        TABLE 190 ST ENGINEERING: PRODUCTS/SOLUTIONS/SERVICES OFFERED
                        TABLE 191 ST ENGINEERING: PRODUCT LAUNCHES
                        TABLE 192 ST ENGINEERING: DEALS
             12.1.12 BALL CORPORATION
                        TABLE 193 BALL CORPORATION: COMPANY OVERVIEW
                        FIGURE 56 BALL CORPORATION: COMPANY SNAPSHOT
                        TABLE 194 BALL CORPORATION: PRODUCTS/SOLUTION/SERVICES OFFERED
                        TABLE 195 BALL CORPORATION: DEALS
             12.1.13 COBHAM SATCOM
                        TABLE 196 COBHAM SATCOM: COMPANY OVERVIEW
                        TABLE 197 COBHAM SATCOM: PRODUCTS/SOLUTIONS/SERVICES OFFERED
                        TABLE 198 COBHAM SATCOM: PRODUCT LAUNCHES
                        TABLE 199 COBHAM SATCOM: DEALS
             12.1.14 GILAT SATELLITE NETWORKS
                        TABLE 200 GILAT SATELLITE NETWORKS: COMPANY OVERVIEW
                        FIGURE 57 GILAT SATELLITE NETWORKS: COMPANY SNAPSHOT
                        TABLE 201 GILAT SATELLITE NETWORKS: PRODUCTS/SOLUTIONS/SERVICES OFFERED
                        TABLE 202 GILAT SATELLITE NETWORKS: PRODUCT LAUNCHES
                        TABLE 203 GILAT SATELLITE NETWORKS: DEALS
             12.1.15 VIASAT, INC.
                        TABLE 204 VIASAT, INC.: COMPANY OVERVIEW
                        FIGURE 58 VIASAT, INC.: COMPANY SNAPSHOT
                        TABLE 205 VIASAT, INC.: PRODUCTS/SOLUTIONS/SERVICES OFFERED
                        TABLE 206 VIASAT, INC.: DEALS
     12.2 OTHER PLAYERS 
             12.2.1 THINKOM SOLUTIONS, INC.
                        TABLE 207 THINKOM SOLUTIONS, INC.: COMPANY OVERVIEW
             12.2.2 NORSAT INTERNATIONAL INC.
                        TABLE 208 NORSAT INTERNATIONAL INC.: COMPANY OVERVIEW
             12.2.3 APT SATELLITE CO. LTD.
                        TABLE 209 APT SATELLITE CO. LTD.: COMPANY OVERVIEW
             12.2.4 SATCUBE
                        TABLE 210 SATCUBE: COMPANY OVERVIEW
             12.2.5 MYNARIC AG
                        TABLE 211 MYNARIC AG: COMPANY OVERVIEW
             12.2.6 LEOSAT ENTERPRISES
                        TABLE 212 LEOSAT ENTERPRISES: COMPANY OVERVIEW
             12.2.7 AVL TECHNOLOGIES, INC.
                        TABLE 213 AVL TECHNOLOGIES, INC.: COMPANY OVERVIEW
             12.2.8 KEPLER COMMUNICATIONS INC.
                        TABLE 214 KEPLER COMMUNICATIONS INC.: COMPANY OVERVIEW
             12.2.9 KRATOS DEFENSE & SECURITY SOLUTIONS, INC.
                        TABLE 215 KRATOS DEFENSE & SECURITY SOLUTIONS, INC.: COMPANY OVERVIEW
             12.2.10 SAINT-GOBAIN COMPOSITE SOLUTIONS
                        TABLE 216 SAINT-GOBAIN COMPOSITE SOLUTIONS: COMPANY OVERVIEW
*Details on Business overview, Products/Services/Solutions offered, Recent Developments, MNM view might not be captured in case of unlisted companies.  
 
13 APPENDIX (Page No. - 251)
     13.1 DISCUSSION GUIDE 
     13.2 KNOWLEDGESTORE: MARKETSANDMARKETS’ SUBSCRIPTION PORTAL 
     13.3 CUSTOMIZATION OPTIONS 
     13.4 RELATED REPORTS 
     13.5 AUTHOR DETAILS 


 The research study conducted on the LEO terminals markets involved extensive use of secondary sources, directories, and databases such as Hoovers, Bloomberg Businessweek, ITC Trade data and Factiva to identify and collect information relevant to the LEO terminals markets.

The primary sources considered included industry experts from the LEO terminals markets as well as sub-component manufacturers, LEO terminals raw material suppliers, government agencies, technology vendors, system integrators, research organizations, and original equipment manufacturers related to all segments of the value chain of this industry. In-depth interviews with various primary respondents, including key industry participants, Subject Matter Experts (SMEs), industry consultants, and C-level executives, have been conducted to obtain and verify critical qualitative and quantitative information pertaining to the LEO terminals markets as well as to assess the growth prospects of the market. Sources from the supply side included various industry experts, such as chief X officers (CXOs), vice presidents (VPs), and directors from business development, marketing, and product development/innovation teams; related key executives; independent consultants; importers; and key opinion leaders.

Secondary Research

The market ranking of companies was determined using the secondary data made available through paid and unpaid sources and by analyzing the product portfolios of major companies. These companies were rated on the basis of performance and quality of their products. These data points were further validated by primary sources.
Secondary sources referred to for this research study include financial statements of companies offering LEO terminals and information from various trade, business, and professional associations. The secondary data was collected and analyzed to arrive at the overall size of the LEO terminals market, which was validated by primary respondents.

Primary Research

Primary interviews were conducted to gather insights such as market statistics, data of revenue collected from the products and services, market breakdowns, market size estimations, market forecasting, and data triangulation. Primary research also helped in understanding the various trends related to technology, threat type, range, domain, and region. Stakeholders from the demand side, such as CIOs, CTOs, and CSOs, and installation teams of the customer/end users who are using anti-aircraft systems were interviewed to understand the buyer’s perspective on the suppliers, products, component providers, and their current usage of anti-aircraft systems and future outlook of their business which will affect the overall market.

LEO Terminals Market Size, and Share

To know about the assumptions considered for the study, download the pdf brochure

Market Size Estimation

  • The top-down and bottom-up approaches were used to estimate and validate the size of the LEO terminals markets. The research methodology used to estimate the market size also included the following details.
  • The key players were identified through secondary research, and their market ranking was determined through primary and secondary research. This included a study of the annual and financial reports of the top market players and extensive interviews of leaders, including chief executive officers (CEO), directors, and marketing executives.
  • All percentage shares, splits, and breakdowns were determined using secondary sources and verified through primary sources. All possible parameters that affect the markets covered in this research study were accounted for, viewed in extensive detail, verified through primary research, and analyzed to obtain the final quantitative and qualitative data. This data was consolidated, enhanced with detailed inputs, analyzed by representatives in MarketsandMarkets, and presented in this report.

Market size estimation methodology: Bottom-up Approach

LEO Terminals Market Size, and Bottom-up Approach

Market size estimation methodology: Top-Down Approach

LEO Terminals Market Size, and Top-Down Approach

Data triangulation

After arriving at the overall size from the market size estimation process explained above, the total market was split into several segments and subsegments. The data triangulation and market breakdown procedures explained below were implemented, wherever applicable, to complete the overall market engineering process and arrive at the exact statistics for various market segments and subsegments.  

Market Definition

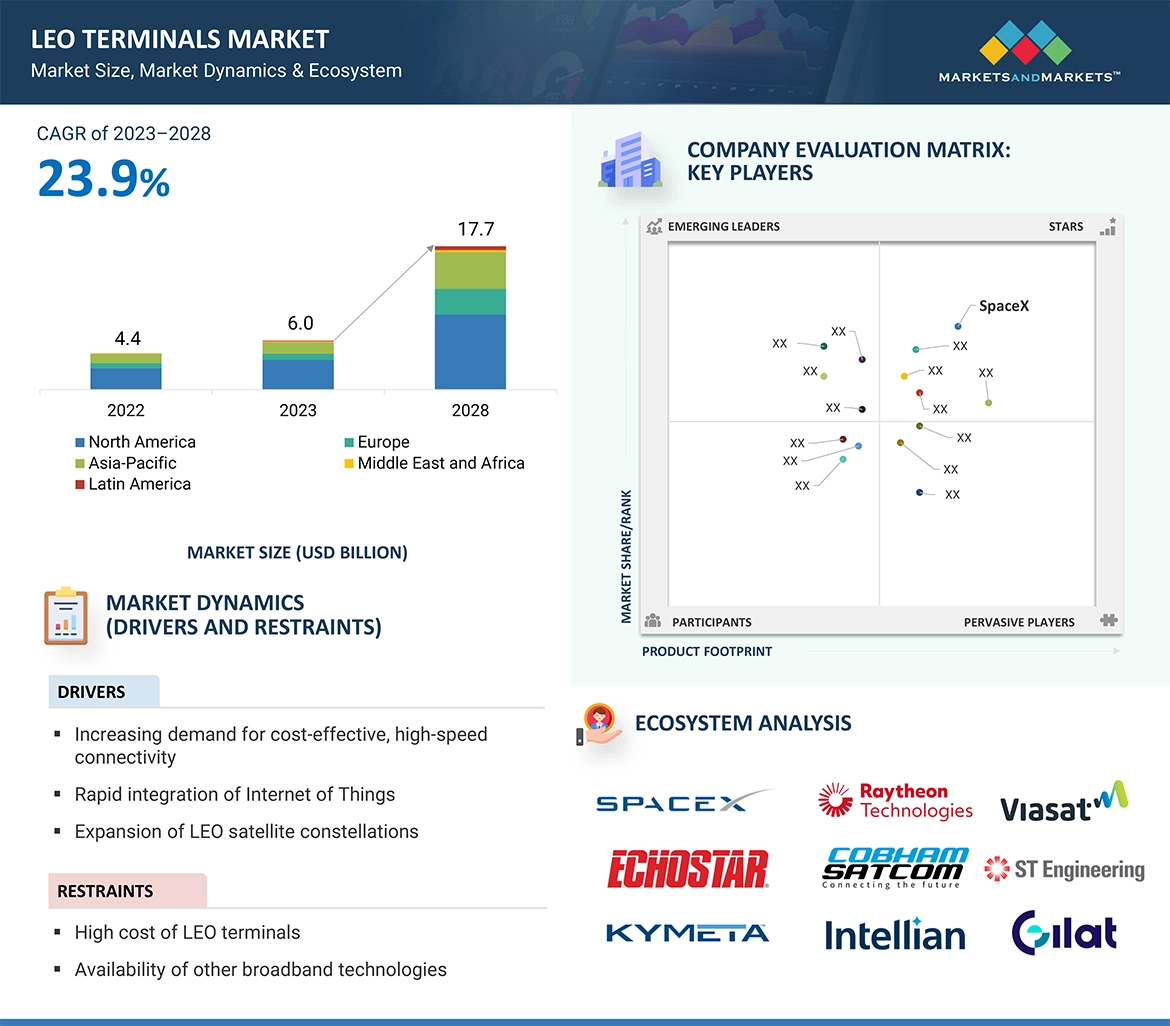
LEO terminal is a system integrated into commercial and military platforms to enable satellite-based communications applications. These terminals are engineered to facilitate the seamless transmission and reception of signals between LEO satellite networks and terrestrial stations. These terminals are prime in establishing dependable and efficient communication links, empowering a range of applications, including high-speed internet access, voice communication, data transfer, video broadcasting, remote sensing, and IoT connectivity.
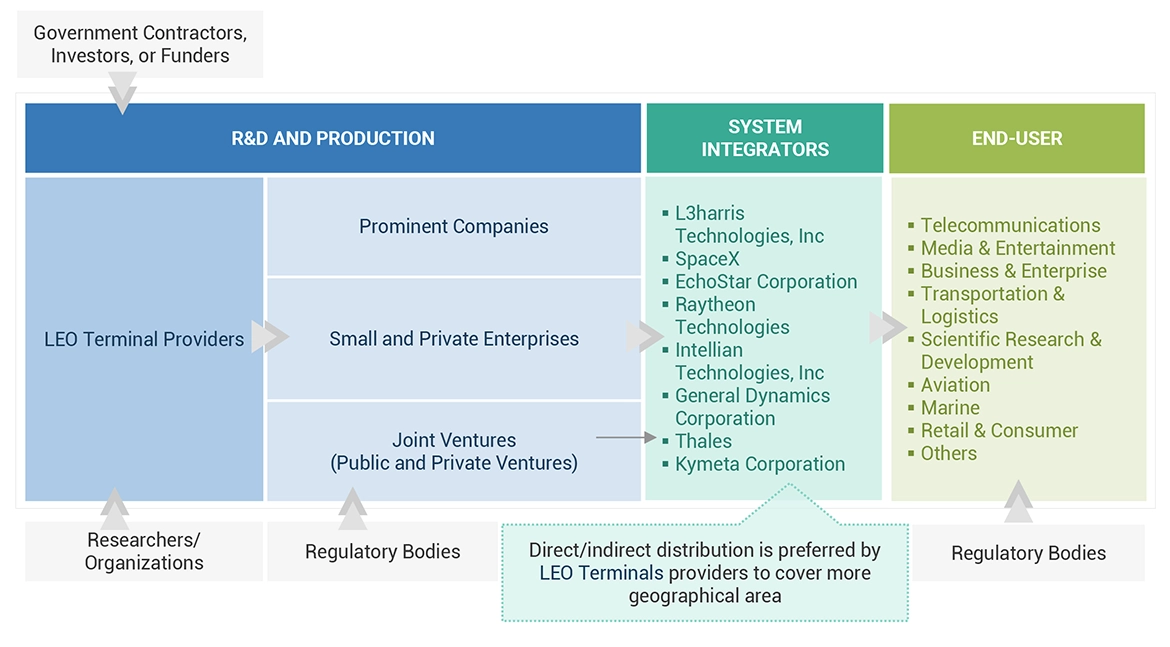
Stakeholders

  • Military Antenna Manufacturers
  • System Integrators
  • Original Equipment Manufacturers
  • Military Service Providers
  • Research Organizations
  • Investors and Venture Capitalists
  • Ministries of Defense
  • R&D Companies

Report Objectives

  • To define, describe, and forecast the size of the LEO terminals market based on platform, vertical, frequency, and region in terms of value
  • To forecast the size of market segments across North America, Europe, Asia Pacific, the Middle East & Africa, and Latin America, along with key countries in these regions
  • To identify and analyze key drivers, restraints, opportunities, and challenges influencing market growth
  • To identify industry trends, market trends, and technology trends prevailing in the market
  • To analyze micromarkets1 with respect to individual technological trends, prospects, and their contribution to the market
  • To strategically profile key market players and comprehensively analyze their market rank analysis and core competencies2
  • To identify the detailed financial positions, product portfolios, and key developments of leading companies in the market
  • To provide details regarding the competitive landscape of the market and analyze growth strategies such as product launches and developments, contracts, partnerships, agreements, and collaborations adopted by key market players

1Micromarkets are referred to as the segments and subsegments of the LEO terminals markets considered in the scope of the report.

2Core competencies of companies were captured in terms of their key developments and key strategies adopted to sustain their positions in the market.

Available customizations

Along with the market data, MarketsandMarkets offers customizations as per the specific needs of companies. The following customization options are available for the report:

Product Analysis

  • Product matrix, which gives a detailed comparison of the product portfolio of each company

Regional Analysis

  • Further breakdown of the market segments at country-level

Company Information

  • Detailed analysis and profiling of additional market players (up to 5)
Custom Market Research Services

We will customize the research for you, in case the report listed above does not meet with your exact requirements. Our custom research will comprehensively cover the business information you require to help you arrive at strategic and profitable business decisions.

Request Customization
Report Code
AS 8859
Published ON
Nov, 2023
Choose License Type
BUY NOW
  • SHARE
X
Request Customization
Speak to Analyst
Speak to Analyst
OR FACE-TO-FACE MEETING
PERSONALIZE THIS RESEARCH
  • Triangulate with your Own Data
  • Get Data as per your Format and Definition
  • Gain a Deeper Dive on a Specific Application, Geography, Customer or Competitor
  • Any level of Personalization
REQUEST A FREE CUSTOMIZATION
LET US HELP YOU!
  • What are the Known and Unknown Adjacencies Impacting the LEO Terminals Market
  • What will your New Revenue Sources be?
  • Who will be your Top Customer; what will make them switch?
  • Defend your Market Share or Win Competitors
  • Get a Scorecard for Target Partners
CUSTOMIZED WORKSHOP REQUEST
+1-888-600-6441
  • Call Us
  • +1-888-600-6441 (Corporate office hours)
  • +1-888-600-6441 (US/Can toll free)
  • +44-800-368-9399 (UK office hours)
CONNECT WITH US
ABOUT TRUST ONLINE
©2024 MarketsandMarkets Research Private Ltd. All rights reserved
DMCA.com Protection Status Website Feedback