Medical Lasers Market

Medical Lasers Market Size, Share & Trends by Technology (Solid (ER:YAG, ND:YAG, HO:YAG, Alexandrite), Gas (CO2, Argon, Excimer), Pulsed Dye, Diode), Application (Aesthetics, Dermatology, Urology), End User (Hospital, Clinic, Home), Unmet Needs - Global Forecast to 2028

Report Code: MD 8923 Jan, 2024, by marketsandmarkets.com

Medical Lasers Market Size, Share & Trends

The global Medical Lasers Market in terms of revenue was estimated to be worth $4.8 Billion in 2023 and is poised to reach $8.3 Billion by 2028, growing at a CAGR of 11.5% from 2023 to 2028. The new research study consists of an industry trend analysis of the market. The new research study consists of industry trends, pricing analysis, patent analysis, conference and webinar materials, key stakeholders, and buying behaviour in the market.

The global market is poised for growth during the forecast period, primarily driven by two key factors. Firstly, there is a rise in the utilization of non-surgical cosmetic procedures, motivating a greater number of individuals to consider and undergo these treatments. Secondly, the market is experiencing positive growth due to the increasing favorability of minimally invasive devices. Patients are increasingly inclined towards these devices because of their lower risk, quicker recovery times, and the attainment of more nuanced results. This dual interaction of heightened awareness and the acceptance of minimally invasive alternatives is anticipated to serve as a substantial catalyst for market expansion in the upcoming years.

Medical Lasers Market Trends

Medical Lasers Market

To know about the assumptions considered for the study, Request for Free Sample Report

Medical Lasers Market

e- Estimated; p- Projected

Medical Lasers Market: Market Dynamics

Driver: Increase in the number of non surgical cosmetic procedures

The field of cosmetic medicine is witnessing a growing preference for minimally invasive and non-surgical laser treatments, presenting a convenient and lower-risk alternative to traditional surgical procedures. Procedures such as laser therapy and microdermabrasion are becoming increasingly popular as they offer natural-looking results while addressing a variety of cosmetic concerns. One of the key advantages of these treatments is their minimal downtime, allowing for quick recovery and the resumption of daily activities without significant interruption. This attribute contributes to their widespread acceptance across different age groups, further fueled by their accessibility and customizable options.

The appeal of these treatments extends to their ability to minimize scarring, making them especially attractive to individuals who are concerned about the potential for surgical scars. Nevertheless, it is essential that these procedures be conducted by qualified medical professionals to ensure both safety and effectiveness. Seeking consultation with healthcare providers is imperative for the development of personalized treatment plans, emphasizing the importance of a cautious and informed approach to cosmetic interventions.

Restraint: Stringent safety regulation

The market is characterized by rigorous regulatory compliance and safety standards, which play a crucial role in ensuring patient well-being and treatment effectiveness. Despite their significant benefits, these standards pose several challenges for industry participants. New entrants face obstacles such as resource-intensive compliance requirements, resulting in hindrances to market entry. Delays in product development and approvals, coupled with increased treatment costs, further compound the challenges. Additionally, the extensive oversight associated with regulatory compliance can potentially lead to legal issues for non-compliant companies.

Furthermore, these regulations impose limitations on practitioner flexibility, and their global variations add complexity to the industry, necessitating ongoing education and training. While these constraints may present difficulties, they ultimately prioritize patient safety, foster trust within the industry, and contribute to the long-term viability of the market. Companies that successfully navigate this regulatory landscape are rewarded with a strengthened position in the market.

Opportunity: Growth of medical tourism

The rapid growth of medical tourism has emerged as a significant opportunity within the market. As global travel becomes more accessible and healthcare costs rise in certain regions, patients increasingly seek affordable and high-quality medical treatments abroad. Medical lasers play a crucial role in various cosmetic and therapeutic procedures, ranging from dermatology to ophthalmology. This surge in international patient traffic has created a burgeoning demand for advanced medical laser technologies in popular medical tourism destinations. Healthcare facilities in these destinations are investing in cutting-edge laser equipment to attract medical tourists seeking cost-effective treatments without compromising on quality. The intersection of medical tourism and the expanding market presents a compelling opportunity for manufacturers and providers to cater to a growing global clientele.

Challenge: Risk associated with lasers

The market faces challenges due to the prevalence of alternative beauty and cosmetic products. Competing for consumer attention against a diverse range of over-the-counter options, providers must highlight the advantages of professional treatments. Economic considerations often influence consumer choices, with many opting for more affordable beauty products over expensive procedures. The perceived convenience of non-invasive beauty products adds another layer of complexity. To distinguish themselves, providers require effective marketing strategies and distinctive brand identities. It is crucial to educate consumers on the safety and benefits of professional treatments while navigating diverse regulatory standards. In a saturated market, providers must underscore the importance of personalized care, enduring results, and expertise to attract and retain clients.

Market Ecosystem/Map

Medical Lasers Market Ecosystem

By technology, the solid-state lasers system segment of medical lasers industry accounted for the largest share in 2023.

Based on technology, the medical lasers market is segmented into solid-state laser systems, gas laser systems, pulsed dye laser systems, diode laser systems, and other technologies system. in 2023, the solid-state laser systems segment accounted for the largest market share. The rising utilization of advanced instruments that improve precise diagnostics and the increasing desire for enhanced sensitivity are driving the growth of this particular segment in the market.

By application, medical lasers industry of the dermatology application market will register significant growth in the near future.

Based on application, the medical lasers market is segmented into aesthetic/cosmetic applications, dermatology applications, urology applications, ophthalmology applications, dental applications, ob/gyn applications, oncology applications, cardiovascular applications, and other applications. The aesthetic/cosmetic applications segment market by application registers the highest growth rate during the forecast period. The primary drivers contributing to the highest growth rate in this segment are attributed to the increased use of innovative devices that facilitate precise targeting of specific areas within the realm of medical laser treatments.

By end user, the hospitals and surgical centers segment of medical lasers industry accounted for the largest share in 2023.

Based on end users, the medical lasers market is segmented into hospitals and surgical centers, dermatology clinics and dental clinics, medical and beauty spas, home use and self care and other end users. In 2022, the hospitals and surgical centers segment accounted for the largest market share. The highest share of this segment is attributed to the rising utilization of automated systems. The primary factor influencing the significant growth in this sector is the increasing use of automated systems in medical laser clinics, particularly for the early detection of diseases, driven by a heightened awareness. This upswing is primarily a consequence of the digitization of patient workflows in medical practices, a rise in the number of laser procedures conducted, and an increased adoption of advanced systems in these clinics to improve the overall quality of patient care.

By region, North America is expected to be the largest market of the medical lasers industry during the forecast period.

In 2023, North America, which includes both the United States and Canada, held the leading position in market share. The growth of the medical lasers market in the North American region can be attributed to several factors such as the increasing applications in the healthcare sector, favorable reimbursement policies, and the notable presence of major industry players. Furthermore, the market is experiencing additional momentum from the rapid rise in the elderly population and the significant establishment of aesthetic imaging centers in the region.

Medical Lasers Market by Region

To know about the assumptions considered for the study, download the pdf brochure

As of 2023, prominent players in the market are Lumenis Be Ltd. (Israel), Alma Lasers (Israel), and Cynosure (US), among others.

Scope of the Medical Laser Industry

Report Metric

Details

Market Revenue in 2023

$4.8 Billion

Projected Revenue by 2028

$8.3 Billion

Revenue Rate

Poised to Grow at a CAGR of 11.5%

Market Driver

Increase in the number of non surgical cosmetic procedures

Market Opportunity

Growth of medical tourism

This report has segmented the medical lasers market to forecast revenue and analyze trends in each of the following submarkets:

By Technology
  • Solid-State Laser Systems
  • ER:YAG Laser Systems
  • NG:YAG Laser Systems
  • HO:YAG Laser Systems
  • Alexandrite Laser Systems
  • Other Solid-State Laser Systems
  • Gas Laser Systems
  • Co2 Laser Systems
  • Argon Laser Systems
  • Krypton Laser Systems
  • Excimer Laser Systems
  • Other Gas Laser Systems
  • Pulsed Dye Laser Systems
  • Diode Laser Systems
  • Other Technologies
By Application
  • Aesthetic/Cosmetic Applications
  • Hair Removal
  • Acne And Scar Removal
  • Tattoo Removal
  • Other Aesthetic Applications
  • Dermatology Applications
  • Urology Applications
  • Ophthalmology Applications
  • Dental Applications
  • Ob/Gyn Applications
  • Oncology Applications
  • Cardiovascular Applications
  • Other Applications
By End User
  • Hospitals And Surgical Centers
  • Dermatology Clinics And Dental Clinics
  • Medical And Beauty Spas
  • Home Use And Self Care
  • Other End Users
By Region
  • North America
    • US
    • Canada
  • Europe
    • Germany
    • France
    • UK
    • Spain
    • Italy
    • Rest of Europe
  • Asia Pacific
    • Japan
    • China
    • India
    • Australia
    • Thailand
    • South Korea
    • Indonesia
    • Rest of Asia Pacific
  • Latin America
    • Brazil
    • Mexico
    • Rest of Latin America
  • Middle East and Africa

Recent Developments of Medical Lasers Industry:

  • In March 2022, Cynosure has introduced the PicoSure Pro system, the only FDA-cleared 755nm picosecond laser utilizing rapid pressure pulses instead of heat. This innovative technology ensures safe and effective pigmentation removal and skin rejuvenation for all skin types. The launch is scheduled to take place at the AMWC Congress in Monaco.
  • March 2021, Bausch Health Companies Inc. and its Solta Medical division have introduced the Clear + Brilliant Touch laser in the United States. This next-generation product offers an advanced treatment protocol, delivering customized and comprehensive benefits to patients of varying ages and skin types through the utilization of two wavelengths.
  • Arpil 2021, Lumenis Ltd. has received FDA approval for their newest IPL device, specially crafted to alleviate symptoms of dry eye disease stemming from meibomian gland dysfunction (MGD). This represents a noteworthy breakthrough in the treatment of dry eye conditions.

Frequently Asked Questions (FAQ):

To speak to our analyst for a discussion on the above findings, click Speak to Analyst

Exclusive indicates content/data unique to MarketsandMarkets and not available with any competitors.

TABLE OF CONTENTS
 
1 INTRODUCTION (Page No. - 28)
    1.1 STUDY OBJECTIVES 
    1.2 MARKET DEFINITION 
           1.2.1 INCLUSIONS & EXCLUSIONS OF STUDY
    1.3 MARKET SCOPE 
           1.3.1 MARKETS COVERED
           1.3.2 YEARS CONSIDERED
    1.4 CURRENCY 
    1.5 RESEARCH LIMITATIONS 
    1.6 STAKEHOLDERS 
    1.7 SUMMARY OF CHANGES 
    1.8 RECESSION IMPACT 
 
2 RESEARCH METHODOLOGY (Page No. - 34)
    2.1 RESEARCH DATA 
    2.2 RECESSION IMPACT 
    2.3 RESEARCH DESIGN 
           2.3.1 SECONDARY RESEARCH
           2.3.2 PRIMARY RESEARCH
                    2.3.2.1 Primary sources
                    2.3.2.2 Key industry insights
                    2.3.2.3 Breakdown of primaries
                                FIGURE 1 BREAKDOWN OF PRIMARY INTERVIEWS: SUPPLY-SIDE AND DEMAND-SIDE PARTICIPANTS
                                FIGURE 2 BREAKDOWN OF PRIMARY INTERVIEWS: BY COMPANY TYPE, DESIGNATION, AND REGION
    2.4 MARKET SIZE ESTIMATION 
          FIGURE 3 RESEARCH METHODOLOGY: HYPOTHESIS BUILDING
           2.4.1 BOTTOM-UP APPROACH
                    2.4.1.1 Approach 1: Company revenue estimation approach
                    2.4.1.2 Approach 2: Customer-based market estimation
                                FIGURE 4 MEDICAL LASERS MARKET SIZE ESTIMATION: BOTTOM-UP APPROACH
                    2.4.1.3 CAGR projections
                                FIGURE 5 CAGR PROJECTIONS: SUPPLY-SIDE ANALYSIS
    2.5 DATA VALIDATION APPROACH 
          FIGURE 6 DATA TRIANGULATION METHODOLOGY
    2.6 MARKET SHARE ASSESSMENT 
    2.7 STUDY ASSUMPTIONS 
    2.8 RISK ASSESSMENT 
           2.8.1 MEDICAL LASERS INDUSTRY: RISK ASSESSMENT
    2.9 GROWTH RATE ASSUMPTIONS 
 
3 EXECUTIVE SUMMARY (Page No. - 46)
    FIGURE 7 MEDICAL LASERS MARKET, BY TECHNOLOGY, 2023 VS. 2028 (USD MILLION)
    FIGURE 8 MEDICAL LASERS INDUSTRY, BY APPLICATION, 2023 VS. 2028 (USD MILLION)
    FIGURE 9 MEDICAL LASERS INDUSTRY, BY END USER, 2023 VS. 2028 (USD MILLION)
    FIGURE 10 GEOGRAPHICAL SNAPSHOT OF MEDICAL LASERS INDUSTRY
 
4 PREMIUM INSIGHTS (Page No. - 50)
    4.1 MEDICAL LASERS MARKET OVERVIEW 
          FIGURE 11 RISING NUMBER OF NON-SURGICAL COSMETIC PROCEDURES TO DRIVE MARKET
    4.2 SOLID-STATE MEDICAL LASER SYSTEMS MARKET, BY TYPE, 2023 VS. 2028 (USD MILLION) 
          FIGURE 12 ND:YAG LASER SYSTEMS TO DOMINATE MARKET DURING FORECAST PERIOD
    4.3 REGIONAL ANALYSIS: MARKET, BY END USER (2022) 
          FIGURE 13 NORTH AMERICA DOMINATED MARKET FOR ALL END-USER SEGMENTS IN 2022
    4.4 MEDICAL LASERS INDUSTRY: GEOGRAPHIC GROWTH OPPORTUNITIES 
          FIGURE 14 INDIA TO REGISTER HIGHEST GROWTH FOR MEDICAL LASER PRODUCTS DURING FORECAST PERIOD
 
5 MARKET OVERVIEW (Page No. - 53)
    5.1 INTRODUCTION 
    5.2 MARKET DYNAMICS 
          FIGURE 15 MEDICAL LASERS MARKET: DRIVERS, RESTRAINTS, OPPORTUNITIES, AND CHALLENGES
           5.2.1 DRIVERS
                    5.2.1.1 Technological advancements in medical laser technology
                    5.2.1.2 Increasing number of non-surgical cosmetic procedures
                                FIGURE 16 NUMBER OF NON-SURGICAL PROCEDURES PERFORMED GLOBALLY, 2018 VS. 2022
                    5.2.1.3 Rising demand for minimally invasive surgical procedures
                    5.2.1.4 Increasing incidence and prevalence of target diseases
                    5.2.1.5 Favorable reimbursement scenario
                                TABLE 1 REIMBURSEMENT SCENARIO IN US
           5.2.2 RESTRAINTS
                    5.2.2.1 High cost of medical laser products and treatment
                                TABLE 2 SURGEON FEES FOR NON-SURGICAL PROCEDURES WITH MEDICAL LASERS
                                TABLE 3 SURGEON FEES FOR SURGICAL PROCEDURES WITH MEDICAL LASERS
                    5.2.2.2 Stringent safety regulations
           5.2.3 OPPORTUNITIES
                    5.2.3.1 Growth of medical tourism
                    5.2.3.2 Growing applications of laser-based devices in diverse clinical areas
           5.2.4 CHALLENGES
                    5.2.4.1 Risks associated with lasers
    5.3 REGULATORY ANALYSIS 
           5.3.1 KEY REGULATORY BODIES AND GOVERNMENT AGENCIES
                    TABLE 4 NORTH AMERICA: REGULATORY BODIES, GOVERNMENT AGENCIES, AND OTHER ORGANIZATIONS
                    TABLE 5 EUROPE: REGULATORY BODIES, GOVERNMENT AGENCIES, AND OTHER ORGANIZATIONS
                    TABLE 6 ASIA PACIFIC: REGULATORY BODIES, GOVERNMENT AGENCIES, AND OTHER ORGANIZATIONS
                    TABLE 7 REST OF THE WORLD: REGULATORY BODIES, GOVERNMENT AGENCIES, AND OTHER ORGANIZATIONS
    5.4 KEY REGULATORY GUIDELINES 
           5.4.1 US
           5.4.2 CANADA
           5.4.3 UK
           5.4.4 FRANCE
           5.4.5 GERMANY
           5.4.6 CHINA
           5.4.7 INDIA
           5.4.8 BRAZIL
           5.4.9 UAE
    5.5 REIMBURSEMENT SCENARIO 
          TABLE 8 MAJOR CPT CODES FOR LASER PROCEDURES IN THE US
    5.6 SUPPLY CHAIN ANALYSIS 
           5.6.1 PROMINENT COMPANIES
           5.6.2 SMALL AND MEDIUM-SIZED ENTERPRISES
           5.6.3 END USERS
                    FIGURE 17 SUPPLY CHAIN ANALYSIS: MARKET
    5.7 ECOSYSTEM MARKET MAP 
          TABLE 9 MEDICAL LASERS INDUSTRY: ROLE IN ECOSYSTEM
    5.8 PRICING ANALYSIS 
          FIGURE 18 AVERAGE SELLING PRICE TREND OF MEDICAL LASER SYSTEMS, BY TECHNOLOGY
          FIGURE 19 AVERAGE SELLING PRICE TREND OF MEDICAL LASER SYSTEMS, BY REGION
    5.9 TRADE ANALYSIS 
           5.9.1 TRADE ANALYSIS OF MEDICAL LASER SYSTEMS
                    TABLE 10 IMPORT DATA FOR LASER DEVICES (HS CODE 854370), BY COUNTRY, 2018–2022 (USD THOUSAND)
                    TABLE 11 EXPORT DATA FOR LASER DEVICES (HS CODE 854370), BY COUNTRY, 2018–2022 (USD THOUSAND)
                    TABLE 12 IMPORT DATA FOR LASERS (EXCLUDING DIODES) (HS CODE 901320), BY COUNTRY, 2018–2022 (USD THOUSAND)
                    TABLE 13 EXPORT DATA FOR LASERS (EXCLUDING DIODES) (HS CODE 901320), BY COUNTRY, 2018–2022 (USD THOUSAND)
    5.10 PATENT ANALYSIS 
           FIGURE 20 PATENT DETAILS FOR MEDICAL LASERS (JANUARY 2013–NOVEMBER 2023)
    5.11 PORTER’S FIVE FORCE ANALYSIS 
           TABLE 14 PORTER’S FIVE FORCES ANALYSIS: MARKET
           5.11.1 THREAT OF NEW ENTRANTS
           5.11.2 THREAT OF SUBSTITUTES
           5.11.3 BARGAINING POWER OF SUPPLIERS
           5.11.4 BARGAINING POWER OF BUYERS
           5.11.5 INTENSITY OF COMPETITIVE RIVALRY
    5.12 KEY CONFERENCES AND EVENTS IN 2024–2025 
           TABLE 15 LIST OF MAJOR CONFERENCES AND EVENTS IN MARKET IN 2023–2024
    5.13 CASE STUDY ANALYSIS 
           5.13.1 CASE 1: IMPROVED PLATFORMS AND HIGHLY EFFECTIVE SUPPLY CHANNELS
           5.13.2 CASE 2: REVOLUTIONIZING DENTAL CARE – HARNESSING DIODE LASERS FOR MINIMALLY INVASIVE PRECISION
    5.14 TECHNOLOGY ANALYSIS 
    5.15 TRENDS/DISRUPTIONS IMPACTING CUSTOMER’S BUSINESS 
    5.16 EMERGING TECHNOLOGIES 
    5.17 KEY STAKEHOLDERS & BUYING CRITERIA 
           5.17.1 KEY STAKEHOLDERS
                     TABLE 16 CRITICAL STAKEHOLDER REQUIREMENT IN PURCHASE CRITERIA FOR MEDICAL LASER SYSTEMS
    5.18 IMPACT ANALYSIS OF KEY BUYING CRITERIA 
          TABLE 17 KEY REQUIREMENTS OF STAKEHOLDERS ON BUYING CRITERIA AND THEIR IMPACT ON PURCHASE DECISION
    5.19 CUSTOMER UNMET NEEDS AND KEY PAIN POINTS 
 
6 MEDICAL LASERS MARKET, BY TECHNOLOGY (Page No. - 84)
    6.1 INTRODUCTION 
          TABLE 18 MEDICAL LASERS INDUSTRY, BY TECHNOLOGY, 2021–2028 (USD MILLION)
    6.2 SOLID-STATE LASER SYSTEMS 
          TABLE 19 SOLID-STATE LASER SYSTEMS MARKET, BY TYPE, 2021–2028 (USD MILLION)
          TABLE 20 SOLID-STATE LASER SYSTEMS MARKET, BY REGION, 2021–2028 (USD MILLION)
          TABLE 21 SOLID-STATE LASER SYSTEMS MARKET, BY END USER, 2021–2028 (USD MILLION)
           6.2.1 ER:YAG LASER SYSTEMS
                    6.2.1.1 Increasing demand for Er:YAG laser systems in medicine to propel market
                                TABLE 22 ER:YAG LASER SYSTEMS MARKET, BY REGION, 2021–2028 (USD MILLION)
           6.2.2 ND:YAG LASER SYSTEMS
                    6.2.2.1 Exhibit versatility across various disciplines
                                TABLE 23 ND:YAG LASER SYSTEMS MARKET, BY REGION, 2021–2028 (USD MILLION)
           6.2.3 HO:YAG LASER SYSTEMS
                    6.2.3.1 Highly versatile tool in endourology
                                TABLE 24 HO:YAG LASER SYSTEMS MARKET, BY REGION, 2021–2028 (USD MILLION)
           6.2.4 ALEXANDRITE LASER SYSTEMS
                    6.2.4.1 Effective in dermatological procedures to treat pigmented lesions and tattoos
                                TABLE 25 ALEXANDRITE LASER SYSTEMS MARKET, BY REGION, 2021–2028 (USD MILLION)
           6.2.5 OTHER SOLID-STATE LASER SYSTEMS
                    TABLE 26 OTHER SOLID-STATE LASER SYSTEMS MARKET, BY REGION, 2021–2028 (USD MILLION)
    6.3 GAS LASER SYSTEMS 
          TABLE 27 GAS LASER SYSTEMS MARKET, BY TYPE, 2021–2028 (USD MILLION)
          TABLE 28 GAS LASER SYSTEMS MARKET, BY REGION, 2021–2028 (USD MILLION)
          TABLE 29 GAS LASER SYSTEMS MARKET, BY END USER, 2021–2028 (USD MILLION)
           6.3.1 CO2 LASER SYSTEMS
                    6.3.1.1 Minimal postoperative swelling and reduced risk of tissue scarring to support market growth
                                TABLE 30 CO2 LASER SYSTEMS MARKET, BY REGION, 2021–2028 (USD MILLION)
           6.3.2 ARGON LASER SYSTEMS
                    6.3.2.1 Rising popularity of argon-based laser systems in medical field to favor market growth
                                TABLE 31 ARGON LASER SYSTEMS MARKET, BY REGION, 2021–2028 (USD MILLION)
           6.3.3 KRYPTON LASER SYSTEMS
                    6.3.3.1 Involve an external light source to excite krypton atoms to higher energy states
                                TABLE 32 KRYPTON LASER SYSTEMS MARKET, BY REGION, 2021–2028 (USD MILLION)
           6.3.4 EXCIMER LASER SYSTEMS
                    6.3.4.1 Expansion and advancements in industrial applications to drive growth
                                TABLE 33 EXCIMER LASER SYSTEMS MARKET, BY REGION, 2021–2028 (USD MILLION)
           6.3.5 OTHER GAS LASER SYSTEMS
                    TABLE 34 OTHER GAS LASER SYSTEMS MARKET, BY REGION, 2021–2028 (USD MILLION)
    6.4 PULSED DYE LASER SYSTEMS 
           6.4.1 INCREASING NUMBER OF DERMATOLOGY AND COSMETIC SURGERY TREATMENT PROCEDURES TO DRIVE MARKET
                    TABLE 35 PULSED DYE LASER SYSTEMS MARKET, BY REGION, 2021–2028 (USD MILLION)
                    TABLE 36 PULSED DYE LASER SYSTEMS MARKET, BY END USER, 2021–2028 (USD MILLION)
    6.5 DIODE LASER SYSTEMS 
           6.5.1 TECHNOLOGICAL ADVANCEMENTS IN SEMICONDUCTOR DIODES TO SUPPORT MARKET GROWTH
                    TABLE 37 DIODE LASER SYSTEMS MARKET, BY REGION, 2021–2028 (USD MILLION)
                    TABLE 38 DIODE LASER SYSTEMS MARKET, BY END USER, 2021–2028 (USD MILLION)
    6.6 OTHER TECHNOLOGIES 
          TABLE 39 MARKET FOR OTHER TECHNOLOGIES, BY REGION, 2021–2028 (USD MILLION)
          TABLE 40 MARKET FOR OTHER TECHNOLOGIES, BY END USER, 2021–2028 (USD MILLION)
 
7 MEDICAL LASERS MARKET, BY APPLICATION (Page No. - 105)
    7.1 INTRODUCTION 
          TABLE 41 MEDICAL LASERS INDUSTRY, BY APPLICATION, 2021–2028 (USD MILLION)
    7.2 AESTHETIC/COSMETIC APPLICATIONS 
          TABLE 42 MARKET FOR AESTHETIC/COSMETIC APPLICATIONS, BY TYPE, 2021–2028 (USD MILLION)
           7.2.1 HAIR REMOVAL
                    7.2.1.1 Laser hair removal gained traction in emerging economies
                                TABLE 43 TOP FIVE COUNTRIES PERFORMING HAIR REMOVAL TREATMENT
                                TABLE 44 MARKET FOR HAIR REMOVAL, BY REGION, 2021–2028 (USD MILLION)
           7.2.2 TATTOO REMOVAL
                    7.2.2.1 Improved safety and efficacy of tattoo removal procedures to drive market
                                TABLE 45 MARKET FOR TATTOO REMOVAL, BY REGION, 2021–2028 (USD MILLION)
           7.2.3 ACNE AND SCAR REMOVAL
                    7.2.3.1 Rising population and expanded portfolio of acne and scar removal devices to drive market
                                TABLE 46 MARKET FOR ACNE AND SCAR REMOVAL, BY REGION, 2021–2028 (USD MILLION)
           7.2.4 OTHER AESTHETIC APPLICATIONS
                    TABLE 47 MARKET FOR OTHER AESTHETIC APPLICATIONS, BY REGION, 2021–2028 (USD MILLION)
    7.3 DERMATOLOGY APPLICATIONS 
           7.3.1 GROWING ADOPTION OF LASER ABLATION IN AESTHETIC APPLICATIONS TO SUPPORT MARKET GROWTH
                    TABLE 48 MARKET FOR DERMATOLOGY APPLICATIONS, BY REGION, 2021–2028 (USD MILLION)
    7.4 DENTAL APPLICATIONS 
           7.4.1 TECHNOLOGICAL ADVANTAGES IN LASER-ASSISTED DENTAL SURGERIES TO SUPPORT MARKET GROWTH
                    TABLE 49 MARKET FOR DENTAL APPLICATIONS, BY REGION, 2021–2028 (USD MILLION)
    7.5 UROLOGY APPLICATIONS 
           7.5.1 INCREASING INCIDENCE OF UROLOGICAL DISORDERS TO DRIVE MARKET
                    TABLE 50 MARKET FOR UROLOGY APPLICATIONS, BY REGION, 2021–2028 (USD MILLION)
    7.6 OPHTHALMOLOGY APPLICATIONS 
           7.6.1 RISING DEMAND IN LASER-ASSISTED OPHTHALMIC SURGERIES TO DRIVE MARKET
                    TABLE 51 MARKET FOR OPHTHALMOLOGY APPLICATIONS, BY REGION, 2021–2028 (USD MILLION)
    7.7 OB/GYN APPLICATIONS 
           7.7.1 RISING INCIDENCE OF GYNECOLOGICAL DISORDERS TO DRIVE MARKET
                    TABLE 52 MAJOR LASER TECHNOLOGIES USED FOR GYNECOLOGICAL APPLICATIONS
                    TABLE 53 MARKET FOR OB/GYN APPLICATIONS, BY REGION, 2021–2028 (USD MILLION)
    7.8 ONCOLOGY APPLICATIONS 
           7.8.1 RISING PREVALENCE OF CANCER TO DRIVE MARKET
                    FIGURE 21 NUMBER OF NEW CANCER CASES, 2023
                    FIGURE 22 NUMBER OF CANCER DEATHS, 2023
                    TABLE 54 MARKET FOR ONCOLOGY APPLICATIONS, BY REGION, 2021–2028 (USD MILLION)
    7.9 CARDIOVASCULAR APPLICATIONS 
           7.9.1 RISING INCLINATION AMONG PATIENTS TOWARD MINIMALLY INVASIVE PROCEDURES TO SUPPORT MARKET GROWTH
                    TABLE 55 MARKET FOR CARDIOVASCULAR APPLICATIONS, BY REGION, 2021–2028 (USD MILLION)
    7.10 OTHER APPLICATIONS 
           TABLE 56 MARKET FOR OTHER APPLICATIONS, BY REGION, 2021–2028 (USD MILLION)
 
8 MEDICAL LASERS MARKET, BY END USER (Page No. - 124)
    8.1 INTRODUCTION 
          TABLE 57 MEDICAL LASERS INDUSTRY, BY END USER, 2021–2028 (USD MILLION)
    8.2 HOSPITALS AND SURGICAL CENTERS 
           8.2.1 INCREASING OUTSOURCING OF MEDICAL LASER TREATMENT TO HOSPITALS AND SURGICAL CENTERS TO DRIVE GROWTH
                    TABLE 58 MARKET FOR HOSPITALS AND SURGICAL CENTERS, BY REGION, 2021–2028 (USD MILLION)
    8.3 DERMATOLOGY AND DENTAL CLINICS 
           8.3.1 INCREASING NUMBER OF DERMATOLOGY AND DENTAL CLINICS TO SUPPORT MARKET GROWTH
                    TABLE 59 MARKET FOR DERMATOLOGY AND DENTAL CLINICS, BY REGION, 2021–2028 (USD MILLION)
    8.4 MEDICAL AND BEAUTY SPAS 
           8.4.1 INCREASING DEMAND FOR COSMETIC AND AESTHETIC TREATMENTS TO DRIVE ADOPTION
                    TABLE 60 MARKET FOR MEDICAL AND BEAUTY SPAS, BY REGION, 2021–2028 (USD MILLION)
    8.5 HOME USE AND SELF-CARE 
           8.5.1 GROWING FOCUS ON INNOVATIVE MEDICAL AESTHETICS TREATMENT TO DRIVE MARKET
                    TABLE 61 MARKET FOR HOME USE AND SELF-CARE, BY REGION, 2021–2028 (USD MILLION)
    8.6 OTHER END USERS 
          TABLE 62 MARKET FOR OTHER END USERS, BY REGION, 2021–2028 (USD MILLION)
 
9 MEDICAL LASERS MARKET, BY REGION (Page No. - 131)
    9.1 INTRODUCTION 
          TABLE 63 MEDICAL LASERS MARKET, BY REGION, 2021–2028 (USD MILLION)
    9.2 NORTH AMERICA 
           9.2.1 RECESSION IMPACT ON NORTH AMERICAN MEDICAL LASERS MARKET
                    FIGURE 23 NORTH AMERICA: MARKET SNAPSHOT
                    TABLE 64 NORTH AMERICA: MEDICAL LASERS INDUSTRY, BY COUNTRY, 2021–2028 (USD MILLION)
                    TABLE 65 NORTH AMERICA: MARKET, BY TECHNOLOGY, 2021–2028 (USD MILLION)
                    TABLE 66 NORTH AMERICA: SOLID-STATE LASER SYSTEMS MARKET, BY TYPE, 2021–2028 (USD MILLION)
                    TABLE 67 NORTH AMERICA: GAS LASER SYSTEMS MARKET, BY TYPE, 2021–2028 (USD MILLION)
                    TABLE 68 NORTH AMERICA: LASERS MARKET, BY APPLICATION, 2021–2028 (USD MILLION)
                    TABLE 69 NORTH AMERICA: MEDICAL LASERS MARKET, BY END USER, 2021–2028 (USD MILLION)
           9.2.2 US
                    9.2.2.1 Presence of developed healthcare system and numerous established medical laser companies to drive market
                                TABLE 70 US: NUMBER OF MEDICAL LASER PROCEDURES, 2018–2022
                                TABLE 71 US: MEDICAL LASERS MARKET, BY TECHNOLOGY, 2021–2028 (USD MILLION)
                                TABLE 72 US: SOLID-STATE LASER SYSTEMS MARKET, BY TYPE, 2021–2028 (USD MILLION)
                                TABLE 73 US: GAS LASER SYSTEMS MARKET, BY TYPE, 2021–2028 (USD MILLION)
           9.2.3 CANADA
                    9.2.3.1 Increased awareness about noninvasive laser procedures to drive market
                                TABLE 74 CANADA: MEDICAL LASERS MARKET, BY TECHNOLOGY, 2021–2028 (USD MILLION)
                                TABLE 75 CANADA: SOLID-STATE LASER SYSTEMS MARKET, BY TYPE, 2021–2028 (USD MILLION)
                                TABLE 76 CANADA: GAS LASER SYSTEMS MARKET, BY TYPE, 2021–2028 (USD MILLION)
    9.3 EUROPE 
           9.3.1 RECESSION IMPACT ON EUROPEAN MEDICAL LASERS MARKET
                    TABLE 77 EUROPE: MARKET, BY COUNTRY, 2021–2028 (USD MILLION)
                    TABLE 78 EUROPE: MARKET, BY TECHNOLOGY, 2021–2028 (USD MILLION)
                    TABLE 79 EUROPE: SOLID-STATE LASER SYSTEMS MARKET, BY TYPE, 2021–2028 (USD MILLION)
                    TABLE 80 EUROPE: GAS LASER SYSTEMS MARKET, BY TYPE, 2021–2028 (USD MILLION)
                    TABLE 81 EUROPE: MARKET, BY APPLICATION, 2021–2028 (USD MILLION)
                    TABLE 82 EUROPE: MEDICAL LASERS MARKET, BY END USER, 2021–2028 (USD MILLION)
           9.3.2 GERMANY
                    9.3.2.1 Increasing research on laser-assisted surgical procedures to propel market
                                TABLE 83 GERMANY: MEDICAL LASERS MARKET, BY TECHNOLOGY, 2021–2028 (USD MILLION)
                                TABLE 84 GERMANY: SOLID-STATE LASER SYSTEMS MARKET, BY TYPE, 2021–2028 (USD MILLION)
                                TABLE 85 GERMANY: GAS LASER SYSTEMS MARKET, BY TYPE, 2021–2028 (USD MILLION)
           9.3.3 FRANCE
                    9.3.3.1 Stringent government regulations related to cosmetic surgeries to limit market
                                TABLE 86 FRANCE: MEDICAL LASERS MARKET, BY TECHNOLOGY, 2021–2028 (USD MILLION)
                                TABLE 87 FRANCE: SOLID-STATE LASER SYSTEMS MARKET, BY TYPE, 2021–2028 (USD MILLION)
                                TABLE 88 FRANCE: GAS LASER SYSTEMS MARKET, BY TYPE, 2021–2028 (USD MILLION)
           9.3.4 UK
                    9.3.4.1 Increasing number of cosmetic surgeries to support market growth
                                TABLE 89 UK: MEDICAL LASERS MARKET, BY TECHNOLOGY, 2021–2028 (USD MILLION)
                                TABLE 90 UK: SOLID-STATE LASER SYSTEMS MARKET, BY TYPE, 2021–2028 (USD MILLION)
                                TABLE 91 UK: GAS LASER SYSTEMS MARKET, BY TYPE, 2021–2028 (USD MILLION)
           9.3.5 ITALY
                    9.3.5.1 Growing medical tourism to drive market
                                TABLE 92 ITALY: NUMBER OF MEDICAL LASER PROCEDURES, 2018–2022
                                TABLE 93 ITALY: MEDICAL LASERS MARKET, BY TECHNOLOGY, 2021–2028 (USD MILLION)
                                TABLE 94 ITALY: SOLID-STATE LASER SYSTEMS MARKET, BY TYPE, 2021–2028 (USD MILLION)
                                TABLE 95 ITALY: GAS LASER SYSTEMS MARKET, BY TYPE, 2021–2028 (USD MILLION)
           9.3.6 SPAIN
                    9.3.6.1 Growing demand for cosmetic procedures and rising availability of safe, minimally invasive treatment procedures to drive market
                                TABLE 96 SPAIN: MEDICAL LASERS MARKET, BY TECHNOLOGY, 2021–2028 (USD MILLION)
                                TABLE 97 SPAIN: SOLID-STATE LASER SYSTEMS MARKET, BY TYPE, 2021–2028 (USD MILLION)
                                TABLE 98 SPAIN: GAS LASER SYSTEMS MARKET, BY TYPE, 2021–2028 (USD MILLION)                    9.3.2.1 Increasing research on laser-assisted surgical procedures to propel market
                                TABLE 83 GERMANY: MEDICAL LASERS INDUSTRY, BY TECHNOLOGY, 2021–2028 (USD MILLION)
                                TABLE 84 GERMANY: SOLID-STATE LASER SYSTEMS MARKET, BY TYPE, 2021–2028 (USD MILLION)
                                TABLE 85 GERMANY: GAS LASER SYSTEMS MARKET, BY TYPE, 2021–2028 (USD MILLION)
           9.3.3 FRANCE
                    9.3.3.1 Stringent government regulations related to cosmetic surgeries to limit market
                                TABLE 86 FRANCE: MEDICAL LASERS MARKET, BY TECHNOLOGY, 2021–2028 (USD MILLION)
                                TABLE 87 FRANCE: SOLID-STATE LASER SYSTEMS MARKET, BY TYPE, 2021–2028 (USD MILLION)
                                TABLE 88 FRANCE: GAS LASER SYSTEMS MARKET, BY TYPE, 2021–2028 (USD MILLION)
           9.3.4 UK
                    9.3.4.1 Increasing number of cosmetic surgeries to support market growth
                                TABLE 89 UK: MEDICAL LASERS MARKET, BY TECHNOLOGY, 2021–2028 (USD MILLION)
                                TABLE 90 UK: SOLID-STATE LASER SYSTEMS MARKET, BY TYPE, 2021–2028 (USD MILLION)
                                TABLE 91 UK: GAS LASER SYSTEMS MARKET, BY TYPE, 2021–2028 (USD MILLION)
           9.3.5 ITALY
                    9.3.5.1 Growing medical tourism to drive market
                                TABLE 92 ITALY: NUMBER OF MEDICAL LASER PROCEDURES, 2018–2022
                                TABLE 93 ITALY: MEDICAL LASERS MARKET, BY TECHNOLOGY, 2021–2028 (USD MILLION)
                                TABLE 94 ITALY: SOLID-STATE LASER SYSTEMS MARKET, BY TYPE, 2021–2028 (USD MILLION)
                                TABLE 95 ITALY: GAS LASER SYSTEMS MARKET, BY TYPE, 2021–2028 (USD MILLION)
           9.3.6 SPAIN
                    9.3.6.1 Growing demand for cosmetic procedures and rising availability of safe, minimally invasive treatment procedures to drive market
                                TABLE 96 SPAIN: MEDICAL LASERS MARKET, BY TECHNOLOGY, 2021–2028 (USD MILLION)
                                TABLE 97 SPAIN: SOLID-STATE LASER SYSTEMS MARKET, BY TYPE, 2021–2028 (USD MILLION)
                                TABLE 98 SPAIN: GAS LASER SYSTEMS MARKET, BY TYPE, 2021–2028 (USD MILLION)
           9.3.7 REST OF EUROPE
                    TABLE 99 REST OF EUROPE: MEDICAL LASERS MARKET, BY TECHNOLOGY, 2021–2028 (USD MILLION)
                    TABLE 100 REST OF EUROPE: SOLID-STATE LASER SYSTEMS MARKET, BY TYPE, 2021–2028 (USD MILLION)
                    TABLE 101 REST OF EUROPE: GAS LASER SYSTEMS MARKET, BY TYPE, 2021–2028 (USD MILLION)
    9.4 ASIA PACIFIC 
          TABLE 102 ASIA PACIFIC: NUMBER OF MEDICAL PROCEDURES, BY COUNTRY, 2022
           9.4.1 RECESSION IMPACT ON ASIA PACIFIC MEDICAL LASERS MARKET
                    FIGURE 24 ASIA PACIFIC: MEDICAL LASERS INDUSTRY SNAPSHOT
                    TABLE 103 ASIA PACIFIC: MARKET, BY COUNTRY, 2021–2028 (USD MILLION)
                    TABLE 104 ASIA PACIFIC: MARKET, BY TECHNOLOGY, 2021–2028 (USD MILLION)
                    TABLE 105 ASIA PACIFIC: SOLID-STATE LASER SYSTEMS MARKET, BY TYPE, 2021–2028 (USD MILLION)
                    TABLE 106 ASIA PACIFIC: GAS LASER SYSTEMS MARKET, BY TYPE, 2021–2028 (USD MILLION)
                    TABLE 107 ASIA PACIFIC: MEDICAL LASERS INDUSTRY, BY APPLICATION, 2021–2028 (USD MILLION)
                    TABLE 108 ASIA PACIFIC: MARKET, BY END USER, 2021–2028 (USD MILLION)
           9.4.2 JAPAN
                    9.4.2.1 Faster implementation of innovative technologies to drive market
                                TABLE 109 JAPAN: MEDICAL LASERS MARKET, BY TECHNOLOGY, 2021–2028 (USD MILLION)
                                TABLE 110 JAPAN: SOLID-STATE LASER SYSTEMS MARKET, BY TYPE, 2021–2028 (USD MILLION)
                                TABLE 111 JAPAN: GAS LASER SYSTEMS MARKET, BY TYPE, 2021–2028 (USD MILLION)
           9.4.3 CHINA
                    9.4.3.1 Rise in accessibility of laser surgery apps and online services to support market growth
                                TABLE 112 CHINA: MEDICAL LASERS MARKET, BY TECHNOLOGY, 2021–2028 (USD MILLION)
                                TABLE 113 CHINA: SOLID-STATE LASER SYSTEMS MARKET, BY TYPE, 2021–2028 (USD MILLION)
                                TABLE 114 CHINA: GAS LASER SYSTEMS MARKET, BY TYPE, 2021–2028 (USD MILLION)
           9.4.4 INDIA
                    9.4.4.1 Increasing incidence of target diseases to drive demand
                                TABLE 115 INDIA: MEDICAL LASERS MARKET, BY TECHNOLOGY, 2021–2028 (USD MILLION)
                                TABLE 116 INDIA: SOLID-STATE LASER SYSTEMS MARKET, BY TYPE, 2021–2028 (USD MILLION)
                                TABLE 117 INDIA: GAS LASER SYSTEMS MARKET, BY TYPE, 2021–2028 (USD MILLION)
           9.4.5 AUSTRALIA
                    9.4.5.1 Rising demand for noninvasive procedures to propel market
                                TABLE 118 AUSTRALIA: MEDICAL LASERS MARKET, BY TECHNOLOGY, 2021–2028 (USD MILLION)
                                TABLE 119 AUSTRALIA: SOLID-STATE LASER SYSTEMS MARKET, BY TYPE, 2021–2028 (USD MILLION)
                                TABLE 120 AUSTRALIA: GAS LASER SYSTEMS MARKET, BY TYPE, 2021–2028 (USD MILLION)
           9.4.6 SOUTH KOREA
                    9.4.6.1 Increasing demand for medical laser treatments to drive market
                                TABLE 121 SOUTH KOREA: MEDICAL LASERS MARKET, BY TECHNOLOGY, 2021–2028 (USD MILLION)
                                TABLE 122 SOUTH KOREA: SOLID-STATE LASER SYSTEMS MARKET, BY TYPE, 2021–2028 (USD MILLION)
                                TABLE 123 SOUTH KOREA: GAS LASER SYSTEMS MARKET, BY TYPE, 2021–2028 (USD MILLION)
           9.4.7 REST OF ASIA PACIFIC
                    TABLE 124 REST OF ASIA PACIFIC: MEDICAL LASERS MARKET, BY TECHNOLOGY, 2021–2028 (USD MILLION)
                    TABLE 125 REST OF ASIA PACIFIC: SOLID-STATE LASER SYSTEMS MARKET, BY TYPE, 2021–2028 (USD MILLION)
                    TABLE 126 REST OF ASIA PACIFIC: GAS LASER SYSTEMS MARKET, BY TYPE, 2021–2028 (USD MILLION)
    9.5 LATIN AMERICA 
           9.5.1 RECESSION IMPACT ON LATIN AMERICAN MEDICAL LASERS MARKET
                    TABLE 127 LATIN AMERICA: MEDICAL LASERS INDUSTRY, BY COUNTRY, 2021–2028 (USD MILLION)
                    TABLE 128 LATIN AMERICA: MARKET, BY TECHNOLOGY, 2021–2028 (USD MILLION)
                    TABLE 129 LATIN AMERICA: SOLID-STATE LASER SYSTEMS MARKET, BY TYPE, 2021–2028 (USD MILLION)
                    TABLE 130 LATIN AMERICA: GAS LASER SYSTEMS MARKET, BY TYPE, 2021–2028 (USD MILLION)
                    TABLE 131 LATIN AMERICA: MARKET, BY APPLICATION, 2021–2028 (USD MILLION)
                    TABLE 132 LATIN AMERICA: MEDICAL LASERS INDUSTRY, BY END USER, 2021–2028 (USD MILLION)
           9.5.2 BRAZIL
                    9.5.2.1 Increased awareness of advanced laser procedures to drive market
                                TABLE 133 BRAZIL: NUMBER OF MEDICAL AESTHETIC PROCEDURES, 2022
                                TABLE 134 BRAZIL: MEDICAL LASERS MARKET, BY TECHNOLOGY, 2021–2028 (USD MILLION)
                                TABLE 135 BRAZIL: SOLID-STATE LASER SYSTEMS MARKET, BY TYPE, 2021–2028 (USD MILLION)
                                TABLE 136 BRAZIL: GAS LASER SYSTEMS MARKET, BY TYPE, 2021–2028 (USD MILLION)
           9.5.3 MEXICO
                    9.5.3.1 Increase in patient inflow for laser treatment procedures to drive market
                                TABLE 137 MEXICO: NUMBER OF MEDICAL PROCEDURES, 2022
                                TABLE 138 MEXICO: MEDICAL LASERS MARKET, BY TECHNOLOGY, 2021–2028 (USD MILLION)
                                TABLE 139 MEXICO: SOLID-STATE LASER SYSTEMS MARKET, BY TYPE, 2021–2028 (USD MILLION)
                                TABLE 140 MEXICO: GAS LASER SYSTEMS MARKET, BY TYPE, 2021–2028 (USD MILLION)
           9.5.4 REST OF LATIN AMERICA
                    TABLE 141 REST OF LATIN AMERICA: MEDICAL LASERS MARKET, BY TECHNOLOGY, 2021–2028 (USD MILLION)
                    TABLE 142 REST OF LATIN AMERICA: SOLID-STATE LASER SYSTEMS MARKET, BY TYPE, 2021–2028 (USD MILLION)
                    TABLE 143 REST OF LATIN AMERICA: GAS LASER SYSTEMS MARKET, BY TYPE, 2021–2028 (USD MILLION)
    9.6 MIDDLE EAST & AFRICA 
           9.6.1 GROWING DEMAND FOR AESTHETIC TREATMENTS TO DRIVE MARKET
           9.6.2 RECESSION IMPACT ON MIDDLE EAST & AFRICAN MEDICAL LASERS MARKET
                    TABLE 144 MIDDLE EAST & AFRICA: MEDICAL LASERS INDUSTRY, BY TECHNOLOGY, 2021–2028 (USD MILLION)
                    TABLE 145 MIDDLE EAST & AFRICA: SOLID-STATE LASER SYSTEMS MARKET, BY TYPE, 2021–2028 (USD MILLION)
                    TABLE 146 MIDDLE EAST & AFRICA: GAS LASER SYSTEMS MARKET, BY TYPE, 2021–2028 (USD MILLION)
                    TABLE 147 MIDDLE EAST & AFRICA: MEDICAL LASERS INDUSTRY, BY APPLICATION, 2021–2028 (USD MILLION)
                    TABLE 148 MIDDLE EAST & AFRICA: MEDICAL LASERS INDUSTRY, BY END USER, 2021–2028 (USD MILLION)
 
10 COMPETITIVE LANDSCAPE (Page No. - 192)
     10.1 OVERVIEW 
     10.2 STRATEGIES ADOPTED BY KEY PLAYERS 
             10.2.1 OVERVIEW OF STRATEGIES ADOPTED BY PLAYERS IN MEDICAL LASERS MARKET
                        TABLE 149 OVERVIEW OF STRATEGIES DEPLOYED BY KEY MANUFACTURING COMPANIES
     10.3 REVENUE SHARE ANALYSIS 
             FIGURE 25 REVENUE SHARE ANALYSIS OF TOP PLAYERS IN MEDICAL LASERS INDUSTRY, 2020–2022 (USD MILLION)
     10.4 MARKET SHARE ANALYSIS 
             10.4.1 DENTAL PRODUCTS MARKET SHARE
                        FIGURE 26 DENTAL PRODUCTS MARKET SHARE, BY KEY PLAYER, 2022
             10.4.2 AESTHETIC AND DERMATOLOGY PRODUCTS MARKET SHARE
                        FIGURE 27 AESTHETIC AND DERMATOLOGY PRODUCTS MARKET SHARE, BY KEY PLAYER, 2022
             10.4.3 OPHTHALMOLOGY PRODUCTS MARKET SHARE
                        FIGURE 28 OPHTHALMOLOGY PRODUCTS MARKET SHARE, BY KEY PLAYER, 2022
                        TABLE 150 MEDICAL LASERS INDUSTRY: DEGREE OF COMPETITION
     10.5 COMPANY EVALUATION MATRIX 
             10.5.1 STARS
             10.5.2 EMERGING LEADERS
             10.5.3 PERVASIVE PLAYERS
             10.5.4 PARTICIPANTS
                        FIGURE 29 MEDICAL LASERS INDUSTRY: COMPANY EVALUATION MATRIX, 2022
     10.6 STARTUP/SME EVALUATION MATRIX 
             10.6.1 PROGRESSIVE COMPANIES
             10.6.2 RESPONSIVE COMPANIES
             10.6.3 DYNAMIC COMPANIES
             10.6.4 STARTING BLOCKS
                        FIGURE 30 MEDICAL LASERS INDUSTRY: STARTUP/SME EVALUATION MATRIX, 2022
     10.7 COMPETITIVE BENCHMARKING 
             10.7.1 PRODUCT AND REGIONAL FOOTPRINT ANALYSIS
                        TABLE 151 TECHNOLOGY AND REGIONAL FOOTPRINT ANALYSIS OF TOP PLAYERS IN MEDICAL LASERS INDUSTRY
                        TABLE 152 TECHNOLOGY FOOTPRINT
                        TABLE 153 REGIONAL FOOTPRINT
     10.8 COMPETITIVE SCENARIO AND TRENDS 
             10.8.1 PRODUCT LAUNCHES & APPROVALS (JANUARY 2020–NOVEMBER 2023)
             10.8.2 DEALS (JANUARY 2020–NOVEMBER 2023)
 
11 COMPANY PROFILES (Page No. - 210)
     11.1 KEY PLAYERS 
(Business Overview, Products/Services/Solutions Offered, MnM View, Key Strengths and Right to Win, Strategic Choices Made, Weaknesses and Competitive Threats, Recent Developments)*
             11.1.1 BOSTON SCIENTIFIC CORPORATION
                        TABLE 154 BOSTON SCIENTIFIC CORPORATION: COMPANY OVERVIEW
                        FIGURE 31 BOSTON SCIENTIFIC CORPORATION: COMPANY SNAPSHOT (2022)
             11.1.2 JOHNSON & JOHNSON VISION CARE, INC.
                        TABLE 155 JOHNSON & JOHNSON VISION CARE, INC.: COMPANY OVERVIEW
                        FIGURE 32 JOHNSON & JOHNSON SERVICES, INC.: COMPANY SNAPSHOT (2022)
             11.1.3 ALCON INC.
                        TABLE 156 ALCON INC.: COMPANY OVERVIEW
                        FIGURE 33 ALCON INC.: COMPANY SNAPSHOT (2022)
             11.1.4 CYNOSURE
                        TABLE 157 CYNOSURE: COMPANY OVERVIEW
             11.1.5 CARL ZEISS MEDITEC AG
                        TABLE 158 CARL ZEISS MEDITEC AG: COMPANY OVERVIEW
                        FIGURE 34 CARL ZEISS MEDITEC AG: COMPANY SNAPSHOT (2022)
             11.1.6 CANDELA CORPORATION
                        TABLE 159 CANDELA CORPORATION: COMPANY OVERVIEW
             11.1.7 LUMENIS BE LTD.
                        TABLE 160 LUMENIS BE LTD.: COMPANY OVERVIEW
             11.1.8 CUTERA, INC.
                        TABLE 161 CUTERA, INC.: COMPANY OVERVIEW
                        FIGURE 35 CUTERA, INC: COMPANY SNAPSHOT (2022)
             11.1.9 BAUSCH HEALTH COMPANIES INC.
                        TABLE 162 BAUSCH HEALTH COMPANIES INC.: COMPANY OVERVIEW
                        FIGURE 36 BAUSCH HEALTH COMPANIES INC.: COMPANY SNAPSHOT (2022)
             11.1.10 EL.EN. S.P.A.
                        TABLE 163 EL.EN. S.P.A.: COMPANY OVERVIEW
                        FIGURE 37 EL.EN. S.P.A.: COMPANY SNAPSHOT (2022)
             11.1.11 ALMA LASERS
                        TABLE 164 ALMA LASERS: COMPANY OVERVIEW
                        FIGURE 38 SISRAM MEDICAL LTD.: COMPANY SNAPSHOT (2022)
             11.1.12 FOTONA
                        TABLE 165 FOTONA: COMPANY OVERVIEW
             11.1.13 AEROLASE CORP.
                        TABLE 166 AEROLASE CORP.: COMPANY OVERVIEW
             11.1.14 SCITON
                        TABLE 167 SCITON: COMPANY OVERVIEW
             11.1.15 LUTRONIC
                        TABLE 168 LUTRONIC: COMPANY OVERVIEW
             11.1.16 IPG PHOTONICS CORPORATION
                        TABLE 169 IPG PHOTONICS CORPORATION: COMPANY OVERVIEW
                        FIGURE 39 IPG PHOTONICS CORPORATION: COMPANY SNAPSHOT (2022)
             11.1.17 BISON MEDICAL.
                        TABLE 170 BISON MEDICAL: COMPANY OVERVIEW
             11.1.18 AMD LASERS
                        TABLE 171 AMD LASERS: COMPANY OVERVIEW
*Business Overview, Products/Services/Solutions Offered, MnM View, Key Strengths and Right to Win, Strategic Choices Made, Weaknesses and Competitive Threats, Recent Developments might not be captured in case of unlisted companies.
     11.2 OTHER PLAYERS 
             11.2.1 ZOLAR TECHNOLOGY & MFG. CO. INC.
             11.2.2 IRIDEX CORPORATION
             11.2.3 SHARPLIGHT TECHNOLOGIES INC.
             11.2.4 EUFOTON S.R.L.
             11.2.5 A.R.C. LASER GMBH
             11.2.6 OMNIGUIDE HOLDINGS, INC.
             11.2.7 AMPLITUDE LASER
             11.2.8 AKELA LASER CORPORATION
             11.2.9 LASOS LASERTECHNIK GMBH
             11.2.10 LIGHT INSTRUMENTS LTD.
 
12 APPENDIX (Page No. - 267)
     12.1 DISCUSSION GUIDE 
     12.2 KNOWLEDGESTORE: MARKETSANDMARKETS’ SUBSCRIPTION PORTAL 
     12.3 CUSTOMIZATION OPTIONS 
     12.4 RELATED REPORTS 
     12.5 AUTHOR DETAILS 

The study involved four major activities in estimating the current size of the medical laser market. Exhaustive secondary research was done to collect information on the market, peer, and parent markets. The next step was to validate these findings, assumptions, and sizing with industry experts across the value chain through primary research. Both top-down and bottom-up approaches were employed to estimate the complete market size. After that, market breakdown and data triangulation were used to estimate the market size of segments and subsegments.

Secondary Research

The secondary research process involves the widespread use of secondary sources, directories, databases (such as Bloomberg Businessweek, Factiva, and D&B Hoovers), white papers, annual reports, company house documents, investor presentations, and SEC filings of companies. Secondary research was used to identify and collect information useful for the extensive, technical, market-oriented, and commercial medical lasers market study. It was also used to obtain important information about the key players and market classification & segmentation according to industry trends to the bottom-most level and key developments related to market and technology perspectives. A database of the key industry leaders was also prepared using secondary research.

Primary Research

In the primary research process, various supply and demand sources were interviewed to obtain qualitative and quantitative information for this report. The primary sources from the supply side include industry experts such as CEOs, vice presidents, marketing and sales directors, technology & innovation directors, and related key executives from various key companies and organizations in the medical lasers market. The primary sources from the demand side include medical OEMs, CDMOs, and service providers. Primary research was conducted to validate the market segmentation, identify key players, and gather insights on key industry trends & key market dynamics.

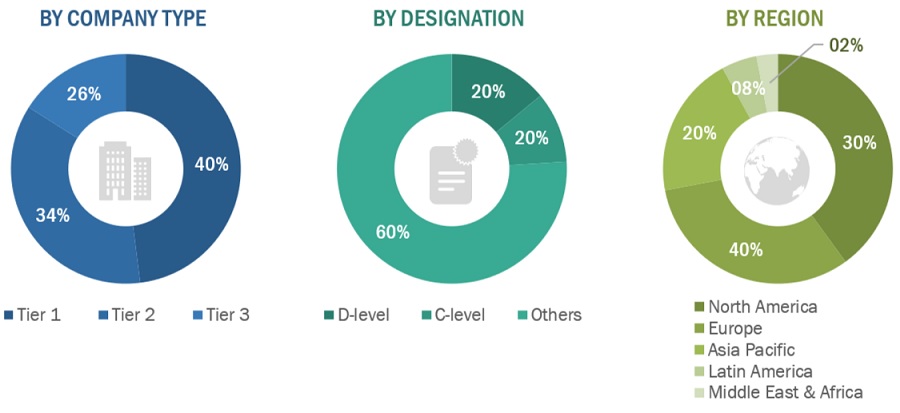
A breakdown of the primary respondents is provided below:
Medical Lasers Market Size, and Share

*Others include sales managers, marketing managers, business development managers, product managers, distributors, and suppliers.

Note: Companies are classified into tiers based on their total revenue. As of 2021, Tier 1 = >USD 1,000 million, Tier 2 = USD 500–1,000 million, and Tier 3 = <USD 500 million.

To know about the assumptions considered for the study, download the pdf brochure

Market Estimation Methodology

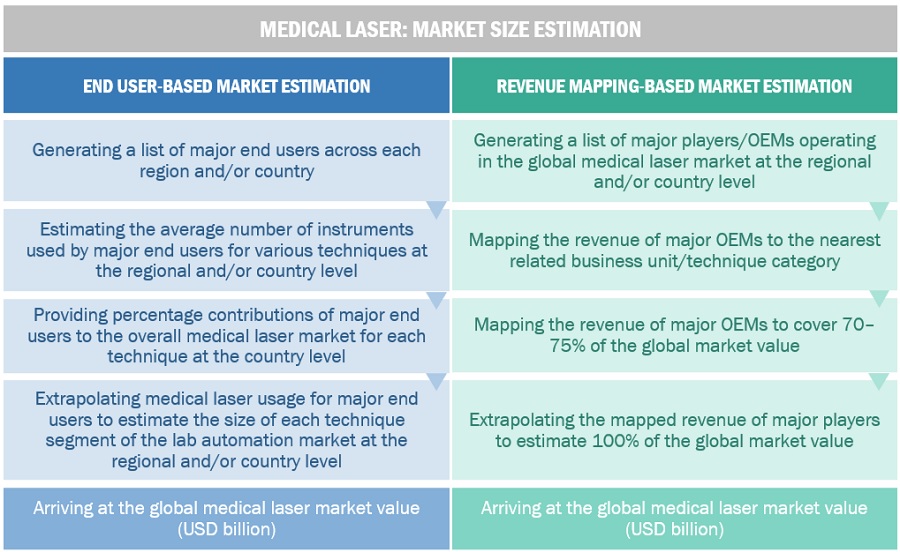
In this report, the size of the medical lasers market’s size was determined using the revenue share analysis of leading players. For this purpose, key players in the market were identified, and their revenues from the market business were determined through various insights gathered during the primary and secondary research phases. Secondary research included the study of the annual and financial reports of the top market players. In contrast, primary research included extensive interviews with key opinion leaders, such as CEOs, directors, and key marketing executives.

Segmental revenues were calculated based on the revenue mapping of major solution/service providers to calculate the global market value. This process involved the following steps:

  • Generating a list of major global players operating in the medical lasers market.
  • Mapping annual revenues generated by major global players from the product segment (or nearest reported business unit/category)
  • Revenue mapping of major players to cover a major share of the global market share as of 2022
  • Extrapolating the global value of the medical lasers market industry
Medical Lasers Market Size, and Share

Data Triangulation

After arriving at the overall market size from the market size estimation process explained above, the global medical lasers market was split into segments and subsegments. Data triangulation and market breakdown procedures were employed to complete the overall market engineering process and arrive at the exact statistics for all segments and subsegments. The data was triangulated by studying various factors and trends from both the demand and supply sides. Additionally, the medical lasers market was validated using top-down and bottom-up approaches.

Market Definition

The medical lasers market encompasses the global industry involved in the development, manufacturing, and distribution of laser-based technologies for diverse medical applications. These devices emit focused and intense beams of light with specific wavelengths, serving diagnostic, therapeutic, and surgical purposes in medical and healthcare settings. The market includes a variety of laser types, such as solid-state lasers (e.g., Nd: YAG lasers), gas lasers (e.g., CO2 lasers, argon lasers), diode lasers, and excimer lasers, each finding application in specialties like ophthalmology, dermatology, dentistry, cardiology, gynecology, urology, and surgery. As a result, medical lasers are widely employed in the formulation and production processes of various industries, including hospitals & surgical centers, dermatology clinics & dental clinics, medical& beauty spa.

Key Stakeholders

  • Dermatology Clinics and Aesthetic Centers
  • Hospitals and Surgical Centers
  • Cosmetic Product Manufacturers
  • Pharmaceutical Companies
  • Medical Spas and Beauty Spas
  • Cosmetologists and Plastic Surgeons
  • Medical Aesthetics Device Distributors and Suppliers
  • Dermatologists and Aesthetic Practitioners
  • Urologists and Urological Surgeons
  • Obstetricians and Gynecologists
  • Nurses and Oncology Nurse Navigators
  • Oncologists
  • Cardiac Surgeons
  • Regulatory Agencies
  • Public Health Organizations
  • Research and Development Organizations
  • Medical Laser Manufacturers

Objectives of the Study

  • To define, describe, and forecast the size of the medical lasers market based on technology, application, end user, and region
  • To provide detailed information regarding the major factors influencing the growth potential of the global medical lasers market (drivers, restraints, opportunities, challenges, and trends)
  • To analyze the micro markets with respect to individual growth trends, prospects, and contributions to the global medical lasers market.
  • To analyze key growth opportunities in the global medical lasers market for key stakeholders and provide details of the competitive landscape for market leaders
  • To forecast the size of market segments and/or subsegments with respect to five major regions, namely, North America (US and Canada), Europe (Germany, France, the UK, Spain, Italy, and the RoE), Asia Pacific (Japan, China, India, Australia, South Korea, Indonesia, Thailand and the RoAPAC), Latin America (Brazil, Mexico, RoLA), and Middle East and Africa.
  • To profile the key players in the medical lasers market and comprehensively analyze their market shares and core competencies
  • To track and analyze the competitive developments undertaken in the global medical lasers market, such as product launches, agreements, expansions, and mergers & acquisitions.

Available Customizations

With the given market data, MarketsandMarkets offers customizations per the company’s specific needs. The following customization options are available for the present medical lasers market report:

Product Analysis

  • Product matrix, which gives a detailed comparison of the product portfolios of the top five companies

Company Information

  • Detailed analysis and profiling of additional market players (up to five)

Geographic Analysis

  • Further breakdown of the Rest of Europe medical lasers market into Russia, Belgium, the Netherlands, Switzerland, Austria, Finland, Sweden, Poland, and Portugal, among others
  • Further breakdown of the Rest of Asia Pacific diagnostic imaging market into Singapore, Taiwan, New Zealand, Philippines, Malaysia, and other APAC countries
Custom Market Research Services

We will customize the research for you, in case the report listed above does not meet with your exact requirements. Our custom research will comprehensively cover the business information you require to help you arrive at strategic and profitable business decisions.

Request Customization
Report Code
MD 8923
Published ON
Jan, 2024
Choose License Type
BUY NOW
  • SHARE
X
Request Customization
Speak to Analyst
Speak to Analyst
OR FACE-TO-FACE MEETING
PERSONALIZE THIS RESEARCH
  • Triangulate with your Own Data
  • Get Data as per your Format and Definition
  • Gain a Deeper Dive on a Specific Application, Geography, Customer or Competitor
  • Any level of Personalization
REQUEST A FREE CUSTOMIZATION
LET US HELP YOU!
  • What are the Known and Unknown Adjacencies Impacting the Medical Lasers Market
  • What will your New Revenue Sources be?
  • Who will be your Top Customer; what will make them switch?
  • Defend your Market Share or Win Competitors
  • Get a Scorecard for Target Partners
CUSTOMIZED WORKSHOP REQUEST
knowledgestore logo

Want to explore hidden markets that can drive new revenue in Medical Lasers Market?

Find Hidden Markets
  • Call Us
  • +1-888-600-6441 (Corporate office hours)
  • +1-888-600-6441 (US/Can toll free)
  • +44-800-368-9399 (UK office hours)
CONNECT WITH US
ABOUT TRUST ONLINE
©2024 MarketsandMarkets Research Private Ltd. All rights reserved
DMCA.com Protection Status
Website Feedback