Natural Language Understanding (NLU) Market

Report Code TC 9061
Published in Jul, 2024, By MarketsandMarkets™
Download PDF

Choose License Type

Buy Report Now Inquire Before Buying

Natural Language Understanding (NLU) Market by Type (Rule-Based, Statistical, Hybrid), Application (Customer Experience Management, Chatbots & Virtual Assistants, Text Analysis, Sentiment Analysis, Machine Translation) – Global Forecast to 2029

Overview

The global natural language understanding market size reached US$ 19.2 Billion in 2024. Looking forward, expects the market to reach US$ 62.9 Billion by 2029, exhibiting a growth rate (CAGR) of 26.8% during 2024-2029. The Natural Language Understanding (NLU) market is driven by several factors including, the increasing demand of consumers for personalized and intuitive interactions, enhanced productivity, shorter call durations in contact centers, a rising need for impactful brand messaging, and the rapid expansion of unstructured text data.

Attractive Opportunities in the Natural Language Understanding (NLU) Market

Asia Pacific

Emerging economies in the regions from Asia Pacific to provide numerous opportunities across industry verticals

The natural language understanding market expected to experience significant growth in natural language understanding due to government initiatives, policies, and investments.

North America is expected to account for the largest market share during the forecast period. The region is a leader in technological advancements and is home to major NLU vendors.

Acquisitions and mergers would offer lucrative opportunities to the market players in the next five years.

The proliferation of technology in businesses is leading to the growth of the natural language understanding market.

Global Natural Language Understanding (NLU) Market Dynamics

Driver: Rising demand for brand messaging drives adoption of robust NLU solutions

The rapid increase in consumer preference for messaging with brands, as highlighted by a recent LivePerson survey showing a rise from 65% to 85% in just one year, underscores a significant shift in communication expectations and presents a compelling driver for the NLU market. As the addressable audience for conversational interactions expands, brands are compelled to adopt robust automation strategies to meet these growing demands. A strong and accurate Natural Language Understanding (NLU) system becomes essential in this context, enabling businesses to create and scale the conversational experiences that consumers now crave. NLU facilitates the recognition of customer intents, allowing for quick and precise query resolution, which is crucial for maintaining high levels of customer satisfaction. Beyond just answering questions, NLU enhances sales, marketing, and customer care operations by providing deep insights into consumer behavior and preferences, thus enabling more personalized and effective engagement strategies.

Restraint: Data sensitivity to hamper the market growth

Data sensitivity is a critical restraint in the NLU market, particularly as NLU systems are increasingly employed in areas like customer support and healthcare, where they handle highly sensitive and confidential information. When users interact with conversational AI systems, they often share personal data, including financial details, medical history, and other private information. Ensuring the security and privacy of this data is paramount to prevent misuse or unauthorized exposure. The potential risks associated with data breaches, unauthorized access, and data leaks can have severe consequences, including identity theft, financial loss, and breaches of confidentiality, which can significantly harm both individuals and organizations.


Opportunity: Emotion recognition-based NLU to unlock empathetic AI for personalized user experiences

The development of emotion-aware systems that can identify and respond to human emotions expressed in text and speech. Emotion recognition technologies aim to bridge the gap between human communication nuances and machine understanding, enabling AI systems to interpret not just the literal meaning of words but also the underlying emotions and sentiments conveyed. This advancement opens up a wide range of applications across various sectors. In mental health support, emotion-aware NLU systems can analyze patient interactions to detect emotional distress, provide empathetic responses, and even escalate concerns to healthcare professionals when necessary.

Challenge: Lexical ambiguity challenges NLU accuracy with multiple word meanings

Lexical ambiguity poses a significant challenge for NLU systems as it introduces complexities in language understanding. This challenge arises from the fact that many words in natural language have multiple meanings depending on context. For example, the word "bank" could refer to a financial institution where people deposit money or the sloping land beside a body of water. When encountered in text or speech, NLU systems must accurately discern the intended meaning based on the surrounding context to avoid misinterpretation. Failure to do so can result in erroneous conclusions and inaccurate outputs. This challenge becomes even more pronounced in languages with rich vocabularies and nuances, where words may have multiple meanings or subtle variations in different contexts.

Global Natural Language Understanding (NLU) Market Ecosystem Analysis

Natural Language Understanding Market Ecosystem The natural language understanding (NLU) market ecosystem comprises of platform providers, service providers, software tools & frameworks providers and regulatory bodies.


By solutions, software tools & frameworks segment to account for the largest market size during the forecast period.

Software tools and frameworks are rapidly emerging as the fastest-growing solutions in the natural language understanding (NLU) market, propelled by their versatility and adaptability. These tools and frameworks provide developers with a wide range of functionalities, such as natural language processing (NLP) libraries, sentiment analysis tools, and speech recognition capabilities, enabling them to create custom NLU solutions tailored to specific needs and requirements. As businesses increasingly leverage NLU for various applications like chatbots, virtual assistants, and sentiment analysis, the demand for flexible and comprehensive software tools and frameworks continues to rise. The integration of these tools with other technologies like machine learning and data analytics further enhances their capabilities, driving innovation and fueling the growth of the NLU market.

By vertical, healthcare & life sciences segment is projected to grow at the highest CAGR during the forecast period.

The healthcare and life sciences sector is rapidly embracing natural language understanding (NLU) technologies, transforming how medical professionals and researchers process and utilize vast amounts of unstructured data. NLU enables the extraction of valuable insights from patient records, clinical trial data, and medical literature, leading to improved diagnostics, personalized treatment plans, and more efficient clinical workflows. By automating the analysis of complex medical texts, NLU helps reduce administrative burdens, allowing healthcare providers to focus more on patient care. NLU-powered applications, such as virtual health assistants and automated patient support systems, enhance patient engagement and streamline communication.

North America Region Holds the Lrgest Share of the Natural Language Understanding (NLU) Market.

North America is a dynamic hub for advancements in the natural language understanding (NLU) market, marked by ongoing developments, technological advancements, and regulatory considerations. With leading tech companies like Google, Amazon, and Microsoft based in the region, there is a constant stream of innovation and research driving the evolution of NLU technologies. These companies invest heavily in AI research, pushing the boundaries of what NLU can achieve. North America's proactive regulatory environment supports the ethical and secure deployment of NLU technologies, further bolstering its leading position in the industry.


Recent Developments of Natural Language Understanding (NLU) Market industry

  • In May 2024, Reddit and OpenAI announced a partnership to enhance the user experience for both communities. OpenAI will utilize Reddit's Data API to integrate enhanced Reddit content into ChatGPT and new products, helping users discover and engage with Reddit communities.
  • In May 2024, Oracle launched Oracle Cloud Infrastructure (OCI) Language 4.0 across all OCI regions, unveiling three new features aimed at delivering top-notch text analytics services to customers at an accessible price point. OCI Language serves as a cloud-based AI service specializing in extensive text analysis.

Key Market Players

KEY PLAYERS IN THE Natural Language Understanding (NLU) Market INCLUDE

  • Microsoft (US)
  • Google (US)
  • IBM (US)
  • AWS (US)
  • Oracle (US)
  • SAS Institute
  • Salesforce (US)
  • OpenAI (US)
  • Meta (US)
  • SoundHound AI (US)
  • IQVIA (US)
  • LivePerson (US)
  • Haptik (India)
  • Kapiche (Australia)
  • Rasa (US)
  • MindMeld (US)
  • Hugging Face (US)
  • Conversica (US)
  • Expert.ai (Italy)
  • Verbio Technologies (Spain)
  • Wolfram (US)
  • Cortical.io (Austria)
  • Omilia (Cyprus)
  • Cognigy (Germany)
  • Plasticity (US)
  • Afforai (US)
  • Tune AI (US)
  • Vebrit.ai (US)
  • Synthesys (UK)
  • Picovoice (Canada)
  • Symbl.ai (US)
  • Tisane Labs (Singapore)
  • Prosa.ai (Indonesia)
  • Abacus.AI (US)
  • Forethought (US)

Want to explore hidden markets that can drive new revenue in Natural Language Understanding (NLU) Market?

Scope of the Report

Report Attribute Details
Market size available for years 2019–2029
Base year considered 2023
Forecast period 2024–2029
Forecast units USD Billion
Segments Covered Offering (Solutions [Platform and Software tools & frameworks], Solutions by Deployment Mode  [Cloud and On-premises] and Services [Professional Services {Training & Consulting, System Integration & Implementation, Support & Maintenance} and Managed Services]), Type (Rule-Based, Statistical, Hybrid), Application (Chatbots & Virtual Assistants, Customer Experience Management, Text Analysis, Sentiment analysis, IVR & message routing, Data capture, Machine translation and Other Applications) and Verticals (BFSI, Healthcare & Life Sciences, Retail & Ecommerce, IT&ITeS, Transportation & logistics, Government & Public sector, Media & Entertainment, Manufacturing, Telecommunication and Other verticals [Travel & Hospitality, Automotive, Energy & Utilities and Education]).
Geographies covered North America, Europe, Asia Pacific, Middle East & Africa, Latin America
Top Companies in Natural Language Understanding Market Key players are Microsoft (US), Google (US), IBM (US), AWS (US), Meta (US), SAS Institute, Oracle (US), Salesforce (US), OpenAI (US), SoundHound AI (US), IQVIA (US), LivePerson (US), Haptik (India), Kapiche (Australia), Rasa (US), MindMeld (US), Hugging Face (US), Conversica (US), Expert.ai (Italy), Verbio Technologies (Spain), Wolfram (US), Cortical.io (Austria), Omilia (Cyprus), Cognigy (Germany), Plasticity (US), Afforai (US), Tune AI (US), Vebrit.ai (US), Synthesys (UK), Picovoice (Canada), Symbl.ai (US), Tisane Labs (Singapore), Prosa.ai (Indonesia), Abacus.AI (US), Forethought (US).


Key Questions Addressed by the Report

What is natural language understanding (NLU)?
Natural language understanding (NLU) is a subset of natural language processing (NLP) within the field of artificial intelligence (AI) that focuses on machine reading comprehension. It involves enabling machines to understand and interpret human language in a way that is meaningful and useful.
Which region is expected to hold the highest share in the natural language understanding (NLU) market?
North America is expected to hold the largest market size in the natural language understanding (NLU) market driven by region's strong technological infrastructure, the presence of major tech companies like Google, Amazon, and Microsoft, and significant investments in research and development.
Which are key verticals adopting natural language understanding (NLU) solutions and services?
The key verticals adopting the NLU solutions & services are BFSI, Healthcare & Life Sciences, Retail & Ecommerce, IT&ITeS, Transportation & logistics, Government & Public sector, Media & Entertainment, Manufacturing, Telecommunication and Other verticals (Travel & Hospitality, Automotive, Energy & Utilities and Education)
Which are the key drivers supporting the market growth for natural language understanding (NLU)market?
The growth of the natural language understanding (NLU) market is propelled by various drivers such as growing consumer demand for personalized and intuitive interactions, increased productivity and reduced call durations in contact centers, a rising need for effective brand messaging, and the exponential growth of unstructured text data.
Who are the key vendors in the market for natural language understanding (NLU) market?
The key vendors in the global natural language understanding (NLU) market include Microsoft (US), Google (US), IBM (US), AWS (US), Oracle (US), Meta (US), SAS Institute, Salesforce (US), OpenAI (US), SoundHound AI (US), IQVIA (US), LivePerson (US), Haptik (India), Kapiche (Australia), Rasa (US), MindMeld (US), Hugging Face (US), Conversica (US), Expert.ai (Italy), Verbio Technologies (Spain), Wolfram (US), Cortical.io (Austria), Omilia (Cyprus), Cognigy (Germany), Plasticity (US), Afforai (US), Tune AI (US), Vebrit.ai (US), Synthesys (UK), Picovoice (Canada), Symbl.ai (US), Tisane Labs (Singapore), Prosa.ai (Indonesia), Abacus.AI (US), Forethought (US). .


Personalize This Research

  • Triangulate with your Own Data
  • Get Data as per your Format and Definition
  • Gain a Deeper Dive on a Specific Application, Geography, Customer or Competitor
  • Any level of Personalization
Request A Free Customisation

Let Us Help You

  • What are the Known and Unknown Adjacencies Impacting the Natural Language Understanding (NLU) Market
  • What will your New Revenue Sources be?
  • Who will be your Top Customer; what will make them switch?
  • Defend your Market Share or Win Competitors
  • Get a Scorecard for Target Partners
Customized Workshop Request

Table of Contents

Exclusive indicates content/data unique to MarketsandMarkets and not available with any competitors.

TITLE
PAGE NO
INTRODUCTION
33
RESEARCH METHODOLOGY
38
EXECUTIVE SUMMARY
50
PREMIUM INSIGHTS
55
MARKET OVERVIEW AND INDUSTRY TRENDS
57
  • 5.1 INTRODUCTION
  • 5.2 MARKET DYNAMICS
    DRIVERS
    - Growing demand for personalized and intuitive interactions
    - Focus on customer-centric approaches and operational efficiency
    - Rising demand for brand messaging driving adoption of robust NLU solutions
    - Exponential growth of unstructured text data fueling demand for NLU
    RESTRAINTS
    - High implementation costs and lack of skilled professionals
    - Data sensitivity hampering market growth and necessitating robust security measures
    OPPORTUNITIES
    - Advancements in NLU enabling cognitive understanding for enhanced AI capabilities
    - Emotion recognition-based NLU unlocking empathetic AI for personalized user experiences
    - Industry-specific NLU solutions offering opportunity to revolutionize sector operations
    CHALLENGES
    - Lexical ambiguity challenging accuracy of NLU with multiple word meanings
    - Societal biases by language models in training data leading to discriminatory predictions in NLU
  • 5.3 TRENDS/DISRUPTIONS IMPACTING CUSTOMERS’ BUSINESSES
  • 5.4 PRICING ANALYSIS
    AVERAGE SELLING PRICE TRENDS OF KEY PLAYERS, BY APPLICATION
    INDICATIVE PRICING ANALYSIS OF NATURAL LANGUAGE UNDERSTANDING SOLUTIONS, BY OFFERING
  • 5.5 SUPPLY CHAIN ANALYSIS
  • 5.6 ECOSYSTEM
    PLATFORM PROVIDERS
    SERVICE PROVIDERS
    SOFTWARE TOOL AND FRAMEWORK PROVIDERS
    REGULATORY BODIES
  • 5.7 TECHNOLOGY ANALYSIS
    KEY TECHNOLOGIES
    - Natural Language Processing (NLP)
    - Machine Learning (ML)
    - Deep learning
    - Speech recognition
    COMPLEMENTARY TECHNOLOGIES
    - Big data analytics
    - Cloud computing
    - IoT
    ADJACENT TECHNOLOGIES
    - Blockchain
    - Cybersecurity
  • 5.8 PATENT ANALYSIS
    METHODOLOGY
    - Patents type
    - Innovation and patent applications
  • 5.9 KEY CONFERENCES AND EVENTS, 2024–2025
  • 5.10 REGULATORY LANDSCAPE
    REGULATORY BODIES, GOVERNMENT AGENCIES, AND OTHER ORGANIZATIONS
    - North America
    - Europe
    - Asia Pacific
    - Middle East & Africa
    - Latin America
  • 5.11 PORTER’S FIVE FORCES ANALYSIS
    THREAT OF NEW ENTRANTS
    THREAT OF SUBSTITUTES
    BARGAINING POWER OF SUPPLIERS
    BARGAINING POWER OF BUYERS
    INTENSITY OF COMPETITION RIVALRY
  • 5.12 KEY STAKEHOLDERS AND BUYING CRITERIA
    KEY STAKEHOLDERS IN BUYING PROCESS
    BUYING CRITERIA
  • 5.13 NATURAL LANGUAGE UNDERSTANDING MARKET: EVOLUTION
  • 5.14 TECHNOLOGY ROADMAP OF NATURAL LANGUAGE UNDERSTANDING MARKET
  • 5.15 PHASES OF NATURAL LANGUAGE UNDERSTANDING
    LEXICAL ANALYSIS
    SYNTACTIC ANALYSIS (PARSING)
    SEMANTIC ANALYSIS
    DISCOURSE INTEGRATION
    PRAGMATIC ANALYSIS
  • 5.16 INVESTMENT AND FUNDING SCENARIO
  • 5.17 CASE STUDY ANALYSIS
    CLEARSCOPE LEVERAGED IBM WATSON FOR AUTOMATED SEO AND ACHIEVED SIGNIFICANT TRAFFIC GROWTH
    VERBIO'S CALL AUTOMATION SOLUTION REVOLUTIONIZED MAJOR SPANISH BANKS’ CUSTOMER SERVICE
    CORTICAL.IO'S SEMANTICPRO EXTRACT & ANALYZE SOLUTION STREAMLINED RFP PROCESSING AND BOOSTED RESPONSE TIMES AND INSIGHTS
    OMILIA'S NLU TECHNOLOGY REVOLUTIONIZED VODAFONE GREECE'S CUSTOMER SERVICE EXPERIENCE
    EXPERT.AI AND ASSOCIATED PRESS ELEVATED NEWS DISCOVERY WITH ADVANCED NATURAL LANGUAGE UNDERSTANDING SOLUTIONS
NATURAL LANGUAGE UNDERSTANDING MARKET, BY OFFERING
96
  • 6.1 INTRODUCTION
    OFFERING: NATURAL LANGUAGE UNDERSTANDING MARKET DRIVERS
  • 6.2 SOLUTIONS
    DIVERSE NLU OFFERINGS DRIVE INNOVATION IN LANGUAGE UNDERSTANDING TECHNOLOGIES GLOBALLY
    PLATFORMS
    SOFTWARE TOOLS & FRAMEWORKS
  • 6.3 SOLUTION, BY DEPLOYMENT MODE
    NLU MARKET SOLUTIONS ADAPT TO CLOUD AND ON-PREMISES DEPLOYMENT DEMANDS
    CLOUD
    ON-PREMISES
  • 6.4 SERVICES
    NLU MARKET SERVICES OPTIMIZE ADOPTION WITH PROFESSIONAL AND MANAGED EXPERTISE
    PROFESSIONAL SERVICES
    - Training & consulting
    - System integration & implementation
    - Support & maintenance
    MANAGED SERVICES
NATURAL LANGUAGE UNDERSTANDING MARKET, BY TYPE
113
  • 7.1 INTRODUCTION
    TYPE: NATURAL LANGUAGE UNDERSTANDING MARKET DRIVERS
  • 7.2 RULE-BASED
    RULE-BASED NLU SYSTEMS DRIVE PRECISION AND COMPLIANCE IN STRUCTURED DATA ENVIRONMENTS
  • 7.3 STATISTICAL
    STATISTICAL NLU MODELS ADVANCE WITH MACHINE LEARNING FOR NUANCED LANGUAGE UNDERSTANDING
  • 7.4 HYBRID
    HYBRID NLU MODELS INTEGRATE RULES AND MACHINE LEARNING FOR VERSATILE APPLICATIONS
NATURAL LANGUAGE UNDERSTANDING MARKET, BY APPLICATION
119
  • 8.1 INTRODUCTION
    APPLICATION: NATURAL LANGUAGE UNDERSTANDING MARKET DRIVERS
  • 8.2 CHATBOTS & VIRTUAL ASSISTANTS
    NLU-POWERED CHATBOTS AND VIRTUAL ASSISTANTS TO STREAMLINE CUSTOMER INTERACTIONS AND TASKS
  • 8.3 CUSTOMER EXPERIENCE MANAGEMENT
    RISING DEMAND FOR PERSONALIZED CUSTOMER INTERACTIONS TO DRIVE NLU SOLUTIONS
  • 8.4 TEXT ANALYSIS
    GROWING DEMAND FOR ACTIONABLE INSIGHTS FROM UNSTRUCTURED TEXT TO DRIVE NLU ADOPTION
  • 8.5 SENTIMENT ANALYSIS
    REAL-TIME SENTIMENT INSIGHTS DRIVE STRATEGIC DECISIONS AND ENHANCE CUSTOMER ENGAGEMENT
  • 8.6 IVR & MESSAGE ROUTING
    EFFICIENT CALL ROUTING AND 24/7 SERVICE DRIVE ADOPTION OF NLU-ENHANCED IVR SYSTEMS
  • 8.7 DATA CAPTURE
    EFFICIENT DATA ENTRY AUTOMATION DRIVES ADOPTION OF NLU-POWERED DATA CAPTURE
  • 8.8 MACHINE TRANSLATION
    IMPROVED GLOBAL COMMUNICATION THROUGH ACCURATE, CONTEXT-AWARE MACHINE TRANSLATIONS
  • 8.9 OTHER APPLICATIONS
NATURAL LANGUAGE UNDERSTANDING MARKET, BY VERTICAL
131
  • 9.1 INTRODUCTION
    VERTICAL: NATURAL LANGUAGE UNDERSTANDING MARKET DRIVERS
  • 9.2 BFSI
    INTEGRATION OF AI-DRIVEN NLU TO ENHANCE CUSTOMER INTERACTIONS IN BFSI
    FRAUD DETECTION & PREVENTION
    ALGORITHMIC TRADING
    RISK ASSESSMENT
    COMPLIANCE & REGULATORY MONITORING
    INSURANCE CLAIMS PROCESSING
  • 9.3 HEALTHCARE & LIFE SCIENCES
    NLU TO ENHANCE HEALTHCARE DIAGNOSTICS AND RESEARCH THROUGH ADVANCED DATA ANALYSIS
    CLINICAL DOCUMENTATION
    DISEASE DETECTION & SURVEILLANCE
    CLINICAL DECISION SUPPORT
    DRUG DISCOVERY & DEVELOPMENT
    HEALTHCARE DATA MINING AND QUERY UNDERSTANDING
  • 9.4 RETAIL & ECOMMERCE
    GROWING DEMAND FOR PERSONALIZED SHOPPING EXPERIENCES TO DRIVE NLU ADOPTION
    CUSTOMER SUPPORT & ENGAGEMENT
    SENTIMENT ANALYSIS
    PERSONALIZED RECOMMENDATION
    SEARCH ENGINE OPTIMIZATION
    SUPPLY CHAIN MANAGEMENT
  • 9.5 IT & ITES
    ADVANCED NLU SOLUTIONS TO STREAMLINE IT OPERATIONS AND CUSTOMER ENGAGEMENT
    IT HELP DESK AUTOMATION
    KNOWLEDGE MANAGEMENT
    SOFTWARE DEVELOPMENT
    PROJECT MANAGEMENT
  • 9.6 TRANSPORTATION & LOGISTICS
    NLU TO TRANSFORM LOGISTICS OPERATIONS WITH REAL-TIME INTELLIGENCE AND AUTOMATION
    ROUTE OPTIMIZATION
    FLEET MANAGEMENT
    INVENTORY VISIBILITY
    CUSTOMER SUPPORT AND TRACKING
  • 9.7 GOVERNMENT & PUBLIC SECTOR
    NLU TO DRIVE EFFICIENCY AND CITIZEN ENGAGEMENT IN GOVERNMENT SERVICES
    PUBLIC SERVICES
    SECURITY & INTELLIGENCE
    COMPLIANCE & LEGAL DOCUMENT MANAGEMENT
    INTELLIGENCE ANALYSIS & THREAT DETECTION
  • 9.8 MEDIA & ENTERTAINMENT
    DEMAND FOR PERSONALIZED CONTENT EXPERIENCES TO DRIVE NLU ADOPTION
    CONTENT PERSONALIZATION
    NEWS & CONTENT ANALYSIS
    AUDIENCE SENTIMENT ANALYSIS
    AUTOMATED CONTENT TAGGING AND CLASSIFICATION
  • 9.9 MANUFACTURING
    DEMAND FOR OPERATIONAL EFFICIENCY AND PREDICTIVE MAINTENANCE DRIVES NLU ADOPTION IN MANUFACTURING
    SUPPLY CHAIN OPTIMIZATION
    PRODUCTION OPTIMIZATION
    MAINTENANCE & PREDICTIVE ANALYTICS
    QUALITY CONTROL & DEFECT DETECTION
  • 9.10 TELECOMMUNICATION
    NLU ENHANCES TELECOM EFFICIENCY BY AUTOMATING CUSTOMER SUPPORT AND NETWORK MANAGEMENT
    AUTOMATED CUSTOMER SERVICE
    NETWORK MANAGEMENT
    VIRTUAL CALL CENTERS
    VOICE COMMAND AND CONTROL
  • 9.11 OTHER VERTICALS
NATURAL LANGUAGE UNDERSTANDING MARKET, BY REGION
158
  • 10.1 INTRODUCTION
  • 10.2 NORTH AMERICA
    MARKET DRIVERS
    RECESSION IMPACT
    US
    - Strong presence of leading tech companies to fuel market
    CANADA
    - Government investment in AI adoption to drive technological advancement and competitiveness
  • 10.3 EUROPE
    MARKET DRIVERS
    RECESSION IMPACT
    UK
    - UK's stringent AI regulations and supportive policies to drive NLU innovation
    GERMANY
    - Robust R&D investments to drive market
    FRANCE
    - Increased funding and government support to drive market
    SPAIN
    - Collaboration between government and tech giants to drive NLU market
    ITALY
    - Increased adoption of AI-driven solutions across Italian industries to drive market
    REST OF EUROPE
  • 10.4 ASIA PACIFIC
    MARKET DRIVERS
    RECESSION IMPACT
    CHINA
    - Rapid development of AI-powered chatbots to drive market
    JAPAN
    - Japan's robust AI ecosystem and advanced technological infrastructure to enhance NLU adoption
    INDIA
    - Increased government initiatives and diverse linguistic challenges to drive market
    SOUTH KOREA
    - Robust AI infrastructure and government support to drive NLU innovation
    ASEAN
    - Proactive AI strategies and robust digital economies to drive regional growth
    REST OF ASIA PACIFIC
  • 10.5 MIDDLE EAST & AFRICA
    MARKET DRIVERS
    RECESSION IMPACT
    MIDDLE EAST
    - UAE
    - Saudi Arabia
    - Turkey
    - Qatar
    - Rest of Middle East
    AFRICA
  • 10.6 LATIN AMERICA
    MARKET DRIVERS
    RECESSION IMPACT
    BRAZIL
    - National AI strategy and regulatory framework to drive NLU market
    MEXICO
    - Government initiatives toward technological advancements to boost growth
    ARGENTINA
    - Robust tech ecosystem and governmental support to drive growth
    REST OF LATIN AMERICA
COMPETITIVE LANDSCAPE
219
  • 11.1 OVERVIEW
  • 11.2 KEY PLAYER STRATEGIES
  • 11.3 REVENUE ANALYSIS
  • 11.4 MARKET SHARE ANALYSIS
    MARKET RANKING ANALYSIS
  • 11.5 BRAND/PRODUCT COMPARATIVE ANALYSIS
  • 11.6 COMPANY EVALUATION MATRIX: KEY PLAYERS, 2023
    STARS
    EMERGING LEADERS
    PERVASIVE PLAYERS
    PARTICIPANTS
    COMPANY FOOTPRINT: KEY PLAYERS, 2023
    - Company footprint
    - Region footprint
    - Offering footprint
    - Application footprint
    - Vertical footprint
  • 11.7 COMPANY EVALUATION MATRIX: STARTUPS/SMES, 2023
    PROGRESSIVE COMPANIES
    RESPONSIVE COMPANIES
    DYNAMIC COMPANIES
    STARTING BLOCKS
    COMPETITIVE BENCHMARKING: STARTUPS/SMES, 2023
    - Detailed list of key startups/SMEs
    - Competitive benchmarking of key startups/SMEs
  • 11.8 COMPETITIVE SCENARIOS AND TRENDS
    PRODUCT LAUNCHES & ENHANCEMENTS
    DEALS
  • 11.9 COMPANY VALUATION AND FINANCIAL METRICS OF KEY VENDORS
COMPANY PROFILES
241
  • 12.1 INTRODUCTION
  • 12.2 KEY PLAYERS
    MICROSOFT
    - Business overview
    - Products/Solutions/Services offered
    - Recent developments
    - MnM view
    GOOGLE
    - Business overview
    - Products/Solutions/Services offered
    - Recent developments
    - MnM view
    IBM
    - Business overview
    - Products/Solutions/Services offered
    - Recent developments
    - MnM view
    AWS
    - Business overview
    - Products/Solutions/Services offered
    - Recent developments
    - MnM view
    ORACLE
    - Business overview
    - Products/Solutions/Services offered
    - Recent developments
    - MnM view
    SALESFORCE
    - Business overview
    - Products/Solutions/Services offered
    - Recent developments
    SAS INSTITUTE
    - Business overview
    - Products/Solutions/Services offered
    - Recent developments
    OPENAI
    - Business overview
    - Products/Solutions/Services offered
    - Recent developments
    META
    - Business overview
    - Products/Solutions/Services offered
    - Recent developments
    SOUNDHOUND AI
    - Business overview
    - Products/Solutions/Services offered
    - Recent developments
  • 12.3 KEY PLAYERS
    IQVIA
    LIVEPERSON
    HAPTIK
    KAPICHE
    RASA
    MINDMELD
    HUGGING FACE
    CONVERSICA
    EXPERT.AI
    VERBIO TECHNOLOGIES
    WOLFRAM
    CORTICAL.IO
    OMILIA
    COGNIGY
    PLASTICITY
  • 12.4 STARTUPS/SMES
    AFFORAI
    TUNE AI
    VERBIT.AI
    SYNTHESYS
    PICOVOICE
    SYMBL.AI
    TISANE LABS
    PROSA.AI
    ABACUS.AI
    FORETHOUGHT
ADJACENT AND RELATED MARKETS
310
  • 13.1 INTRODUCTION
  • 13.2 NATURAL LANGUAGE PROCESSING MARKET—GLOBAL FORECAST TO 2028
    MARKET DEFINITION
    MARKET OVERVIEW
    - Natural language processing market, by offering
    - Natural language processing market, by type
    - Natural language processing market, by application
    - Natural language processing market, by technology
    - Natural language processing market, by vertical
    - Natural language processing market, by region
  • 13.3 CONVERSATIONAL AI MARKET—GLOBAL FORECAST TO 2030
    MARKET DEFINITION
    MARKET OVERVIEW
    - Conversational AI market, by offering
    - Conversational AI market, by business function
    - Conversational AI market, by agent type
    - Conversational AI market, by integration mode
    - Conversational AI market, by vertical
    - Conversational AI market, by region
APPENDIX
325
  • 14.1 DISCUSSION GUIDE
  • 14.2 KNOWLEDGESTORE: MARKETSANDMARKETS’ SUBSCRIPTION PORTAL
  • 14.3 CUSTOMIZATION OPTIONS
  • 14.4 RELATED REPORTS
  • 14.5 AUTHOR DETAILS
LIST OF TABLES
 
  • TABLE 1 USD EXCHANGE RATE, 2019–2023
  • TABLE 2 PRIMARY INTERVIEWS
  • TABLE 3 FACTOR ANALYSIS
  • TABLE 4 RECESSION IMPACT ON NATURAL LANGUAGE UNDERSTANDING MARKET
  • TABLE 5 NATURAL LANGUAGE UNDERSTANDING MARKET SIZE AND GROWTH RATE, 2019–2023 (USD MILLION, Y-O-Y)
  • TABLE 6 NATURAL LANGUAGE UNDERSTANDING MARKET SIZE AND GROWTH RATE, 2024–2029 (USD MILLION, Y-O-Y)
  • TABLE 7 AVERAGE SELLING PRICE TREND OF KEY PLAYERS FOR TOP THREE APPLICATIONS
  • TABLE 8 INDICATIVE PRICING LEVELS OF NATURAL LANGUAGE UNDERSTANDING SOLUTIONS, BY OFFERING
  • TABLE 9 NATURAL LANGUAGE UNDERSTANDING MARKET: ECOSYSTEM
  • TABLE 10 NATURAL LANGUAGE UNDERSTANDING MARKET: GLOBAL PATENTS, 2014–2024
  • TABLE 11 TOP TWENTY PATENT OWNERS IN LAST TEN YEARS, 2014–2024
  • TABLE 12 LIST OF PATENTS IN NATURAL LANGUAGE UNDERSTANDING MARKET, 2022–2024
  • TABLE 13 NATURAL LANGUAGE UNDERSTANDING MARKET: DETAILED LIST OF CONFERENCES & EVENTS, 2024–2025
  • TABLE 14 NORTH AMERICA: LIST OF REGULATORY BODIES, GOVERNMENT AGENCIES, AND OTHER ORGANIZATIONS
  • TABLE 15 EUROPE: LIST OF REGULATORY BODIES, GOVERNMENT AGENCIES, AND OTHER ORGANIZATIONS
  • TABLE 16 ASIA PACIFIC: LIST OF REGULATORY BODIES, GOVERNMENT AGENCIES, AND OTHER ORGANIZATIONS
  • TABLE 17 MIDDLE EAST & AFRICA: LIST OF REGULATORY BODIES, GOVERNMENT AGENCIES, AND OTHER ORGANIZATIONS
  • TABLE 18 LATIN AMERICA: LIST OF REGULATORY BODIES, GOVERNMENT AGENCIES, AND OTHER ORGANIZATIONS
  • TABLE 19 PORTER’S FIVE FORCES IMPACT ON NATURAL LANGUAGE UNDERSTANDING MARKET
  • TABLE 20 INFLUENCE OF STAKEHOLDERS ON BUYING PROCESS FOR TOP THREE VERTICALS (%)
  • TABLE 21 KEY BUYING CRITERIA FOR TOP THREE VERTICALS
  • TABLE 22 SHORT-TERM ROADMAP (FOR NEXT FIVE YEARS)
  • TABLE 23 LONG-TERM ROADMAP (BEYOND NEXT FIVE YEARS)
  • TABLE 24 NATURAL LANGUAGE UNDERSTANDING MARKET, BY OFFERING, 2019–2023 (USD MILLION)
  • TABLE 25 MARKET, BY OFFERING, 2024–2029 (USD MILLION)
  • TABLE 26 MARKET, BY SOLUTION, 2019–2023 (USD MILLION)
  • TABLE 27 MARKET, BY SOLUTION, 2024–2029 (USD MILLION)
  • TABLE 28 SOLUTIONS: MARKET, BY REGION, 2019–2023 (USD MILLION)
  • TABLE 29 SOLUTIONS: MARKET, BY REGION, 2024–2029 (USD MILLION)
  • TABLE 30 PLATFORMS: MARKET, BY REGION, 2019–2023 (USD MILLION)
  • TABLE 31 PLATFORMS: MARKET, BY REGION, 2024–2029 (USD MILLION)
  • TABLE 32 SOFTWARE TOOLS & FRAMEWORKS: MARKET, BY REGION, 2019–2023 (USD MILLION)
  • TABLE 33 SOFTWARE TOOLS & FRAMEWORKS: MARKET, BY REGION, 2024–2029 (USD MILLION)
  • TABLE 34 NATURAL LANGUAGE UNDERSTANDING SOLUTIONS MARKET, BY DEPLOYMENT MODE, 2019–2023 (USD MILLION)
  • TABLE 35 NATURAL LANGUAGE UNDERSTANDING SOLUTIONS MARKET, BY DEPLOYMENT MODE, 2024–2029 (USD MILLION)
  • TABLE 36 CLOUD: NATURAL LANGUAGE UNDERSTANDING MARKET, BY REGION, 2019–2023 (USD MILLION)
  • TABLE 37 CLOUD: MARKET, BY REGION, 2024–2029 (USD MILLION)
  • TABLE 38 ON-PREMISES: MARKET, BY REGION, 2019–2023 (USD MILLION)
  • TABLE 39 ON-PREMISES: MARKET, BY REGION, 2024–2029 (USD MILLION)
  • TABLE 40 MARKET, BY SERVICE, 2019–2023 (USD MILLION)
  • TABLE 41 NATURAL LANGUAGE UNDERSTANDING MARKET, BY SERVICE, 2024–2029 (USD MILLION)
  • TABLE 42 SERVICES: MARKET, BY REGION, 2019–2023 (USD MILLION)
  • TABLE 43 SERVICES: MARKET, BY REGION, 2024–2029 (USD MILLION)
  • TABLE 44 MARKET, BY PROFESSIONAL SERVICE, 2019–2023 (USD MILLION)
  • TABLE 45 MARKET, BY PROFESSIONAL SERVICE, 2024–2029 (USD MILLION)
  • TABLE 46 PROFESSIONAL SERVICES: MARKET, BY REGION, 2019–2023 (USD MILLION)
  • TABLE 47 PROFESSIONAL SERVICES: MARKET, BY REGION, 2024–2029 (USD MILLION)
  • TABLE 48 TRAINING & CONSULTING: MARKET, BY REGION, 2019–2023 (USD MILLION)
  • TABLE 49 TRAINING & CONSULTING: NATURAL LANGUAGE UNDERSTANDING MARKET, BY REGION, 2024–2029 (USD MILLION)
  • TABLE 50 SYSTEM INTEGRATION & IMPLEMENTATION: MARKET, BY REGION, 2019–2023 (USD MILLION)
  • TABLE 51 SYSTEM INTEGRATION & IMPLEMENTATION: MARKET, BY REGION, 2024–2029 (USD MILLION)
  • TABLE 52 SUPPORT & MAINTENANCE: MARKET, BY REGION, 2019–2023 (USD MILLION)
  • TABLE 53 SUPPORT & MAINTENANCE: MARKET, BY REGION, 2024–2029 (USD MILLION)
  • TABLE 54 MANAGED SERVICES: MARKET, BY REGION, 2019–2023 (USD MILLION)
  • TABLE 55 MANAGED SERVICES: MARKET, BY REGION, 2024–2029 (USD MILLION)
  • TABLE 56 NATURAL LANGUAGE UNDERSTANDING MARKET, BY TYPE, 2019–2023 (USD MILLION)
  • TABLE 57 MARKET, BY TYPE, 2024–2029 (USD MILLION)
  • TABLE 58 RULE-BASED: MARKET, BY REGION, 2019–2023 (USD MILLION)
  • TABLE 59 RULE-BASED: MARKET, BY REGION, 2024–2029 (USD MILLION)
  • TABLE 60 STATISTICAL: MARKET, BY REGION, 2019–2023 (USD MILLION)
  • TABLE 61 STATISTICAL: MARKET, BY REGION, 2024–2029 (USD MILLION)
  • TABLE 62 HYBRID: MARKET, BY REGION, 2019–2023 (USD MILLION)
  • TABLE 63 HYBRID: MARKET, BY REGION, 2024–2029 (USD MILLION)
  • TABLE 64 MARKET, BY APPLICATION, 2019–2023 (USD MILLION)
  • TABLE 65 NATURAL LANGUAGE UNDERSTANDING MARKET, BY APPLICATION, 2024–2029 (USD MILLION)
  • TABLE 66 CHATBOTS & VIRTUAL ASSISTANTS: MARKET, BY REGION, 2019–2023 (USD MILLION)
  • TABLE 67 CHATBOTS & VIRTUAL ASSISTANTS: MARKET, BY REGION, 2024–2029 (USD MILLION)
  • TABLE 68 CUSTOMER EXPERIENCE MANAGEMENT: MARKET, BY REGION, 2019–2023 (USD MILLION)
  • TABLE 69 CUSTOMER EXPERIENCE MANAGEMENT: MARKET, BY REGION, 2024–2029 (USD MILLION)
  • TABLE 70 TEXT ANALYSIS: MARKET, BY REGION, 2019–2023 (USD MILLION)
  • TABLE 71 TEXT ANALYSIS: MARKET, BY REGION, 2024–2029 (USD MILLION)
  • TABLE 72 SENTIMENT ANALYSIS: MARKET, BY REGION, 2019–2023 (USD MILLION)
  • TABLE 73 SENTIMENT ANALYSIS: NATURAL LANGUAGE UNDERSTANDING MARKET, BY REGION, 2024–2029 (USD MILLION)
  • TABLE 74 IVR & MESSAGE ROUTING: MARKET, BY REGION, 2019–2023 (USD MILLION)
  • TABLE 75 IVR & MESSAGE ROUTING: MARKET, BY REGION, 2024–2029 (USD MILLION)
  • TABLE 76 DATA CAPTURE: MARKET, BY REGION, 2019–2023 (USD MILLION)
  • TABLE 77 DATA CAPTURE: MARKET, BY REGION, 2024–2029 (USD MILLION)
  • TABLE 78 MACHINE TRANSLATION: MARKET, BY REGION, 2019–2023 (USD MILLION)
  • TABLE 79 MACHINE TRANSLATION: MARKET, BY REGION, 2024–2029 (USD MILLION)
  • TABLE 80 OTHER APPLICATIONS: MARKET, BY REGION, 2019–2023 (USD MILLION)
  • TABLE 81 OTHER APPLICATIONS: MARKET, BY REGION, 2024–2029 (USD MILLION)
  • TABLE 82 NATURAL LANGUAGE UNDERSTANDING MARKET, BY VERTICAL, 2019–2023 (USD MILLION)
  • TABLE 83 MARKET, BY VERTICAL, 2024–2029 (USD MILLION)
  • TABLE 84 BFSI: MARKET, BY REGION, 2019–2023 (USD MILLION)
  • TABLE 85 BFSI: MARKET, BY REGION, 2024–2029 (USD MILLION)
  • TABLE 86 HEALTHCARE & LIFE SCIENCES: MARKET, BY REGION, 2019–2023 (USD MILLION)
  • TABLE 87 HEALTHCARE & LIFE SCIENCES: MARKET, BY REGION, 2024–2029 (USD MILLION)
  • TABLE 88 RETAIL & ECOMMERCE: MARKET, BY REGION, 2019–2023 (USD MILLION)
  • TABLE 89 RETAIL & ECOMMERCE: MARKET, BY REGION, 2024–2029 (USD MILLION)
  • TABLE 90 IT & ITES: MARKET, BY REGION, 2019–2023 (USD MILLION)
  • TABLE 91 IT & ITES: MARKET, BY REGION, 2024–2029 (USD MILLION)
  • TABLE 92 TRANSPORTATION & LOGISTICS: MARKET, BY REGION, 2019–2023 (USD MILLION)
  • TABLE 93 TRANSPORTATION & LOGISTICS: MARKET, BY REGION, 2024–2029 (USD MILLION)
  • TABLE 94 GOVERNMENT & PUBLIC SECTOR: MARKET, BY REGION, 2019–2023 (USD MILLION)
  • TABLE 95 GOVERNMENT & PUBLIC SECTOR: MARKET, BY REGION, 2024–2029 (USD MILLION)
  • TABLE 96 MEDIA & ENTERTAINMENT: NATURAL LANGUAGE UNDERSTANDING MARKET, BY REGION, 2019–2023 (USD MILLION)
  • TABLE 97 MEDIA & ENTERTAINMENT: MARKET, BY REGION, 2024–2029 (USD MILLION)
  • TABLE 98 MANUFACTURING: MARKET, BY REGION, 2019–2023 (USD MILLION)
  • TABLE 99 MANUFACTURING: MARKET, BY REGION, 2024–2029 (USD MILLION)
  • TABLE 100 TELECOMMUNICATION: MARKET, BY REGION, 2019–2023 (USD MILLION)
  • TABLE 101 TELECOMMUNICATION: MARKET, BY REGION, 2024–2029 (USD MILLION)
  • TABLE 102 OTHER VERTICALS: MARKET, BY REGION, 2019–2023 (USD MILLION)
  • TABLE 103 OTHER VERTICALS: MARKET, BY REGION, 2024–2029 (USD MILLION)
  • TABLE 104 MARKET, BY REGION, 2019–2023 (USD MILLION)
  • TABLE 105 NATURAL LANGUAGE UNDERSTANDING MARKET, BY REGION, 2024–2029 (USD MILLION)
  • TABLE 106 NORTH AMERICA: MARKET, BY COUNTRY, 2019–2023 (USD MILLION)
  • TABLE 107 NORTH AMERICA: MARKET, BY COUNTRY, 2024–2029 (USD MILLION)
  • TABLE 108 NORTH AMERICA: MARKET, BY OFFERING, 2019–2023 (USD MILLION)
  • TABLE 109 NORTH AMERICA: MARKET, BY OFFERING, 2024–2029 (USD MILLION)
  • TABLE 110 NORTH AMERICA: MARKET, BY SOLUTION, 2019–2023 (USD MILLION)
  • TABLE 111 NORTH AMERICA: MARKET, BY SOLUTION, 2024–2029 (USD MILLION)
  • TABLE 112 NORTH AMERICA: MARKET, BY DEPLOYMENT MODE, 2019–2023 (USD MILLION)
  • TABLE 113 NORTH AMERICA: MARKET, BY DEPLOYMENT MODE, 2024–2029 (USD MILLION)
  • TABLE 114 NORTH AMERICA: NATURAL LANGUAGE UNDERSTANDING MARKET, BY SERVICE, 2019–2023 (USD MILLION)
  • TABLE 115 NORTH AMERICA: MARKET, BY SERVICE, 2024–2029 (USD MILLION)
  • TABLE 116 NORTH AMERICA: MARKET, BY PROFESSIONAL SERVICE, 2019–2023 (USD MILLION)
  • TABLE 117 NORTH AMERICA: MARKET, BY PROFESSIONAL SERVICE, 2024–2029 (USD MILLION)
  • TABLE 118 NORTH AMERICA: MARKET, BY TYPE, 2019–2023 (USD MILLION)
  • TABLE 119 NORTH AMERICA: MARKET, BY TYPE, 2024–2029 (USD MILLION)
  • TABLE 120 NORTH AMERICA: MARKET, BY APPLICATION, 2019–2023 (USD MILLION)
  • TABLE 121 NORTH AMERICA: MARKET, BY APPLICATION, 2024–2029 (USD MILLION)
  • TABLE 122 NORTH AMERICA: MARKET, BY VERTICAL, 2019–2023 (USD MILLION)
  • TABLE 123 NORTH AMERICA: MARKET, BY VERTICAL, 2024–2029 (USD MILLION)
  • TABLE 124 US: NATURAL LANGUAGE UNDERSTANDING MARKET, BY OFFERING, 2019–2023 (USD MILLION)
  • TABLE 125 US: MARKET, BY OFFERING, 2024–2029 (USD MILLION)
  • TABLE 126 CANADA: MARKET, BY OFFERING, 2019–2023 (USD MILLION)
  • TABLE 127 CANADA: MARKET, BY OFFERING, 2024–2029 (USD MILLION)
  • TABLE 128 EUROPE: MARKET, BY COUNTRY, 2019–2023 (USD MILLION)
  • TABLE 129 EUROPE: MARKET, BY COUNTRY, 2024–2029 (USD MILLION)
  • TABLE 130 EUROPE: MARKET, BY OFFERING, 2019–2023 (USD MILLION)
  • TABLE 131 EUROPE: MARKET, BY OFFERING, 2024–2029 (USD MILLION)
  • TABLE 132 EUROPE: MARKET, BY SOLUTION, 2019–2023 (USD MILLION)
  • TABLE 133 EUROPE: MARKET, BY SOLUTION, 2024–2029 (USD MILLION)
  • TABLE 134 EUROPE: MARKET, BY DEPLOYMENT MODE, 2019–2023 (USD MILLION)
  • TABLE 135 EUROPE: MARKET, BY DEPLOYMENT MODE, 2024–2029 (USD MILLION)
  • TABLE 136 EUROPE: NATURAL LANGUAGE UNDERSTANDING MARKET, BY SERVICE, 2019–2023 (USD MILLION)
  • TABLE 137 EUROPE: MARKET, BY SERVICE, 2024–2029 (USD MILLION)
  • TABLE 138 EUROPE: MARKET, BY PROFESSIONAL SERVICE, 2019–2023 (USD MILLION)
  • TABLE 139 EUROPE: MARKET, BY PROFESSIONAL SERVICE, 2024–2029 (USD MILLION)
  • TABLE 140 EUROPE: MARKET, BY TYPE, 2019–2023 (USD MILLION)
  • TABLE 141 EUROPE: MARKET, BY TYPE, 2024–2029 (USD MILLION)
  • TABLE 142 EUROPE: MARKET, BY APPLICATION, 2019–2023 (USD MILLION)
  • TABLE 143 EUROPE: MARKET, BY APPLICATION, 2024–2029 (USD MILLION)
  • TABLE 144 EUROPE: MARKET, BY VERTICAL, 2019–2023 (USD MILLION)
  • TABLE 145 EUROPE: MARKET, BY VERTICAL, 2024–2029 (USD MILLION)
  • TABLE 146 UK: MARKET, BY OFFERING, 2019–2023 (USD MILLION)
  • TABLE 147 UK: MARKET, BY OFFERING, 2024–2029 (USD MILLION)
  • TABLE 148 GERMANY: MARKET, BY OFFERING, 2019–2023 (USD MILLION)
  • TABLE 149 GERMANY: MARKET, BY OFFERING, 2024–2029 (USD MILLION)
  • TABLE 150 FRANCE: MARKET, BY OFFERING, 2019–2023 (USD MILLION)
  • TABLE 151 FRANCE: NATURAL LANGUAGE UNDERSTANDING MARKET, BY OFFERING, 2024–2029 (USD MILLION)
  • TABLE 152 SPAIN: MARKET, BY OFFERING, 2019–2023 (USD MILLION)
  • TABLE 153 SPAIN: MARKET, BY OFFERING, 2024–2029 (USD MILLION)
  • TABLE 154 ITALY: MARKET, BY OFFERING, 2019–2023 (USD MILLION)
  • TABLE 155 ITALY: MARKET, BY OFFERING, 2024–2029 (USD MILLION)
  • TABLE 156 REST OF EUROPE: MARKET, BY OFFERING, 2019–2023 (USD MILLION)
  • TABLE 157 REST OF EUROPE: MARKET, BY OFFERING, 2024–2029 (USD MILLION)
  • TABLE 158 ASIA PACIFIC: MARKET, BY COUNTRY, 2019–2023 (USD MILLION)
  • TABLE 159 ASIA PACIFIC: MARKET, BY COUNTRY, 2024–2029 (USD MILLION)
  • TABLE 160 ASIA PACIFIC: MARKET, BY OFFERING, 2019–2023 (USD MILLION)
  • TABLE 161 ASIA PACIFIC: MARKET, BY OFFERING, 2024–2029 (USD MILLION)
  • TABLE 162 ASIA PACIFIC: MARKET, BY SOLUTION, 2019–2023 (USD MILLION)
  • TABLE 163 ASIA PACIFIC: NATURAL LANGUAGE UNDERSTANDING MARKET, BY SOLUTION, 2024–2029 (USD MILLION)
  • TABLE 164 ASIA PACIFIC: NATURAL LANGUAGE UNDERSTANDING SOLUTIONS MARKET, BY DEPLOYMENT MODE, 2019–2023 (USD MILLION)
  • TABLE 165 ASIA PACIFIC: NATURAL LANGUAGE UNDERSTANDING SOLUTIONS MARKET, BY DEPLOYMENT MODE, 2024–2029 (USD MILLION)
  • TABLE 166 ASIA PACIFIC: MARKET, BY SERVICE, 2019–2023 (USD MILLION)
  • TABLE 167 ASIA PACIFIC: MARKET, BY SERVICE, 2024–2029 (USD MILLION)
  • TABLE 168 ASIA PACIFIC: MARKET, BY PROFESSIONAL SERVICE, 2019–2023 (USD MILLION)
  • TABLE 169 ASIA PACIFIC: MARKET, BY PROFESSIONAL SERVICE, 2024–2029 (USD MILLION)
  • TABLE 170 ASIA PACIFIC: MARKET, BY TYPE, 2019–2023 (USD MILLION)
  • TABLE 171 ASIA PACIFIC: MARKET, BY TYPE, 2024–2029 (USD MILLION)
  • TABLE 172 ASIA PACIFIC: MARKET, BY APPLICATION, 2019–2023 (USD MILLION)
  • TABLE 173 ASIA PACIFIC: MARKET, BY APPLICATION, 2024–2029 (USD MILLION)
  • TABLE 174 ASIA PACIFIC: MARKET, BY VERTICAL, 2019–2023 (USD MILLION)
  • TABLE 175 ASIA PACIFIC: NATURAL LANGUAGE UNDERSTANDING MARKET, BY VERTICAL, 2024–2029 (USD MILLION)
  • TABLE 176 CHINA: MARKET, BY OFFERING, 2019–2023 (USD MILLION)
  • TABLE 177 CHINA: MARKET, BY OFFERING, 2024–2029 (USD MILLION)
  • TABLE 178 JAPAN: MARKET, BY OFFERING, 2019–2023 (USD MILLION)
  • TABLE 179 JAPAN: MARKET, BY OFFERING, 2024–2029 (USD MILLION)
  • TABLE 180 INDIA: MARKET, BY OFFERING, 2019–2023 (USD MILLION)
  • TABLE 181 INDIA: MARKET, BY OFFERING, 2024–2029 (USD MILLION)
  • TABLE 182 SOUTH KOREA: MARKET, BY OFFERING, 2019–2023 (USD MILLION)
  • TABLE 183 SOUTH KOREA: NATURAL LANGUAGE UNDERSTANDING MARKET, BY OFFERING, 2024–2029 (USD MILLION)
  • TABLE 184 ASEAN: MARKET, BY OFFERING, 2019–2023 (USD MILLION)
  • TABLE 185 ASEAN: MARKET, BY OFFERING, 2024–2029 (USD MILLION)
  • TABLE 186 REST OF ASIA PACIFIC: MARKET, BY OFFERING, 2019–2023 (USD MILLION)
  • TABLE 187 REST OF ASIA PACIFIC: MARKET, BY OFFERING, 2024–2029 (USD MILLION)
  • TABLE 188 MIDDLE EAST & AFRICA: MARKET, BY SUB-REGION, 2019–2023 (USD MILLION)
  • TABLE 189 MIDDLE EAST & AFRICA: MARKET, BY SUB-REGION, 2024–2029 (USD MILLION)
  • TABLE 190 MIDDLE EAST & AFRICA: MARKET, BY COUNTRY, 2019–2023 (USD MILLION)
  • TABLE 191 MIDDLE EAST & AFRICA: MARKET, BY COUNTRY, 2024–2029 (USD MILLION)
  • TABLE 192 MIDDLE EAST & AFRICA: NATURAL LANGUAGE UNDERSTANDING MARKET, BY OFFERING, 2019–2023 (USD MILLION)
  • TABLE 193 MIDDLE EAST & AFRICA: MARKET, BY OFFERING, 2024–2029 (USD MILLION)
  • TABLE 194 MIDDLE EAST & AFRICA: MARKET, BY SOLUTION, 2019–2023 (USD MILLION)
  • TABLE 195 MIDDLE EAST & AFRICA: MARKET, BY SOLUTION, 2024–2029 (USD MILLION)
  • TABLE 196 MIDDLE EAST & AFRICA: NATURAL LANGUAGE UNDERSTANDING SOLUTIONS MARKET, BY DEPLOYMENT MODE, 2019–2023 (USD MILLION)
  • TABLE 197 MIDDLE EAST & AFRICA: NATURAL LANGUAGE UNDERSTANDING SOLUTIONS MARKET, BY DEPLOYMENT MODE, 2024–2029 (USD MILLION)
  • TABLE 198 MIDDLE EAST & AFRICA: MARKET, BY SERVICE, 2019–2023 (USD MILLION)
  • TABLE 199 MIDDLE EAST & AFRICA: MARKET, BY SERVICE, 2024–2029 (USD MILLION)
  • TABLE 200 MIDDLE EAST & AFRICA: MARKET, BY PROFESSIONAL SERVICE, 2019–2023 (USD MILLION)
  • TABLE 201 MIDDLE EAST & AFRICA: MARKET, BY PROFESSIONAL SERVICE, 2024–2029 (USD MILLION)
  • TABLE 202 MIDDLE EAST & AFRICA: MARKET, BY TYPE, 2019–2023 (USD MILLION)
  • TABLE 203 MIDDLE EAST & AFRICA: NATURAL LANGUAGE UNDERSTANDING MARKET, BY TYPE, 2024–2029 (USD MILLION)
  • TABLE 204 MIDDLE EAST & AFRICA: MARKET, BY APPLICATION, 2019–2023 (USD MILLION)
  • TABLE 205 MIDDLE EAST & AFRICA: MARKET, BY APPLICATION, 2024–2029 (USD MILLION)
  • TABLE 206 MIDDLE EAST & AFRICA: MARKET, BY VERTICAL, 2019–2023 (USD MILLION)
  • TABLE 207 MIDDLE EAST & AFRICA: MARKET, BY VERTICAL, 2024–2029 (USD MILLION)
  • TABLE 208 UAE: MARKET, BY OFFERING, 2019–2023 (USD MILLION)
  • TABLE 209 UAE: MARKET, BY OFFERING, 2024–2029 (USD MILLION)
  • TABLE 210 SAUDI ARABIA: MARKET, BY OFFERING, 2019–2023 (USD MILLION)
  • TABLE 211 SAUDI ARABIA: MARKET, BY OFFERING, 2024–2029 (USD MILLION)
  • TABLE 212 TURKEY: MARKET, BY OFFERING, 2019–2023 (USD MILLION)
  • TABLE 213 TURKEY: MARKET, BY OFFERING, 2024–2029 (USD MILLION)
  • TABLE 214 QATAR: MARKET, BY OFFERING, 2019–2023 (USD MILLION)
  • TABLE 215 QATAR: MARKET, BY OFFERING, 2024–2029 (USD MILLION)
  • TABLE 216 REST OF MIDDLE EAST: MARKET, BY OFFERING, 2019–2023 (USD MILLION)
  • TABLE 217 REST OF MIDDLE EAST: MARKET, BY OFFERING, 2024–2029 (USD MILLION)
  • TABLE 218 LATIN AMERICA: MARKET, BY COUNTRY, 2019–2023 (USD MILLION)
  • TABLE 219 LATIN AMERICA: MARKET, BY COUNTRY, 2024–2029 (USD MILLION)
  • TABLE 220 LATIN AMERICA: MARKET, BY OFFERING, 2019–2023 (USD MILLION)
  • TABLE 221 LATIN AMERICA: NATURAL LANGUAGE UNDERSTANDING MARKET, BY OFFERING, 2024–2029 (USD MILLION)
  • TABLE 222 LATIN AMERICA: MARKET, BY SOLUTION, 2019–2023 (USD MILLION)
  • TABLE 223 LATIN AMERICA: MARKET, BY SOLUTION, 2024–2029 (USD MILLION)
  • TABLE 224 LATIN AMERICA: NATURAL LANGUAGE UNDERSTANDING SOLUTIONS MARKET, BY DEPLOYMENT MODE, 2019–2023 (USD MILLION)
  • TABLE 225 LATIN AMERICA: NATURAL LANGUAGE UNDERSTANDING SOLUTIONS MARKET, BY DEPLOYMENT MODE, 2024–2029 (USD MILLION)
  • TABLE 226 LATIN AMERICA: MARKET, BY SERVICE, 2019–2023 (USD MILLION)
  • TABLE 227 LATIN AMERICA: MARKET, BY SERVICE, 2024–2029 (USD MILLION)
  • TABLE 228 LATIN AMERICA: MARKET, BY PROFESSIONAL SERVICE, 2019–2023 (USD MILLION)
  • TABLE 229 LATIN AMERICA: MARKET, BY PROFESSIONAL SERVICE, 2024–2029 (USD MILLION)
  • TABLE 230 LATIN AMERICA: NATURAL LANGUAGE UNDERSTANDING MARKET, BY TYPE, 2019–2023 (USD MILLION)
  • TABLE 231 LATIN AMERICA: MARKET, BY TYPE, 2024–2029 (USD MILLION)
  • TABLE 232 LATIN AMERICA: MARKET, BY APPLICATION, 2019–2023 (USD MILLION)
  • TABLE 233 LATIN AMERICA: MARKET, BY APPLICATION, 2024–2029 (USD MILLION)
  • TABLE 234 LATIN AMERICA: MARKET, BY VERTICAL, 2019–2023 (USD MILLION)
  • TABLE 235 LATIN AMERICA: MARKET, BY VERTICAL, 2024–2029 (USD MILLION)
  • TABLE 236 BRAZIL: MARKET, BY OFFERING, 2019–2023 (USD MILLION)
  • TABLE 237 BRAZIL: MARKET, BY OFFERING, 2024–2029 (USD MILLION)
  • TABLE 238 MEXICO: MARKET, BY OFFERING, 2019–2023 (USD MILLION)
  • TABLE 239 MEXICO: MARKET, BY OFFERING, 2024–2029 (USD MILLION)
  • TABLE 240 ARGENTINA: MARKET, BY OFFERING, 2019–2023 (USD MILLION)
  • TABLE 241 ARGENTINA: NATURAL LANGUAGE UNDERSTANDING MARKET, BY OFFERING, 2024–2029 (USD MILLION)
  • TABLE 242 REST OF LATIN AMERICA: MARKET, BY OFFERING, 2019–2023 (USD MILLION)
  • TABLE 243 REST OF LATIN AMERICA: MARKET, BY OFFERING, 2024–2029 (USD MILLION)
  • TABLE 244 OVERVIEW OF STRATEGIES ADOPTED BY KEY NATURAL LANGUAGE UNDERSTANDING VENDORS
  • TABLE 245 MARKET: DEGREE OF COMPETITION
  • TABLE 246 MARKET: REGION FOOTPRINT
  • TABLE 247 MARKET: OFFERING FOOTPRINT
  • TABLE 248 MARKET: APPLICATION FOOTPRINT
  • TABLE 249 MARKET: VERTICAL FOOTPRINT
  • TABLE 250 MARKET: DETAILED LIST OF KEY STARTUPS/SMES
  • TABLE 251 MARKET: COMPETITIVE BENCHMARKING OF KEY STARTUPS/SMES
  • TABLE 252 NATURAL LANGUAGE UNDERSTANDING MARKET: PRODUCT LAUNCHES & ENHANCEMENTS, JANUARY 2021–JUNE 2024
  • TABLE 253 MARKET: DEALS, JANUARY 2021–JUNE 2024
  • TABLE 254 MICROSOFT: COMPANY OVERVIEW
  • TABLE 255 MICROSOFT: PRODUCTS/SOLUTIONS/SERVICES OFFERED
  • TABLE 256 MICROSOFT: PRODUCT LAUNCHES & ENHANCEMENTS
  • TABLE 257 MICROSOFT: DEALS
  • TABLE 258 GOOGLE: COMPANY OVERVIEW
  • TABLE 259 GOOGLE: PRODUCTS/SOLUTIONS/SERVICES OFFERED
  • TABLE 260 GOOGLE: PRODUCT LAUNCHES & ENHANCEMENTS
  • TABLE 261 GOOGLE: DEALS
  • TABLE 262 IBM: COMPANY OVERVIEW
  • TABLE 263 IBM: PRODUCTS/SOLUTIONS/SERVICES OFFERED
  • TABLE 264 IBM: PRODUCT LAUNCHES & ENHANCEMENTS
  • TABLE 265 IBM: DEALS
  • TABLE 266 AWS: COMPANY OVERVIEW
  • TABLE 267 AWS: PRODUCTS/SOLUTIONS/SERVICES OFFERED
  • TABLE 268 AWS: PRODUCT LAUNCHES & ENHANCEMENTS
  • TABLE 269 AWS: DEALS
  • TABLE 270 ORACLE: COMPANY OVERVIEW
  • TABLE 271 ORACLE: PRODUCTS/SOLUTIONS/SERVICES OFFERED
  • TABLE 272 ORACLE: PRODUCT LAUNCHES & ENHANCEMENTS
  • TABLE 273 ORACLE: DEALS
  • TABLE 274 SALESFORCE: COMPANY OVERVIEW
  • TABLE 275 SALESFORCE: PRODUCTS/SOLUTIONS/SERVICES OFFERED
  • TABLE 276 SALESFORCE: PRODUCT LAUNCHES & ENHANCEMENTS
  • TABLE 277 SALESFORCE: DEALS
  • TABLE 278 SAS INSTITUTE: COMPANY OVERVIEW
  • TABLE 279 SAS INSTITUTE: PRODUCTS/SOLUTIONS/SERVICES OFFERED
  • TABLE 280 SAS INSTITUTE: PRODUCT LAUNCHES & ENHANCEMENTS
  • TABLE 281 SAS INSTITUTE: DEALS
  • TABLE 282 OPENAI: COMPANY OVERVIEW
  • TABLE 283 OPENAI: PRODUCTS/SOLUTIONS/SERVICES OFFERED
  • TABLE 284 OPENAI: PRODUCT LAUNCHES & ENHANCEMENTS
  • TABLE 285 OPENAI: DEALS
  • TABLE 286 META: COMPANY OVERVIEW
  • TABLE 287 META: PRODUCTS/SOLUTIONS/SERVICES OFFERED
  • TABLE 288 META: PRODUCT LAUNCHES & ENHANCEMENTS
  • TABLE 289 META: DEALS
  • TABLE 290 SOUNDHOUND AI: COMPANY OVERVIEW
  • TABLE 291 SOUNDHOUND AI: PRODUCTS/SOLUTIONS/SERVICES OFFERED
  • TABLE 292 SOUNDHOUND AI: PRODUCT LAUNCHES & ENHANCEMENTS
  • TABLE 293 SOUNDHOUND AI: DEALS
  • TABLE 294 NATURAL LANGUAGE PROCESSING MARKET SIZE AND GROWTH RATE, 2017–2022 (USD MILLION, Y-O-Y)
  • TABLE 295 NATURAL LANGUAGE PROCESSING MARKET SIZE AND GROWTH RATE, 2023–2028 (USD MILLION, Y-O-Y)
  • TABLE 296 NATURAL LANGUAGE PROCESSING MARKET, BY OFFERING, 2017–2022 (USD MILLION)
  • TABLE 297 NATURAL LANGUAGE PROCESSING MARKET, BY OFFERING, 2023–2028 (USD MILLION)
  • TABLE 298 NATURAL LANGUAGE PROCESSING MARKET, BY TYPE, 2017–2022 (USD MILLION)
  • TABLE 299 NATURAL LANGUAGE PROCESSING MARKET, BY TYPE, 2023–2028 (USD MILLION)
  • TABLE 300 NATURAL LANGUAGE PROCESSING MARKET, BY APPLICATION, 2017–2022 (USD MILLION)
  • TABLE 301 NATURAL LANGUAGE PROCESSING MARKET, BY APPLICATION, 2023–2028 (USD MILLION)
  • TABLE 302 NATURAL LANGUAGE PROCESSING MARKET, BY TECHNOLOGY, 2017–2022 (USD MILLION)
  • TABLE 303 NATURAL LANGUAGE PROCESSING MARKET, BY TECHNOLOGY, 2023–2028 (USD MILLION)
  • TABLE 304 NATURAL LANGUAGE PROCESSING MARKET, BY VERTICAL, 2017–2022 (USD MILLION)
  • TABLE 305 NATURAL LANGUAGE PROCESSING MARKET, BY VERTICAL, 2023–2028 (USD MILLION)
  • TABLE 306 NATURAL LANGUAGE PROCESSING MARKET, BY REGION, 2017–2022 (USD MILLION)
  • TABLE 307 NATURAL LANGUAGE PROCESSING MARKET, BY REGION, 2023–2028 (USD MILLION)
  • TABLE 308 GLOBAL CONVERSATIONAL AI MARKET SIZE AND GROWTH RATE, 2019–2023 (USD MILLION, Y-O-Y)
  • TABLE 309 GLOBAL CONVERSATIONAL AI MARKET SIZE AND GROWTH RATE, 2024–2030 (USD MILLION, Y-O-Y)
  • TABLE 310 CONVERSATIONAL AI MARKET, BY OFFERING, 2019–2023 (USD MILLION)
  • TABLE 311 CONVERSATIONAL AI MARKET, BY OFFERING, 2024–2030 (USD MILLION)
  • TABLE 312 CONVERSATIONAL AI MARKET, BY BUSINESS FUNCTION, 2019–2023 (USD MILLION)
  • TABLE 313 CONVERSATIONAL AI MARKET, BY BUSINESS FUNCTION, 2024–2030 (USD MILLION)
  • TABLE 314 CONVERSATIONAL AI MARKET, BY CONVERSATIONAL AGENT TYPE, 2019–2023 (USD MILLION)
  • TABLE 315 CONVERSATIONAL AI MARKET, BY CONVERSATIONAL AGENT TYPE, 2024–2030 (USD MILLION)
  • TABLE 316 CONVERSATIONAL AI MARKET, BY INTEGRATION MODE, 2019–2023 (USD MILLION)
  • TABLE 317 CONVERSATIONAL AI MARKET, BY INTEGRATION MODE, 2024–2030 (USD MILLION)
  • TABLE 318 CONVERSATIONAL AI MARKET, BY VERTICAL, 2019–2023 (USD MILLION)
  • TABLE 319 CONVERSATIONAL AI MARKET, BY VERTICAL, 2024–2030 (USD MILLION)
  • TABLE 320 CONVERSATIONAL AI MARKET, BY REGION, 2019–2023 (USD MILLION)
  • TABLE 321 CONVERSATIONAL AI MARKET, BY REGION, 2024–2030 (USD MILLION)
LIST OF FIGURES
 
  • FIGURE 1 MARKET: RESEARCH DESIGN
  • FIGURE 2 NATURAL LANGUAGE UNDERSTANDING (NLU) MARKET: DATA TRIANGULATION
  • FIGURE 3 TOP-DOWN AND BOTTOM-UP APPROACHES
  • FIGURE 4 MARKET SIZE ESTIMATION METHODOLOGY - APPROACH 1 (SUPPLY-SIDE): REVENUE OF NLU MARKET SOLUTIONS/SERVICES
  • FIGURE 5 MARKET SIZE ESTIMATION METHODOLOGY - APPROACH 2, BOTTOM-UP (SUPPLY-SIDE): COLLECTIVE REVENUE OF ALL NLU MARKET SOLUTIONS/ SERVICES
  • FIGURE 6 MARKET SIZE ESTIMATION METHODOLOGY - APPROACH 3, BOTTOM-UP (SUPPLY-SIDE): COLLECTIVE REVENUE FROM ALL NLU MARKET SOLUTIONS/SERVICES
  • FIGURE 7 MARKET SIZE ESTIMATION METHODOLOGY - APPROACH 4, BOTTOM-UP (DEMAND-SIDE): SHARE OF NLU MARKET THROUGH OVERALL NLU MARKET SPENDING
  • FIGURE 8 SOLUTIONS SEGMENT TO HOLD LARGER MARKET SHARE THAN SERVICES SEGMENT IN 2024
  • FIGURE 9 SOFTWARE TOOLS & FRAMEWORKS SEGMENT TO LEAD MARKET IN 2024
  • FIGURE 10 CLOUD SEGMENT TO HOLD LARGER MARKET SHARE THAN ON-PREMISES SEGMENT IN 2024
  • FIGURE 11 PROFESSIONAL SERVICES SEGMENT TO HOLD LARGER MARKET SHARE THAN MANAGED SERVICES SEGMENT IN 2024
  • FIGURE 12 SYSTEM INTEGRATION & IMPLEMENTATION SEGMENT TO LEAD MARKET IN 2024
  • FIGURE 13 STATISTICAL SEGMENT TO LEAD MARKET IN 2024
  • FIGURE 14 TEXT ANALYSIS SEGMENT TO ACCOUNT FOR LARGEST MARKET SIZE IN 2024
  • FIGURE 15 HEALTHCARE & LIFESCIENCES SEGMENT TO REGISTER HIGHEST CAGR DURING FORECAST PERIOD
  • FIGURE 16 ASIA PACIFIC TO REGISTER HIGHEST CAGR DURING FORECAST PERIOD
  • FIGURE 17 RISING DEMAND FOR PERSONALIZED INTERACTIONS TO DRIVE MARKET
  • FIGURE 18 HEALTHCARE & LIFE SCIENCES SEGMENT TO REGISTER HIGHEST CAGR DURING FORECAST PERIOD
  • FIGURE 19 SOLUTIONS AND BFSI SEGMENTS TO ACCOUNT FOR LARGEST MARKET SHARES IN 2024
  • FIGURE 20 NORTH AMERICA TO ACCOUNT FOR LARGEST MARKET SHARE IN 2024
  • FIGURE 21 NATURAL LANGUAGE UNDERSTANDING MARKET: MARKET DRIVERS, RESTRAINTS, OPPORTUNITIES, AND CHALLENGES
  • FIGURE 22 TRENDS/DISRUPTIONS IMPACTING CUSTOMERS’ BUSINESSES
  • FIGURE 23 AVERAGE SELLING PRICE TREND OF KEY PLAYERS FOR TOP THREE APPLICATIONS
  • FIGURE 24 NATURAL LANGUAGE UNDERSTANDING MARKET: SUPPLY CHAIN ANALYSIS
  • FIGURE 25 KEY PLAYERS IN NATURAL LANGUAGE UNDERSTANDING MARKET ECOSYSTEM
  • FIGURE 26 ANNUAL NUMBER OF PATENTS GRANTED OVER LAST 10 YEARS, 2014–2024
  • FIGURE 27 TOP TEN COMPANIES WITH HIGHEST PERCENTAGE OF PATENT APPLICATIONS FOR NATURAL LANGUAGE UNDERSTANDING MARKET, 2014–2024
  • FIGURE 28 REGIONAL ANALYSIS OF PATENTS GRANTED FOR NATURAL LANGUAGE UNDERSTANDING MARKET, 2014–2024
  • FIGURE 29 PORTER’S FIVE FORCES ANALYSIS: NATURAL LANGUAGE UNDERSTANDING MARKET
  • FIGURE 30 INFLUENCE OF STAKEHOLDERS ON BUYING PROCESS FOR TOP THREE VERTICALS
  • FIGURE 31 KEY BUYING CRITERIA FOR TOP THREE VERTICALS
  • FIGURE 32 EVOLUTION OF NATURAL LANGUAGE UNDERSTANDING MARKET
  • FIGURE 33 NATURAL LANGUAGE UNDERSTANDING MARKET: INVESTMENT LANDSCAPE
  • FIGURE 34 SERVICES SEGMENT TO GROW AT HIGHER CAGR DURING FORECAST PERIOD
  • FIGURE 35 SOFTWARE TOOLS & FRAMEWORKS TO HOLD LARGER MARKET SIZE OF NLU SOLUTIONS
  • FIGURE 36 ON-PREMISES SEGMENT TO GROW AT HIGHER CAGR DURING FORECAST PERIOD
  • FIGURE 37 MANAGED SERVICES TO GROW AT HIGHER CAGR DURING FORECAST PERIOD
  • FIGURE 38 TRAINING & CONSULTING SERVICES SEGMENT TO GROW AT HIGHEST CAGR DURING FORECAST PERIOD
  • FIGURE 39 HYBRID SEGMENT TO GROW AT HIGHER CAGR DURING FORECAST PERIOD
  • FIGURE 40 SENTIMENT ANALYSIS SEGMENT TO GROW AT HIGHER CAGR DURING FORECAST PERIOD
  • FIGURE 41 HEALTHCARE & LIFESCIENCES SEGMENT TO GROW AT HIGHEST CAGR DURING FORECAST PERIOD
  • FIGURE 42 INDIA TO WITNESS HIGHEST CAGR DURING FORECAST PERIOD
  • FIGURE 43 ASIA PACIFIC TO REGISTER HIGHEST CAGR DURING FORECAST PERIOD
  • FIGURE 44 NORTH AMERICA: NATURAL LANGUAGE UNDERSTANDING MARKET SNAPSHOT
  • FIGURE 45 ASIA PACIFIC: NATURAL LANGUAGE UNDERSTANDING MARKET SNAPSHOT
  • FIGURE 46 REVENUE ANALYSIS FOR KEY COMPANIES IN PAST 5 YEARS
  • FIGURE 47 NATURAL LANGUAGE UNDERSTANDING MARKET: MARKET SHARE ANALYSIS
  • FIGURE 48 BRAND/PRODUCT COMPARATIVE ANALYSIS
  • FIGURE 49 NATURAL LANGUAGE UNDERSTANDING MARKET: COMPANY EVALUATION MATRIX (KEY PLAYERS), 2023
  • FIGURE 50 NATURAL LANGUAGE UNDERSTANDING MARKET: COMPANY FOOTPRINT
  • FIGURE 51 NATURAL LANGUAGE UNDERSTANDING MARKET: COMPANY EVALUATION MATRIX (STARTUPS/SMES), 2023
  • FIGURE 52 COMPANY VALUATION AND FINANCIAL METRICS OF KEY VENDORS
  • FIGURE 53 YEAR-TO-DATE (YTD) PRICE TOTAL RETURN AND 5-YEAR STOCK BETA OF KEY VENDORS
  • FIGURE 54 MICROSOFT: COMPANY SNAPSHOT
  • FIGURE 55 GOOGLE: COMPANY SNAPSHOT
  • FIGURE 56 IBM: COMPANY SNAPSHOT
  • FIGURE 57 AWS: COMPANY SNAPSHOT
  • FIGURE 58 ORACLE: COMPANY SNAPSHOT
  • FIGURE 59 SALESFORCE: COMPANY SNAPSHOT
  • FIGURE 60 META: COMPANY SNAPSHOT
  • FIGURE 61 SOUNDHOUND AI: COMPANY SNAPSHOT


The research study for the natural language understanding market involved extensive secondary sources, sources, directories, and several journals, including the Journal of the American Medical Informatics Association and The Association for Natural Language Processing Providers. Primary sources were mainly industry experts from the core and related industries, preferred NLU, third-party service providers, consulting service providers, end users, and other commercial enterprises. In-depth interviews were conducted with various primary respondents, including key industry participants and subject matter experts, to obtain and verify critical qualitative and quantitative information and assess the market’s prospects.

Secondary Research

The market size of companies offering NLU solutions and services was arrived at based on secondary data available through paid and unpaid sources. It was also arrived at by analysing the product portfolios of major companies and rating the companies based on their performance and quality.

In the secondary research process, various sources were referred to, for identifying and collecting information for this study. Secondary sources included annual reports, press releases, and investor presentations of companies; white papers, journals, and certified publications; and articles from recognized authors, directories, and databases. The data was also collected from other secondary sources, such as journals, government websites, blogs, and vendor websites. Additionally, NLU spending of various countries was extracted from the respective sources. Secondary research was mainly used to obtain key information related to the industry’s value chain and supply chain to identify key players based on solutions, services, market classification, and segmentation according to offerings of major players, industry trends related to solutions, solution by deployment mode, services, type, application, verticals and regions and key developments from both market- and technology-oriented perspectives.

Primary Research

In the primary research process, various primary sources from both supply and demand sides were interviewed to obtain qualitative and quantitative information on the market. The primary sources from the supply side included various industry experts, including Chief Experience Officers (CXOs); Vice Presidents (VPs); directors from business development, marketing, and NLU expertise; related key executives from NLU solution vendors, SIs, professional service providers, and industry associations; and key opinion leaders.

Primary interviews were conducted to gather insights, such as market statistics, revenue data collected from solutions and services, market breakups, market size estimations, market forecasts, and data triangulation. Primary research also helped in understanding various trends related to technologies, applications, deployments, and regions. Demand-side stakeholders, such as Chief Information Officers (CIOs), Chief Technology Officers (CTOs), Chief Strategy Officers (CSOs), and end-users using NLU solutions were interviewed to understand the buyer’s perspective on suppliers, products, service providers, and their current usage of NLU solutions and services, which would impact the overall NLU market.

The following is the breakup of primary profiles:
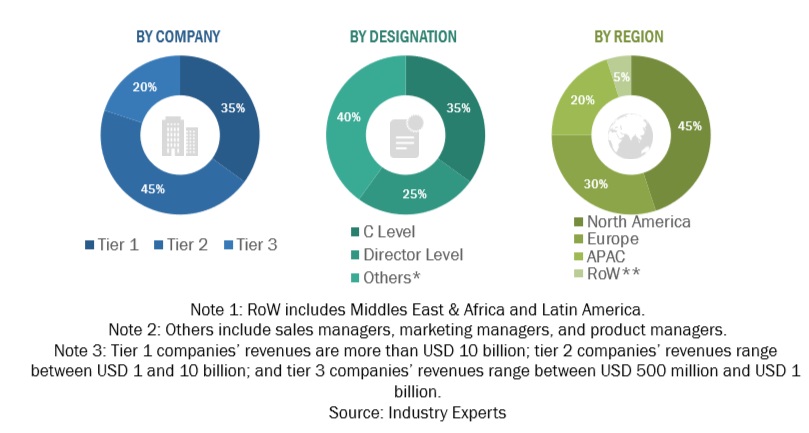
Natural Language Understanding (NLU) Market  Size, and Share

To know about the assumptions considered for the study, download the pdf brochure

Natural Language Understanding Market Size Estimation

Multiple approaches were adopted for estimating and forecasting the natural language understanding (NLU)market. The first approach involves estimating the market size by summation of companies’ revenue generated through the sale of solutions and services.

Natural Language Understanding Market Size Estimation Methodology-Top-down approach

In the top-down approach, an exhaustive list of all the vendors offering solutions and services in the natural language understanding (NLU) market was prepared. The revenue contribution of the market vendors was estimated through annual reports, press releases, funding, investor presentations, paid databases, and primary interviews. Each vendor's offerings were evaluated based on the breadth of solutions and services, types, application, and vertical. The aggregate of all the companies’ revenue was extrapolated to reach the overall market size. Each subsegment was studied and analyzed for its global market size and regional penetration. The markets were triangulated through both primary and secondary research. The primary procedure included extensive interviews for key insights from industry leaders, such as CIOs, CEOs, VPs, directors, and marketing executives. The market numbers were further triangulated with the existing MarketsandMarkets’ repository for validation

Market Size Estimation Methodology-Bottom-up approach

In the bottom-up approach, the adoption rate of NLU solutions and services among different verticals in key countries with respect to their regions contributing the most to the market share was identified. For cross-validation, the adoption of NLU solutions and services among industries, along with different use cases with respect to their regions, was identified and extrapolated. Weightage was given to use cases identified in different regions for the market size calculation.

Based on the market numbers, the regional split was determined by primary and secondary sources. The procedure included the analysis of the NLU market’s regional penetration. Based on secondary research, the regional spending on Information and Communications Technology (ICT), socio-economic analysis of each country, strategic vendor analysis of major NLU providers, and organic and inorganic business development activities of regional and global players were estimated. With the data triangulation procedure and data validation through primaries, the exact values of the overall natural language understanding (NLU) market size and segments’ size were determined and confirmed using the study.

Top-down and Bottom-up approaches
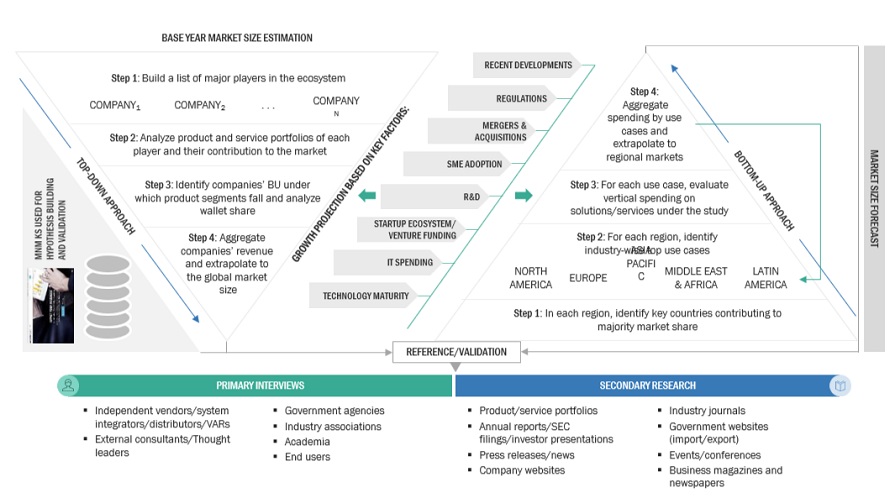
Natural Language Understanding (NLU) Market  Top Down and Bottom Up Approach

Data Triangulation

After arriving at the overall market size using the market size estimation processes as explained above, the market was split into several segments and subsegments. To complete the overall market engineering process and arrive at the exact statistics of each market segment and subsegment, data triangulation and market breakup procedures were employed, wherever applicable. The overall market size was then used in the top-down procedure to estimate the size of other individual markets via percentage splits of the market segmentation.

Natural Language Understanding Market Definition

According to IBM, Natural language understanding (NLU) is a subset of NLP that focuses on analyzing the meaning behind sentences. NLU enables software to find similar meanings in different sentences or to process words that have different meanings.

As per Forethought, NLU is a part of artificial intelligence that allows computers to understand, interpret, and respond to human language. NLU helps computers comprehend the meaning of words, phrases, and the context in which they are used.

Stakeholders

  • NLU Vendors
  • NLU Solution Vendors
  • Managed Service Providers
  • Support & Maintenance Service Providers
  • System Integrators (SIs)/Migration Service Providers
  • Value-added Resellers (VARs) and Distributors
  • Distributors and Value-added Resellers (VARs)
  • System Integrators (SIs)
  • Independent Software Vendors (ISV)
  • Third-party Providers
  • Technology Providers

Report Objectives

  • To define, describe, and predict the natural language understanding (NLU) market, by offering (solutions [platform and software tools & frameowrks], solutions by deployment mode, and services), type, application, vertical and region.
  • To describe and forecast the NLU market, in terms of value, by region—North America, Europe, Asia Pacific, Middle East & Africa and Latin America.
  • To provide detailed information regarding major factors influencing the market growth (drivers, restraints, opportunities, and challenges)
  • To strategically analyze micromarkets with respect to individual growth trends, prospects, and contribution to the overall NLU market.
  • To profile key players and comprehensively analyze their market positions in terms of ranking and core competencies, along with detailing the competitive landscape for market leaders.
  • To analyze competitive developments such as joint ventures, mergers and acquisitions, product developments, and ongoing research and development (R&D) in the NLU market
  • To provide the illustrative segmentation, analysis, and projection of the main regional markets.

Available Customizations

With the given market data, MarketsandMarkets offers customizations as per the company’s specific needs. The following customization options are available for the report:

Product Analysis

  • The product matrix provides a detailed comparison of the product portfolio of each company.

Geographic Analysis as per Feasibility

  • Further breakup of the North American natural language understanding (NLU) Market
  • Further breakup of the European natural language understanding (NLU) Market
  • Further breakup of the Asia Pacific natural language understanding (NLU) Market
  • Further breakup of the Middle East & Africa natural language understanding (NLU) Market
  • Further breakup of the Latin American natural language understanding (NLU) Market

Company Information

  • Detailed analysis and profiling of additional market players (up to five)

Previous Versions of this Report

Custom Market Research Services

We Will Customise The Research For You, In Case The Report Listed Above Does Not Meet With Your Requirements

Get 10% Free Customisation

Growth opportunities and latent adjacency in Natural Language Understanding (NLU) Market

DMCA.com Protection Status