Nuclear Power Plant Control System Market

Nuclear Power Plant Control System Market by Component (Hardware, Software, Services), Solution (SCADA, PLC, DCS), Application (Generator Excitation & Electrical Control, Turbine & Auxiliaries Control System) and Region - Global Forecast to 2028

Report Code: EP 8936 Feb, 2024, by marketsandmarkets.com

[185 Pages Report] The global nuclear power plant control system market is projected to reach USD 825 million by 2028 from an estimated USD 636 million in 2023, at a CAGR of 5.3% during the forecast period. Advances in control system technologies enhance the safety, efficiency, and reliability of nuclear power plants. The integration of digital control systems and automation is a notable trend. Many countries are investing in upgrading and extending the lifespan of existing nuclear power plants, driving the demand for modern control systems.

Nuclear Power Plant Control System Market

To know about the assumptions considered for the study, Request for Free Sample Report

Nuclear Power Plant Control System Market

To know about the assumptions considered for the study, download the pdf brochure

Nuclear Power Plant Control System Market Dynamics

Driver: Global Nuclear Power Expansion

The market for nuclear power plant control systems is being significantly driven by the spread of nuclear power throughout the world. Nuclear power has garnered attention once again as a practical and ecological solution as nations throughout the world struggle with the rising demand for electricity and the necessity of shifting to low-carbon energy sources. Nuclear power facilities must have sophisticated and reliable control systems in light of the growing interest in nuclear power expansion around the world. The safe, effective, and dependable functioning of nuclear facilities is greatly dependent on these control systems. They include safety features, human-machine interfaces, instrumentation and control systems, and reactor protection systems, all of which work together to maintain the stability of the facility.

Restraint: Availability of alternative energy source

The market for nuclear power plant control systems is being significantly impacted by the advent of alternative energy sources. Renewable energy sources in particular have gained prominence as the world's energy landscape undergoes a dramatic change towards sustainability and varied sources. This shifting dynamic presents problems for the nuclear power sector and, by extension, the market for control systems used in nuclear power reactors. With considerable technological improvements and cost reductions, renewable energy sources—like solar, wind, and hydropower—have become more and more appealing to consumers, businesses, and governments. When opposed to nuclear power, the renewable energy sector offers less perceived danger and more environmentally beneficial options.

Opportunities: Development of new control system technologies

The market for nuclear power plant control systems has a lot to gain from the development of new technologies, which could lead to improvements in safety, efficiency, and flexibility in the ever-changing nuclear energy environment. The nuclear power industry is turning to innovation in control systems as a strategic focal area as technology advances continue to transform the energy sector. The incorporation of digital control systems is a significant opportunity. Nuclear power facilities now have more accurate data analysis, monitoring, and real-time decision-making capabilities thanks to the shift towards digitization. More responsiveness, flexibility, and dependability of advanced digital control systems provide better response to changing operating situations.

Challenges: Radioactive waste management

The management of radioactive waste is a noteworthy obstacle for the nuclear power plant control system industry, necessitating advanced methods to tackle the intricate and enduring characteristics of nuclear waste. Nuclear power plants produce many types of radioactive waste that need to be handled, contained, and disposed of carefully as they produce electricity through fission processes. The variety of radioactive waste types—from low-level to high-level waste—is one of the main obstacles. Spent nuclear fuel and other extremely radioactive elements are classified as high-level waste, whereas contaminated tools and protective clothes are classified as low-level waste. Controlling this range of waste requires specialised control systems that can guarantee the safe isolation and observation of every waste kind.

Nuclear Power Plant Control System Market Ecosystem

In this market, prominent companies stand out as well-established and financially stable providers of Nuclear Power Plant Control System products and services. With years of experience, these companies boast a diverse product portfolio, cutting-edge technologies, and robust global sales and marketing networks. Their proven track record in the industry positions them as reliable and trusted partners for customers seeking Nuclear Power Plant Control System solutions. These companies have demonstrated their ability to adapt to market dynamics and consistently deliver high-quality products and services, making them leaders in meeting the demands of the energy and power sector. Prominent companies in this market include Siemens (Germany), ABB (Switzerland), General Electric (US), Fortum (Europe), Framatome (France).

Nuclear <a  data-cke-saved-href=

The Hardware segment, component, is expected to be the largest market during the forecast period.

This report segments the market based on component into three categories: hardware, software, and services. The hardware segment is expected to be the largest market during the forecast period. As plants expand or their control requirements evolve, hardware can seamlessly scale up or down by adding or removing modules. This eliminates the need for costly overhauls, ensuring systems remain optimized for current needs. By embracing modular and scalable hardware, the nuclear power plant control system market can cater to the diverse needs of existing and future plants, ensuring safety, efficiency, and adaptability in a rapidly evolving energy landscape.

By application, the Turbine & auxiliaries control system is expected to be the largest segment during the forecast period.

This report segments the market based on application into four segments: boiler & auxiliaries control, generator excitation & electrical control, turbine & auxiliaries control system, and other applications. The turbine & auxiliaries control system segment is expected to be the fastest-growing segment of the nuclear power plant control system market during the forecast period. The integration of digital control solutions in turbine and auxiliaries control systems represents a paradigm shift towards a more interconnected, responsive, and efficient operational framework. This sophisticated integration not only meets the rigorous demands of safety and regulatory compliance in the nuclear power sector but also positions these control systems at the forefront of technological innovation, ensuring the sustained performance and longevity of vital power plant assets.

Asia Pacific: The largest in the nuclear power plant control system market.

Asia Pacific is expected to be the largest region in the nuclear power plant control system market between 2023–2038. Asia Pacific has been leading the market. The commitment to energy independence through nuclear power is further strengthened by advancements in reactor technologies, safety measures, and international collaborations. As countries in the Asia Pacific region strive to harness the benefits of nuclear energy, they are actively engaging in partnerships, technology transfers, and collaborations to ensure the responsible development and deployment of nuclear power plants and their associated control systems.

North American Nuclear Power Plant Control System Market Size, and Share

Key Market Players

The market is dominated by a few major players that have a wide regional presence. The major players in the nuclear power plant control system market include Siemens (Germany), ABB (Switzerland), General Electric (US), Fortum (Europe), Framatome (France). Between 2019 and 2023, Strategies such as new product launches, contracts, agreements, partnerships, collaborations, acquisitions, and expansions are followed by these companies to capture a larger share of the market.

Get online access to the report on the World's First Market Intelligence Cloud

  • Easy to Download Historical Data & Forecast Numbers
  • Company Analysis Dashboard for high growth potential opportunities
  • Research Analyst Access for customization & queries
  • Competitor Analysis with Interactive dashboard
  • Latest News, Updates & Trend analysis
Request Sample

Scope of the Report

Report Metric

Details

Market size available for years

2022–2028

Base year considered

2022

Forecast period

2022–2028

Forecast units

Value (USD Million)

Segments Covered

Nuclear Power Plant Control System Market by Component, Solution,  Application, and Region.

Geographies covered

Americas, Asia Pacific, Europe, and Middle East & Africa.

Companies covered

Siemens (Germany), ABB (Switzerland), General Electric (US), Fortum (Europe), Framatome (France), Emerson Electric Co. (US), Mitsubishi Electric Corporation (Japan),  NuScale Power, LLC (US), Rolls-Royce plc (UK) , Honeywell International Inc,(Germany), Molorola Solutions, Inc. (US), Curtiss-Wright Corporation (US), Fortum (Europe), Lockheed Martin Corporation (US), Fortinet (Europe), Westinghouse Electric Company LLC (Europe), L&T Electrical & Automation (India), McAfee, LLC (US), Cyberbit (US), CyberArk Software Ltd, (US), Efacec (Portugal).

This research report categorizes the market based on Component, Solution, application, and region.

On the basis of Component, the Nuclear power plant control system market has been segmented as follows:
  • Hardware
    • Controller
    • Input/output devices
    • Workstations
    • Networking hardware
  • Software
  • Services
On the basis of Solution, the market has been segmented as follows:
  • Supervisory Control & Data Acquisition (SCADA)
  • Programmable Logic Controller (PLC)
  • Distributed Control System (DCS)
  • Industrial Safety
  • Others
On the basis of Application, the Nuclear power plant control system market has been segmented as follows:
  • Boiler & auxiliaries control
  • Generator excitation & electrical control
  • Turbine & auxiliaries control system
  • Other Applications
Based on region, the market has been segmented as follows:
  • Americas
  • Asia Pacific
  • Europe
  • Middle East & Africa

Recent Developments

  • In March 2023, Mitsubishi Electric Corporation announced that its U.S. subsidiary Mitsubishi Electric Power Products, Inc. (MEPPI) has received a contract from Holtec International (Holtec), a premier supplier of equipment and systems for the energy industry, to expedite the design engineering of the digital instrumentation and control systems (I&C) for Holtec's SMR-160 small modular reactor which is a next-generation small reactor with superior safety and reliability levels, featuring a natural cooling ability in case of any accidents.
  • In November 2023, Fortum and the Swedish nuclear technology company Studsvik entered into a partnership to explore conditions for new nuclear in Sweden. The collaboration is part of Fortum’s ongoing feasibility study to explore business opportunities in new nuclear both in Finland and Sweden.
  • In September 2023 Framatome announced a three-year collaboration agreement with AGH University of Krakow (pol. Akademia Górniczo-Hutnicza), Poland, to cultivate educational programs that foster growth opportunities for students pursuing nuclear energy professions. Framatome and AGH University will promote joint initiatives to support the nation’s nuclear program by preparing graduate and post-graduate engineering students for long-term careers in nuclear energy.

Frequently Asked Questions (FAQ):

To speak to our analyst for a discussion on the above findings, click Speak to Analyst

TABLE OF CONTENTS
 
1 INTRODUCTION (Page No. - 26)
    1.1 STUDY OBJECTIVES 
    1.2 MARKET DEFINITION 
    1.3 INCLUSIONS AND EXCLUSIONS 
    1.4 STUDY SCOPE 
           1.4.1 MARKETS COVERED
           1.4.2 REGIONAL SCOPE
           1.4.3 YEARS CONSIDERED
           1.4.4 CURRENCY CONSIDERED
    1.5 LIMITATIONS 
    1.6 STAKEHOLDERS 
    1.7 IMPACT OF RECESSION 
 
2 RESEARCH METHODOLOGY (Page No. - 31)
    2.1 RESEARCH DATA 
           FIGURE 1 NUCLEAR POWER PLANT CONTROL SYSTEM MARKET: RESEARCH DESIGN
    2.2 MARKET BREAKDOWN AND DATA TRIANGULATION 
           FIGURE 2 DATA TRIANGULATION
    2.3 PRIMARY AND SECONDARY RESEARCH 
           2.3.1 SECONDARY DATA
                    2.3.1.1 List of major secondary sources
                    2.3.1.2 Key data from secondary sources
           2.3.2 PRIMARY DATA
                    2.3.2.1 List of primary interview participants
                    2.3.2.2 Key data from primary sources
                    2.3.2.3 Breakdown of primaries
                               FIGURE 3 BREAKDOWN OF PRIMARIES: BY COMPANY TYPE, DESIGNATION, AND REGION
    2.4 MARKET SIZE ESTIMATION 
           2.4.1 BOTTOM-UP APPROACH
                    FIGURE 4 NUCLEAR POWER PLANT CONTROL SYSTEMS MARKET: BOTTOM-UP APPROACH
           2.4.2 TOP-DOWN APPROACH
                    FIGURE 5 MARKET: TOP-DOWN APPROACH
    2.5 DEMAND-SIDE ANALYSIS 
           FIGURE 6 NUCLEAR POWER PLANT CONTROL SYSTEM: DEMAND-SIDE ANALYSIS
           2.5.1 DEMAND-SIDE METRICS
                    FIGURE 7 METRICS CONSIDERED TO ANALYZE AND ASSESS DEMAND FOR NUCLEAR POWER PLANT CONTROL SYSTEMS
                    2.5.1.1 Assumptions for demand-side analysis
                    2.5.1.2 Calculations for demand-side analysis
    2.6 SUPPLY-SIDE ANALYSIS 
           2.6.1 DEMAND-SIDE METRICS
                    FIGURE 8 METRICS CONSIDERED TO ASSESS SUPPLY OF NUCLEAR POWER PLANT CONTROL SYSTEMS
                    FIGURE 9 MARKET: SUPPLY-SIDE ANALYSIS
                    2.6.1.1 Calculations for supply-side analysis
                    2.6.1.2 Assumptions for supply-side analysis
    2.7 FORECAST 
    2.8 RISK ASSESSMENT 
    2.9 RECESSION IMPACT 
 
3 EXECUTIVE SUMMARY (Page No. - 43)
    TABLE 1 NUCLEAR POWER PLANT CONTROL SYSTEM MARKET SNAPSHOT 
    FIGURE 10 HARDWARE SEGMENT TO DOMINATE MARKET DURING FORECAST PERIOD 
    FIGURE 11 DISTRIBUTED CONTROL SYSTEMS SEGMENT TO LEAD NUCLEAR POWER PLANT CONTROL SYSTEMS MARKET DURING FORECAST PERIOD 
    FIGURE 12 TURBINE & AUXILIARIES CONTROL SYSTEM TO LEAD NUCLEAR POWER PLANT CONTROL SYSTEMS MARKET DURING FORECAST PERIOD 
    FIGURE 13 ASIA PACIFIC DOMINATED MARKET IN 2022 
 
4 PREMIUM INSIGHTS (Page No. - 47)
    4.1 ATTRACTIVE OPPORTUNITIES FOR PLAYERS IN NUCLEAR POWER PLANT CONTROL SYSTEM MARKET 
           FIGURE 14 GLOBAL NUCLEAR POWER CAPACITY EXPANSION TO CREATE LUCRATIVE OPPORTUNITIES FOR MARKET PLAYERS
    4.2 NUCLEAR POWER PLANT CONTROL SYSTEM MARKET, BY COMPONENT 
           FIGURE 15 HARDWARE SEGMENT DOMINATED MARKET IN 2022
    4.3 MARKET, BY SOLUTION 
           FIGURE 16 DISTRIBUTED CONTROL SYSTEMS (DCSS) SEGMENT DOMINATED MARKET IN 2022
    4.4 MARKET, BY APPLICATION 
           FIGURE 17 TURBINE & AUXILIARIES CONTROL SYSTEM SEGMENT DOMINATED MARKET IN 2022
           FIGURE 18 ASIA PACIFIC TO REGISTER HIGHEST CAGR DURING FORECAST PERIOD
    4.5 ASIA PACIFIC MARKET, BY APPLICATION AND COUNTRY 
           FIGURE 19 TURBINE & AUXILIARIES CONTROL SYSTEM SEGMENT AND CHINA DOMINATED ASIA PACIFIC MARKET IN 2022
 
5 MARKET OVERVIEW (Page No. - 50)
    5.1 INTRODUCTION 
    5.2 MARKET DYNAMICS 
           FIGURE 20 NUCLEAR POWER PLANT CONTROL SYSTEM MARKET: DRIVERS, RESTRAINTS, OPPORTUNITIES, AND CHALLENGES
           5.2.1 DRIVERS
                    5.2.1.1 Growing demand for clean energy
                               FIGURE 21 GLOBAL ENERGY MIX, BY SOURCE, 2022
                    5.2.1.2 Global nuclear power capacity expansion
                    5.2.1.3 Government-led support and implementation of stringent safety regulations to curb potential risks associated with nuclear technology
           5.2.2 RESTRAINTS
                    5.2.2.1 Availability of alternative energy sources
                    5.2.2.2 Nuclear proliferation concerns
           5.2.3 OPPORTUNITIES
                    5.2.3.1 Development of new control system technologies
                    5.2.3.2 Expansion of nuclear power plant control systems market in emerging economies
           5.2.4 CHALLENGES
                    5.2.4.1 Radioactive waste management
                    5.2.4.2 Lack of skilled workforce to operate industrial automation devices and systems
    5.3 TRENDS/DISRUPTIONS IMPACTING CUSTOMERS’ BUSINESSES 
           FIGURE 22 TRENDS/DISRUPTIONS IMPACTING CUSTOMERS’ BUSINESSES
    5.4 PRICING ANALYSIS 
           5.4.1 AVERAGE PRICE TREND OF NUCLEAR POWER PLANT CONTROL SYSTEMS, BY REGION
                    TABLE 2 AVERAGE PRICE TREND OF NUCLEAR POWER PLANT CONTROL SYSTEMS, BY REGION, 2022–2028 (USD/KWE)
                    FIGURE 23 AVERAGE PRICE TREND OF NUCLEAR POWER PLANT CONTROL SYSTEMS, BY REGION, 2022–2028 (USD/KWE)
           5.4.2 INDICATIVE PRICE TREND OF NUCLEAR POWER PLANT CONTROL SYSTEMS, BY SOLUTION
                    TABLE 3 INDICATIVE PRICE TREND OF NUCLEAR POWER PLANT CONTROL SYSTEMS, BY SOLUTION, 2022–2028 (USD THOUSAND)
                    FIGURE 24 INDICATIVE PRICE TREND OF NUCLEAR POWER PLANT CONTROL SYSTEMS, BY SOLUTION, 2022–2028 (USD THOUSAND)
    5.5 SUPPLY CHAIN ANALYSIS 
           FIGURE 25 MARKET: SUPPLY CHAIN ANALYSIS
           5.5.1 RAW MATERIAL SUPPLIERS
           5.5.2 COMPONENT MANUFACTURERS
           5.5.3 SYSTEM INTEGRATORS/ASSEMBLERS
           5.5.4 DISTRIBUTORS AND POST-SALES SERVICE PROVIDERS
    5.6 ECOSYSTEM/MARKET MAP 
           FIGURE 26 NUCLEAR POWER PLANT CONTROL SYSTEM MARKET MAP
           TABLE 4 COMPANIES AND THEIR ROLES IN NUCLEAR POWER PLANT CONTROL SYSTEM ECOSYSTEM
    5.7 REGULATORY LANDSCAPE 
           5.7.1 REGULATORY BODIES, GOVERNMENT AGENCIES, AND OTHER ORGANIZATIONS
                    TABLE 5 AMERICAS: LIST OF REGULATORY BODIES, GOVERNMENT AGENCIES, AND OTHER ORGANIZATIONS
                    TABLE 6 EUROPE: LIST OF REGULATORY BODIES, GOVERNMENT AGENCIES, AND OTHER ORGANIZATIONS
                    TABLE 7 ASIA PACIFIC: LIST OF REGULATORY BODIES, GOVERNMENT AGENCIES, AND OTHER ORGANIZATIONS
                    TABLE 8 MIDDLE EAST & AFRICA: LIST OF REGULATORY BODIES, GOVERNMENT AGENCIES, AND OTHER ORGANIZATIONS
           5.7.2 REGULATIONS RELATED TO NUCLEAR POWER PLANT CONTROL SYSTEMS
                    TABLE 9 MARKET: REGULATIONS
    5.8 PATENT ANALYSIS 
           FIGURE 27 MARKET: INNOVATIONS AND PATENT REGISTRATIONS, 2012–2022
           5.8.1 LIST OF MAJOR PATENTS
                    TABLE 10 MARKET: INNOVATIONS AND PATENT REGISTRATIONS, 2018–2022
    5.9 CASE STUDY ANALYSIS 
           5.9.1 KRŠKO IMPLEMENTED ADVANCED DIGITAL CONTROL SYSTEM (DCS) IN NUCLEAR POWER PLANT (SLOVENIA)
                    5.9.1.1 Problem Statement
                    5.9.1.2 Solution
           5.9.2 FORSMARK NUCLEAR POWER PLANT INTEGRATED CUTTING-EDGE FUEL MANAGEMENT OPTIMIZATION SOFTWARE INTO PLANT’S CONTROL SYSTEM (SWEDEN)
                    5.9.2.1 Problem Statement
                    5.9.2.2 Solution
           5.9.3 OLKILUOTO NUCLEAR POWER PLANT (NPP) IMPLEMENTED ROBUST CYBER SECURITY MEASURES TO MITIGATE RISKS (FINLAND)
                    5.9.3.1 Problem Statement
                    5.9.3.2 Solution
    5.10 TECHNOLOGY ANALYSIS 
           5.10.1 ARTIFICIAL INTELLIGENCE (AI) AND MACHINE LEARNING (ML)
           5.10.2 DIGITAL TWINS
           5.10.3 CYBERSECURITY
    5.11 KEY CONFERENCES AND EVENTS, 2023–2024 
                    TABLE 11 MARKET: LIST OF KEY CONFERENCES AND EVENTS, 2023–2024
    5.12 TRADE ANALYSIS 
           5.12.1 EXPORT SCENARIO
                    TABLE 12 EXPORT DATA FOR HS CODE 84-COMPLIANT PRODUCTS, BY COUNTRY, 2020–2022 (USD)
                    FIGURE 28 EXPORT DATA FOR HS CODE 84-COMPLIANT PRODUCTS FOR TOP FIVE COUNTRIES, 2020–2022 (USD)
           5.12.2 IMPORT SCENARIO
                    TABLE 13 IMPORT SCENARIO FOR HS CODE 84-COMPLIANT PRODUCTS, BY COUNTRY, 2020–2022 (USD)
                    FIGURE 29 IMPORT DATA FOR HS CODE 84-COMPLIANT PRODUCTS FOR TOP FIVE COUNTRIES, 2020–2022 (USD)
    5.13 PORTER’S FIVE FORCES ANALYSIS 
                    FIGURE 30 NUCLEAR POWER PLANT CONTROL SYSTEM MARKET: PORTER’S FIVE FORCES ANALYSIS
                    TABLE 14 MARKET: PORTER’S FIVE FORCES ANALYSIS
           5.13.1 THREAT OF SUBSTITUTES
           5.13.2 BARGAINING POWER OF SUPPLIERS
           5.13.3 BARGAINING POWER OF BUYERS
           5.13.4 THREAT OF NEW ENTRANTS
           5.13.5 INTENSITY OF COMPETITIVE RIVALRY
    5.14 KEY STAKEHOLDERS AND BUYING CRITERIA 
           5.14.1 KEY STAKEHOLDERS IN BUYING PROCESS
                    FIGURE 31 INFLUENCE OF KEY STAKEHOLDERS ON BUYING PROCESS, BY APPLICATION
                    TABLE 15 INFLUENCE OF STAKEHOLDERS ON BUYING PROCESS, BY APPLICATION (%)
           5.14.2 BUYING CRITERIA
                    FIGURE 32 KEY BUYING CRITERIA, BY APPLICATION
                    TABLE 16 KEY BUYING CRITERIA, BY APPLICATION
 
6 NUCLEAR POWER PLANT CONTROL SYSTEM MARKET, BY SOLUTION (Page No. - 77)
    6.1 INTRODUCTION 
           FIGURE 33 MARKET, BY SOLUTION, 2022
           TABLE 17 NUCLEAR POWER PLANT CONTROL SYSTEMS MARKET, BY SOLUTION, 2022–2028 (USD MILLION)
    6.2 SUPERVISORY CONTROL AND DATA ACQUISITION (SCADA) 
           6.2.1 MODERNIZATION OF SCADA SYSTEMS AND TECHNOLOGICAL EVOLUTION OF NUCLEAR POWER PLANT CONTROL SYSTEMS TO DRIVE MARKET
                    TABLE 18 SCADA: MARKET, BY REGION, 2022–2028 (USD MILLION)
    6.3 PROGRAMMABLE LOGICAL CONTROLLERS (PLCS) 
           6.3.1 INTEGRATION OF CYBERSECURITY AND ENERGY MANAGEMENT FUNCTIONALITY INTO PLCS TO DRIVE DEMAND
                    TABLE 19 PLCS: MARKET, BY REGION, 2022–2028 (USD MILLION)
    6.4 DISTRIBUTED CONTROL SYSTEMS (DCSS) 
           6.4.1 FAULT TOLERANCE AND REDUNDANCY FEATURES TO DRIVE DEMAND
                    TABLE 20 DCSS: MARKET, BY REGION, 2022–2028 (USD MILLION)
    6.5 INDUSTRIAL SAFETY SOLUTIONS 
           6.5.1 UPGRADES OF NUCLEAR CONTROL SYSTEMS POST-FUKUSHIMA AS SAFETY OVERHAUL INITIATIVE TO DRIVE MARKET
                    TABLE 21 INDUSTRIAL SAFETY SOLUTIONS: MARKET, BY REGION, 2022–2028 (USD MILLION)
    6.6 OTHER SOLUTIONS 
           TABLE 22 OTHER SOLUTIONS: MARKET, BY REGION, 2022–2028 (USD MILLION)
 
7 NUCLEAR POWER PLANT CONTROL SYSTEM MARKET, BY COMPONENT (Page No. - 83)
    7.1 INTRODUCTION 
           FIGURE 34 MARKET, BY COMPONENT, 2022
           TABLE 23 NUCLEAR POWER PLANT CONTROL SYSTEMS MARKET, BY COMPONENT, 2022–2028 (USD MILLION)
    7.2 HARDWARE 
           7.2.1 CONTROLLERS
                    7.2.1.1 Use to enhance process control and stability in nuclear power plants to drive market
           7.2.2 INPUT/OUTPUT DEVICES
                    7.2.2.1 Deployment to detect movement, light, temperature, pressure, and many other parameters in nuclear power plants to drive market
           7.2.3 WORKSTATIONS
                    7.2.3.1 Evolution of nuclear control through HMI innovation to drive market
           7.2.4 NETWORKING HARDWARE
                    7.2.4.1 Installation of networking hardware to revolutionize nuclear power plant control systems to drive market
                               TABLE 24 HARDWARE: MARKET, BY REGION, 2022–2028 (USD MILLION)
                               TABLE 25 HARDWARE: MARKET, BY COMPONENT, 2022–2028 (USD MILLION)
    7.3 SOFTWARE 
           7.3.1 INCREASED FOCUS ON PLANT LIFECYCLE MANAGEMENT, PLANT ASSET MANAGEMENT, AND PLANT OPTIMIZATION TO DRIVE MARKET
                    TABLE 26 SOFTWARE: MARKET, BY REGION, 2022–2028 (USD MILLION)
    7.4 SERVICES 
           7.4.1 GROWING NEED FOR PLANT RENOVATION AND UPGRADE AND RETROFITTING OF AGING NUCLEAR POWER PLANT CONTROL SYSTEMS TO DRIVE MARKET
                    TABLE 27 SERVICES: MARKET, BY REGION, 2022–2028 (USD MILLION)
 
8 NUCLEAR POWER PLANT CONTROL SYSTEM MARKET, BY APPLICATION (Page No. - 89)
    8.1 INTRODUCTION 
           FIGURE 35 MARKET, BY APPLICATION, 2022
           TABLE 28 NUCLEAR POWER PLANT CONTROL SYSTEMS MARKET, BY APPLICATION, 2022–2028 (USD MILLION)
    8.2 BOILER & AUXILIARIES CONTROL 
           8.2.1 RISING ADOPTION OF AUTOMATIC RESET TYPE CONTROL SYSTEMS TO FUEL DEMAND
                    TABLE 29 BOILER & AUXILIARIES CONTROL: MARKET, BY REGION, 2022–2028 (USD MILLION)
    8.3 GENERATOR EXCITATION & ELECTRICAL CONTROL 
           8.3.1 NEED TO MONITOR AND CONTROL ELECTRICAL SYSTEMS ACROSS DIFFERENT NUCLEAR PLANT TYPES TO DRIVE MARKET
                    TABLE 30 GENERATOR EXCITATION & ELECTRICAL CONTROL: MARKET, BY REGION, 2022–2028 (USD MILLION)
    8.4 TURBINE & AUXILIARIES CONTROL 
           8.4.1 ADVANCEMENTS IN MODULATION OF TURBINE & AUXILIARIES CONTROL SYSTEMS TO DRIVE MARKET
                    TABLE 31 TURBINE & AUXILIARIES CONTROL: MARKET, BY REGION, 2022–2028 (USD MILLION)
    8.5 OTHER APPLICATIONS 
           TABLE 32 OTHER APPLICATIONS: MARKET, BY REGION, 2022–2028 (USD MILLION)
 
9 NUCLEAR POWER PLANT CONTROL SYSTEM MARKET, BY REGION (Page No. - 94)
    9.1 INTRODUCTION 
           FIGURE 36 ASIA PACIFIC MARKET TO EXHIBIT HIGHEST CAGR DURING FORECAST PERIOD
           FIGURE 37 MARKET, BY REGION, 2022
           TABLE 33 MARKET, BY REGION, 2022–2028 (USD MILLION)
    9.2 AMERICAS 
           9.2.1 AMERICAS: RECESSION IMPACT
           9.2.2 BY COMPONENT
                    TABLE 34 AMERICAS: NUCLEAR POWER PLANT CONTROL SYSTEM MARKET, BY COMPONENT, 2022–2028 (USD MILLION)
           9.2.3 BY SOLUTION
                    TABLE 35 AMERICAS: MARKET, BY SOLUTION, 2022–2028 (USD MILLION)
           9.2.4 BY APPLICATION
                    TABLE 36 AMERICAS: MARKET, BY APPLICATION, 2022–2028 (USD MILLION)
           9.2.5 BY COUNTRY
                    TABLE 37 AMERICAS: MARKET, BY COUNTRY, 2022–2028 (USD MILLION)
                    9.2.5.1 US
                               9.2.5.1.1 High use of advanced digital technologies to fuel development and use of nuclear electricity and drive market
                               9.2.5.1.2 By application
                               TABLE 38 US: MARKET, BY APPLICATION, 2022–2028 (USD MILLION)
                    9.2.5.2 Canada
                               9.2.5.2.1 Use of uranium reserves to supply low-emission electricity and meet net zero emission target to drive market
                               9.2.5.2.2 By application
                               TABLE 39 CANADA: MARKET, BY APPLICATION, 2022–2028 (USD MILLION)
                    9.2.5.3 Argentina
                               9.2.5.3.1 Increased use of nuclear energy attributed to cooperation between CNEA and CNNC to drive market
                               9.2.5.3.2 By application
                               TABLE 40 ARGENTINA: MARKET, BY APPLICATION, 2022–2028 (USD MILLION)
                    9.2.5.4 Rest of Americas
                               9.2.5.4.1 By application
                               TABLE 41 REST OF AMERICAS: MARKET, BY APPLICATION, 2022–2028 (USD MILLION)
    9.3 EUROPE 
           9.3.1 EUROPE: RECESSION IMPACT
                    FIGURE 38 EUROPE: NUCLEAR POWER PLANT CONTROL SYSTEM MARKET SNAPSHOT
           9.3.2 BY COMPONENT
                    TABLE 42 EUROPE: MARKET, BY COMPONENT, 2022–2028 (USD MILLION)
           9.3.3 BY SOLUTION
                    TABLE 43 EUROPE: MARKET, BY SOLUTION, 2022–2028 (USD MILLION)
           9.3.4 BY APPLICATION
                    TABLE 44 EUROPE: MARKET, BY APPLICATION, 2022–2028 (USD MILLION)
           9.3.5 BY COUNTRY
                    TABLE 45 EUROPE: MARKET, BY COUNTRY, 2022–2028 (USD MILLION)
                    9.3.5.1 Russia
                               9.3.5.1.1 Development of new reactor technologies to drive market
                               9.3.5.1.2 By application
                               TABLE 46 RUSSIA: MARKET, BY APPLICATION, 2022–2028 (USD MILLION)
                    9.3.5.2 UK
                               9.3.5.2.1 Government-led initiatives to expand nuclear capacity by 2050 to propel market growth
                               9.3.5.2.2 By application
                               TABLE 47 UK: MARKET, BY APPLICATION, 2022–2028 (USD MILLION)
                    9.3.5.3 France
                               9.3.5.3.1 Emphasis on medium- and long-term goals for energy transition to drive market
                               9.3.5.3.2 By application
                               TABLE 48 FRANCE: MARKET, BY APPLICATION, 2022–2028 (USD MILLION)
                    9.3.5.4 Rest of Europe
                               9.3.5.4.1 By application
                               TABLE 49 REST OF EUROPE: MARKET, BY APPLICATION, 2022–2028 (USD MILLION)
    9.4 ASIA PACIFIC 
           9.4.1 ASIA PACIFIC: RECESSION IMPACT
                    FIGURE 39 ASIA PACIFIC: NUCLEAR POWER PLANT CONTROL SYSTEM MARKET SNAPSHOT
           9.4.2 BY COMPONENT
                    TABLE 50 ASIA PACIFIC: MARKET, BY COMPONENT, 2022–2028 (USD MILLION)
           9.4.3 BY SOLUTION
                    TABLE 51 ASIA PACIFIC: MARKET, BY SOLUTION, 2022–2028 (USD MILLION)
           9.4.4 BY APPLICATION
                    TABLE 52 ASIA PACIFIC: MARKET, BY APPLICATION, 2022–2028 (USD MILLION)
           9.4.5 BY COUNTRY
                    TABLE 53 ASIA PACIFIC: MARKET, BY COUNTRY, 2022–2028 (USD MILLION)
                    9.4.5.1 China
                               9.4.5.1.1 Continuous investments in nuclear power plants to support market growth
                               9.4.5.1.2 By application
                               TABLE 54 CHINA: MARKET, BY APPLICATION, 2022–2028 (USD MILLION)
                    9.4.5.2 Japan
                               9.4.5.2.1 High expertise in nuclear designing, construction, and operations to fuel market growth
                               9.4.5.2.2 By application
                               TABLE 55 JAPAN: MARKET, BY APPLICATION, 2022–2028 (USD MILLION)
                    9.4.5.3 South Korea
                               9.4.5.3.1 Development of advanced reactors to drive market
                               9.4.5.3.2 By application
                               TABLE 56 SOUTH KOREA: MARKET, BY APPLICATION, 2022–2028 (USD MILLION)
                    9.4.5.4 Rest of Asia Pacific
                               9.4.5.4.1 By application
                               TABLE 57 REST OF ASIA PACIFIC: MARKET, BY APPLICATION, 2022–2028 (USD MILLION)
    9.5 MIDDLE EAST & AFRICA 
           9.5.1 MIDDLE EAST & AFRICA: RECESSION IMPACT
           9.5.2 BY COMPONENT
                    TABLE 58 MIDDLE EAST & AFRICA: NUCLEAR POWER PLANT CONTROL SYSTEM MARKET, BY COMPONENT, 2022–2028 (USD MILLION)
           9.5.3 BY SOLUTION
                    TABLE 59 MIDDLE EAST & AFRICA: MARKET, BY SOLUTION, 2022–2028 (USD MILLION)
           9.5.4 BY APPLICATION
                    TABLE 60 MIDDLE EAST & AFRICA: MARKET, BY APPLICATION, 2022–2028 (USD MILLION)
           9.5.5 BY COUNTRY
                    TABLE 61 MIDDLE EAST & AFRICA: MARKET, BY COUNTRY, 2022–2028 (USD MILLION)
                    9.5.5.1 GCC Countries
                               9.5.5.1.1 UAE
                                             9.5.5.1.1.1 Technological innovations and rising investments in nuclear power projects to drive market
                                             9.5.5.1.1.2 By application
                               TABLE 62 UAE: MARKET, BY APPLICATION, 2022–2028 (USD MILLION)
                               9.5.5.1.2 Rest of GCC countries
                    9.5.5.2 South Africa
                               9.5.5.2.1 Growing focus on renewable power generation to fuel demand
                               9.5.5.2.2 By application
                               TABLE 63 SOUTH AFRICA: MARKET, BY APPLICATION, 2022–2028 (USD MILLION)
                    9.5.5.3 Rest of Middle East & Africa
                               9.5.5.3.1 By application
                               TABLE 64 REST OF MIDDLE EAST & AFRICA: MARKET, BY APPLICATION, 2022–2028 (USD MILLION)
 
10 COMPETITIVE LANDSCAPE (Page No. - 119)
     10.1 OVERVIEW 
     10.2 STRATEGIES ADOPTED BY KEY PLAYERS 
               TABLE 65 MARKET: OVERVIEW OF STRATEGIES ADOPTED BY KEY PLAYERS, 2019–2023
     10.3 MARKET SHARE ANALYSIS, 2022 
               TABLE 66 MARKET: DEGREE OF COMPETITION
               FIGURE 40 NUCLEAR POWER PLANT CONTROL SYSTEM MARKET SHARE ANALYSIS, 2022
     10.4 MARKET EVALUATION FRAMEWORK, 2019–2022 
               TABLE 67 MARKET EVALUATION FRAMEWORK, 2019–2022
     10.5 SEGMENTAL REVENUE ANALYSIS, 2018–2022 
               FIGURE 41 MARKET: SEGMENTAL REVENUE ANALYSIS OF FOUR KEY PLAYERS, 2018–2022
               FIGURE 42 EBIDTA OF KEY PLAYERS, 2022
     10.6 COMPETITIVE SCENARIOS AND TRENDS 
             10.6.1 DEALS
                       TABLE 68 MARKET: DEALS, FEBRUARY 2022–SEPTEMBER 2023
     10.7 COMPANY EVALUATION MATRIX, 2022 
             10.7.1 STARS
             10.7.2 EMERGING LEADERS
             10.7.3 PERVASIVE PLAYERS
             10.7.4 PARTICIPANTS
                       FIGURE 43 MARKET: COMPANY EVALUATION MATRIX, 2022
             10.7.5 COMPANY FOOTPRINT
                       TABLE 69 COMPANY COMPONENT FOOTPRINT
                       TABLE 70 COMPANY SOLUTION FOOTPRINT
                       TABLE 71 COMPANY APPLICATION FOOTPRINT
                       TABLE 72 COMPANY REGION FOOTPRINT
                       TABLE 73 OVERALL PRODUCT FOOTPRINT
                       TABLE 74 OVERALL MARKET SHARE FOOTPRINT
 
11 COMPANY PROFILES (Page No. - 134)
(Business Overview, Products/Solutions/Services Offered, Recent Developments, and MnM View (Key strengths/Right to Win, Strategic Choices Made, and Weaknesses and Competitive Threats))*
     11.1 KEY PLAYERS 
             11.1.1 SIEMENS
                       TABLE 75 SIEMENS: COMPANY OVERVIEW
                       FIGURE 44 SIEMENS: COMPANY SNAPSHOT
                       TABLE 76 SIEMENS: PRODUCTS/SOLUTIONS/SERVICES OFFERED
             11.1.2 ABB
                       TABLE 77 ABB: COMPANY OVERVIEW
                       FIGURE 45 ABB: COMPANY SNAPSHOT
                       TABLE 78 ABB: PRODUCTS/SERVICES/SOLUTIONS OFFERED
             11.1.3 GENERAL ELECTRIC
                       TABLE 79 GENERAL ELECTRIC: COMPANY OVERVIEW
                       FIGURE 46 GENERAL ELECTRIC: COMPANY SNAPSHOT
                       TABLE 80 GENERAL ELECTRIC: PRODUCTS/SOLUTIONS/SERVICES OFFERED
                       TABLE 81 GENERAL ELECTRIC: DEALS
             11.1.4 FORTUM
                       TABLE 82 FORTUM: COMPANY OVERVIEW
                       FIGURE 47 FORTUM: COMPANY SNAPSHOT
                       TABLE 83 FORTUM: PRODUCTS/SERVICES/SOLUTIONS OFFERED
                       TABLE 84 FORTUM: DEALS
             11.1.5 FRAMATOME
                       TABLE 85 FRAMATOME: COMPANY OVERVIEW
                       FIGURE 48 FRAMATOME: COMPANY SNAPSHOT
                       TABLE 86 FRAMATOME: PRODUCTS/SOLUTIONS/SERVICES OFFERED
                       TABLE 87 FRAMATOME: DEALS
                       TABLE 88 FRAMATOME: OTHERS
             11.1.6 EMERSON ELECTRIC CO.
                       TABLE 89 EMERSON ELECTRIC CO.: COMPANY OVERVIEW
                       FIGURE 49 EMERSON ELECTRIC CO: COMPANY SNAPSHOT
                       TABLE 90 EMERSON ELECTRIC CO.: PRODUCTS/SOLUTIONS/SERVICES OFFERED
                       TABLE 91 EMERSON ELECTRIC CO.: DEALS
             11.1.7 MITSUBISHI ELECTRIC CORPORATION
                       TABLE 92 MITSUBISHI ELECTRIC CORPORATION: COMPANY OVERVIEW
                       FIGURE 50 MITSUBISHI ELECTRIC CORPORATION: COMPANY SNAPSHOT
                       TABLE 93 MITSUBISHI ELECTRIC CORPORATION: PRODUCTS/SOLUTIONS/SERVICES OFFERED
                       TABLE 94 MITSUBISHI ELECTRIC CORPORATION: DEALS
             11.1.8 NUSCALE POWER, LLC
                       TABLE 95 NUSCALE POWER, LLC: COMPANY OVERVIEW
                       FIGURE 51 NUSCALE POWER, LLC: COMPANY SNAPSHOT
                       TABLE 96 NUSCALE POWER, LLC: PRODUCTS/SOLUTIONS/SERVICES OFFERED
             11.1.9 ROLLS-ROYCE PLC
                       TABLE 97 ROLLS-ROYCE PLC: COMPANY OVERVIEW
                       FIGURE 52 ROLLS-ROYCE PLC: COMPANY SNAPSHOT
                       TABLE 98 ROLLS-ROYCE PLC: PRODUCTS/SOLUTIONS/SERVICES OFFERED
             11.1.10 HONEYWELL INTERNATIONAL INC.
                       TABLE 99 HONEYWELL INTERNATIONAL INC.: COMPANY OVERVIEW
                       FIGURE 53 HONEYWELL INTERNATIONAL INC.: COMPANY SNAPSHOT
                       TABLE 100 HONEYWELL INTERNATIONAL INC.: PRODUCTS/SOLUTIONS/SERVICES OFFERED
                       TABLE 101 HONEYWELL INTERNATIONAL INC.: DEALS
             11.1.11 MOTOROLA SOLUTIONS, INC.
                       TABLE 102 MOTOROLA SOLUTIONS, INC.: COMPANY OVERVIEW
                       FIGURE 54 MOTOROLA SOLUTIONS, INC.: COMPANY SNAPSHOT
                       TABLE 103 MOTOROLA SOLUTIONS, INC.: PRODUCTS/SERVICES/SOLUTIONS OFFERED
             11.1.12 CURTISS-WRIGHT CORPORATION
                       TABLE 104 CURTISS-WRIGHT CORPORATION: COMPANY OVERVIEW
                       FIGURE 55 CURTISS-WRIGHT CORPORATION: COMPANY SNAPSHOT
                       TABLE 105 CURTISS-WRIGHT CORPORATION: PRODUCTS/SERVICES/SOLUTIONS OFFERED
                       TABLE 106 CURTISS-WRIGHT CORPORATION: DEALS
             11.1.13 LOCKHEED MARTIN CORPORATION
                       TABLE 107 LOCKHEED MARTIN CORPORATION: COMPANY OVERVIEW
                       FIGURE 56 LOCKHEED MARTIN CORPORATION: COMPANY SNAPSHOT
                       TABLE 108 LOCKHEED MARTIN CORPORATION: PRODUCTS/SERVICES/SOLUTIONS OFFERED
             11.1.14 FORTINET
                       TABLE 109 FORTINET: COMPANY OVERVIEW
                       FIGURE 57 FORTINET: COMPANY SNAPSHOT
                       TABLE 110 FORTINET: PRODUCTS/SERVICES/SOLUTIONS OFFERED
             11.1.15 WESTINGHOUSE ELECTRIC COMPANY LLC
                       TABLE 111 WESTINGHOUSE ELECTRIC COMPANY LLC: COMPANY OVERVIEW
                       TABLE 112 WESTINGHOUSE ELECTRIC COMPANY LLC: PRODUCTS/SERVICES/SOLUTIONS OFFERED
     11.2 OTHER PLAYERS 
             11.2.1 L&T ELECTRICAL & AUTOMATION
             11.2.2 MCAFEE, LLC
             11.2.3 CYBERBIT
             11.2.4 CYBERARK SOFTWARE LTD.
             11.2.5 EFACEC
*Details on Business Overview, Products/Solutions/Services Offered, Recent Developments, and MnM View (Key strengths/Right to Win, Strategic Choices Made, and Weaknesses and Competitive Threats) might not be captured in case of unlisted companies.
 
12 APPENDIX (Page No. - 177)
     12.1 INSIGHTS FROM INDUSTRY EXPERTS 
     12.2 DISCUSSION GUIDE 
     12.3 KNOWLEDGESTORE: MARKETSANDMARKETS’ SUBSCRIPTION PORTAL 
     12.4 CUSTOMIZATION OPTIONS 
     12.5 RELATED REPORTS 
     12.6 AUTHOR DETAILS 

The study involved major activities in estimating the current size of the nuclear power plant control system market. Exhaustive secondary research was done to collect information on the peer and parent markets. The next step was to validate these findings, assumptions, and sizing with industry experts across the value chain through primary research. Both top-down and bottom-up approaches were employed to estimate the total market size. Thereafter, market breakdown and data triangulation were used to estimate the market size of the segments and subsegments.

Secondary Research

This research study on the nuclear power plant control systems market involved the use of extensive secondary sources, directories, and databases, such as Hoover’s, Bloomberg, Factiva, IRENA, International Energy Agency, and Statista Industry Journal, to collect and identify information useful for a technical, market-oriented, and commercial study of the market. The other secondary sources included annual reports, press releases & investor presentations of companies, white papers, certified publications, articles by recognized authors, manufacturer associations, trade directories, and databases.

Primary Research

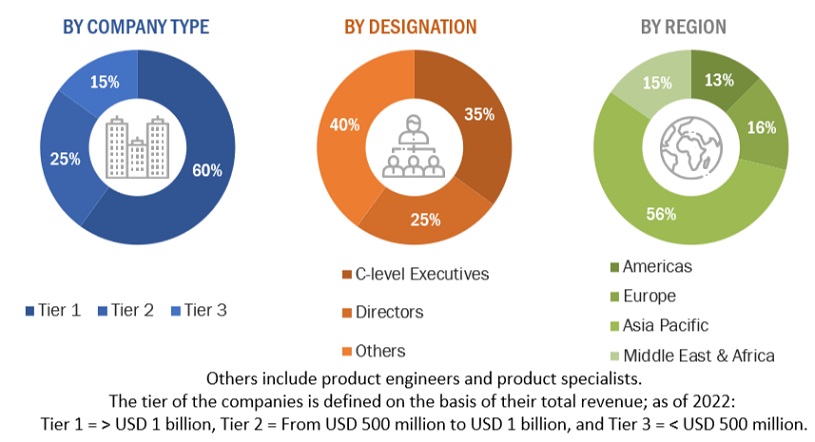
The nuclear power plant control systems market comprises several stakeholders, such as nuclear power plant control system manufacturers, technology providers, and technical support providers in the supply chain. The demand side of this market is characterized by the rising demand for control systems in various applications such as energy, mobility, industrial, and grid injection. The supply side is characterized by rising demand for contracts from the industrial sector and mergers & acquisitions among big players. Various primary sources from both the supply and demand sides of the market were interviewed to obtain qualitative and quantitative information. Following is the breakdown of primary respondents:
Nuclear Power Plant Control System  Market Size, and Share

To know about the assumptions considered for the study, download the pdf brochure

Market Size Estimation

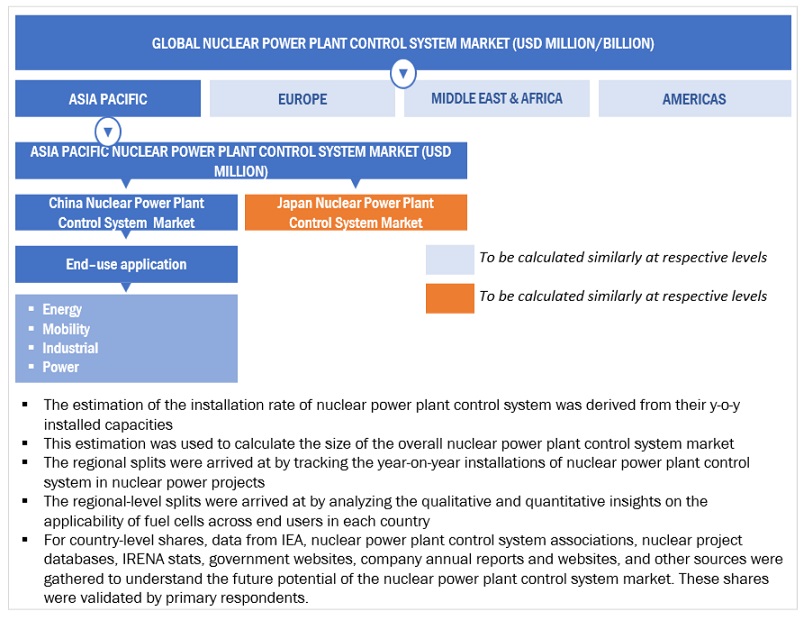
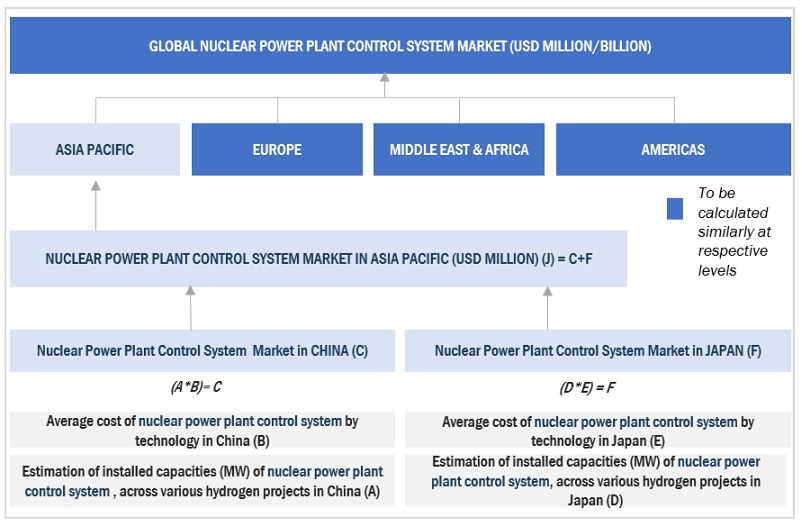
Both top-down and bottom-up approaches were used to estimate and validate the total size of the nuclear power plant control systems market. These methods were also used extensively to estimate the size of various subsegments in the market. The research methodology used to estimate the market size includes the following:

  • The key players in the industry and market have been identified through extensive secondary research, and their market share has been determined through primary and secondary research.
  • The industry’s value chain and market size, in terms of value, have been determined through both primary and secondary research processes.
  • All percentage shares, splits, and breakdowns have been determined using secondary sources and verified through primary sources.

Nuclear Power Plant Control System Market Size: Top-Down Approach
Nuclear Power Plant Control System  Market Bottom Up Approach

To know about the assumptions considered for the study, Request for Free Sample Report

Nuclear Power Plant Control System Market Size: Bottom-Up Approach
Nuclear Power Plant Control System  Market Top Down Approach

Data Triangulation

After arriving at the overall market size from the above estimation process, the total market has been split into several segments and subsegments. Data triangulation and market breakdown processes have been employed to complete the overall market engineering process and arrive at the exact statistics for all the segments and sub-segments, wherever applicable. The data has been triangulated by studying various factors and trends from both the demand- and supply sides. Along with this, the market has been validated using both the top-down and bottom-up approaches.

Market Definition

Nuclear power plant control systems refer to a set of integrated hardware and software components designed to monitor, regulate, and manage the various processes and functions within a nuclear power plant. These systems play a crucial role in ensuring the safe, efficient, and reliable operation of the nuclear facility. The control systems are responsible for overseeing the nuclear reactor, power generation process, safety systems, and auxiliary systems, among other critical aspects.

Key Stakeholders

  • Nuclear power generation companies
  • Utilities
  • Manufacturers of programmable controllers
  • Suppliers of SCADA and DCS
  • Integrators of power plant control systems
  • Engineering, procurement, and construction (EPC) companies
  • Government and research organizations
  • Third-party testing companies
  • Manufacturers, dealers, and suppliers of nuclear power plant control systems
  • Organizations, forums, alliances, and associations

State and National Regulatory Authorities Objectives of the Study

  • To define, describe, segment, and forecast the Nuclear power plant control system market size, by technology, and application, and power rating, in terms of value.
  • To forecast the Nuclear power plant control system market size, by application, in terms of volume.
  • To forecast the market size across four key regions: Americas, Europe, Asia Pacific, and Middle East & Africa, along with country-level analysis, in terms of value and volume.
  • To describe key elements required to manufacture a Nuclear power plant control system.
  • To provide statistical data for installed Nuclear power plant control system capacity for each region and country.
  • To provide detailed information regarding key drivers, restraints, opportunities, and challenges influencing the market growth.
  • To provide the supply chain analysis, trends/disruptions impacting customer business, market mapping, pricing analysis, and regulatory landscape pertaining to the market.
  • To strategically analyze the ecosystem, standards and regulations, patent analysis, trade analysis, Porter’s five forces, and case studies pertaining to the market under study.
  • To strategically analyze micromarkets1 with respect to individual growth trends, prospects, contributions to the overall market size.
  • To analyze opportunities for stakeholders in the market and draw a competitive landscape for market players.
  • To benchmark players within the market using the company evaluation matrix, which analyzes market players based on several parameters within the broad categories of business and product strategies.
  • To compare the key market players with respect to the market share, product specifications, and applications.
  • To strategically profile the key players and comprehensively analyze their market ranking and core competencies.
  • To analyze competitive developments in the market, such as contracts, agreements, investments, expansions, product launches, partnerships, joint ventures, and collaborations.

Available Customizations:

With the given market data, MarketsandMarkets offers customizations according to the specific requirements of companies. The following customization options are available for the report:

Product Analysis

  • Product Matrix, which provides a detailed comparison of the product portfolio of each company

Company Information

  • Detailed analyses and profiling of additional market players
Custom Market Research Services

We will customize the research for you, in case the report listed above does not meet with your exact requirements. Our custom research will comprehensively cover the business information you require to help you arrive at strategic and profitable business decisions.

Request Customization
Report Code
EP 8936
Published ON
Feb, 2024
Choose License Type
BUY NOW
  • SHARE
X
Request Customization
Speak to Analyst
Speak to Analyst
OR FACE-TO-FACE MEETING
PERSONALIZE THIS RESEARCH
  • Triangulate with your Own Data
  • Get Data as per your Format and Definition
  • Gain a Deeper Dive on a Specific Application, Geography, Customer or Competitor
  • Any level of Personalization
REQUEST A FREE CUSTOMIZATION
LET US HELP YOU!
  • What are the Known and Unknown Adjacencies Impacting the Nuclear Power Plant Control System Market
  • What will your New Revenue Sources be?
  • Who will be your Top Customer; what will make them switch?
  • Defend your Market Share or Win Competitors
  • Get a Scorecard for Target Partners
CUSTOMIZED WORKSHOP REQUEST
+1-888-600-6441
  • Call Us
  • +1-888-600-6441 (Corporate office hours)
  • +1-888-600-6441 (US/Can toll free)
  • +44-800-368-9399 (UK office hours)
CONNECT WITH US
ABOUT TRUST ONLINE
©2024 MarketsandMarkets Research Private Ltd. All rights reserved
DMCA.com Protection Status Website Feedback