OTA Testing Market by Test Chambers, Antenna Testing Solutions, Software, Services, 5G, LTE, UMTS, GSM, CDMA, Wi-Fi, Bluetooth, Smartphones, Laptops, Notebooks & Tablets, Wearables, Automotive & Transportation and Smart Cities - Global Forecast to 2029

icon1
USD 3.17 BN
MARKET SIZE, 2029
icon2
CAGR 7.3%
(2024-2029)
icon3
230
REPORT PAGES
icon4
160
MARKET TABLES

OVERVIEW

ota-testing-market Overview

Source: Secondary Research, Interviews with Experts, MarketsandMarkets Analysis

The OTA testing market is projected to grow from USD 2.23 billion in 2024 to USD 3.17 billion by 2029, registering a CAGR of 7.3% during the forecast period (2024–2029). Growth is driven by increasing adoption of 5G and advanced wireless technologies, rising complexity of antenna and RF designs, and expanding use of connected devices across automotive, consumer electronics, and industrial IoT applications.

KEY TAKEAWAYS

  • BY REGION
    By region, the market accounted for a share of 39.7% in 2024.
  • BY OFFERING
    By offering, the services segment is expected to dominate the OTA testing market.
  • BY TECHNOLOGY
    By technology, the cellular network segment is projected to register the fastest growth during the forecast period.
  • BY END USERS
    By end user, the consumer devices segment is expected to dominate the OTA testing market.
  • COMPETITIVE LANDSCAPE
    Rohde & Schwarz, Keysight Technologies, Anritsu, SGS SA, Intertek Group plc, and UL LLC, among others, were identified as star players in the OTA testing market, supported by their strong financial capabilities, well-established brand equity, comprehensive service portfolios, and global operational presence.
  • COMPETITIVE LANDSCAPE
    Orbis Systems Oy, Copper Mountain Technologies, and Millibox have distinguished themselves as progressive companies in the OTA testing market due to their expanding solution offerings, agile business models, and increasing focus on niche and high-growth OTA testing applications.

The OTA testing market is witnessing steady growth, driven by increasing adoption of 5G and advanced wireless technologies, rising antenna and RF design complexity, and the proliferation of connected devices. Growing demand for multi-antenna, multi-band, and mmWave validation is improving test accuracy, real-world performance assessment, and certification efficiency. Advancements in automated OTA platforms, AI-driven analytics, and compact antenna test environments are further reshaping the market landscape.

TRENDS & DISRUPTIONS IMPACTING CUSTOMERS' CUSTOMERS

The OTA testing market is undergoing a structural shift as customers move from legacy, instrument-based RF validation toward advanced, real-world wireless performance testing solutions. While past revenues were driven by vector network analyzers, spectrum analyzers, and basic anechoic chambers, future growth is increasingly supported by compact antenna test ranges (CATR), massive MIMO OTA systems, 5G NR signal analyzers, and AI-powered automated test platforms. Rising adoption of 5G NR (FR1 and FR2), Wi-Fi 6/6E/7, Bluetooth Low Energy, NB-IoT, and V2X technologies is reshaping client imperatives across consumer devices, automotive and transportation, industrial, and smart city applications. This transition reflects a broader industry shift toward multi-technology, software-enabled, and high-throughput OTA testing platforms that support faster validation cycles, improved wireless reliability, and scalable deployment, creating new revenue opportunities across developed and emerging markets.

ota-testing-market Disruptions

Source: Secondary Research, Interviews with Experts, MarketsandMarkets Analysis

MARKET DYNAMICS

Drivers
Impact
Level
  • Rising Demand for Wireless Consumer Device
  • Growing adoption of 5G technology
RESTRAINTS
Impact
Level
  • High cost of OTA testing equipment
  • Complexity of OTA testing procedures
OPPORTUNITIES
Impact
Level
  • Advancements in autonomous vehicles
  • Growth in smart city initiatives and infrastructures
CHALLENGES
Impact
Level
  • Rapidly Evolving Wireless Standards and Technologies
  • Simulating Real-World Conditions in Laboratory Environments

Source: Secondary Research, Interviews with Experts, MarketsandMarkets Analysis

Driver: Rising Demand for Wireless Consumer Device

The increasing adoption of wireless consumer devices such as smartphones, wearables, smart home products, and AR/VR headsets is a key driver of the OTA testing market. These devices integrate multiple antennas and support advanced standards including 5G, Wi-Fi 6/7, and Bluetooth. OTA testing is essential to validate real-world antenna performance, ensure regulatory compliance, minimize connectivity issues, and deliver consistent user experience across compact and complex device form factors.

Restraint: High cost of OTA testing equipment

OTA testing equipment, including anechoic chambers, compact antenna test ranges, and mmWave measurement systems, involves high upfront capital expenditure. Additional costs related to installation, calibration, skilled labor, and system upgrades further increase the financial burden. These high costs restrict adoption among small and mid-sized manufacturers and testing labs, particularly in emerging markets, thereby limiting broader market penetration and slowing overall growth.

Opportunity: Advancements in autonomous vehicles

Rapid advancements in autonomous and connected vehicle technologies are creating significant growth opportunities for the OTA testing market. Modern vehicles rely on multiple wireless systems such as 5G, V2X, GNSS, Wi-Fi, and Bluetooth for communication and safety functions. OTA testing enables accurate evaluation of complex antenna placements and real-world signal behavior, supporting reliable connectivity and regulatory compliance in next-generation autonomous mobility solutions.

Challenge: Rapidly Evolving Wireless Standards and Technologies

The fast pace of innovation in wireless standards, including 5G-Advanced, Wi-Fi 7, and emerging V2X protocols, presents a major challenge for OTA testing providers. Test systems must be frequently upgraded to support new frequency bands, modulation schemes, and performance metrics. Maintaining compatibility, measurement accuracy, and interoperability across evolving standards increases development complexity and operational costs for market participants.

OTA TESTING MARKET SIZE, SHARE & GROWTH ANALYSIS: COMMERCIAL USE CASES ACROSS INDUSTRIES

COMPANY USE CASE DESCRIPTION BENEFITS
Implementation of OTA testing during smartphone and wearable device development to evaluate antenna efficiency, radiated performance, and multi-band 4G/5G, Wi-Fi, and Bluetooth connectivity. Ensures regulatory compliance, enhances device connectivity, reduces post-launch performance issues, and accelerates product commercialization.
Adoption of OTA testing solutions for connected and autonomous vehicles to validate telematics, V2X, GNSS, infotainment, and in-vehicle wireless systems. Improves vehicle connectivity reliability, supports advanced driver-assistance systems, enhances passenger safety, and meets automotive certification standards.
Use of OTA testing chambers to assess wireless performance of smartphones, tablets, wearables, and AR devices across multiple frequency bands and form factors. Delivers consistent user experience, minimizes RF-related field issues, improves device interoperability, and reduces return rates.
Application of OTA testing for 5G base stations, small cells, and customer premise equipment to validate massive MIMO, beamforming, and mmWave performance. Optimizes network performance, ensures compliance with global standards, and supports deployment of advanced 5G infrastructure.
Deployment of OTA testing for industrial IoT and automation devices to evaluate wireless reliability, coexistence, and performance in complex industrial environments. Enhances device reliability, reduces connectivity-related downtime, and supports large-scale industrial digitalization initiatives.

Logos and trademarks shown above are the property of their respective owners. Their use here is for informational and illustrative purposes only.

MARKET ECOSYSTEM

The OTA testing market ecosystem consists of component and chipset providers (Intel, NXP, Panasonic, STMicroelectronics, Infineon, TDK), OTA testing equipment manufacturers (Keysight Technologies, Rohde & Schwarz, Teradyne, Anritsu, Spirent), OTA testing and certification service providers (UL Solutions, SGS, TÜV SÜD, TÜV Rheinland, Intertek, DEKRA), and end users (Apple, Tesla, Samsung, Sony, BMW Group, HP, Dell). Component and chipset providers supply advanced RF, antenna, and connectivity technologies, while equipment manufacturers deliver anechoic chambers, signal generators, and automated OTA test systems. Service providers support compliance and performance validation, and end users drive demand through growing adoption of 5G, Wi-Fi, Bluetooth, and multi-radio connectivity across consumer, automotive, and enterprise devices.

ota-testing-market Ecosystem

Logos and trademarks shown above are the property of their respective owners. Their use here is for informational and illustrative purposes only.

MARKET SEGMENTS

ota-testing-market Segments

Source: Secondary Research, Interviews with Experts, MarketsandMarkets Analysis

OTA Testing Market, By Offering

As of 2024, the services segment held the largest share of the OTA testing market and is expected to maintain its dominance throughout the forecast period. This growth is driven by increasing reliance on third-party testing, certification, and validation services as device complexity rises. Service-based models help manufacturers reduce capital expenditure, access advanced test infrastructure, and ensure compliance with evolving wireless standards, including 5G, Wi-Fi, and Bluetooth, across global regulatory environments.

OTA Testing Market, By Technology

As of 2024, the cellular network segment accounted for the largest share of the OTA testing market and is projected to remain dominant during the forecast period. Widespread adoption of 4G LTE and rapid deployment of 5G technologies have significantly increased antenna complexity and testing requirements. Cellular OTA testing is essential for validating multi-band, multi-antenna, and massive MIMO configurations across FR1 and FR2 bands, ensuring reliable connectivity and regulatory compliance.

OTA Testing Market, By End-user

As of 2024, consumer devices represented the leading end-user segment in the OTA testing market and are expected to sustain their dominance over the forecast period. High production volumes of smartphones, wearables, tablets, and smart home devices drive continuous demand for OTA testing. The integration of cellular, Wi-Fi, and Bluetooth technologies, along with frequent product refresh cycles, further reinforces the need for comprehensive over-the-air performance validation.

REGION

The Asia Pacific OTA testing market is expected to register the highest growth during the forecast period, driven by rapid expansion of electronics manufacturing, large-scale deployment of 5G networks, and increasing production of wireless consumer devices. Countries such as China, South Korea, Japan, Taiwan, and India are key contributors, supported by strong investments in device R&D, automotive connectivity, and testing infrastructure. Rising adoption of smartphones, connected vehicles, IoT devices, and advanced wireless standards further accelerates demand for OTA testing solutions across the region.

ota-testing-market Region

OTA TESTING MARKET SIZE, SHARE & GROWTH ANALYSIS: COMPANY EVALUATION MATRIX

In the OTA testing market matrix, Rohde & Schwarz (Star) leads with a strong market position supported by a comprehensive portfolio of OTA chambers, compact antenna test ranges, signal analyzers, and automated validation platforms. Its strong global presence, deep RF expertise, and continuous innovation in 5G, massive MIMO, and mmWave testing position it as a dominant force in the market. National Instruments Corporation (Emerging Leader) is steadily expanding its influence through software-centric test platforms, flexible system architectures, and growing adoption in advanced wireless and automotive OTA applications, indicating strong potential to move toward the leaders quadrant.

ota-testing-market Evaluation Metrics

Source: Secondary Research, Interviews with Experts, MarketsandMarkets Analysis

KEY MARKET PLAYERS

MARKET SCOPE

REPORT METRIC DETAILS
Market Size in 2023 (Value) USD 2.03 Billion
Market Forecast in 2029 (Value) USD 3.17 Billion
Growth Rate CAGR of 7.3% from 2023-2029
Years Considered 2020-2029
Base Year 2023
Forecast Period 2024-2029
Units Considered Value (USD Million), Volume (Thousand Units)
Report Coverage Revenue forecast, company ranking, competitive landscape, growth factors, and trends
Segments Covered
  • By Offering:
    • Solutions (Test Chambers
    • Antenna testing Solutions
    • and Software)
    • Services
  • By End Users:
    • Consumer Devices
    • Automotive & Transportation
    • Industrial
    • Smart Cities
    • Others
  • By Technology:
    • Cellular Network (5G
    • LTE/4G
    • UMTS/3G
    • GSM/2G
    • and CDMA)
    • Wi-Fi
    • Bluetooth
    • Others
Regions Covered North America, Asia Pacific, Europe, Rest of the World

WHAT IS IN IT FOR YOU: OTA TESTING MARKET SIZE, SHARE & GROWTH ANALYSIS REPORT CONTENT GUIDE

ota-testing-market Content Guide

DELIVERED CUSTOMIZATIONS

We have successfully delivered the following deep-dive customizations:

CLIENT REQUEST CUSTOMIZATION DELIVERED VALUE ADDS
Consumer Device Manufacturer
  • Benchmarking of OTA testing approaches for smartphones, wearables, and smart devices
  • Evaluation of antenna performance, radiated power, and sensitivity
  • Comparison of in-house vs outsourced OTA testing services
  • Improve wireless performance and user experience
  • Reduce certification failures
  • Accelerate product time-to-market
Automotive OEM / Tier-1 Supplier
  • OTA testing strategy for connected and autonomous vehicles
  • Validation of V2X, GNSS, infotainment, and telematics systems
  • Assessment of chamber types for vehicle-level and module-level testing
  • Enhance vehicle connectivity reliability
  • Support ADAS and autonomous driving validation
  • Ensure compliance with automotive wireless standards
Telecom Equipment Manufacturer
  • Mapping of OTA requirements for base stations, small cells, and CPE
  • Analysis of massive MIMO, beamforming, and mmWave testing needs
  • Selection of appropriate OTA test configurations
  • Optimize network equipment performance
  • Enable next-generation 5G deployments
  • Improve signal quality and coverage reliability
IoT & Industrial Device Provider
  • OTA testing framework for low-power and industrial IoT devices
  • Coexistence and multi-radio performance analysis
  • Scalability assessment for high-volume device testing
  • Improve device reliability in complex environments
  • Reduce field failures
  • Support large-scale IoT rollouts
Test & Certification Service Provider
  • Demand assessment for cellular, Wi-Fi, and Bluetooth OTA services
  • Identification of high-growth end-user industries
  • Regional opportunity and capacity expansion analysis
  • Optimize service portfolio planning
  • Increase utilization of OTA test infrastructure
  • Support geographic expansion strategies

RECENT DEVELOPMENTS

  • February 2024 : Keysight Technologies launched the E7515W UXM Wireless Connectivity Test Platform for Wi-Fi, enabling advanced network emulation for Wi-Fi 7 devices with comprehensive signaling, RF, and throughput testing, supporting 4×4 MIMO and 320 MHz bandwidth.
  • January 2024 : Keysight Technologies launched the SSA-X Signal Source Analyzer, expanding its portfolio with high-frequency models up to 54 GHz and providing integrated phase noise and signal source analysis for advanced wireless, radar, and high-speed digital applications.
  • December 2023 : Rohde & Schwarz launched the R&S TS8991 OTA Test System, the first CTIA-certified solution for 5G A-GNSS antenna testing, enabling accurate GNSS performance evaluation for E911 emergency call support over 5G networks.
  • COLUMN 'A' SHOULD BE IN TEXT FORMAT AND NOT DATE FORMAT :


Table of Contents

Exclusive indicates content/data unique to MarketsandMarkets and not available with any competitors.

TITLE
PAGE NO
1
INTRODUCTION


24
2
RESEARCH METHODOLOGY


29
3
EXECUTIVE SUMMARY


39
4
PREMIUM INSIGHTS


43
5
MARKET OVERVIEW
5G and IoT drive wireless device demand, challenging OTA testing with evolving standards and high costs.


46
 
5.1
INTRODUCTION


5.2
MARKET DYNAMICS


5.2.1
DRIVERS


5.2.1.1
RISING DEMAND FOR WIRELESS CONSUMER DEVICES


5.2.1.2
GROWING ADOPTION OF 5G TECHNOLOGY


5.2.1.3
EXPANSION OF INTERNET OF THINGS (IOT) ECOSYSTEM


5.2.1.4
STRINGENT REGULATORY REQUIREMENTS FOR WIRELESS DEVICES


5.2.2
RESTRAINTS


5.2.2.1
HIGH COST OF OTA TESTING EQUIPMENT


5.2.2.2
COMPLEXITY OF OTA TESTING PROCEDURES


5.2.2.3
LIMITED AVAILABILITY OF TESTING FACILITIES


5.2.3
OPPORTUNITIES


5.2.3.1
ADVANCEMENTS IN AUTONOMOUS VEHICLES


5.2.3.2
GROWTH IN SMART CITY INITIATIVES AND INFRASTRUCTURE


5.2.3.3
ADVANCEMENTS IN MMWAVE AND MASSIVE MIMO TECHNOLOGIES


5.2.4
CHALLENGES


5.2.4.1
RAPIDLY EVOLVING WIRELESS STANDARDS AND TECHNOLOGIES


5.2.4.2
SIMULATING REAL-WORLD CONDITIONS IN LABORATORY ENVIRONMENTS


5.3
TRENDS/DISRUPTIONS IMPACTING CUSTOMER BUSINESS


5.4
PRICING ANALYSIS


5.4.1
AVERAGE SELLING PRICE TREND OF KEY PLAYERS, BY OFFERING


5.4.2
AVERAGE SELLING PRICE TREND OF TEST CHAMBER, BY REGION


5.5
SUPPLY CHAIN ANALYSIS


5.6
ECOSYSTEM ANALYSIS


5.7
INVESTMENT AND FUNDING SCENARIO


5.8
TECHNOLOGY ANALYSIS


5.8.1
KEY TECHNOLOGIES


5.8.1.1
OTA TEST CHAMBERS


5.8.2
COMPLEMENTARY TECHNOLOGIES


5.8.2.1
MASSIVE MIMO


5.8.3
ADJACENT TECHNOLOGIES


5.8.3.1
AUTONOMOUS VEHICLES


5.9
PATENT ANALYSIS


5.10
TRADE ANALYSIS


5.10.1
EXPORT SCENARIO (HS CODE 903180)


5.10.2
IMPORT SCENARIO (HS CODE 903180)


5.11
KEY CONFERENCES & EVENTS, 2024—2025


5.12
CASE STUDY ANALYSIS


5.12.1
OTA TESTING SOLUTION ENABLED XIAOMI TO VALIDATE PERFORMANCE OF ITS 5G DEVICES


5.12.2
OTA TESTING SOLUTIONS ENABLED BOSCH TO VALIDATE ITS UWB APPLICATIONS


5.12.3
OTA TEST SYSTEM HELPED TMYTEK ACCELERATE PRODUCT DEVELOPMENT CYCLE


5.13
REGULATORY LANDSCAPE


5.13.1
REGULATORY BODIES, GOVERNMENT AGENCIES, AND OTHER ORGANIZATIONS


5.14
PORTER'S FIVE FORCES ANALYSIS


5.14.1
THREAT OF NEW ENTRANTS


5.14.2
THREAT OF SUBSTITUTES


5.14.3
BARGAINING POWER OF SUPPLIERS


5.14.4
BARGAINING POWER OF BUYERS


5.14.5
INTENSITY OF COMPETITIVE RIVALRY


5.15
KEY STAKEHOLDERS & BUYING CRITERIA


5.15.1
KEY STAKEHOLDERS IN BUYING PROCESS


5.15.2
BUYING CRITERIA


5.16
IMPACT OF AI/GEN AI ON OTA TESTING MARKET


6
OTA TESTING MARKET, BY OFFERING
Market Size & Growth Rate Forecast Analysis to 2029 in USD Million and Units | 36 Data Tables


78
 
6.1
INTRODUCTION


6.2
SOLUTIONS


6.2.1
TEST CHAMBERS


6.2.1.1
INCREASING COMPLEXITY AND DEMAND FOR ACCURATE TESTING OF ADVANCED WIRELESS TECHNOLOGIES TO PROPEL MARKET GROWTH


6.2.1.2
COMPACT ANTENNA TEST RANGES (CATRS)


6.2.1.3
MULTI-PROBE ANECHOIC CHAMBERS (MPAC)


6.2.1.4
DIRECT FAR-FIELD (DFF) CHAMBERS


6.2.2
ANTENNA TESTING SOLUTIONS


6.2.2.1
EXPANSION OF WIRELESS TECHNOLOGIES, PARTICULARLY WITH ADVENT OF 5G AND MIMO SYSTEMS, TO DRIVE MARKET GROWTH


6.2.3
SOFTWARE


6.2.3.1
GROWING DEMAND FOR MORE ADVANCED OTA TESTING SOFTWARE TO SUPPORT MARKET GROWTH


6.3
SERVICES


6.3.1
RAPID ADVANCEMENT OF WIRELESS TECHNOLOGIES AND STRICTER REGULATIONS AND STANDARDS TO DRIVE GROWTH


6.3.2
TOTAL RADIATED POWER (TRP) TESTING


6.3.3
TOTAL ISOTROPIC SENSITIVITY (TIS) TESTING


6.3.4
A-GNSS RECEIVER SENSITIVITY TESTING


6.3.5
DESENSITIZATION TESTING FOR CONVERGED WI-FI AND 5G TECHNOLOGIES


7
OTA TESTING MARKET, BY TECHNOLOGY
Market Size & Growth Rate Forecast Analysis to 2029 in USD Million | 4 Data Tables


93
 
7.1
INTRODUCTION


7.2
CELLULAR NETWORK


7.3
5G


7.3.1
RAPID DEPLOYMENT OF 5G TECHNOLOGY TO DRIVE MARKET GROWTH


7.3.2
5G FR1/5G FR2


7.3.3
5G NR NSA/SA


7.3.4
LTE


7.3.5
UMTS


7.3.6
GSM


7.3.7
CDMA


7.4
WI-FI


7.4.1
EVOLUTION OF WI-FI TECHNOLOGIES, INCLUDING WI-FI 6E AND UPCOMING WI-FI 7, TO DRIVE MARKET GROWTH


7.4.2
WI-FI 6 (802.11AX)


7.4.3
WI-FI 7 (802.11BE)


7.5
BLUETOOTH


7.5.1
RAPID PROLIFERATION OF BLUETOOTH LOW ENERGY (BLE) DEVICES TO DRIVE DEMAND


7.5.2
BLUETOOTH CLASSIC


7.5.3
BLUETOOTH LOW ENERGY (BLE)


7.6
OTHER TECHNOLOGIES


8
OTA TESTING MARKET, BY END USER
Market Size & Growth Rate Forecast Analysis to 2029 in USD Million | 42 Data Tables


100
 
8.1
INTRODUCTION


8.2
CONSUMER DEVICES


8.2.1
GROWING INTEGRATION OF 5G TECHNOLOGIES WITH ADVANCED MULTI-ANTENNA SYSTEMS DRIVING GROWTH


8.3
SMARTPHONES


8.3.1
RAPID ADOPTION OF ADVANCED TECHNOLOGIES, INCLUDING 5G NR, WI-FI 6/6E, AND BLUETOOTH 5, TO DRIVE DEMAND


8.3.2
LAPTOPS, NOTEBOOKS & TABLETS


8.3.2.1
INCREASING INTEGRATION OF 5G CAPABILITIES AND ADVANCED WIRELESS TECHNOLOGIES INTO LAPTOPS TO DRIVE DEMAND


8.3.3
WEARABLES


8.3.3.1
GROWING ADOPTION OF ADVANCED WEARABLE TECHNOLOGIES TO SUPPORT MARKET GROWTH


8.3.4
OTHER CONSUMER DEVICES


8.4
AUTOMOTIVE & TRANSPORTATION


8.4.1
INCREASING INTEGRATION OF CONNECTED CAR TECHNOLOGIES AND AUTONOMOUS DRIVING SYSTEMS TO FUEL DEMAND


8.5
INDUSTRIAL


8.5.1
RAPID ADOPTION OF INDUSTRY 4.0 AND IOT TECHNOLOGIES TO SUPPORT MARKET GROWTH


8.6
SMART CITIES


8.6.1
PUSH TOWARD SMART CITY DEVELOPMENT TO SUPPORT MARKET GROWTH


8.7
OTHER END USERS


9
OTA TESTING MARKET, BY REGION
Comprehensive coverage of 8 Regions with country-level deep-dive of 12 Countries | 28 Data Tables.


119
 
9.1
INTRODUCTION


9.2
NORTH AMERICA


9.2.1
MACROECONOMIC OUTLOOK FOR NORTH AMERICA


9.2.2
US


9.2.2.1
RAPID EXPANSION OF 5G NETWORKS TO DRIVE MARKET GROWTH


9.2.3
CANADA


9.2.3.1
ACCELERATING 5G ROLLOUT AND GOVERNMENT INITIATIVES PROMOTING INNOVATION IN WIRELESS TECHNOLOGIES TO BOOST DEMAND


9.2.4
MEXICO


9.2.4.1
EXPANDING ELECTRONICS MANUFACTURING SECTOR TO DRIVE MARKET GROWTH


9.3
EUROPE


9.3.1
MACROECONOMIC OUTLOOK FOR EUROPE


9.3.2
GERMANY


9.3.2.1
LEADERSHIP IN INDUSTRY 4.0 AND ADVANCEMENTS IN CONNECTED AND AUTONOMOUS VEHICLES TO DRIVE MARKET


9.3.3
UK


9.3.3.1
GROWING ADOPTION OF IOT TECHNOLOGIES IN SMART HOMES AND SMART CITY INITIATIVES TO PROPEL GROWTH


9.3.4
FRANCE


9.3.4.1
AUTOMOTIVE SECTOR TO CONTRIBUTE SIGNIFICANTLY TO GROWTH IN DEMAND FOR OTA TESTING


9.3.5
SPAIN


9.3.5.1
SIGNIFICANT INVESTMENTS IN ADVANCED WIRELESS TECHNOLOGIES AND DIGITAL TRANSFORMATION TO FUEL DEMAND


9.3.6
REST OF EUROPE


9.4
ASIA PACIFIC


9.4.1
MACROECONOMIC OUTLOOK FOR ASIA PACIFIC


9.4.2
CHINA


9.4.2.1
RAPID DEPLOYMENT OF 5G TECHNOLOGY AND SIGNIFICANT INVESTMENT IN IOT INFRASTRUCTURE TO DRIVE GROWTH


9.4.3
JAPAN


9.4.3.1
FOCUS ON NEXT-GENERATION WIRELESS TECHNOLOGIES AND DEVELOPING CONNECTED AND AUTONOMOUS VEHICLES TO SUPPORT MARKET GROWTH


9.4.4
INDIA


9.4.4.1
RAPID 5G ROLLOUT AND BOOMING ELECTRONICS MANUFACTURING SECTOR TO DRIVE GROWTH


9.4.5
SOUTH KOREA


9.4.5.1
STRONG EMPHASIS ON DEVELOPING AND MAINTAINING HIGH-PERFORMANCE SEMICONDUCTOR MANUFACTURING TO DRIVE GROWTH


9.4.6
TAIWAN


9.4.6.1
ADVANCEMENTS IN TESTING METHODOLOGIES FOR 5G AND BEYOND-5G TECHNOLOGIES TO DRIVE MARKET


9.4.7
SINGAPORE


9.4.7.1
COMPREHENSIVE 5G ROLLOUT PLANS AND ADVANCED SMART NATION INITIATIVES TO DRIVE MARKET GROWTH


9.4.8
REST OF ASIA PACIFIC


9.5
REST OF THE WORLD


9.5.1
SOUTH AMERICA


9.5.1.1
GROWING ADOPTION OF WIRELESS COMMUNICATION AND NETWORKING TECHNOLOGIES TO DRIVE MARKET GROWTH


9.5.2
MIDDLE EAST


9.5.2.1
ADVANCEMENTS IN TELECOMMUNICATIONS INFRASTRUCTURE AND TECHNOLOGY ADOPTION TO DRIVE GROWTH


9.5.2.2
GCC COUNTRIES


9.5.2.3
REST OF MIDDLE EAST


9.5.3
AFRICA


9.5.3.1
RAPID MOBILE TECHNOLOGY ADOPTION AND TELECOM INFRASTRUCTURE EXPANSION TO DRIVE MARKET


10
COMPETITIVE LANDSCAPE
Discover market leaders' growth strategies and financial metrics shaping the competitive landscape.


143
 
10.1
INTRODUCTION


10.2
KEY PLAYER STRATEGIES/RIGHT TO WIN, 2021−2024


10.2.1
ORGANIC/INORGANIC GROWTH STRATEGIES


10.2.2
PRODUCT/SERVICE PORTFOLIO


10.2.3
GEOGRAPHICAL PRESENCE


10.2.4
GLOBAL FOOTPRINT


10.3
REVENUE ANALYSIS


10.4
MARKET SHARE ANALYSIS


10.5
COMPANY VALUATION AND FINANCIAL METRICS


10.6
PRODUCT/BRAND COMPARISON


10.7
COMPANY EVALUATION MATRIX: KEY PLAYERS, 2023


10.7.1
STARS


10.7.2
EMERGING LEADERS


10.7.3
PERVASIVE PLAYERS


10.7.4
PARTICIPANTS


10.7.5
COMPANY FOOTPRINT: KEY PLAYERS, 2023


10.7.5.1
COMPANY FOOTPRINT


10.7.5.2
OFFERING FOOTPRINT


10.7.5.3
TECHNOLOGY FOOTPRINT


10.7.5.4
END USER FOOTPRINT


10.7.5.5
REGION FOOTPRINT


10.8
STARTUPS/SMES EVALUATION MATRIX, 2023


10.8.1
PROGRESSIVE COMPANIES


10.8.2
RESPONSIVE COMPANIES


10.8.3
DYNAMIC COMPANIES


10.8.4
STARTING BLOCKS


10.8.5
COMPETITIVE BENCHMARKING: STARTUPS/SMES, 2023


10.8.5.1
DETAILED LIST OF KEY STARTUPS/SMES


10.8.5.2
COMPETITIVE BENCHMARKING OF KEY STARTUPS/SMES


10.9
COMPETITIVE SCENARIO


10.9.1
PRODUCT/SOLUTION/SERVICE LAUNCHES


10.9.2
DEALS


10.9.3
EXPANSIONS


11
COMPANY PROFILES
In-depth Company Profiles of Leading Market Players with detailed Business Overview, Product and Service Portfolio, Recent Developments, and Unique Analyst Perspective (MnM View)


171
 
11.1
INTRODUCTION


11.2
KEY PLAYERS


11.2.1
ROHDE & SCHWARZ


11.2.1.1
BUSINESS OVERVIEW


11.2.1.2
PRODUCTS/SOLUTIONS/SERVICES OFFERED


11.2.1.3
RECENT DEVELOPMENTS


11.2.1.3.1
PRODUCT LAUNCHES


11.2.1.3.2
DEALS


11.2.1.4
MNM VIEW


11.2.1.4.1
KEY STRENGTHS/RIGHT TO WIN


11.2.1.4.2
STRATEGIC CHOICES


11.2.1.4.3
WEAKNESSES AND COMPETITIVE THREATS


11.2.2
KEYSIGHT TECHNOLOGIES


11.2.3
ANRITSU


11.2.4
SGS SA


11.2.5
INTERTEK GROUP PLC


11.2.6
NATIONAL INSTRUMENTS


11.2.7
UL LLC


11.2.8
SPIRENT COMMUNICATIONS


11.2.9
BUREAU VERITAS


11.2.10
EUROFINS SCIENTIFIC


11.2.11
DEKRA


11.2.12
TÜV RHEINLAND


11.2.13
ELEMENT MATERIALS TECHNOLOGY


11.2.14
TÜV SÜD


11.2.15
TERADYNE INC.


11.2.16
MICROWAVE VISION GROUP


11.3
OTHER PLAYERS


11.3.1
TOYO CORPORATION


11.3.2
ORBIS SYSTEMS OY


11.3.3
DSPACE GMBH


11.3.4
DVTEST INC.


11.3.5
COPPER MOUNTAIN TECHNOLOGIES


11.3.6
ETS-LINDGREN


11.3.7
TESTILABS OY


11.3.8
VERKOTAN


11.3.9
CETECOM ADVANCED


12
APPENDIX


230
 
12.1
INSIGHTS OF INDUSTRY EXPERTS


12.2
DISCUSSION GUIDE


12.3
KNOWLEDGESTORE: MARKETSANDMARKETS’ SUBSCRIPTION PORTAL


12.4
CUSTOMIZATION OPTIONS


12.5
RELATED REPORTS


12.6
AUTHOR DETAILS


LIST OF TABLES


TABLE 1
MARKET GROWTH ASSUMPTIONS


TABLE 2
RISK ASSESSMENT: OTA TESTING MARKET


TABLE 3
AVERAGE SELLING PRICE OF KEY PLAYERS, BY OFFERING (USD)


TABLE 4
AVERAGE SELLING PRICE OF TEST CHAMBER, BY KEY PLAYERS (USD)


TABLE 5
AVERAGE SELLING PRICE TREND OF TEST CHAMBER, BY REGION (USD)


TABLE 6
OTA TESTING MARKET: ROLE OF PLAYERS IN ECOSYSTEM


TABLE 7
PATENTS FILED FROM 2014 TO 2023


TABLE 8
LIST OF MAJOR PATENTS RELATED TO OTA TESTING


TABLE 9
EXPORT SCENARIO FOR HS CODE 903180-COMPLIANT PRODUCTS, BY COUNTRY, 2019–2023 (USD MILLION)


TABLE 10
IMPORT SCENARIO FOR HS CODE 903180-COMPLIANT PRODUCTS, BY COUNTRY, 2019–2023 (USD MILLION)


TABLE 11
OTA TESTING MARKET: DETAILED LIST OF CONFERENCES AND EVENTS, 2024—2025


TABLE 12
NORTH AMERICA: LIST OF REGULATORY BODIES, GOVERNMENT AGENCIES, AND OTHER ORGANIZATIONS


TABLE 13
EUROPE: LIST OF REGULATORY BODIES, GOVERNMENT AGENCIES, AND OTHER ORGANIZATIONS


TABLE 14
ASIA PACIFIC: LIST OF REGULATORY BODIES, GOVERNMENT AGENCIES, AND OTHER ORGANIZATIONS


TABLE 15
ROW: LIST OF REGULATORY BODIES, GOVERNMENT AGENCIES, AND OTHER ORGANIZATIONS


TABLE 16
OTA TESTING MARKET: PORTER'S FIVE FORCES ANALYSIS


TABLE 17
INFLUENCE OF STAKEHOLDERS IN BUYING PROCESS FOR OTA TESTING MARKET (%)


TABLE 18
KEY BUYING CRITERIA FOR OTA TESTING


TABLE 19
OTA TESTING MARKET, BY OFFERING, 2020–2023 (USD MILLION)


TABLE 20
OTA TESTING MARKET, BY OFFERING, 2024–2029 (USD MILLION)


TABLE 21
OTA TESTING MARKET, BY SOLUTIONS, 2020–2023 (USD MILLION)


TABLE 22
OTA TESTING MARKET, BY SOLUTIONS, 2024–2029 (USD MILLION)


TABLE 23
OTA TESTING MARKET, BY SOLUTIONS, 2020–2023 (UNITS)


TABLE 24
OTA TESTING MARKET, BY SOLUTIONS, 2024–2029 (UNITS)


TABLE 25
SOLUTIONS: OTA TESTING MARKET, BY END USER, 2020–2023 (USD MILLION)


TABLE 26
SOLUTIONS: OTA TESTING MARKET, BY END USER, 2024–2029 (USD MILLION)


TABLE 27
SOLUTIONS: OTA TESTING MARKET, BY REGION, 2020–2023 (USD MILLION)


TABLE 28
SOLUTIONS: OTA TESTING MARKET, BY REGION, 2024–2029 (USD MILLION)


TABLE 29
SOLUTIONS: OTA TESTING MARKET IN NORTH AMERICA, BY COUNTRY, 2020–2023 (USD MILLION)


TABLE 30
SOLUTIONS: OTA TESTING MARKET IN NORTH AMERICA, BY COUNTRY, 2024–2029 (USD MILLION)


TABLE 31
SOLUTIONS: OTA TESTING MARKET IN EUROPE, BY COUNTRY, 2020–2023 (USD MILLION)


TABLE 32
SOLUTIONS: OTA TESTING MARKET IN EUROPE, BY COUNTRY, 2024–2029 (USD MILLION)


TABLE 33
SOLUTIONS: OTA TESTING MARKET IN ASIA PACIFIC, BY COUNTRY, 2020–2023 (USD MILLION)


TABLE 34
SOLUTIONS: OTA TESTING MARKET IN ASIA PACIFIC, BY COUNTRY, 2024–2029 (USD MILLION)


TABLE 35
SOLUTIONS: OTA TESTING MARKET IN REST OF THE WORLD, BY REGION, 2020–2023 (USD MILLION)


TABLE 36
SOLUTIONS: OTA TESTING MARKET IN REST OF THE WORLD, BY REGION, 2024–2029 (USD MILLION)


TABLE 37
SOLUTIONS: OTA TESTING MARKET IN MIDDLE EAST, BY COUNTRY, 2020–2023 (USD MILLION)


TABLE 38
SOLUTIONS: OTA TESTING MARKET IN MIDDLE EAST, BY COUNTRY, 2024–2029 (USD MILLION)


TABLE 39
SERVICES: OTA TESTING MARKET, BY END USER, 2020–2023 (USD MILLION)


TABLE 40
SERVICES: OTA TESTING MARKET, BY END USER, 2024–2029 (USD MILLION)


TABLE 41
SERVICES: OTA TESTING MARKET, BY CONSUMER DEVICES, 2020–2023 (USD MILLION)


TABLE 42
SERVICES: OTA TESTING MARKET, BY CONSUMER DEVICES, 2024–2029 (USD MILLION)


TABLE 43
SERVICES: OTA TESTING MARKET, BY REGION, 2020–2023 (USD MILLION)


TABLE 44
SERVICES: OTA TESTING MARKET, BY REGION, 2024–2029 (USD MILLION)


TABLE 45
SERVICES: OTA TESTING MARKET IN NORTH AMERICA, BY COUNTRY, 2020–2023 (USD MILLION)


TABLE 46
SERVICES: OTA TESTING MARKET IN NORTH AMERICA, BY COUNTRY, 2024–2029 (USD MILLION)


TABLE 47
SERVICES: OTA TESTING MARKET IN EUROPE, BY COUNTRY, 2020–2023 (USD MILLION)


TABLE 48
SERVICES: OTA TESTING MARKET IN EUROPE, BY COUNTRY, 2024–2029 (USD MILLION)


TABLE 49
SERVICES: OTA TESTING MARKET IN ASIA PACIFIC, BY COUNTRY, 2020–2023 (USD MILLION)


TABLE 50
SERVICES: OTA TESTING MARKET IN ASIA PACIFIC, BY COUNTRY, 2024–2029 (USD MILLION)


TABLE 51
SERVICES: OTA TESTING MARKET IN REST OF THE WORLD, BY REGION, 2020–2023 (USD MILLION)


TABLE 52
SERVICES: OTA TESTING MARKET IN REST OF THE WORLD, BY REGION, 2024–2029 (USD MILLION)


TABLE 53
SERVICES: OTA TESTING MARKET IN MIDDLE EAST, BY COUNTRY, 2020–2023 (USD MILLION)


TABLE 54
SERVICES: OTA TESTING MARKET IN MIDDLE EAST, BY COUNTRY, 2024–2029 (USD MILLION)


TABLE 55
OTA TESTING MARKET, BY TECHNOLOGY, 2020–2023 (USD MILLION)


TABLE 56
OTA TESTING MARKET, BY TECHNOLOGY, 2024–2029 (USD MILLION)


TABLE 57
OTA TESTING MARKET, BY CELLULAR NETWORK, 2020–2023 (USD MILLION)


TABLE 58
OTA TESTING MARKET, BY CELLULAR NETWORK, 2024–2029 (USD MILLION)


TABLE 59
OTA TESTING MARKET, BY END USER, 2020–2023 (USD MILLION)


TABLE 60
OTA TESTING MARKET, BY END USER, 2024–2029 (USD MILLION)


TABLE 61
CONSUMER DEVICES: OTA TESTING MARKET, BY OFFERING, 2020–2023 (USD MILLION)


TABLE 62
CONSUMER DEVICES: OTA TESTING MARKET, BY OFFERING, 2024–2029 (USD MILLION)


TABLE 63
CONSUMER DEVICES: OTA TESTING MARKET FOR SERVICES, BY REGION, 2020–2023 (USD MILLION)


TABLE 64
CONSUMER DEVICES: OTA TESTING MARKET FOR SERVICES, BY REGION, 2024–2029 (USD MILLION)


TABLE 65
CONSUMER DEVICES: OTA TESTING MARKET FOR SOLUTIONS, BY REGION, 2020–2023 (USD MILLION)


TABLE 66
CONSUMER DEVICES: OTA TESTING MARKET FOR SOLUTIONS, BY REGION, 2024–2029 (USD MILLION)


TABLE 67
CONSUMER DEVICES: OTA TESTING MARKET, BY REGION, 2020–2023 (USD MILLION)


TABLE 68
CONSUMER DEVICES: OTA TESTING MARKET, BY REGION, 2024–2029 (USD MILLION)


TABLE 69
AUTOMOTIVE & TRANSPORTATION: OTA TESTING MARKET, BY OFFERING, 2020–2023 (USD MILLION)


TABLE 70
AUTOMOTIVE & TRANSPORTATION: OTA TESTING MARKET, BY OFFERING, 2024–2029 (USD MILLION)


TABLE 71
AUTOMOTIVE & TRANSPORTATION: OTA TESTING MARKET FOR SERVICES, BY REGION, 2020–2023 (USD MILLION)


TABLE 72
AUTOMOTIVE & TRANSPORTATION: OTA TESTING MARKET FOR SERVICES, BY REGION, 2024–2029 (USD MILLION)


TABLE 73
AUTOMOTIVE & TRANSPORTATION: OTA TESTING MARKET FOR SOLUTIONS, BY REGION, 2020–2023 (USD MILLION)


TABLE 74
AUTOMOTIVE & TRANSPORTATION: OTA TESTING MARKET FOR SOLUTIONS, BY REGION, 2024–2029 (USD MILLION)


TABLE 75
AUTOMOTIVE & TRANSPORTATION: OTA TESTING MARKET, BY REGION, 2020–2023 (USD MILLION)


TABLE 76
AUTOMOTIVE & TRANSPORTATION: OTA TESTING MARKET, BY REGION, 2024–2029 (USD MILLION)


TABLE 77
INDUSTRIAL: OTA TESTING MARKET, BY OFFERING, 2020–2023 (USD MILLION)


TABLE 78
INDUSTRIAL: OTA TESTING MARKET, BY OFFERING, 2024–2029 (USD MILLION)


TABLE 79
INDUSTRIAL: OTA TESTING MARKET FOR SERVICES, BY REGION, 2020–2023 (USD MILLION)


TABLE 80
INDUSTRIAL: OTA TESTING MARKET FOR SERVICES, BY REGION, 2024–2029 (USD MILLION)


TABLE 81
INDUSTRIAL: OTA TESTING MARKET FOR SOLUTIONS, BY REGION, 2020–2023 (USD MILLION)


TABLE 82
INDUSTRIAL: OTA TESTING MARKET FOR SOLUTIONS, BY REGION, 2024–2029 (USD MILLION)


TABLE 83
INDUSTRIAL: OTA TESTING MARKET, BY REGION, 2020–2023 (USD MILLION)


TABLE 84
INDUSTRIAL: OTA TESTING MARKET, BY REGION, 2024–2029 (USD MILLION)


TABLE 85
SMART CITIES: OTA TESTING MARKET, BY OFFERING, 2020–2023 (USD MILLION)


TABLE 86
SMART CITIES: OTA TESTING MARKET, BY OFFERING, 2024–2029 (USD MILLION)


TABLE 87
SMART CITIES: OTA TESTING MARKET FOR SERVICES, BY REGION, 2020–2023 (USD MILLION)


TABLE 88
SMART CITIES: OTA TESTING MARKET FOR SERVICES, BY REGION, 2024–2029 (USD MILLION)


TABLE 89
SMART CITIES: OTA TESTING MARKET FOR SOLUTIONS, BY REGION, 2020–2023 (USD MILLION)


TABLE 90
SMART CITIES: OTA TESTING MARKET FOR SOLUTIONS, BY REGION, 2024–2029 (USD MILLION)


TABLE 91
SMART CITIES: OTA TESTING MARKET, BY REGION, 2020–2023 (USD MILLION)


TABLE 92
SMART CITIES: OTA TESTING MARKET, BY REGION, 2024–2029 (USD MILLION)


TABLE 93
OTHER END USERS: OTA TESTING MARKET, BY OFFERING, 2020–2023 (USD MILLION)


TABLE 94
OTHER END USERS: OTA TESTING MARKET, BY OFFERING, 2024–2029 (USD MILLION)


TABLE 95
OTHER END USERS: OTA TESTING MARKET FOR SERVICES, BY REGION, 2020–2023 (USD MILLION)


TABLE 96
OTHER END USERS: OTA TESTING MARKET FOR SERVICES, BY REGION, 2024–2029 (USD MILLION)


TABLE 97
OTHER END USERS: OTA TESTING MARKET FOR SOLUTIONS, BY REGION, 2020–2023 (USD MILLION)


TABLE 98
OTHER END USERS: OTA TESTING MARKET FOR SOLUTIONS, BY REGION, 2024–2029 (USD MILLION)


TABLE 99
OTHER END USERS: OTA TESTING MARKET, BY REGION, 2020–2023 (USD MILLION)


TABLE 100
OTHER END USERS: OTA TESTING MARKET, BY REGION, 2024–2029 (USD MILLION)


TABLE 101
OTA TESTING MARKET, BY REGION, 2020–2023 (USD MILLION)


TABLE 102
OTA TESTING MARKET, BY REGION, 2024–2029 (USD MILLION)


TABLE 103
NORTH AMERICA: OTA TESTING MARKET, BY COUNTRY, 2020–2023 (USD MILLION)


TABLE 104
NORTH AMERICA: OTA TESTING MARKET, BY COUNTRY, 2024–2029 (USD MILLION)


TABLE 105
NORTH AMERICA: OTA TESTING MARKET, BY END USER, 2020–2023 (USD MILLION )


TABLE 106
NORTH AMERICA: OTA TESTING MARKET, BY END USER, 2024–2029 (USD MILLION)


TABLE 107
NORTH AMERICA: OTA TESTING MARKET, BY OFFERING, 2020–2023 (USD MILLION )


TABLE 108
NORTH AMERICA: OTA TESTING MARKET, BY OFFERING, 2024–2029 (USD MILLION)


TABLE 109
EUROPE: OTA TESTING MARKET, BY COUNTRY, 2020–2023 (USD MILLION)


TABLE 110
EUROPE: OTA TESTING MARKET, BY COUNTRY, 2024–2029 (USD MILLION)


TABLE 111
EUROPE: OTA TESTING MARKET, BY END USER, 2020–2023 (USD MILLION )


TABLE 112
EUROPE: OTA TESTING MARKET, BY END USER, 2024–2029 (USD MILLION)


TABLE 113
EUROPE: OTA TESTING MARKET, BY OFFERING, 2020–2023 (USD MILLION )


TABLE 114
EUROPE: OTA TESTING MARKET, BY OFFERING, 2024–2029 (USD MILLION)


TABLE 115
ASIA PACIFIC: OTA TESTING MARKET, BY COUNTRY, 2020–2023 (USD MILLION)


TABLE 116
ASIA PACIFIC: OTA TESTING MARKET, BY COUNTRY, 2024–2029 (USD MILLION)


TABLE 117
ASIA PACIFIC: OTA TESTING MARKET, BY END USER, 2020–2023 (USD MILLION )


TABLE 118
ASIA PACIFIC: OTA TESTING MARKET, BY END USER, 2024–2029 (USD MILLION)


TABLE 119
ASIA PACIFIC: OTA TESTING MARKET, BY OFFERING, 2020–2023 (USD MILLION )


TABLE 120
ASIA PACIFIC: OTA TESTING MARKET, BY OFFERING, 2024–2029 (USD MILLION)


TABLE 121
REST OF THE WORLD: OTA TESTING MARKET, BY REGION, 2020–2023 (USD MILLION)


TABLE 122
REST OF THE WORLD: OTA TESTING MARKET, BY REGION, 2024–2029 (USD MILLION)


TABLE 123
REST OF THE WORLD: OTA TESTING MARKET, BY END USER, 2020–2023 (USD MILLION )


TABLE 124
REST OF THE WORLD: OTA TESTING MARKET, BY END USER, 2024–2029 (USD MILLION)


TABLE 125
REST OF THE WORLD: OTA TESTING MARKET, BY OFFERING, 2020–2023 (USD MILLION )


TABLE 126
REST OF THE WORLD: OTA TESTING MARKET, BY OFFERING, 2024–2029 (USD MILLION)


TABLE 127
MIDDLE EAST: OTA TESTING MARKET, BY COUNTRY, 2020–2023 (USD MILLION)


TABLE 128
MIDDLE EAST: OTA TESTING MARKET, BY COUNTRY, 2024–2029 (USD MILLION)


TABLE 129
OVERVIEW OF STRATEGIES ADOPTED BY KEY PLAYERS, 2021−2024


TABLE 130
MARKET SHARE ANALYSIS OF TOP 5 PLAYERS IN OTA TESTING MARKET, 2023


TABLE 131
OTA TESTING MARKET: OFFERING FOOTPRINT


TABLE 132
OTA TESTING MARKET: TECHNOLOGY FOOTPRINT


TABLE 133
OTA TESTING MARKET: END USER FOOTPRINT


TABLE 134
OTA TESTING MARKET: REGION FOOTPRINT


TABLE 135
OTA TESTING MARKET: DETAILED LIST OF KEY STARTUPS/SMES


TABLE 136
COMPETITIVE BENCHMARKING OF KEY STARTUPS/SMES, BY OFFERING


TABLE 137
COMPETITIVE BENCHMARKING OF KEY STARTUPS/SMES, BY TECHNOLOGY


TABLE 138
COMPETITIVE BENCHMARKING OF KEY STARTUPS/SMES, BY END USER


TABLE 139
COMPETITIVE BENCHMARKING OF KEY STARTUPS/SMES, BY REGION


TABLE 140
OTA TESTING MARKET: PRODUCT/SOLUTION/SERVICE LAUNCHES, MARCH 2021– JULY 2024


TABLE 141
OTA TESTING MARKET, DEALS, MARCH 2021– JULY 2024


TABLE 142
OTA TESTING MARKET, EXPANSIONS, MARCH 2021–JULY 2024


TABLE 143
ROHDE & SCHWARZ: COMPANY OVERVIEW


TABLE 144
ROHDE & SCHWARZ: PRODUCTS/SOLUTIONS/SERVICES 0FFERED


TABLE 145
ROHDE & SCHWARZ: PRODUCT LAUNCHES


TABLE 146
ROHDE & SCHWARZ: DEALS


TABLE 147
KEYSIGHT TECHNOLOGIES: COMPANY OVERVIEW


TABLE 148
KEYSIGHT TECHNOLOGIES: PRODUCTS/SOLUTIONS/SERVICES 0FFERED


TABLE 149
KEYSIGHT TECHNOLOGIES: PRODUCT LAUNCHES


TABLE 150
KEYSIGHT TECHNOLOGIES: DEALS


TABLE 151
ANRITSU: COMPANY OVERVIEW


TABLE 152
ANRITSU: PRODUCTS/SOLUTIONS/SERVICES 0FFERED


TABLE 153
ANRITSU: PRODUCT LAUNCHES


TABLE 154
ANRITSU: DEALS


TABLE 155
SGS SA: COMPANY OVERVIEW


TABLE 156
SGS SA: PRODUCTS/SOLUTIONS/SERVICES OFFERED


TABLE 157
SGS SA: DEALS


TABLE 158
SGS SA: EXPANSIONS


TABLE 159
INTERTEK GROUP PLC: COMPANY OVERVIEW


TABLE 160
INTERTEK GROUP PLC: PRODUCTS/SOLUTIONS/SERVICES 0FFERED


TABLE 161
INTERTEK GROUP PLC: DEALS


TABLE 162
NATIONAL INSTRUMENTS: COMPANY OVERVIEW


TABLE 163
NATIONAL INSTRUMENTS: PRODUCTS/SOLUTIONS/SERVICES OFFERED


TABLE 164
UL LLC: COMPANY OVERVIEW


TABLE 165
UL LLC: PRODUCTS/SOLUTIONS/SERVICES 0FFERED


TABLE 166
SPIRENT COMMUNICATIONS: COMPANY OVERVIEW


TABLE 167
SPIRENT COMMUNICATIONS: PRODUCTS/SOLUTIONS/SERVICES OFFERED


TABLE 168
SPIRENT COMMUNICATIONS: PRODUCT LAUNCHES


TABLE 169
SPIRENT COMMUNICATIONS: DEALS


TABLE 170
BUREAU VERITAS: COMPANY OVERVIEW


TABLE 171
BUREAU VERITAS: PRODUCTS/SOLUTIONS/SERVICES OFFERED


TABLE 172
BUREAU VERITAS: EXPANSIONS


TABLE 173
EUROFINS SCIENTIFIC: COMPANY OVERVIEW


TABLE 174
EUROFINS SCIENTIFIC: PRODUCTS/SOLUTIONS/SERVICES OFFERED


TABLE 175
EUROFINS SCIENTIFIC: DEALS


TABLE 176
EUROFINS SCIENTIFIC: EXPANSIONS


TABLE 177
DEKRA: COMPANY OVERVIEW


TABLE 178
DEKRA: PRODUCTS/SOLUTIONS/SERVICES 0FFERED


TABLE 179
DEKRA: EXPANSIONS


TABLE 180
TÜV RHEINLAND: COMPANY OVERVIEW


TABLE 181
TÜV RHEINLAND: PRODUCTS/SOLUTIONS/SERVICES 0FFERED


TABLE 182
TÜV RHEINLAND: PRODUCT LAUNCHES


TABLE 183
ELEMENT MATERIALS TECHNOLOGY: COMPANY OVERVIEW


TABLE 184
ELEMENT MATERIALS TECHNOLOGY: PRODUCTS/SOLUTIONS/SERVICES 0FFERED


TABLE 185
ELEMENT MATERIALS TECHNOLOGY: DEALS


TABLE 186
TÜV SÜD: COMPANY OVERVIEW


TABLE 187
TÜV SÜD: PRODUCTS/SOLUTIONS/SERVICES OFFERED


TABLE 188
TÜV SÜD: EXPANSIONS


TABLE 189
TERADYNE INC.: COMPANY OVERVIEW


TABLE 190
TERADYNE INC.: PRODUCTS/SOLUTIONS/SERVICES 0FFERED


TABLE 191
MICROWAVE VISION GROUP: COMPANY OVERVIEW


TABLE 192
MICROWAVE VISION GROUP: PRODUCTS/SOLUTIONS/SERVICES 0FFERED


LIST OF FIGURES


FIGURE 1
OTA TESTING MARKET: SEGMENTATION & REGIONS COVERED


FIGURE 2
OTA TESTING MARKET: RESEARCH DESIGN


FIGURE 3
BOTTOM-UP APPROACH


FIGURE 4
TOP-DOWN APPROACH


FIGURE 5
MARKET SIZE ESTIMATION METHODOLOGY: SUPPLY-SIDE ANALYSIS


FIGURE 6
DATA TRIANGULATION: OTA TESTING MARKET


FIGURE 7
OTA TESTING MARKET GROWTH, 2020−2029 (USD MILLION)


FIGURE 8
SERVICES SEGMENT TO REGISTER HIGHER CAGR DURING FORECAST PERIOD


FIGURE 9
CELLULAR NETWORK TECHNOLOGY TO DOMINATE OTA TESTING MARKET DURING FORECAST PERIOD


FIGURE 10
CONSUMER DEVICES SEGMENT TO ACCOUNT FOR LARGEST MARKET SHARE DURING FORECAST PERIOD


FIGURE 11
ASIA PACIFIC TO EXHIBIT HIGHEST CAGR IN OTA TESTING MARKET FROM 2024 TO 2029


FIGURE 12
EXTENSIVE 5G ROLLOUTS IN ASIA PACIFIC TO DRIVE MARKET GROWTH


FIGURE 13
5G TO ACCOUNT FOR LARGEST MARKET SHARE DURING FORECAST PERIOD


FIGURE 14
SERVICES SEGMENT TO ACCOUNT FOR LARGER SHARE OF OTA TESTING MARKET DURING FORECAST PERIOD


FIGURE 15
CONSUMER DEVICES SEGMENT TO DOMINATE MARKET DURING FORECAST PERIOD


FIGURE 16
CONSUMER DEVICES SEGMENT TO BE LARGEST END USER OF OTA TESTING IN ASIA PACIFIC


FIGURE 17
OTA TESTING MARKET: DRIVERS, RESTRAINTS, OPPORTUNITIES, AND CHALLENGES


FIGURE 18
IMPACT ANALYSIS OF DRIVERS ON OTA TESTING MARKET


FIGURE 19
IMPACT ANALYSIS OF RESTRAINTS ON OTA TESTING MARKET


FIGURE 20
IMPACT ANALYSIS OF OPPORTUNITIES ON OTA TESTING MARKET


FIGURE 21
IMPACT ANALYSIS OF CHALLENGES ON OTA TESTING MARKET


FIGURE 22
TRENDS/DISRUPTIONS IMPACTING CUSTOMER BUSINESS


FIGURE 23
AVERAGE SELLING PRICE TREND OF KEY PLAYERS, BY OFFERING (TEST CHAMBER)


FIGURE 24
AVERAGE SELLING PRICE TREND OF KEY PLAYERS, BY OFFERING (ANTENNA TESTING SOLUTIONS)


FIGURE 25
AVERAGE SELLING PRICE TREND OF TEST CHAMBER, BY REGION


FIGURE 26
OTA TESTING MARKET: SUPPLY CHAIN ANALYSIS


FIGURE 27
OTA TESTING MARKET: ECOSYSTEM ANALYSIS


FIGURE 28
FUNDS AUTHORIZED BY KEY PLAYERS IN OTA TESTING MARKET, 2020−2024


FIGURE 29
PATENTS APPLIED AND GRANTED, 2014−2023


FIGURE 30
EXPORT DATA FOR HS CODE 903180-COMPLIANT PRODUCTS, BY COUNTRY, 2019–2023


FIGURE 31
IMPORT DATA FOR HS CODE 903180-COMPLIANT PRODUCTS, BY COUNTRY, 2019–2023


FIGURE 32
OTA TESTING MARKET: PORTER'S FIVE FORCES ANALYSIS


FIGURE 33
IMPACT OF PORTER'S FIVE FORCES ON OTA TESTING MARKET


FIGURE 34
INFLUENCE OF STAKEHOLDERS IN BUYING PROCESS FOR OTA TESTING


FIGURE 35
KEY BUYING CRITERIA FOR TOP 3 END USERS OF OTA TESTING


FIGURE 36
IMPACT OF AI/GEN AI ON OTA TESTING MARKET


FIGURE 37
SERVICES TO ACCOUNT FOR LARGER SHARE OF OTA TESTING MARKET


FIGURE 38
CELLULAR NETWORK TO ACCOUNT FOR LARGEST MARKET SHARE DURING FORECAST PERIOD


FIGURE 39
CONSUMER DEVICES TO ACCOUNT FOR LARGEST SHARE OF OTA TESTING MARKET


FIGURE 40
INDIA TO REGISTER HIGHEST CAGR DURING FORECAST PERIOD


FIGURE 41
NORTH AMERICA: OTA TESTING MARKET SNAPSHOT


FIGURE 42
EUROPE: OTA TESTING MARKET SNAPSHOT


FIGURE 43
ASIA PACIFIC: OTA TESTING MARKET SNAPSHOT


FIGURE 44
COMPANIES ADOPTED PARTNERSHIPS AS KEY GROWTH STRATEGY FROM 2021 TO 2024


FIGURE 45
REVENUE ANALYSIS OF KEY PLAYER IN OTA TESTING MARKET, 2021–2023


FIGURE 46
OTA TESTING MARKET SHARE ANALYSIS, 2023


FIGURE 47
COMPANY VALUATION, 2024


FIGURE 48
FINANCIAL METRICS (EV/EBITDA), 2024


FIGURE 49
PRODUCT/BRAND COMPARISON


FIGURE 50
OTA TESTING MARKET: COMPANY EVALUATION MATRIX (SOLUTIONS), 2023


FIGURE 51
OTA TESTING MARKET: COMPANY EVALUATION MATRIX (SERVICES), 2023


FIGURE 52
OTA TESTING MARKET: COMPANY FOOTPRINT


FIGURE 53
OTA TESTING MARKET: STARTUPS/SMES EVALUATION MATRIX, 2023


FIGURE 54
KEYSIGHT TECHNOLOGIES: COMPANY SNAPSHOT


FIGURE 55
ANRITSU: COMPANY SNAPSHOT


FIGURE 56
SGS SA: COMPANY SNAPSHOT


FIGURE 57
INTERTEK GROUP PLC: COMPANY SNAPSHOT


FIGURE 58
SPIRENT COMMUNICATIONS: COMPANY SNAPSHOT


FIGURE 59
BUREAU VERITAS: COMPANY SNAPSHOT


FIGURE 60
EUROFINS SCIENTIFIC: COMPANY SNAPSHOT


FIGURE 61
DEKRA: COMPANY SNAPSHOT


FIGURE 62
TÜV RHEINLAND: COMPANY SNAPSHOT


FIGURE 63
TÜV SÜD: COMPANY SNAPSHOT


FIGURE 64
TERADYNE INC.: COMPANY SNAPSHOT


Methodology

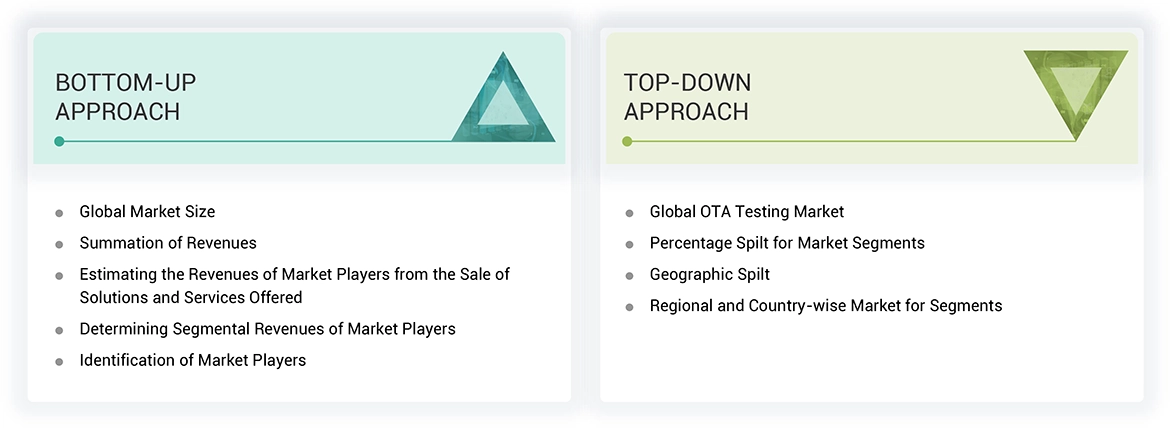
The research study involved 4 major activities in estimating the size of the OTA testing market. Exhaustive secondary research has been done to collect important information about the market and peer markets. The validation of these findings, assumptions, and sizing with the help of primary research with industry experts across the value chain has been the next step. Both top-down and bottom-up approaches have been used to estimate the market size. Post which the market breakdown and data triangulation have been adopted to estimate the market sizes of segments and sub-segments.

Secondary Research

In the secondary research process, various secondary sources have been referred to for identifying and collecting information required for this study. The secondary sources include annual reports, press releases, investor presentations of companies, white papers, and articles from recognized authors. Secondary research has been mainly done to obtain key information about the market’s value chain, the pool of key market players, market segmentation according to industry trends, regional outlook, and developments from both market and technology perspectives.

In the OTA testing market report, the global market size has been estimated using both the top-down and bottom-up approaches, along with several other dependent submarkets. The major players in the market were identified using extensive secondary research, and their presence in the market was determined using secondary and primary research. All the percentage shares splits, and breakdowns have been determined using secondary sources and verified through primary sources.

Primary Research

Extensive primary research has been conducted after understanding the OTA testing market scenario through secondary research. Several primary interviews have been conducted with key opinion leaders from both demand- and supply-side vendors across 4 major regions— North America, Europe, Asia Pacific, and the Rest of the World. Approximately 25% of the primary interviews have been conducted with the demand-side vendors and 75% with the supply-side vendors. Primary data has been collected mainly through telephonic interviews, which consist of 80% of the total primary interviews; questionnaires and emails have also been used to collect the data.

After successful interaction with industry experts, brief sessions were conducted with highly experienced independent consultants to reinforce the findings of our primary research. This, along with the in-house subject matter experts’ opinions, has led us to the findings as described in the report.

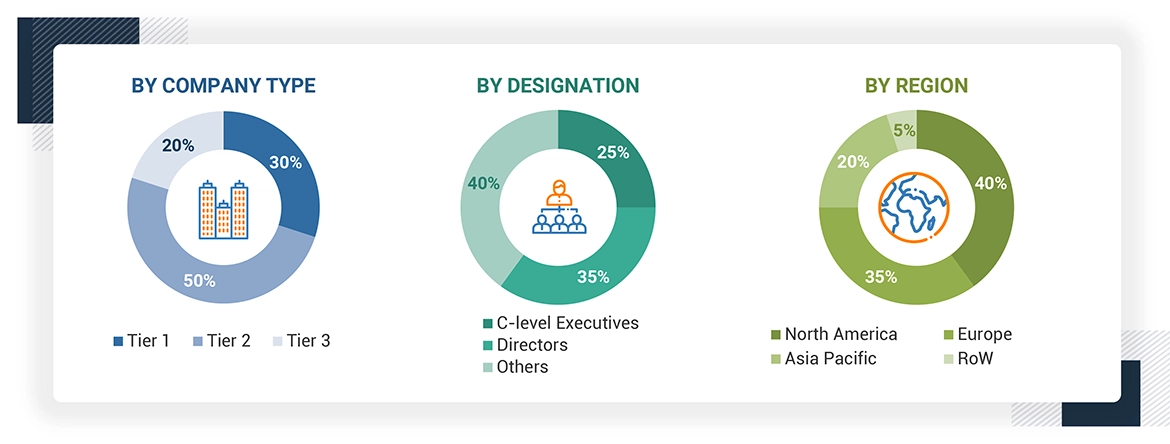
Note: “Others” includes sales, marketing, and product managers

About the assumptions considered for the study, To know download the pdf brochure

Market Size Estimation

In the market engineering process, both top-down and bottom-up approaches, along with data triangulation methods, have been used to estimate and validate the size of the OTA testing and other dependent submarkets. The research methodology used to estimate the market sizes includes the following:

  • Identifying top-line investments and spending in the ecosystem and considering segment-level splits and major market developments
  • Identifying different stakeholders in the OTA testing market that influence the entire market, along with participants across the supply chain
  • Analyzing major manufacturers and service providers in the OTA testing market and studying their solutions and service portfolios
  • Analyzing trends related to the adoption of OTA testing solutions and services
  • Tracking recent and upcoming market developments, including investments, R&D activities, solution and service launches, collaborations, mergers and acquisitions, and partnerships, as well as forecasting the market size based on these developments and other critical parameters
  • Carrying out multiple discussions with key opinion leaders to identify the adoption trends of OTA testing solutions and services
  • Segmenting the overall market into various other market segments
  • Validating the estimates at every level through discussions with key opinion leaders, such as chief executives (CXOs), directors, and operation managers, and finally with the domain experts at MarketsandMarkets

Data Triangulation

After arriving at the overall market size by the market size estimation process explained in the earlier section, the overall OTA testing market has been divided into several segments and subsegments. To complete the overall market engineering process and arrive at the exact statistics for all segments, the data triangulation and market breakdown procedures have been used, wherever applicable. The data has been triangulated by studying various factors and trends from both the demand and supply side perspectives. Along with data triangulation and market breakdown, the market has been validated by top-down and bottom-up approaches.

Market Definition

OTA testing is basically a methodology that considers the performance of a wireless device about the performance of its antenna transmitting and receiving signals in the air. The main parameters for this test include Total Isotropic Sensitivity and Total Radiated Power. The TIS refers to the total sensitivity of an antenna to receive signals from every direction so that it can ensure that communication is okay in different scenarios, and it is tested inside anechoic chambers under different environmental conditions. Total Radiated Power-TRP measures antenna performance with regard to sending out signals, ensuring that the antenna does not exceed the maximum radiated power limits and works well in real-life environments.

The segments of the OTA Testing market based on offerings include test chambers (anechoic chambers), antenna testing solutions, and software, along with comprehensive testing and certification services. The technology segment includes cellular networks, inclusive of 5G, LTE, UMTS, GSM, CDMA, WiFi, and Bluetooth. The end-user segment is quite diversified and includes applications such as consumer smartphones, laptops, tablets, wearables, others, automotive & transportation systems, industrial applications, smart cities infrastructure, and emerging use cases. Each of these segments requires precise OTA testing against performance standards and regulations.

Key Stakeholders

  • Raw Material Suppliers
  • Test Equipment Manufacturers
  • Service Providers
  • Device Manufacturers
  • Network Operators
  • Research and Development Organizations
  • Government and Regulatory Bodies
  • Industry Associations
  • System Integrators
  • Component Suppliers
  • Certification Bodies

Report Objectives

  • To define, describe, and forecast the OTA testing market in terms of value on the basis of offering, technology, end users, and region.
  • To forecast the market size for various segments with respect to four main regions, namely, North America, Europe, Asia Pacific, and Rest of the World
  • To define, describe, and forecast test chamber and antenna testing solutions in OTA testing market in terms of volume
  • To provide detailed information regarding the major drivers, restraints, opportunities, and challenges influencing the growth of the OTA testing market
  • To study the complete value chain and related industry segments for the OTA testing market
  • To strategically analyze the micro markets with respect to individual growth trends, prospects, and contributions to the total market
  • To analyze trends and disruptions; pricing trends; investment and funding scenario; patents and innovations; trade data (export and import data); regulatory environment; Porter's five forces analysis; case studies; key stakeholders & buying criteria; technology trends; the market ecosystem; and key conferences and events related to the OTA testing market.
  • To analyze opportunities in the market for various stakeholders by identifying the high-growth segments of the market
  • To strategically profile the key players and comprehensively analyze their market position in terms of ranking and core competencies, along with detailing the competitive landscape for the market leaders.
  • To analyze competitive developments such as solution and service launches/developments, expansions, acquisitions, partnerships, collaborations, agreements, and research and development (R&D) activities carried out by players in the OTA testing market

Available Customizations

With the given market data, MarketsandMarkets offers customizations according to the specific requirements of companies. The following customization options are available for the report:

  • Country-wise Information:
  • Country-wise breakdown for North America, Europe, Asia Pacific, and Rest of the World
  • Company Information:
  • Detailed analysis and profiling of additional market players (up to five)

Personalize This Research

  • Triangulate with your Own Data
  • Get Data as per your Format and Definition
  • Gain a Deeper Dive on a Specific Application, Geography, Customer or Competitor
  • Any level of Personalization
Request A Free Customisation

Let Us Help You

  • What are the Known and Unknown Adjacencies Impacting the OTA Testing Market
  • What will your New Revenue Sources be?
  • Who will be your Top Customer; what will make them switch?
  • Defend your Market Share or Win Competitors
  • Get a Scorecard for Target Partners
Customized Workshop Request

Custom Market Research Services

We Will Customise The Research For You, In Case The Report Listed Above Does Not Meet With Your Requirements

Get 10% Free Customisation

Growth opportunities and latent adjacency in OTA Testing Market

thesmaz

Apr, 2021

Need details about companies using OTA Testing (5G & 4G).

Turn Research into Strategy in Minutes. Generate 15+ consulting-grade intelligence outputs instantly
Interactive dashboards | Proprietary market intelligence
Try GrowthIQ →
DMCA.com Protection Status