Polyester Fiber Market

Polyester Fiber Market by Form (Solid and Hollow), Grade (PET Polyester Fiber and Pcdt Polyester Fiber), Product type (PFY and PSF), Application (Textile & Apparel, Home Furnishing, Automotive), and Region - Global Forecast to 2028

Report Code: CH 8818 Oct, 2023, by marketsandmarkets.com

The global polyester fiber market size is expected to be USD 102.2 billion in 2023 and is projected to grow at a CAGR of 8.2% during the forecasted period for 151.6 billion for 2028. Numerous applications, including textile & apparel, automotive & transportation, home furnishing, industrial and others, require polyester fiber. The expansion of these applications directly influences polyester fiber demand. Moreover, it's recognized for its recyclability, which aligns with global sustainability goals, and hence which supports market expansion.

Attractive Opportunities in the Polyester Fiber Market

Polyester Fiber Market

To know about the assumptions considered for the study, Request for Free Sample Report

Polyester Fiber Market

Global Polyester fiber Market Dynamics:

Drivers: Polyester fiber’s adaptability to various applications

Polyester fiber plays a crucial role in today's textile industry because of its exceptional adaptability to a wide array of applications. Its intrinsic qualities such as strength and durability as well as other significant variables contribute to its flexibility. Polyester is durable, thus its applications in apparel, home textiles, and industrial items guarantee that the finished goods can withstand the rigors of regular use. Polyester can be produced as filament and staple fibers, among other textile forms. This variety of forms gives manufacturers the freedom to choose the form that best suits their particular purpose, be it making durable industrial materials or cozy apparel.

Restraints: Polyester’s limited breathability

While polyester fiber possesses numerous advantageous characteristics, it is not devoid of limitations. One prominent constraint is its restricted breathability, which can impact its suitability for specific applications, particularly in the context of clothing and textiles.

Polyester, being a synthetic fiber, offers less breathability compared to natural fibers like cotton or linen. This reduced breathability arises from polyester's fundamental properties, including its limited moisture absorption and its propensity to trap heat and moisture close to the body. Consequently, this limitation can result in discomfort, particularly in warm or humid conditions.

In the realm of clothing, where breathability is often crucial for comfort, polyester may not be the ideal choice for certain types of garments, such as activewear, summer clothing, or undergarments. When worn in high-temperature environments or during physical activities, polyester clothing can cause individuals to feel overheated and sweaty, as it interferes with the body's natural cooling mechanisms, specifically through evaporation. In summary, polyester's restricted breathability stands as a significant limitation that warrants consideration.

Opportunities: Various customization needs

Polyester fiber finds extensive use in the retrofitting and improvement of pre-existing infrastructure and buildings, primarily due to its superior properties. It is a great option for modernizing HVAC and industrial installations, supporting fire safety systems, and improving plumbing systems because of its resistance to corrosion, chemical resistance, and flame-retardant qualities. The adaptability of polyester fiber really shows in historical preservation projects, where it blends in perfectly with existing structures.

Nowadays, polyester fiber is playing a major part in converting outdated infrastructure into areas that are efficient, sustainable, and modern. This change is largely due to its simplicity of installation and potential for long-term cost reductions, mostly from less maintenance needs. Customization has been increasingly popular in a number of industries, including textiles, and polyester fiber is well-positioned to benefit from this trend.

Challenges: Microplastic pollution due to excessive use

Polyester fiber encounters a significant challenge in the form of microplastic pollution, an issue intrinsically tied to the environmental consequences of polyester and other synthetic textiles. Petrochemicals are the source of polyester, which is produced using non-renewable resources. Polyester fabrics have the potential to exacerbate the issue of microplastic pollution when their life cycle is completed. Microfibers, or tiny plastic particles, are released when polyester decomposes over time.

When worn and laundered, polyester textiles—especially those with fine denier (fiber thickness)—are more prone to shedding these microfibers. The wastewater that contains these microfibers is eventually dumped into rivers and seas, among other natural water bodies. These microplastic fibers are eaten by aquatic species after being released into the environment, and they may eventually make their way up the food chain. Concern over the effects on ecosystems, terrestrial environments, and marine life is growing.

Polyester fiber Market: Ecosystem

Polyester Fiber Market Ecosystem

The solid polyester fiber segment to account for the largest market share, in terms of value and volume

Over the course of the estimated period, the solid form of polyester fiber is expected to witness the largest Compound Annual Growth Rate (CAGR) and to dominate the worldwide polyester fiber market. Demand for environmentally friendly solid polyester fiber has significantly increased across a range of industries, especially for recycled materials. Solid polyester fiber's remarkable CAGR is shown by the fact that it is still a necessary component in many industries. These include the fashion business, where it is notable for its color retention and affordability, as well as the construction and industrial sectors, where it is crucial for durability.

PET Polyester Fiber is expected to lead the global polyester fiber market during the forecast period

Polyester fiber made of PET is expected to grow at the greatest Compound Annual Growth Rate (CAGR) due to its favorable properties. The market for polyester fiber made of PET (polyethylene terephthalate) has grown significantly, and its strong compound annual growth rate (CAGR) confirms its continued appeal. Several noteworthy causes are responsible for this strong demand. Because PET polyester fiber is so affordable and versatile, it is a highly favored option for a broad range of applications, including clothing, home furnishings, industrial applications, and textiles. Its outstanding resilience to external influences, robustness, and longevity have strengthened its standing across a range of sectors. In light of the growing importance of environmental issues, PET polyester fiber's recyclability makes it an exceptional choice. The environmental responsibility is in line with global sustainability objectives.

Polyester Filament Yarn to be the fastest growing segment between 2023 to 2028

The polyester filament yarn is projected to experience the highest Compound Annual Growth Rate (CAGR) during the forecasted period. In contrast, polyester staple fiber is expected to hold the largest market share in 2022, in terms of value. Polyester staple fiber is in considerable demand, especially in the textile and home furnishings industry. It finds applications in the manufacturing of clothing, bedding, curtains, and various products due to its resistance to wrinkles, ease of maintenance, and cost-effectiveness. The CAGR for polyester staple fiber remains relatively steady, primarily due to its significant role in the textile and home furnishings sectors. However, its growth rate may not match that of polyester filament yarn, as it serves specific applications.

Textile & Apparel segment hold the largest share in the global polyester fiber market 

The textile and apparel sector continues to maintain its unchallenged leading position in the huge and constantly changing polyester fiber market. Because of its continued popularity, it is in the forefront, especially when compared to many other applications. There are multiple variables that lead to this supremacy. Because of its special combination of characteristics, including remarkable durability, resistance to wrinkles, and color retention, polyester fiber is an excellent choice for textiles and apparel. This adaptability is present in many different goods, ranging from high-performance sporting to daily wear. The polyester fiber's potential has been completely realized by the textile and apparel industries, allowing them to create a wide range of styles that satisfy different customer tastes and current trends.

The textile and apparel industry is still at the forefront of innovation, actively supporting technological advancements and environmentally conscious efforts. The development of sustainable and recycled polyester fibers guarantees its continued dominance in the polyester fiber market, precisely coinciding with the increasing global emphasis on environmental responsibility. The polyester fiber industry is anchored by the textile and apparel sector, which sets the bar for other uses due to its diverse appeal and ongoing significance.

Asia Pacific holds the maximum share along with the maximum CAGR in terms of both, volume and value

The Asia-Pacific region took a commanding position in the global polyester fiber market in 2022, securing the largest market share. Furthermore, from 2023 to 2028, this region is expected to experience the greatest Compound Annual Growth Rate (CAGR). Because of the large and quickly growing population in the Asia-Pacific region, polyester fiber has found a home in this vibrant and promising market. This region is home to almost 60% of the global population, thus it is not surprising that polyester fiber is used so widely in so many different applications. The spectacular economic growth of the region has also contributed to the development of industrial applications and infrastructure, as well as the increased demand for polyester fibers across a variety of industries, including construction and the automobile industry. The Asia-Pacific region's dynamic customer base and governmental backing for the textile industry are key factors in satisfying the world's demand for polyester fiber.

Polyester Fiber Market by Region

To know about the assumptions considered for the study, download the pdf brochure

Riseing demand by evolving fashion trends and active lifestyles

With the ever-changing fashion scene and the increasing popularity of active lifestyles, polyester fiber has never had more prospects in the textile sector.

Given how quickly trends change in the fashion industry, polyester's adaptability really shines out. Because polyester can mimic the look and feel of natural fabrics or mix in seamlessly with them, designers are able to create a vast range of fashions while taking advantage of polyester's durability. Polyester easily adjusts to satisfy the demand for creative, cozy, and stylish apparel as fashion trends change.

For polyester in particular, the rise in active lifestyles and athleisure trend has proven advantageous. Because of its stretchability, breathability, and moisture-wicking properties, this synthetic fabric is perfect for athleisure, sportswear, and activewear. It can maintain a sleek and fashionable appearance while keeping people comfortable throughout vigorous activity. Fashion trends are becoming more and more global, and polyester is a reliable material for producers who serve a variety of markets because of its availability and consistent quality. It is easily customizable to meet the needs of consumers worldwide in terms of performance and style preferences.

Key Market Players

  • Zhejiang Hengyi Group Co., Ltd. (China)
  • Reliance Industries Ltd. (India)
  • Indorama Venture  Public Company Ltd. (Thailand)
  • Toray Industries Ltd. (Japan)
  • Sinopec Yizheng Chemical Fiber Limited Liablity Company (China)
  • Alpek S.A.B DE C.V. (Mexico)
  • Diyou Fiber (M) Sdn Bhd (Malaysia)
  • Bombay Dyeing (India)
  • Green Group SA (Romania)
  • W. R. Grace & Co. (US)

These companies are involved in adopting various inorganic and organic strategies to increase their foothold in the polyester fiber industry. The study includes an in-depth competitive analysis of these key players in the polyester fiber market, with their company profiles, recent developments, and key market strategies.

Get online access to the report on the World's First Market Intelligence Cloud

  • Easy to Download Historical Data & Forecast Numbers
  • Company Analysis Dashboard for high growth potential opportunities
  • Research Analyst Access for customization & queries
  • Competitor Analysis with Interactive dashboard
  • Latest News, Updates & Trend analysis
Request Sample

Scope of the Report

:

Report Metric

Details

Market size available for years

2021–2028

Base year considered

2022

Forecast period

2023–2028

Forecast units

Value (USD Million/Billion), Volume (Kilotons)

Segments covered

By Form, By Grade, By Product Type, By Application and Region

Regions covered

North America, Europe, Asia Pacific, Latin America, and Middle East & Africa

Companies covered

Zhejiang Hengyi Group Co., Ltd. (China), Reliance Industries Ltd. (India), Indorama Venture  Public Company Ltd. (Thailand), Toray Industries Ltd. (Japan), Sinopec Yizheng Chemical Fiber Limited Liablity Company (China), Alpek S.A.B DE C.V. (Mexico), Diyou Fiber (M) Sdn Bhd (Malaysia), Bombay Dyeing (India), and Green Group SA (Romania)

Based on Form:
  • Solid
  • Hollow
Based on Grade:
  • PET Polyester Fiber
  • PCDT Polyester Fiber
Based on Product Type:
  • Polyester Filament Yarn
  • Polyester Staple Fiber
Based on the Application:
  • Textile & Apparel
  • Home Furnishing
  • Automotive & Transportation
  • Industrial
  • Others (yoga & exercise mat, packaging and furniture)
Based on the region:
  • Asia Pacific
  • Europe
  • North America
  • Middle East & Africa
  • Latin America

Recent Developments

  • In March 2023, Reliance Industries has completed the acquisition of Sintex Industries. The development occurred a year after banks approved the acquisition and a month after the National Company Law Tribunal (NCLT) approved the transaction.
  • In January 2023, Stein Fibers Ltd. acquired the Fibertex corporation to improve its product portfolio and better serve its customers.
  • In September 2022, Reliance Polyester Ltd, a wholly owned subsidiary of Reliance Industries, has completed the acquisition of the polyester business of Shubhalakshmi Polyesters Ltd. Shubhalakshmi Polyesters has two manufacturing facilities, in Dahej (Gujarat) and Silvassa (Dadra and Nagar Haveli).
  • In June 2022, Alpek S.A.B de C.V. announced that it had acquired CarbonLite Recycling LLC’s state-of-the-art PET recycling and pelletization facility in Reading, Pennsylvania, in the US. The site was acquired for USD 96 million debt-free and is subject to customary conditions precedent.

Frequently Asked Questions (FAQ):

To speak to our analyst for a discussion on the above findings, click Speak to Analyst

TABLE OF CONTENTS
 
1 INTRODUCTION (Page No. - 31)
    1.1 STUDY OBJECTIVES 
    1.2 MARKET DEFINITION 
           1.2.1 INCLUSIONS AND EXCLUSIONS
    1.3 MARKET SCOPE 
          FIGURE 1 POLYESTER FIBER MARKET SEGMENTATION
           1.3.1 REGIONS COVERED
           1.3.2 YEARS CONSIDERED
    1.4 CURRENCY CONSIDERED 
    1.5 UNITS CONSIDERED 
    1.6 LIMITATIONS 
    1.7 STAKEHOLDERS 
           1.7.1 RECESSION IMPACT
 
2 RESEARCH METHODOLOGY (Page No. - 35)
    2.1 RESEARCH DATA 
          FIGURE 2 POLYESTER FIBER MARKET: RESEARCH DESIGN
           2.1.1 SECONDARY DATA
                    2.1.1.1 Key data from secondary sources
           2.1.2 PRIMARY DATA
                    2.1.2.1 Key primary participants
                    2.1.2.2 Breakdown of primary interviews
                    2.1.2.3 Key industry insights
    2.2 RECESSION IMPACT 
    2.3 MARKET SIZE ESTIMATION 
           2.3.1 TOP-DOWN APPROACH
                    FIGURE 3 MARKET SIZE ESTIMATION: TOP-DOWN APPROACH
           2.3.2 BOTTOM-UP APPROACH
                    FIGURE 4 MARKET SIZE ESTIMATION: BOTTOM-UP APPROACH
    2.4 BASE NUMBER CALCULATION 
           2.4.1 MARKET SIZE ESTIMATION METHODOLOGY: SUPPLY-SIDE ANALYSIS
           2.4.2 MARKET SIZE ESTIMATION METHODOLOGY: DEMAND-SIDE ANALYSIS
    2.5 MARKET FORECAST APPROACH 
           2.5.1 SUPPLY-SIDE
           2.5.2 DEMAND- SIDE
    2.6 DATA TRIANGULATION 
          FIGURE 5 POLYESTER FIBER MARKET: DATA TRIANGULATION
    2.7 FACTOR ANALYSIS 
    2.8 RESEARCH ASSUMPTIONS 
    2.9 RISK ANALYSIS 
 
3 EXECUTIVE SUMMARY (Page No. - 44)
    FIGURE 6 POLYESTER FILAMENT YARN TO BE FASTER-GROWING POLYESTER FIBER DURING FORECAST PERIOD
    FIGURE 7 SOLID FORM SEGMENT TO LEAD POLYESTER FIBER MARKET
    FIGURE 8 PET POLYESTER TO LEAD POLYESTER FIBER MARKET
    FIGURE 9 HOME FURNISHING TO BE SECOND-FASTEST-GROWING APPLICATION OF POLYESTER FIBER
    FIGURE 10 CHINA TO BE LARGEST COUNTRY IN POLYESTER FIBER MARKET
    FIGURE 11 ASIA PACIFIC DOMINATED POLYESTER FIBER MARKET IN 2022
 
4 PREMIUM INSIGHTS (Page No. - 49)
    4.1 ATTRACTIVE OPPORTUNITIES FOR PLAYERS IN POLYESTER FIBER MARKET 
          FIGURE 12 HIGH DEMAND FROM TEXTILE & APPAREL INDUSTRY TO DRIVE MARKET
    4.2 POLYESTER FIBER MARKET, BY TYPE 
          FIGURE 13 POLYESTER FILAMENT YARN DOMINATED OVERALL MARKET
    4.3 POLYESTER FIBER MARKET, BY GRADE AND REGION 
          FIGURE 14 ASIA PACIFIC TO BE LARGEST POLYESTER FIBER MARKET
    4.4 POLYESTER FIBER MARKET, BY APPLICATION 
          FIGURE 15 TEXTILE & APPAREL TO LEAD POLYESTER FIBER MARKET
    4.5 POLYESTER FIBER MARKET, BY KEY COUNTRY 
          FIGURE 16 CHINA TO REGISTER HIGHEST CAGR DURING FORECAST PERIOD
 
5 MARKET OVERVIEW (Page No. - 52)
    5.1 INTRODUCTION 
    5.2 MARKET DYNAMICS 
          FIGURE 17 DRIVERS, RESTRAINTS, OPPORTUNITIES, AND CHALLENGES IN POLYESTER FIBER MARKET
           5.2.1 DRIVERS
                    5.2.1.1 Polyester fiber’s adaptability to various applications
                    5.2.1.2 Cost effectiveness
           5.2.2 RESTRAINTS
                    5.2.2.1 Polyester fiber’s limited breathability
           5.2.3 OPPORTUNITIES
                    5.2.3.1 Growth by evolving fashion trends and active lifestyles
                    5.2.3.2 Various customization needs
           5.2.4 CHALLENGES
                    5.2.4.1 Microplastic pollution due to excessive use
                    5.2.4.2 Quality concern due to complex process
    5.3 PORTER’S FIVE FORCES ANALYSIS 
          FIGURE 18 POLYESTER FIBER MARKET: PORTER’S FIVE FORCES ANALYSIS
           5.3.1 THREAT OF NEW ENTRANTS
           5.3.2 THREAT OF SUBSTITUTES
           5.3.3 BARGAINING POWER OF BUYERS
           5.3.4 BARGAINING POWER OF SUPPLIERS
           5.3.5 INTENSITY OF COMPETITIVE RIVALRY
                    TABLE 1 POLYESTER FIBER MARKET: PORTER’S FIVE FORCES ANALYSIS
    5.4 SUPPLY CHAIN ANALYSIS 
          TABLE 2 POLYESTER FIBER MARKET: COMPANIES AND THEIR ROLE IN ECOSYSTEM
    5.5 PRICING ANALYSIS 
           5.5.1 AVERAGE SELLING PRICE, BY APPLICATION (KEY PLAYERS)
                    FIGURE 19 AVERAGE SELLING PRICE BY KEY PLAYERS FOR TOP THREE APPLICATIONS (USD/KG)
    5.6 AVERAGE SELLING PRICE, BY FORM 
          FIGURE 20 AVERAGE SELLING PRICE BASED ON FORM (USD/KG)
    5.7 AVERAGE SELLING PRICE, BY GRADE 
          FIGURE 21 AVERAGE SELLING PRICE BASED ON GRADE (USD/KG)
    5.8 AVERAGE SELLING PRICE, BY PRODUCT TYPE 
          FIGURE 22 AVERAGE SELLING PRICE BASED ON PRODUCT TYPE (USD/KG)
    5.9 AVERAGE SELLING PRICE, BY REGION 
          TABLE 3 POLYESTER FIBER AVERAGE SELLING PRICE, BY REGION
    5.10 KEY STAKEHOLDERS AND BUY ING CRITERIA 
           5.10.1 KEY STAKEHOLDERS IN BUYING PROCESS
                     FIGURE 23 INFLUENCE OF STAKEHOLDERS ON BUYING PROCESS FOR TOP THREE APPLICATIONS
                     TABLE 4 INFLUENCE OF STAKEHOLDERS ON BUYING PROCESS FOR TOP THREE APPLICATIONS
           5.10.2 BUYING CRITERIA
                     FIGURE 24 KEY BUYING CRITERIA FOR TOP THREE APPLICATIONS
                     TABLE 5 KEY BUYING CRITERIA FOR TOP THREE APPLICATIONS
    5.11 TECHNOLOGY ANALYSIS 
           TABLE 6 COMPARATIVE STUDY OF POLYESTER FIBER PRODUCT TYPE
    5.12 ECOSYSTEM MAPPING 
    5.13 VALUE CHAIN ANALYSIS 
           FIGURE 25 VALUE CHAIN ANALYSIS: POLYESTER FIBER MARKET
    5.14 CASE STUDY ANALYSIS 
    5.15 TRENDS AND DISRUPTIONS IMPACTING CUSTOMER BUSINESS 
    5.16 TRADE ANALYSIS 
           5.16.1 TOP 25 EXPORTING COUNTRIES IN 2022
                     TABLE 7 TOP 25 EXPORTING COUNTRIES IN 2022
           5.16.2 TOP 25 IMPORTING COUNTRIES IN 2022
                     TABLE 8 TOP 25 IMPORTING COUNTRIES IN 2022
    5.17 REGULATORY LANDSCAPE 
           5.17.1 REGULATORY BODIES, GOVERNMENT AGENCIES, AND OTHER ORGANIZATIONS
                     TABLE 9 NORTH AMERICA: REGULATORY BODIES, GOVERNMENT AGENCIES, AND OTHER ORGANIZATIONS
                     TABLE 10 EUROPE: REGULATORY BODIES, GOVERNMENT AGENCIES, AND OTHER ORGANIZATIONS
                     TABLE 11 ASIA PACIFIC: REGULATORY BODIES, GOVERNMENT AGENCIES, AND OTHER ORGANIZATIONS
                     TABLE 12 REST OF THE WORLD: REGULATORY BODIES, GOVERNMENT AGENCIES, AND OTHER ORGANIZATIONS
           5.17.2 STANDARDS IN POLYESTER FIBER MARKET
                     TABLE 13 CURRENT STANDARD CODES FOR POLYESTER FIBER
    5.18 KEY CONFERENCES AND EVENTS 
           TABLE 14 POLYESTER FIBER MARKETS: KEY CONFERENCES AND EVENTS, 2023–2024
    5.19 PATENT ANALYSIS 
           5.19.1 INTRODUCTION
           5.19.2 METHODOLOGY
           5.19.3 DOCUMENT TYPES
                     TABLE 15 POLYESTER FIBER MARKET: GLOBAL PATENT COUNT
                     FIGURE 26 GLOBAL PATENT ANALYSIS, BY DOCUMENT TYPE
                     FIGURE 27 GLOBAL PATENT PUBLICATION TREND, 2017–2022
           5.19.4 INSIGHTS
           5.19.5 LEGAL STATUS
                     FIGURE 28 POLYESTER FIBER MARKET: LEGAL STATUS OF PATENTS
           5.19.6 JURISDICTION ANALYSIS
                     FIGURE 29 GLOBAL JURISDICTION ANALYSIS
           5.19.7 TOP APPLICANTS
                     FIGURE 30 JIANGSU HENGLI CHEMICAL FIBRE CO LTD TO REGISTER HIGHEST PATENT COUNT
           5.19.8 PATENTS BY JIANGSU HENGLI CHEMICAL FIBRE CO LTD
           5.19.9 PATENTS BY HUVIS CORP.
                    5.19.10 PATENTS BY TORAY INDUSTRIES
                    5.19.11 TOP 10 PATENT OWNERS (US) IN LAST 10 YEARS
 
6 POLYESTER FIBER MARKET, BY FORM TYPE (Page No. - 79)
    6.1 INTRODUCTION 
          FIGURE 31 SOLID FORM TO GROW AT HIGHEST CAGR DURING FORECAST PERIOD
          TABLE 16 POLYESTER FIBER MARKET, BY FORM TYPE, 2021–2028 (USD MILLION)
          TABLE 17 POLYESTER FIBER MARKET, BY FORM TYPE, 2021–2028 (KILOTON)
    6.2 SOLID FORM 
           6.2.1 EASE OF RECYCLING TO DRIVE DAMAND
                    FIGURE 32 ASIA PACIFIC TO LEAD SOLID POLYESTER FIBER MARKET
                    TABLE 18 SOLID POLYESTER FIBER MARKET, BY REGION, 2021–2028 (USD MILLION)
                    TABLE 19 SOLID POLYESTER FIBER MARKET, BY REGION, 2021–2028 (KILOTON)
    6.3 HOLLOW FORM 
           6.3.1 CONTINUOUS DEVELOPMENT AND INNOVATION TO DRIVE MARKET
                    TABLE 20 HOLLOW POLYESTER FIBER MARKET, BY REGION, 2021–2028 (USD MILLION)
                    TABLE 21 HOLLOW POLYESTER FIBER MARKET, BY REGION, 2021–2028 (KILOTON)
 
7 POLYESTER FIBER MARKET, BY GRADE (Page No. - 85)
    7.1 INTRODUCTION 
          FIGURE 33 PET GRADE TO LEAD POLYESTER FIBER MARKET DURING FORECAST PERIOD
          TABLE 22 POLYESTER FIBER MARKET, BY GRADE, 2021–2028 (USD MILLION)
          TABLE 23 POLYESTER FIBER MARKET, BY GRADE, 2021–2028 (KILOTON)
    7.2 PET POLYESTER GRADE 
           7.2.1 RECYCLABILITY OF PET TO DRIVE THE MARKET FOR PET POLYESTER GRADE
                    FIGURE 34 ASIA PACIFIC TO LEAD PET POLYESTER FIBER MARKET
                    TABLE 24 PET POLYESTER FIBER MARKET, BY REGION, 2021–2028 (USD MILLION)
                    TABLE 25 PET POLYESTER FIBER MARKET, BY REGION, 2021–2028 (KILOTON)
    7.3 PCDT POLYESTER GRADE 
           7.3.1 CONTINUOUS DEVELOPMENT AND INNOVATION TO DRIVE MARKET
                    TABLE 26 PCDT POLYESTER FIBER MARKET, BY REGION, 2021–2028 (USD MILLION)
                    TABLE 27 PCDT POLYESTER FIBER MARKET, BY REGION, 2021–2028 (KILOTON)
 
8 POLYESTER FIBER MARKET, BY PRODUCT TYPE (Page No. - 90)
    8.1 INTRODUCTION 
          FIGURE 35 POLYESTER FILAMENT YARN TO WITNESS HIGHEST CAGR DURING FORECAST PERIOD
          TABLE 28 POLYESTER FIBER MARKET, BY PRODUCT TYPE, 2021–2028 (USD MILLION)
          TABLE 29 POLYESTER FIBER MARKET, BY PRODUCT TYPE, 2021–2028 (KILOTON)
    8.2 POLYESTER FILAMENT YARN 
           8.2.1 EXTENSIVE USE IN TEXTILE INDUSTRY DUE TO STRENGTH, DURABILITY, AND EXCEPTIONAL COLORFASTNESS TO DRIVE MARKET
                    FIGURE 36 ASIA PACIFIC TO LEAD POLYESTER FILAMENT YARN MARKET
                    TABLE 30 POLYESTER FILAMENT YARN: POLYESTER FIBER MARKET, BY REGION, 2021–2028 (USD MILLION)
                    TABLE 31 POLYESTER FILAMENT YARN: POLYESTER FIBER MARKET, BY REGION, 2021–2028 (KILOTON)
    8.3 POLYESTER STAPLE FIBER 
           8.3.1 DEMAND FOR ELEVATING TEXTILE EXCELLENCE TO DRIVE MARKET
                    TABLE 32 POLYESTER STAPLE FIBER: POLYESTER FIBER MARKET, REGION, 2021–2028 (USD MILLION)
                    TABLE 33 POLYESTER STAPLE FIBER: POLYESTER FIBER MARKET, REGION, 2021–2028 (KILOTON)
 
9 POLYESTER FIBER MARKET, BY APPLICATION (Page No. - 95)
    9.1 INTRODUCTION 
          FIGURE 37 TEXTILE & APPAREL SEGMENT TO REGISTER HIGHEST CAGR DURING FORECAST PERIOD
          TABLE 34 POLYESTER FIBER MARKET, BY APPLICATION, 2021–2028 (USD MILLION)
          TABLE 35 POLYESTER FIBER MARKET, BY APPLICATION, 2021–2028 (KILOTON)
    9.2 TEXTILE & APPAREL 
           9.2.1 HIGH DEMAND FOR TEXTILE GOODS TO DRIVE MARKET
                    FIGURE 38 ASIA PACIFIC TO BE LARGEST MARKET FOR TEXTILE AND APPAREL SEGMENT
                    TABLE 36 TEXTILE & APPAREL: POLYESTER FIBER MARKET, BY REGION, 2021–2028 (USD MILLION)
                    TABLE 37 TEXTILE & APPAREL: POLYESTER FIBER MARKET, BY REGION, 2021–2028 (KILOTON)
    9.3 HOME FURNISHING 
           9.3.1 RISING DEMAND FOR COMFORTABLE AND STYLISH HOME FURNISHINGS TO DRIVE DEMAND
                    TABLE 38 HOME FURNISHING: POLYESTER FIBER MARKET, BY REGION, 2021–2028 (USD MILLION)
                    TABLE 39 HOME FURNISHING: POLYESTER FIBER MARKET, BY REGION, 2021–2028 (KILOTON)
    9.4 AUTOMOTIVE & TRANSPORTATION 
           9.4.1 SUNLIGHT AND CHEMICAL RESISTANCE OF POLYESTER FIBERS TO DRIVE DEMAND
                    TABLE 40 AUTOMOTIVE & TRANSPORTATION: POLYESTER FIBER MARKET, BY REGION, 2021–2028 (USD MILLION)
                    TABLE 41 AUTOMOTIVE & TRANSPORTATION: POLYESTER FIBER MARKET, BY REGION, 2021–2028 (KILOTON)
    9.5 INDUSTRIAL 
           9.5.1 STRENGTH AND DURABILITY OF POLYESTER FIBER TO DRIVE MARKET
                    TABLE 42 INDUSTRIAL: POLYESTER FIBER MARKET, BY REGION, 2021–2028 (USD MILLION)
                    TABLE 43 INDUSTRIAL: POLYESTER FIBER MARKET, BY REGION, 2021–2028 (KILOTON)
    9.6 OTHERS 
          TABLE 44 OTHER APPLICATIONS: POLYESTER FIBER MARKET, BY REGION, 2021–2028 (USD MILLION)
          TABLE 45 OTHER APPLICATIONS: POLYESTER FIBER MARKET, BY REGION, 2021–2028 (KILOTON)
 
10 POLYESTER FIBER MARKET, BY REGION (Page No. - 103)
     10.1 INTRODUCTION 
             FIGURE 39 CHINA TO BE FASTEST-GROWING POLYESTER FIBER MARKET DURING FORECAST PERIOD
             10.1.1 POLYESTER FIBER MARKET, BY REGION
                        TABLE 46 POLYESTER FIBER MARKET, BY REGION, 2021–2028 (USD MILLION)
                        TABLE 47 POLYESTER FIBER MARKET, BY REGION, 2021–2028 (KILOTON)
     10.2 ASIA PACIFIC 
             10.2.1 RECESSION IMPACT
                        FIGURE 40 ASIA PACIFIC: POLYESTER FIBER MARKET SNAPSHOT
             10.2.2 ASIA PACIFIC: POLYESTER FIBER MARKET, BY FORM
                        TABLE 48 ASIA PACIFIC: POLYESTER FIBER MARKET, BY FORM, 2021–2028 (USD MILLION)
                        TABLE 49 ASIA PACIFIC: POLYESTER FIBER MARKET, BY FORM, 2021–2028 (KILOTON)
             10.2.3 ASIA PACIFIC: POLYESTER FIBER MARKET, BY GRADE
                        TABLE 50 ASIA PACIFIC: POLYESTER FIBER MARKET, BY GRADE, 2021–2028 (USD MILLION)
                        TABLE 51 ASIA PACIFIC: POLYESTER FIBER MARKET, BY GRADE, 2021–2028 (KILOTON)
             10.2.4 ASIA PACIFIC: POLYESTER FIBER MARKET, BY PRODUCT TYPE
                        TABLE 52 ASIA PACIFIC: POLYESTER FIBER MARKET, BY PRODUCT TYPE, 2021–2028 (USD MILLION)
                        TABLE 53 ASIA PACIFIC: POLYESTER FIBER MARKET, BY PRODUCT TYPE, 2021–2028 (KILOTON)
             10.2.5 ASIA PACIFIC: POLYESTER FIBER MARKET, BY APPLICATION
                        TABLE 54 ASIA PACIFIC: POLYESTER FIBER MARKET, BY APPLICATION, 2021–2028 (USD MILLION)
                        TABLE 55 ASIA PACIFIC: POLYESTER FIBER MARKET, BY APPLICATION, 2021–2028 (KILOTON)
             10.2.6 ASIA PACIFIC: POLYESTER FIBER MARKET, BY COUNTRY
                        TABLE 56 ASIA PACIFIC: POLYESTER FIBER MARKET, BY COUNTRY, 2021–2028 (USD MILLION)
                        TABLE 57 ASIA PACIFIC: POLYESTER FIBER MARKET, BY COUNTRY, 2021–2028 (KILOTON)
                        10.2.6.1 China
                                     10.2.6.1.1 Increased consumer spending on clothing, textiles, and home furnishings to drive market
                                     10.2.6.1.2 China: Polyester fiber market, by application
                                                      TABLE 58 CHINA: POLYESTER FIBER MARKET, BY APPLICATION, 2021–2028 (USD MILLION)
                                                      TABLE 59 CHINA: POLYESTER FIBER MARKET, BY APPLICATION, 2021–2028 (KILOTON)
                        10.2.6.2 Japan
                                     10.2.6.2.1 Expanding textile and apparel sector to drive market
                                     10.2.6.2.2 Japan: Polyester fiber market, by application
                                                      TABLE 60 JAPAN: POLYESTER FIBER MARKET, BY APPLICATION, 2021–2028 (USD MILLION)
                                                      TABLE 61 JAPAN: POLYESTER FIBER MARKET, BY APPLICATION, 2021–2028 (KILOTON)
                        10.2.6.3 India
                                     10.2.6.3.1 Rapid expansion of domestic polyester fiber industry to drive market
                                     10.2.6.3.2 India: Polyester fiber market, by application
                                                      TABLE 62 INDIA: POLYESTER FIBER MARKET, BY APPLICATION, 2021–2028 (USD MILLION)
                                                      TABLE 63 INDIA: POLYESTER FIBER MARKET, BY APPLICATION, 2021–2028 (KILOTON)
                        10.2.6.4 South Korea
                                     10.2.6.4.1 Growing use of polyester fiber in textile industry to drive market
                                     10.2.6.4.2 South Korea: Polyester fiber market, by application
                                                      TABLE 64 SOUTH KOREA: POLYESTER FIBER MARKET, BY APPLICATION, 2021–2028 (USD MILLION)
                                                      TABLE 65 SOUTH KOREA: POLYESTER FIBER MARKET, BY APPLICATION, 2021–2028 (KILOTON)
                        10.2.6.5 Australia
                                     10.2.6.5.1 Growing demand for sustainable textile & apparel sector to drive market
                                     10.2.6.5.2 Australia: Polyester fiber market, by application
                                                      TABLE 66 AUSTRALIA: POLYESTER FIBER MARKET, BY APPLICATION, 2021–2028 (USD MILLION)
                                                      TABLE 67 AUSTRALIA: POLYESTER FIBER MARKET, BY APPLICATION, 2021–2028 (KILOTON)
                        10.2.6.6 Rest of Asia Pacific
                                     10.2.6.6.1 Rest of Asia Pacific: Polyester fiber market, by application
                                                      TABLE 68 REST OF ASIA PACIFIC: POLYESTER FIBER MARKET, BY APPLICATION, 2021–2028 (USD MILLION)
                                                      TABLE 69 REST OF ASIA PACIFIC: POLYESTER FIBER MARKET, BY APPLICATION, 2021–2028 (KILOTON)
     10.3 NORTH AMERICA 
             10.3.1 RECESSION IMPACT
                        FIGURE 41 NORTH AMERICA: POLYESTER FIBER MARKET SNAPSHOT
             10.3.2 NORTH AMERICA: POLYESTER FIBER MARKET, BY FORM
                        TABLE 70 NORTH AMERICA: POLYESTER FIBER MARKET, BY FORM, 2021–2028 (USD MILLION)
                        TABLE 71 NORTH AMERICA: POLYESTER FIBER MARKET, BY FORM, 2021–2028 (KILOTON)
             10.3.3 NORTH AMERICA: POLYESTER FIBER MARKET, BY GRADE
                        TABLE 72 NORTH AMERICA: POLYESTER FIBER MARKET, BY GRADE, 2021–2028 (USD MILLION)
                        TABLE 73 NORTH AMERICA: POLYESTER FIBER MARKET, BY GRADE, 2021–2028 (KILOTON)
             10.3.4 NORTH AMERICA: POLYESTER FIBER MARKET, BY PRODUCT TYPE
                        TABLE 74 NORTH AMERICA: POLYESTER FIBER MARKET, BY PRODUCT TYPE, 2021–2028 (USD MILLION)
                        TABLE 75 NORTH AMERICA: POLYESTER FIBER MARKET, BY PRODUCT TYPE, 2021–2028 (KILOTON)
             10.3.5 NORTH AMERICA: POLYESTER FIBER MARKET, BY APPLICATION
                        TABLE 76 NORTH AMERICA: POLYESTER FIBER MARKET, BY APPLICATION, 2021–2028 (USD MILLION)
                        TABLE 77 NORTH AMERICA: POLYESTER FIBER MARKET, BY APPLICATION, 2021–2028 (KILOTON)
             10.3.6 NORTH AMERICA: POLYESTER FIBER MARKET, BY COUNTRY
                        TABLE 78 NORTH AMERICA: POLYESTER FIBER MARKET, BY COUNTRY, 2021–2028 (USD MILLION)
                        TABLE 79 NORTH AMERICA: POLYESTER FIBER MARKET, BY COUNTRY, 2021–2028 (KILOTON)
                        10.3.6.1 US
                                     10.3.6.1.1 High demand from textile & apparel, automotive, and industrial applications
                                     10.3.6.1.2 US: Polyester fiber market, by application
                                                      TABLE 80 US: POLYESTER FIBER MARKET, BY APPLICATION, 2021–2028 (USD MILLION)
                                                      TABLE 81 US: POLYESTER FIBER MARKET, BY APPLICATION, 2021–2028 (KILOTON)
                        10.3.6.2 Canada
                                     10.3.6.2.1 Increasing demand from textile & apparel industry to drive market
                                     10.3.6.2.2 Canada: Polyester fiber market, by application
                                                      TABLE 82 CANADA: POLYESTER FIBER MARKET, BY APPLICATION, 2021–2028 (USD MILLION)
                                                      TABLE 83 CANADA: POLYESTER FIBER MARKET, BY APPLICATION, 2021–2028 (KILOTON)
     10.4 EUROPE 
             10.4.1 RECESSION IMPACT
                        FIGURE 42 EUROPE: POLYESTER FIBER MARKET SNAPSHOT
             10.4.2 EUROPE: POLYESTER FIBER MARKET, BY FORM
                        TABLE 84 EUROPE: POLYESTER FIBER MARKET, BY FORM, 2021–2028 (USD MILLION)
                        TABLE 85 EUROPE: POLYESTER FIBER MARKET, BY FORM, 2021–2028 (KILOTON)
             10.4.3 EUROPE: POLYESTER FIBER MARKET, BY GRADE
                        TABLE 86 EUROPE: POLYESTER FIBER MARKET, BY GRADE, 2021–2028 (USD MILLION)
                        TABLE 87 EUROPE: POLYESTER FIBER MARKET, BY GRADE, 2021–2028 (KILOTON)
             10.4.4 EUROPE: POLYESTER FIBER MARKET, BY PRODUCT TYPE
                        TABLE 88 EUROPE: POLYESTER FIBER MARKET, BY PRODUCT TYPE, 2021–2028 (USD MILLION)
                        TABLE 89 EUROPE: POLYESTER FIBER MARKET, BY PRODUCT TYPE, 2021–2028 (KILOTON)
             10.4.5 EUROPE: POLYESTER FIBER MARKET, BY APPLICATION
                        TABLE 90 EUROPE: POLYESTER FIBER MARKET, BY APPLICATION, 2021–2028 (USD MILLION)
                        TABLE 91 EUROPE: POLYESTER FIBER MARKET, BY APPLICATION, 2021–2028 (KILOTON)
             10.4.6 EUROPE: POLYESTER FIBER MARKET, BY COUNTRY
                        TABLE 92 EUROPE: POLYESTER FIBER MARKET, BY COUNTRY, 2021–2028 (USD MILLION)
                        TABLE 93 EUROPE: POLYESTER FIBER MARKET, BY COUNTRY, 2021–2028 (KILOTON)
                        10.4.6.1 Germany
                                     10.4.6.1.1 Growing automotive and textile industry to drive market
                                     10.4.6.1.2 Germany: Polyester fiber market, by application
                                                      TABLE 94 GERMANY: POLYESTER FIBER MARKET, BY APPLICATION, 2021–2028 (USD MILLION)
                                                      TABLE 95 GERMANY: POLYESTER FIBER MARKET, BY APPLICATION, 2021–2028 (KILOTON)
                        10.4.6.2 UK
                                     10.4.6.2.1 Adaptability, durability, and cost-effectiveness features to drive market
                                     10.4.6.2.2 UK: Polyester fiber market, by application
                                                      TABLE 96 UK: POLYESTER FIBER MARKET, BY APPLICATION, 2021–2028 (USD MILLION)
                                                      TABLE 97 UK: POLYESTER FIBER MARKET, BY APPLICATION, 2021–2028 (KILOTON)
                        10.4.6.3 Italy
                                     10.4.6.3.1 Durability, affordability, and adaptability features to drive market
                                     10.4.6.3.2 Italy: Polyester fiber market, by application
                                                      TABLE 98 ITALY: POLYESTER FIBER MARKET, BY APPLICATION, 2021–2028 (USD MILLION)
                                                      TABLE 99 ITALY: POLYESTER FIBER MARKET, BY APPLICATION, 2021–2028 (KILOTON)
                        10.4.6.4 France
                                     10.4.6.4.1 Growing textile and fashion industry to drive market
                                     10.4.6.4.2 France: Polyester fiber market, by application
                                                      TABLE 100 FRANCE: POLYESTER FIBER MARKET, BY APPLICATION, 2021–2028 (USD MILLION)
                                                      TABLE 101 FRANCE: POLYESTER FIBER MARKET, BY APPLICATION, 2021–2028 (KILOTON)
                        10.4.6.5 SPAIN
                                     10.4.6.5.1 Growing textile and automotive industry to drive market
                                     10.4.6.5.2 Spain: Polyester fiber market, by application
                                                      TABLE 102 SPAIN: POLYESTER FIBER MARKET, BY APPLICATION, 2021–2028 (USD MILLION)
                                                      TABLE 103 SPAIN: POLYESTER FIBER MARKET, BY APPLICATION, 2021–2028 (KILOTON)
                        10.4.6.6 Russia
                                     10.4.6.6.1 Resistance to wrinkles and vibrant color retention properties to drive market
                                     10.4.6.6.2 Russia: Polyester fiber market, by application
                                                      TABLE 104 RUSSIA: POLYESTER FIBER MARKET, BY APPLICATION, 2021–2028 (USD MILLION)
                                                      TABLE 105 RUSSIA: POLYESTER FIBER MARKET, BY APPLICATION, 2021–2028 (KILOTON)
                        10.4.6.7 Rest of Europe
                                     10.4.6.7.1 Rest of Europe: Polyester fiber market, by application
                                                      TABLE 106 REST OF EUROPE: POLYESTER FIBER MARKET, BY APPLICATION, 2021–2028 (USD MILLION)
                                                      TABLE 107 REST OF EUROPE: POLYESTER FIBER MARKET, BY APPLICATION, 2021–2028 (KILOTON)
     10.5 MIDDLE EAST & AFRICA 
             10.5.1 RECESSION IMPACT
             10.5.2 MIDDLE EAST & AFRICA: POLYESTER FIBER MARKET, BY FORM
                        TABLE 108 MIDDLE EAST & AFRICA: POLYESTER FIBER MARKET, BY FORM, 2021–2028 (USD MILLION)
                        TABLE 109 MIDDLE EAST & AFRICA: POLYESTER FIBER MARKET, BY FORM, 2021–2028 (KILOTON)
             10.5.3 MIDDLE EAST & AFRICA: POLYESTER FIBER MARKET, BY GRADE
                        TABLE 110 MIDDLE EAST & AFRICA: POLYESTER FIBER MARKET, BY GRADE, 2021–2028 (USD MILLION)
                        TABLE 111 MIDDLE EAST & AFRICA: POLYESTER FIBER MARKET, BY GRADE, 2021–2028 (KILOTON)
             10.5.4 MIDDLE EAST & AFRICA: POLYESTER FIBER MARKET, BY PRODUCT TYPE
                        TABLE 112 MIDDLE EAST & AFRICA: POLYESTER FIBER MARKET, BY PRODUCT TYPE, 2021–2028 (USD MILLION)
                        TABLE 113 MIDDLE EAST & AFRICA: POLYESTER FIBER MARKET, BY PRODUCT TYPE, 2021–2028 (KILOTON)
             10.5.5 MIDDLE EAST & AFRICA: POLYESTER FIBER MARKET, BY APPLICATION
                        TABLE 114 MIDDLE EAST & AFRICA: POLYESTER FIBER MARKET, BY APPLICATION, 2021–2028 (USD MILLION)
                        TABLE 115 MIDDLE EAST & AFRICA: POLYESTER FIBER MARKET, BY APPLICATION, 2021–2028 (KILOTON)
             10.5.6 MIDDLE EAST & AFRICA: POLYESTER FIBER MARKET, BY COUNTRY
                        TABLE 116 MIDDLE EAST & AFRICA: POLYESTER FIBER MARKET, BY COUNTRY, 2021–2028 (USD MILLION)
                        TABLE 117 MIDDLE EAST & AFRICA: POLYESTER FIBER MARKET, BY COUNTRY, 2021–2028 (KILOTON)
                        10.5.6.1 Saudi Arabia
                                     10.5.6.1.1 Growing automotive industry to drive market
                                     10.5.6.1.2 Saudi Arabia: Polyester fiber market, by application
                                                      TABLE 118 SAUDI ARABIA: POLYESTER FIBER MARKET, BY APPLICATION, 2021–2028 (USD MILLION)
                                                      TABLE 119 SAUDI ARABIA: POLYESTER FIBER MARKET, BY APPLICATION, 2021–2028 (KILOTON)
                        10.5.6.2 South Africa
                                     10.5.6.2.1 Growing population and economy to drive market
                                     10.5.6.2.2 South Africa: Polyester fiber market, by application
                                                      TABLE 120 SOUTH AFRICA: POLYESTER FIBER MARKET, BY APPLICATION, 2021–2028 (USD MILLION)
                                                      TABLE 121 SOUTH AFRICA: POLYESTER FIBER MARKET, BY APPLICATION, 2021–2028 (KILOTON)
                        10.5.6.3 Iran
                                     10.5.6.3.1 Diverse range of packaging alternatives for various industrial sectors to drive market
                                     10.5.6.3.2 Iran: Polyester fiber market, by application
                                                      TABLE 122 IRAN: POLYESTER FIBER MARKET, BY APPLICATION, 2021–2028 (USD MILLION)
                                                      TABLE 123 IRAN: POLYESTER FIBER MARKET, BY APPLICATION, 2021–2028 (KILOTON)
                        10.5.6.4 Rest of Middle East & Africa
                                     10.5.6.4.1 Rest of Middle East & Africa: Polyester fiber market, by application
                                                      TABLE 124 REST OF MIDDLE EAST & AFRICA: POLYESTER FIBER MARKET, BY APPLICATION, 2021–2028 (USD MILLION)
                                                      TABLE 125 REST OF MIDDLE EAST & AFRICA: POLYESTER FIBER MARKET, BY APPLICATION, 2021–2028 (KILOTON)
     10.6 LATIN AMERICA 
             10.6.1 RECESSION IMPACT
             10.6.2 LATIN AMERICA: POLYESTER FIBER MARKET, BY FORM
                        TABLE 126 LATIN AMERICA: POLYESTER FIBER MARKET, BY FORM, 2021–2028 (USD MILLION)
                        TABLE 127 LATIN AMERICA: POLYESTER FIBER MARKET, BY FORM, 2021–2028 (KILOTON)
             10.6.3 LATIN AMERICA: POLYESTER FIBER MARKET, BY GRADE
                        TABLE 128 LATIN AMERICA: POLYESTER FIBER MARKET, BY GRADE, 2021–2028 (USD MILLION)
                        TABLE 129 LATIN AMERICA: POLYESTER FIBER MARKET, BY GRADE, 2021–2028 (KILOTON)
             10.6.4 LATIN AMERICA: POLYESTER FIBER MARKET, BY PRODUCT TYPE
                        TABLE 130 LATIN AMERICA: POLYESTER FIBER MARKET, BY PRODUCT TYPE, 2021–2028 (USD MILLION)
                        TABLE 131 LATIN AMERICA: POLYESTER FIBER MARKET, BY PRODUCT TYPE, 2021–2028 (KILOTON)
             10.6.5 LATIN AMERICA: POLYESTER FIBER MARKET, BY APPLICATION
                        TABLE 132 LATIN AMERICA: POLYESTER FIBER MARKET, BY APPLICATION, 2021–2028 (USD MILLION)
                        TABLE 133 LATIN AMERICA: POLYESTER FIBER MARKET, BY APPLICATION, 2021–2028 (KILOTON)
             10.6.6 LATIN AMERICA: POLYESTER FIBER MARKET, BY COUNTRY
                        TABLE 134 LATIN AMERICA: POLYESTER FIBER MARKET, BY COUNTRY, 2021–2028 (USD MILLION)
                        TABLE 135 LATIN AMERICA: POLYESTER FIBER MARKET SIZE, BY COUNTRY, 2021–2028 (KILOTON)
                        10.6.6.1 Mexico
                                     10.6.6.1.1 Growing use of polyester fibers in geotextiles and roofing materials to drive market
                                     10.6.6.1.2 Mexico: Polyester fiber market, by application
                                                      TABLE 136 MEXICO: POLYESTER FIBER MARKET, BY APPLICATION, 2021–2028 (USD MILLION)
                                                      TABLE 137 MEXICO: POLYESTER FIBER MARKET, BY APPLICATION, 2021–2028 (KILOTON)
                        10.6.6.2 Brazil
                                     10.6.6.2.1 Growing tourism sector to drive market
                                     10.6.6.2.2 Brazil: Polyester fiber market, by application
                                                      TABLE 138 BRAZIL: POLYESTER FIBER MARKET, BY APPLICATION, 2021–2028 (USD MILLION)
                                                      TABLE 139 BRAZIL: POLYESTER FIBER MARKET, BY APPLICATION, 2021–2028 (KILOTON)
                        10.6.6.3 Rest of Latin America
                                     10.6.6.3.1 Rest of Latin America: Polyester fiber market, by application
                                                      TABLE 140 REST OF LATIN AMERICA: POLYESTER FIBER MARKET, BY APPLICATION, 2021–2028 (USD MILLION)
                                                      TABLE 141 REST OF LATIN AMERICA: POLYESTER FIBER MARKET, BY APPLICATION, 2021–2028 (KILOTON)
 
11 COMPETITIVE LANDSCAPE (Page No. - 155)
     11.1 KEY PLAYER STRATEGIES 
             TABLE 142 OVERVIEW OF STRATEGIES ADOPTED BY KEY PLAYERS
     11.2 REVENUE ANALYSIS 
     11.3 MARKET SHARE ANALYSIS 
             FIGURE 43 SHARES OF TOP COMPANIES IN POLYESTER FIBER MARKET
             TABLE 143 DEGREE OF COMPETITION: POLYESTER FIBER MARKET
     11.4 COMPANY EVALUATION MATRIX 
             11.4.1 STARS
             11.4.2 EMERGING LEADERS
             11.4.3 PERVASIVE PLAYERS
             11.4.4 PARTICIPANTS
                        FIGURE 44 POLYESTER FIBER MARKET (GLOBAL): COMPANY EVALUATION MATRIX, 2022
             11.4.5 COMPANY FOOTPRINT
                        TABLE 144 COMPANY PRODUCT FOOTPRINT
                        TABLE 145 COMPANY FORM FOOTPRINT
                        TABLE 146 COMPANY GRADE FOOTPRINT
                        TABLE 147 COMPANY PRODUCT TYPE FOOTPRINT
                        TABLE 148 COMPANY APPLICATION FOOTPRINT
                        TABLE 149 COMPANY REGION FOOTPRINT
     11.5 START-UP/SME EVALUATION MATRIX 
             11.5.1 PROGRESSIVE COMPANIES
             11.5.2 RESPONSIVE COMPANIES
             11.5.3 DYNAMIC COMPANIES
             11.5.4 STARTING BLOCKS
                        FIGURE 45 POLYESTER FIBER MARKET: START-UP/SME EVALUATION MATRIX, 2022
             11.5.5 COMPETITIVE BENCHMARKING
                        TABLE 150 POLYESTER FIBER MARKET: KEY START-UPS/SMES
                        TABLE 151 POLYESTER FIBER MARKET: COMPETITIVE BENCHMARKING OF KEY START-UPS/SMES
     11.6 COMPETITIVE SCENARIO AND TRENDS 
             TABLE 152 POLYESTER FIBER MARKET: DEALS, 2018–2023
             TABLE 153 POLYESTER FIBER MARKET: OTHERS, 2018–2023
 
12 COMPANY PROFILES (Page No. - 172)
(Business Overview, Products/Solutions/Services Offered, Recent Developments, MnM view (Key strengths/Right to win, Strategic choices made, Weakness/competitive threats)*
     12.1 KEY COMPANIES 
             12.1.1 RELIANCE INDUSTRIES LIMITED
                        TABLE 154 RELIANCE INDUSTRIES LIMITED: COMPANY OVERVIEW
                        FIGURE 46 RELIANCE INDUSTRIES LIMITED: COMPANY SNAPSHOT
                        TABLE 155 RELIANCE INDUSTRIES LIMITED: DEALS
             12.1.2 INDORAMA VENTURES PUBLIC COMPANY LIMITED
                        TABLE 156 INDORAMA VENTURES PUBLIC COMPANY LIMITED: COMPANY OVERVIEW
                        FIGURE 47 INDORAMA VENTURES PUBLIC COMPANY LIMITED: COMPANY SNAPSHOT
                        TABLE 157 INDORAMA VENTURES PUBLIC COMPANY LIMITED: DEALS
             12.1.3 THE BOMBAY DYEING AND MANUFACTURING COMPANY LIMITED
                        TABLE 158 THE BOMBAY DYEING AND MANUFACTURING COMPANY LIMITED: COMPANY OVERVIEW
                        FIGURE 48 THE BOMBAY DYEING AND MANUFACTURING COMPANY LIMITED: COMPANY SNAPSHOT
             12.1.4 BARNET
                        TABLE 159 BARNET: COMPANY OVERVIEW
                        TABLE 160 BARNET: OTHERS
             12.1.5 VNPOLYFIBER (VIETNAM POLYESTER STAPLE FIBER)
                        TABLE 161 VNPOLYFIBER (VIETNAM POLYESTER STAPLE FIBER): COMPANY OVERVIEW
             12.1.6 SARLA PERFORMANCE FIBERS LIMITED
                        TABLE 162 SARLA PERFORMANCE FIBERS LIMITED: COMPANY OVERVIEW
                        FIGURE 49 SARLA PERFORMANCE FIBERS LIMITED: COMPANY SNAPSHOT
                        TABLE 163 SARLA PERFORMANCE FIBERS LIMITED: OTHER DEALS
             12.1.7 MÄRKISCHE FASER GMBH
                        TABLE 164 MÄRKISCHE FASER GMBH: COMPANY OVERVIEW
                        TABLE 165 MÄRKISCHE FASER GMBH: DEALS
             12.1.8 EASTMAN CHEMICAL COMPANY
                        TABLE 166 EASTMAN CHEMICAL COMPANY: COMPANY OVERVIEW
                        FIGURE 50 EASTMAN CHEMICAL COMPANY: COMPANY SNAPSHOT
                        TABLE 167 EASTMAN CHEMICAL COMPANY: DEALS
                        TABLE 168 EASTMAN CHEMICAL COMPANY: OTHER DEALS
             12.1.9 TORAY INDUSTRIES INC.
                        TABLE 169 TORAY INDUSTRIES INC.: COMPANY OVERVIEW
                        FIGURE 51 TORAY INDUSTRIES INC.: COMPANY SNAPSHOT
                        TABLE 170 TORAY INDUSTRIES INC.: OTHER DEALS
             12.1.10 STEIN FIBERS LTD.
                        TABLE 171 STEIN FIBERS LTD.: COMPANY OVERVIEW
                        TABLE 172 STEIN FIBERS LTD.: DEALS
             12.1.11 GREEN GROUP S.A.
                        TABLE 173 GREEN GROUP S.A.: COMPANY OVERVIEW
                        TABLE 174 GREEN GROUP S.A.: DEALS
                        TABLE 175 GREEN GROUP S.A.: OTHER DEALS
             12.1.12 KAYAVLON IMPEX PVT. LTD.
                        TABLE 176 KAYAVLON IMPEX PVT. LTD.: COMPANY OVERVIEW
             12.1.13 DIYOU FIBER (M) SDN BHD.
                        TABLE 177 DIYOU FIBER (M) SDN BHD.: COMPANY OVERVIEW
             12.1.14 SWICOFIL AG
                        TABLE 178 SWICOFIL AG: COMPANY OVERVIEW
             12.1.15 SINOPEC YIZHENG CHEMICAL FIBER LIMITED LIABILITY COMPANY
                        TABLE 179 SINOPEC YIZHENG CHEMICAL FIBER LIMITED LIABILITY COMPANY: COMPANY OVERVIEW
                        FIGURE 52 SINOPEC YIZHENG CHEMICAL FIBER LIMITED LIABILITY COMPANY: COMPANY SNAPSHOT
                        TABLE 180 SINOPEC YIZHENG CHEMICAL FIBER LIMITED LIABILITY COMPANY: PRODUCT DEVELOPMENTS
             12.1.16 ALPEK S.A.B. DE C.V.
                        TABLE 181 ALPEK S.A.B. DE C.V.: COMPANY OVERVIEW
                        FIGURE 53 ALPEK S.A.B. DE C.V.: COMPANY SNAPSHOT
                        TABLE 182 ALPEK S.A.B. DE C.V.: DEALS
                        TABLE 183 ALPEK S.A.B. DE C.V.: OTHER DEALS
             12.1.17 ZHEJIANG HENGYI GROUP CO., LTD.
                        TABLE 184 ZHEJIANG HENGYI GROUP CO., LTD.: COMPANY OVERVIEW
                        TABLE 185 ZHEJIANG HENGYI GROUP CO., LTD.: PRODUCT DEVELOPMENTS
                        TABLE 186 ZHEJIANG HENGYI GROUP CO., LTD.: DEALS
                        TABLE 187 ZHEJIANG HENGYI GROUP CO., LTD.: OTHER DEALS
             12.1.18 JIANGNAN TEXTILE (SHANGHAI) CO., LTD.
                        TABLE 188 JIANGNAN TEXTILE (SHANGHAI) CO., LTD.: COMPANY OVERVIEW
             12.1.19 DONGGUAN YUEXIN INDUSTRIAL CO., LTD.
                        TABLE 189 DONGGUAN YUEXIN INDUSTRIAL CO., LTD.: COMPANY OVERVIEW
             12.1.20 XIAMEI (GUANGZHOU) SYNTHETIC FIBER CO., LTD.
                        TABLE 190 XIAMEI (GUANGZHOU) SYNTHETIC FIBER CO., LTD.: COMPANY OVERVIEW
 
*Details on Business Overview, Products/Solutions/Services Offered, Recent Developments, MnM view (Key strengths/Right to win, Strategic choices made, Weakness/competitive threats)* might not be captured in case of unlisted companies.
 
13 APPENDIX (Page No. - 236)
     13.1 DISCUSSION GUIDE 
     13.2 KNOWLEDGESTORE: MARKETSANDMARKETS' SUBSCRIPTION PORTAL 
     13.3 CUSTOMIZATION OPTIONS 
     13.4 RELATED REPORTS 
     13.5 AUTHOR DETAILS 

The study involved two major activities in estimating the current size of the polyester fiber market. Exhaustive secondary research was carried out to collect information on the market, peer markets, and the parent market. The next step was to validate the findings obtained from secondary sources, assumptions, and sizing with industry experts across the value chain through primary research. Both the top-down and bottom-up approaches were employed to estimate the total market size. After that, the market breakdown and data triangulation procedures were used to estimate the market size of segments and subsegments.

Secondary Research

Secondary sources referred to for this research study include financial statements of companies offering polyester fiber and information from various trade, business, and professional associations. Secondary research has been used to obtain critical information about the industry’s value chain, the total pool of key players, market classification, and segmentation according to industry trends to the bottom-most level and regional markets. The secondary data was collected and analyzed to arrive at the overall size of the polyester fiber market, which was validated by primary respondents.

Primary Research

Extensive primary research was conducted after obtaining information regarding the polyester fiber market scenario through secondary research. Several primary interviews were conducted with market experts from both the demand and supply sides across major countries of North America, Europe, Asia Pacific, the Middle East & Africa, and Latin America. Primary data was collected through questionnaires, emails, and telephonic interviews. The primary sources from the supply side included various industry experts, such as Chief X Officers (CXOs), Vice Presidents (VPs), Directors from business development, marketing, product development/innovation teams, and related key executives from polyester fiber industry vendors; system integrators; component providers; distributors; and key opinion leaders. Primary interviews were conducted to gather insights such as market statistics, data on revenue collected from the products and services, market breakdowns, market size estimations, market forecasting, and data triangulation. Primary research also helped in understanding the various trends related to technology, application, vertical, and region. Stakeholders from the demand side, such as CIOs, CTOs, CSOs, and installation teams of the customer/end users who are using the polyester fiber  industry, were interviewed to understand the buyer’s perspective on the suppliers, products, component providers, and their current usage of polyester fiber and future outlook of their business which will affect the overall market.

The Breakup of Primary Research:

Polyester Fiber Market Size, and Share

Note: Companies are classified based on their revenues, product portfolios, and geographical presence.

To know about the assumptions considered for the study, download the pdf brochure

Market Size Estimation:

The research methodology used to estimate the size of the polyester fiber market includes the following details. The market sizing of the market was undertaken from the demand side. The market was upsized based on procurements and modernizations of polyester fiber in different applications at a regional level. Such procurements provide information on the demand aspects of the polyester fiber industry for each application. For each application, all possible segments of the polyester fiber market were integrated and mapped.

Polyester fiber Market Size: Botton Up Approach

Polyester Fiber Market Size, and Share

To know about the assumptions considered for the study, Request for Free Sample Report

Polyester fiber Market Size: Top Down Approach

Polyester Fiber Market Size, and Share

Data Triangulation:

After arriving at the overall size from the market size estimation process explained above, the total market was split into several segments and subsegments. The data triangulation and market breakdown procedures explained below were implemented, wherever applicable, to complete the overall market engineering process and arrive at the exact statistics for various market segments and subsegments. The data was triangulated by studying various factors and trends from the demand and supply sides. Along with this, the market size was validated using both the top-down and bottom-up approaches.

Market Definition

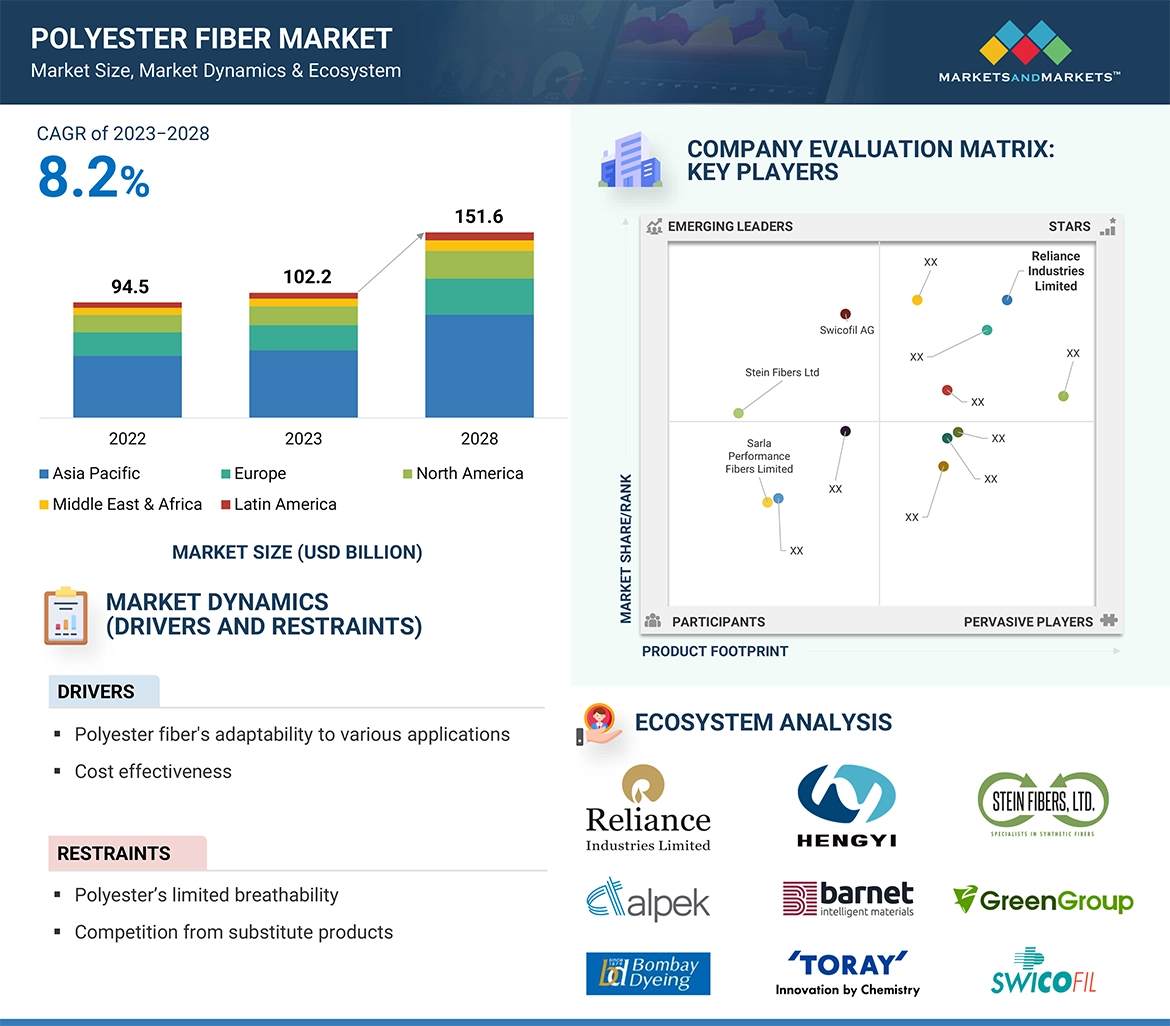
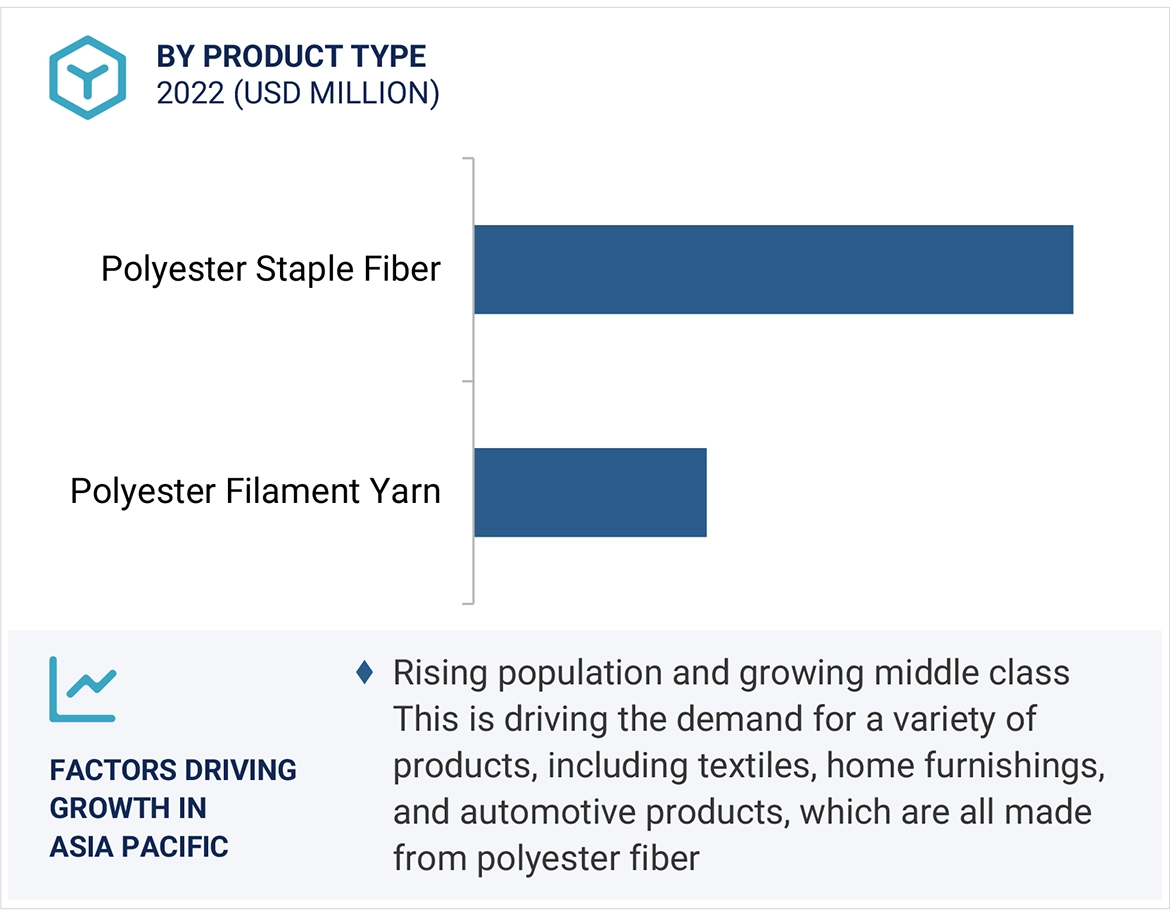
Polyester fiber, also known as a synthetic textile material derived from Polyethylene Terephthalate (PET) or other polyester polymers, is renowned for its exceptional versatility, strength, and long-lasting attributes. This fiber is produced via a multi-step process that includes melting spinning, drawing, and polymerization. The ultimate product is the creation of long, continuous fiber strands. These fibers, which are customized to meet precise specifications regarding length, denier (thickness), and other attributes, are widely used in a variety of textile-related applications. These applications include non-woven materials, household textiles, industrial textiles, and apparel. Polyester fiber is much-liked because it is affordable, low maintenance, wrinkle-resistant, and retains color well. Notably, there has been a noticeable trend in favor of sustainability in recent years, and recycled polyester, or rPET, has become more popular as a way to address the environmental issues related to the production of conventional polyester.

Key Stakeholders

  • Polyester fiber manufacturers and distributors
  • Key application segments for Polyester fiber
  • Research and consulting firms
  • R&D institutions
  • Associations and government institutions
  • Environmental support agencies

Report Objectives:

  • To estimate and forecast the size of the polyester fiber market in terms of volume (KT) and value (USD million)
  • To define, describe, and forecast the size of the polyester fiber market based on form, grade, product type, application, and region.
  • To forecast the size of various segments of the market based on five main regions-—Asia Pacific, North America, Europe, the Middle East & Africa, and South America, along with major countries in each region
  • To provide detailed information about the major factors (drivers, restraints, opportunities, and challenges) influencing the growth of the polyester fiber market across the globe
  • To identify and profile key market players and analyze their core competencies

Available Customizations

Along with the market data, MarketsandMarkets offers customizations according to the specific needs of the companies.

The following customization options are available for the report:

Product Analysis

  • Product matrix, which provides a detailed comparison of the product portfolio of each company's market
Custom Market Research Services

We will customize the research for you, in case the report listed above does not meet with your exact requirements. Our custom research will comprehensively cover the business information you require to help you arrive at strategic and profitable business decisions.

Request Customization
Report Code
CH 8818
Published ON
Oct, 2023
Choose License Type
BUY NOW
  • SHARE
X
Request Customization
Speak to Analyst
Speak to Analyst
OR FACE-TO-FACE MEETING
PERSONALIZE THIS RESEARCH
  • Triangulate with your Own Data
  • Get Data as per your Format and Definition
  • Gain a Deeper Dive on a Specific Application, Geography, Customer or Competitor
  • Any level of Personalization
REQUEST A FREE CUSTOMIZATION
LET US HELP YOU!
  • What are the Known and Unknown Adjacencies Impacting the Polyester Fiber Market
  • What will your New Revenue Sources be?
  • Who will be your Top Customer; what will make them switch?
  • Defend your Market Share or Win Competitors
  • Get a Scorecard for Target Partners
CUSTOMIZED WORKSHOP REQUEST
+1-888-600-6441
  • Call Us
  • +1-888-600-6441 (Corporate office hours)
  • +1-888-600-6441 (US/Can toll free)
  • +44-800-368-9399 (UK office hours)
CONNECT WITH US
ABOUT TRUST ONLINE
©2024 MarketsandMarkets Research Private Ltd. All rights reserved
DMCA.com Protection Status Website Feedback