Process Mining Market

Process Mining Market by Offering (Software (Process Discovery Tools, Conformance Checking Tools), Services), Mining Algorithm (Deep Learning, Sequence Analysis), Data Source (ERP Systems, CRM Systems), Vertical and Region - Global Forecast to 2028

Report Code: TC 8819 Oct, 2023, by marketsandmarkets.com

Updated on : Feb 01, 2024

The process mining market is anticipated to grow rapidly, reaching a value of USD 12.1 billion by 2028 from USD 1.8 billion in 2023. Over the course of the projected period at a CAGR of 45.6%. The rapid expansion of the process mining market can be attributed to several key drivers, as organizations navigate through intricate processes, there's a heightened necessity for tools that can adeptly dissect and optimize these complexities, the pervasive wave of digital transformation has evolved into a tidal force, with businesses across sectors increasingly integrating advanced technologies and process mining serves as the compass, illuminating the intricate pathways of operations, fostering transparency, and empowering organizations with the control needed to navigate through the intricacies of modern business environments.

Technology Roadmap of Process mining till 2030

The process mining market report covers the technology roadmap till 2030, with insights into the short-term, mid-term and long-term developments.

  • Short-term (2023–2025):
    • Improved data collection from various sources including databases, IoT devices, and external APIs.
    • Real-time data integration for more accurate process monitoring.
    • More sophisticated data analysis techniques, including statistical analysis and machine learning algorithms.
    • Predictive analytics to forecast process issues and bottlenecks.
    • User interfaces that are more intuitive and require less technical expertise.
    • Enhanced data visualization for easy process analysis.
    • Improved scalability to handle larger datasets and complex processes.
    • Cloud-based solutions for flexible and cost-effective scaling.
  • Mid-term (2026–2028):
    • Extensive use of artificial intelligence for process automation and optimization.
    • Intelligent process mining tools capable of making autonomous decisions.
    • Enhanced integration capabilities with other enterprise systems, such as ERP and CRM.
    • Seamless data flow between various business applications.
    • Widespread adoption of blockchain for secure and transparent process data recording.
    • Integration with smart contracts for automated process execution.
    • Quantum computing will be used for complex data processing and analysis.
    • Faster and more accurate process discovery and monitoring.
  • Long-term (2029–2030):
    • Comprehensive process mining suites offering end-to-end process management.
    • Integration with a wide range of business systems and applications.
    • AI-driven process improvement recommendations integrated into everyday business operations.
    • Proactive decision support for process optimization.
    • Process mining becomes an integral part of core business operations.
    • Real-time process monitoring and optimization for competitive advantage.
    • Process mining embedded in DevOps and Continuous Integration/Continuous Deployment (CI/CD) pipelines.
    • Real-time monitoring and optimization of software development and deployment processes.

Process Mining Market

To know about the assumptions considered for the study, Request for Free Sample Report

Process Mining Market

To know about the assumptions considered for the study, download the pdf brochure

Market Dynamics

Driver: Increasing complexity of business processes

With businesses engaging in diverse and interdependent operations globally, the intricate network of workflows is further compounded by the integration of technologies such as ERP systems, CRMs, and RPA. Stringent regulatory compliance requirements, coupled with the imperative to meet customer expectations for personalized experiences, contribute to the multifaceted nature of these processes. Process mining emerges as a vital tool, providing real-time visibility, actionable insights, and historical perspectives to unravel the complexities, optimize operations, and drive informed decision-making in the ever-evolving landscape of modern business.

Restraint: Data security and privacy concerns

In this modern era, where organizations increasingly rely on process mining solutions to optimize their operations, the sensitivity and confidentiality of data cannot be overstated. As businesses delve into the intricate details of their processes through mining, there is a growing apprehension about the security of the data being analyzed. Companies handle vast amounts of proprietary information, including customer data, financial records, and internal operations data, making them susceptible to breaches. The reluctance to adopt process mining tools often stems from the fear that exposing such granular insights may inadvertently lead to data leaks or unauthorized access. Compliance with data protection regulations, such as GDPR, adds an additional layer of complexity, necessitating stringent measures to ensure adherence. This concern is particularly pronounced in industries dealing with highly regulated information, such as finance and healthcare, where the repercussions of a security breach can be severe, including legal actions, financial penalties, and reputational damage.

Opportunity: Artificial intelligence and machine learning integration

As organizations across various sectors strive for operational excellence and efficiency, the synergy between AI, ML, and Process Mining emerges as a powerful solution. AI and ML technologies enhance Process Mining capabilities by enabling advanced data analysis and predictive insights. Process Mining involves the extraction of knowledge from event logs to discover, monitor, and improve business processes. When integrated with AI and ML, it transcends mere retrospective analysis, offering proactive and real-time decision-making support. One key aspect is the ability of AI and ML algorithms to handle large and complex datasets, allowing for more comprehensive process mapping and analysis. This, in turn, facilitates the identification of inefficiencies, bottlenecks, and opportunities for optimization within business processes. The predictive analytics offered by ML algorithms further empower organizations to forecast potential process deviations, enabling preemptive corrective actions.

Challenge:Interpreting complex insights

Process Mining tools are adept at extracting and analyzing vast amounts of data to provide valuable insights into business processes. However, the sheer volume and intricacy of the generated data often pose a usability challenge for end-users. The complexity arises from the diverse sources of data, intricate process interdependencies, and the nuanced nature of business workflows. Organizations may struggle to derive actionable insights from the wealth of information presented by Process Mining tools, hindering effective decision-making. The challenge of interpreting complex insights translates into a potential bottleneck for deriving meaningful and strategic conclusions. This complexity can overwhelm users, leading to difficulties in identifying key patterns, bottlenecks, or areas for improvement in their processes.

Process Mining Market Ecosystem

Process Mining Market

By offering, continuous monitoring & analytics tools software segment to account for a larger market size during forecast period

The software segment of the process mining market includes various software solutions that cater to the needs of several industries. Continuous analytics allow organizations to continuously optimize their processes based on real-time data. This iterative improvement cycle ensures that businesses are always operating at peak performance, meeting customer expectations, and adapting to changing market dynamics effectively. These tools enable proactive issue identification and resolution. By constantly analyzing processes, they can detect anomalies or inefficiencies before they escalate. This proactive approach aligns with the modern business ethos of preventing problems rather than reacting to them, contributing to smoother operations.

By mining algorithm, discovery algorithms segment to hold the largest market share during the forecast period

In an era marked by increasingly complex business operations, discovery algorithms showcase a remarkable adaptability. They excel in handling intricate process structures and variations, making them indispensable for industries with multifaceted workflows. This adaptability positions them as the go-to solution for businesses navigating intricate operational scenarios. The iterative nature of discovery algorithms allows for continuous monitoring of processes. As businesses evolve and adapt to changing market dynamics, these algorithms facilitate real-time insights into ongoing operations.

By data source, financial systems data segment to register the fastest growth rate during the forecast period

Financial systems form the backbone of any organization, serving as the nerve center for monetary transactions, budgeting, and financial planning. As businesses increasingly recognize the pivotal role of finance in overall operational health, the demand for process mining within financial systems intensifies. Financial processes are inherently complex, involving numerous steps and stakeholders. Process mining excels in unraveling intricate workflows, identifying bottlenecks, and optimizing processes for efficiency. The financial systems data segment benefits significantly from the ability of process mining to streamline these intricate financial workflows.

By region, Europe to hold the largest market size during the forecast period

Process mining's versatility makes it applicable across a wide range of industries, from manufacturing to finance. Europe, with its diverse economic landscape, sees widespread adoption of process mining solutions across various sectors, contributing to the region's overall market share. Supportive government initiatives and funding for digital transformation projects further propel the adoption of process mining in Europe. This creates an environment conducive to innovation and technological advancement, fostering the growth of the process mining market in the region.

Europe has a well-established regulatory framework that emphasizes transparency and compliance in business operations. The need to adhere to stringent regulations, such as GDPR (General Data Protection Regulation), propels the adoption of process mining solutions as organizations seek tools to ensure compliance and maintain a clear audit trail. European businesses have a strong focus on achieving operational excellence to remain competitive on the global stage. Process mining plays a pivotal role in streamlining processes, identifying bottlenecks, and optimizing workflows, aligning perfectly with the strategic objectives of businesses in the region.

Process Mining Market Size, and Share

Key Market Players

The process mining solution and service providers have implemented various types of organic and inorganic growth strategies, such as new product launches, product upgrades, partnerships, and agreements, business expansions, and mergers and acquisitions to strengthen their offerings in the market. Some major players in the process mining market include UiPath (US), ABBYY (US), Celonis (US), IBM (US) and Software AG (Germany) along with start-ups such as Apromore (Australia), Inverbis Analytics (Spain), Mindzie (US), and Workfellow (Finland).

Get online access to the report on the World's First Market Intelligence Cloud

  • Easy to Download Historical Data & Forecast Numbers
  • Company Analysis Dashboard for high growth potential opportunities
  • Research Analyst Access for customization & queries
  • Competitor Analysis with Interactive dashboard
  • Latest News, Updates & Trend analysis
Request Sample

Scope of the Report

Report Metrics

Details

Market size available for years

2018–2028

Base year considered

2022

Forecast period

2023–2028

Forecast units

USD (Billion)

Segments covered

Offering, Mining Algorithms, Data Source, Vertical, and Region

Geographies covered

North America, Europe, Asia Pacific, Middle East & Africa, and Latin America

Companies covered

IBM (US), ABBYY (US), Celonis (US), UiPath (US), Software AG (Germany), SAP Signavio (Germany), QPR Software (Finland), Microsoft (US), Appian (US), Pegasystems (US), Mehrwerk (Germany), Kofax (US), Soroco (US), iGrafx (US), Nintex (US), Automation Anywhere (US), Hyland Software (US), Fluxicon (Netherlands), Datapolis (Poland), Apromore (Australia), BusinessOptix (US), StereoLOGIC (Canada), Worksoft (US), Inverbis Analytics (Spain), Skan.ai (US), Mindzie (US), Cyclone Robotics (China), Upflux (Brazil), Puzzledata Inc. (South Korea), Kyp.ai (Germany), Workfellow (Finland).

This research report categorizes the process mining market based on offering, mining algorithms, data source, vertical, and region

By Offering:
  • Software
    • Process Discovery Tools
      • Event Log-Based Discovery
        • Automated Discovery
        • Interactive Discovery
        • Log Filtering & Preprocessing
      • Process Map-Based Discovery
        • Flowchart Generation
        • Process Map Visualization
    • Conformance Checking Tools
      • Model-Checking Conformance
        • Direct Model Comparison
        • Statistical Model Checking
        • Automated Rule-Based Conformance
      • Log-Based Conformance
        • Deviation Detection
        • Anomaly Detection
        • Root Cause Analysis
    • Process Enhancement & Simulation Tools
      • Simulation & Optimization
        • Process Simulation
        •  What-If Analysis
        • Optimization Algorithms
      • Process Enhancement & Automation
        • Recommendation Engine
        • Automation Integration
        • Process Redesign Tools
    • Performance Analysis Tools
      • Performance Metrics
        • Key Performance Indicator (KPI) Tracking
        • Process Efficiency Analysis
        • Bottleneck Identification
      • Performance Visualization
        • Real-Time Performance Dashboards
        • Historical Performance Trends
        • Performance Benchmarking
    • Visualization Tools
      • Process Visualization
        • Interactive Process Maps
        • Process Flowcharts
        • Heatmaps & Sankey Diagrams
      • Data Visualization
        • Data Dashboards
        • Custom Data Visualizations
        • Data Exploration Tools
    • Continuous Monitoring & Analytics tools
      • Real-Time Monitoring
        • Continuous Event Stream Analysis
        • Real-Time Process Tracking
        • Alerting & Notification
      • Historical Analytics
        • Trend Analysis
        • Root Cause Analysis
        • Historical Process Performance Reports
      • Predictive Analytics
        • Machine Learning Models
        • Predictive KPI Forecasting
      • Advanced Prediction Models
        • Complex Event Processing
        • Time Series Forecasting
    • Integration & Collaboration tools
      • Data Integration
        • Data Source Integration
        • API & Data Connector Support
        • Data Transformation & Mapping
      • Collaboration Tools
        • Workflow Collaboration
        • Team Collaboration
        • Process Documentation & Sharing
    • Other Software
  • Services
    • Professional Services
      • System Integration & Implementation Services
      • Support & Maintenance Services
      • Training & Consulting Services
    • Managed Services
By Mining Algorithms:
  • Discovery Algorithms
    • Heuristic Mining
      • Directly-Follows Graph Discovery
      • Dependency Graph Discovery
      • Alpha Algorithm
    • Alpha Miner
      • Enhanced Heuristic Mining
      • Noise Filtering
      • Loop Handling
    • Inductive Miner
      • Directly-Follows Graph Induction
      • Log-Petri Net Conversion
      • Noise Tolerance
  • Conformance Checking Algorithms
    • Token-Based Replay
      • Fitness Assessment
      • Alignments
      • Precision & Generalization
    • Log-Based Conformance Checking
      • Deviation Detection
      • Conformance Metrics
      • Root Cause Analysis
    • Model-Based Conformance Checking
      • Process Model Alignment
      • Fitness Analysis
      • Precision & Generalization
  • Enhancement & Extension Algorithms
    • Process Simulation
      • Monte Carlo Simulation
      • Process Variability Analysis
      • What-If Analysis
    • Recommendation Algorithms
      • Process Optimization Suggestions
      • Resource Allocation Recommendations
      • Compliance Improvement Guidance
    • Predictive Analytics Algorithms
      • Machine Learning for Process Predictions
      • Predictive KPI Monitoring
  • Clustering & Classification Algorithms
    • Process Instance Clustering
      • Similarity Measures
      • Hierarchical Clustering
      • K-Means Clustering
    • Process Variant Classification
      • Decision Tree Classification
      • Naive Bayes Classification
      • Support Vector Machines (SVM)
    • Anomaly Detection
      • Statistical Anomaly Detection
      • Isolation Forest
      • Autoencoders for Sequence Anomalies
  • Sequence Analysis Algorithms
    • Sequential Pattern Mining
      • Frequent Sequential Pattern Discovery
      • Parallel Sequence Mining
    • Sequence Alignment
      • Event Log Sequence Alignment
      • Sequence Edit Distance Metrics
      • Sequence Clustering
    • Process Path Analysis
      • Path Frequency Analysis
      • Abstraction of Process Paths
      • Critical Path Identification
  • Deep Learning Algorithms
    • Recurrent Neural Networks (RNN)
      • LSTM-Based Process Analysis
      • GRU-Based Sequence Modeling
      • Event Sequence Prediction
    • Transformer Models
      • Attention-Based Process Analysis
      • Transformer-XL for Long Sequences
      • Process Text Mining
    • Graph Neural Networks (GNN)
      • Graph-Based Process Analysis
      • Graph Attention Networks (GAT)
      • GNNs for Process Prediction
  • Temporal Process Mining Algorithms
    • Temporal Pattern Discovery
      • Time Interval-Based Patterns
      • Temporal Rules & Constraints
      • Duration Analysis
    • Time Series Analysis
      • Event Log Time Series Analysis
      • Process Event Forecasting
      • Time-Related Process Insights
  • Other Mining Algorithms
By Data Source:
  • Enterprise Resource Planning (ERP) Systems
    • Financial ERP Data
    • Inventory ERP Data
    • Procurement ERP Data
  • Customer Relationship Management (CRM) Systems
    • Sales CRM Data
    • Marketing CRM Data
    • Customer Support CRM Data
  • IoT Devices & Sensors
    • Sensor Data Analytics
    • IoT Device Performance Data
    • Predictive Maintenance Data
  • Custom Applications & Databases
    • Custom Database Tables
    • Legacy Application Data
    • Web Application Logs
  • Workflow & BPM Systems
    • Workflow Process Data
    • Business Process Model & Notation (BPMN) Model Execution
    • Process Workflow Metrics
  • Document Management Systems
    • Document Workflow Data
    • Content Management Data
    • Digital Signature Workflows
  • Supply Chain & Logistics Data
    • Transportation & Shipping Data
    • Supplier & Vendor Interactions
    • cold-chain monitoring Data
  • Financial Systems Data
    • Accounting & Financial Transactions
    • Expense Management Data
    • Audit & Compliance Records
  • Other Data Sources
By Vertical:
  • BFSI
    • Loan Origination & Underwriting
      • Credit Risk Assessment
      • Mortgage Approval Process
      • Loan Document Verification
    • Fraud Detection & Prevention
      • Transaction Fraud Analysis
      • Identity Theft Detection
      • Anti-Money Laundering (AML)
    • Customer Onboarding & KYC
      • Customer Due Diligence
      • KYC Process Efficiency
      • Compliance Monitoring
    • Claims Processing
      • Insurance Claims Verification
      • Claims Settlement Efficiency
      • Fraudulent Claims Detection
    • Others
  • Manufacturing
    • Production Optimization
      • Production Line Efficiency
      • Workforce Productivity
      • Equipment Utilization
    • Quality Control & Assurance
      • Defect Detection & Prevention
      • Compliance Monitoring
      • Root Cause Analysis
    • Supply Chain Management
      • Inventory Optimization
      • Supplier Performance Analysis
      • Demand Forecasting & Planning
    • Maintenance & Reliability
      • Predictive Maintenance
      • Asset Utilization Analysis
      • Downtime Reduction
    • Others
  • IT & ITeS
    • Software Development Lifecycle (SDLC) Analysis
      • Code Review & Optimization
      • Bug & Issue Tracking
      • Release Cycle Efficiency
    • IT Help Desk & Support
      • Ticket Resolution Time Analysis
      • Incident Trends & Patterns
      • Service Level Agreement (SLA) Compliance
    • IT Infrastructure Management
      • Network Performance Monitoring
      • Server Resource Utilization
      • IT Asset Inventory
    • Cybersecurity & Threat Detection
      • Intrusion Detection & Response
      • Security Incident Analysis
      • Compliance with Security Policies
    • Others
  • Healthcare & Life Sciences
    • Patient Care & Hospital Management
      • Patient Journey Analysis
      • Resource Allocation Optimization
      • Billing & Claims Processing
    • Clinical Trials Optimization
      • Trial Enrollment Efficiency
      • Adverse Event Analysis
      • Drug Development Timelines
    • Electronic Health Records (EHR) Analysis
      • EHR Data Accuracy
      • Regulatory Compliance
      • Patient Outcome Improvement
    • Supply Chain & Pharmaceutical Manufacturing
      • Pharmaceutical Production Optimization
      • Drug Traceability
      • Inventory Management
    • Others
  • Retail & E-Commerce
    • Customer Experience Enhancement
      • Customer Journey Mapping
      • Personalization & Recommendations
      • Cart Abandonment Analysis
    • Inventory & Stock Management
      • Stock-Level Optimization
      • stock Demand Forecasting
      • Shelf Space Optimization
    • Order Fulfillment & Logistics
      • Order Processing Efficiency
      • Delivery Time Optimization
      • Returns Management
    • Pricing & Promotion Strategy
      • Dynamic Pricing Analysis
      • Promotion Effectiveness
      • Profit Margin Optimization
    • Others
  • Energy & Utilities
    • Energy Consumption Analysis
      • Energy Efficiency Improvement
      • energy Demand Forecasting
      • Renewable Energy Integration
    • Asset Management & Predictive Maintenance
      • Equipment Reliability Analysis
      • Asset Performance Optimization
      • Grid Resilience Enhancement
    • Grid & Distribution Optimization
      • Grid Performance Analysis
      • Distribution Network Efficiency
      • Smart Grid Implementation
    • Environmental Compliance
      • Emissions Monitoring & Reporting
      • Regulatory Compliance
      • Sustainability Initiatives
    • Others
  • Transportation & Logistics
    • Route Optimization
      • Transportation Route Efficiency
      • Delivery Time Monitoring
      • Fleet Management
    • Inventory & Warehouse Management
      • Inventory Turnover Optimization
      • Warehouse Efficiency
      • Demand Forecasting
    • Logistics Visibility & Tracking
      • Supply Chain Visibility
      • Carrier Performance Analysis
      • Last-Mile Delivery Optimization
    • Safety & Compliance
      • Driver Safety Monitoring
      • Regulatory Compliance
      • Incident & Accident Analysis
    • Others
  • Government & Defense
    • Citizen Services Improvement
      • Government Service Efficiency
      • Citizen Experience Enhancement
      • Compliance Monitoring
    • Public Health & Safety
      • Emergency Response Optimization
      • Disease Surveillance
      • Traffic Management
    • Regulatory Compliance & Auditing
      • Audit Trail Analysis
      • Data Privacy Compliance
      • Regulatory Reporting
    • Others
  • Education
    • Student Lifecycle Management
      • Enrollment Process Optimization
      • Academic Performance Analysis
      • Student Support Services
    • Curriculum & Course Optimization
      • Curriculum Design Efficiency
      • Course Enrollment Analysis
      • Learning Outcome Improvement
    • Resource Allocation
      • Faculty Workload Balancing
      • Infrastructure Utilization
      • Budget Allocation Efficiency
    • Others
  • Other Verticals
By Region:
  • North America
    • US
    • Canada
  • Europe
    • UK
    • Germany
    • France
    • Italy
    • Spain
    • Netherlands
    • Rest of Europe
  • Asia Pacific
    • China
    • India
    • Japan
    • South Korea
    • Singapore
    • Australia & New Zealand (ANZ)
    • Rest of Asia Pacific
  • Middle East and Africa
    • Saudi Arabia
    • UAE
    • South Africa
    • Turkey
    • Rest of Middle East & Africa
  • Latin America
    • Brazil
    • Mexico
    • Argentina
    • Rest of Latin America

Recent Developments:

  • In July 2023, Microsoft announced the launch of Power Automate Process Mining, infused with next-generation AI which enables organizations to easily understand what is happening across their business, maximize process insights, use out-of-box recommendations to reduce the complexity of processes, transform operations, and drive continuous process improvement with automation and low-code apps.
  • In May 2023, Pegasystems announced the launch of Pega Process Mining, which will make it easier for Pega users of all skill levels to find and fix process inefficiencies hindering their business operations.
  • In May 2023, QPR Software announced a brand-new partnership with Paris-based Solution BI, known for their customer-centric end-to-end business intelligence solutions.
  • In March 2023, UiPath launched a new process mining tool called Communications Mining which brings new capabilities to understand and automate business communications. It uses state-of-the-art AI models to turn business messages—from emails to tickets—into actionable data.
  • In January 2023, Appian announced a strategic alliance with EY to support clients on digital transformation initiatives using the next wave of intelligent automation and process mining.

Frequently Asked Questions (FAQ):

To speak to our analyst for a discussion on the above findings, click Speak to Analyst

TABLE OF CONTENTS
 
1 INTRODUCTION (Page No. - 48)
    1.1 STUDY OBJECTIVES 
    1.2 MARKET DEFINITION 
    1.3 STUDY SCOPE 
           1.3.1 MARKET SEGMENTATION
                    TABLE 1 PROCESS MINING MARKET: DETAILED SEGMENTATION
           1.3.2 INCLUSIONS & EXCLUSIONS
           1.3.3 REGIONS COVERED
    1.4 YEARS CONSIDERED 
    1.5 CURRENCY CONSIDERED 
           TABLE 2 USD EXCHANGE RATES, 2018–2022
    1.6 STAKEHOLDERS 
    1.7 IMPACT OF RECESSION 
 
2 RESEARCH METHODOLOGY (Page No. - 57)
    2.1 RESEARCH DATA 
           FIGURE 1 RESEARCH DESIGN
           2.1.1 SECONDARY DATA
           2.1.2 PRIMARY DATA
                    TABLE 3 PRIMARY INTERVIEWS
                    2.1.2.1 Breakup of primary profiles
                    2.1.2.2 Key industry insights
    2.2 MARKET BREAKUP AND DATA TRIANGULATION 
           FIGURE 2 DATA TRIANGULATION
    2.3 MARKET SIZE ESTIMATION 
           FIGURE 3 PROCESS MINING MARKET: TOP-DOWN AND BOTTOM-UP APPROACHES
           2.3.1 TOP-DOWN APPROACH
           2.3.2 BOTTOM-UP APPROACH
                    FIGURE 4 APPROACH 1 (SUPPLY-SIDE): REVENUE FROM SOLUTIONS/SERVICES OF PROCESS MINING VENDORS
                    FIGURE 5 APPROACH 2, BOTTOM-UP (SUPPLY-SIDE): COLLECTIVE REVENUE FROM ALL SOFTWARE AND SERVICES OF PROCESS MINING VENDORS
                    FIGURE 6 APPROACH 3, BOTTOM-UP (SUPPLY-SIDE): COLLECTIVE REVENUE FROM ALL SOFTWARE AND SERVICES OF PROCESS MINING VENDORS
                    FIGURE 7 APPROACH 4, BOTTOM-UP (DEMAND-SIDE): SHARE OF PROCESS MINING IN OVERALL INFORMATION TECHNOLOGY SPENDING
    2.4 MARKET FORECAST 
           TABLE 4 FACTOR ANALYSIS
    2.5 RESEARCH ASSUMPTIONS 
    2.6 LIMITATIONS AND RISK ASSESSMENT 
    2.7 IMPACT OF RECESSION ON MARKET 
           TABLE 5 IMPACT OF RECESSION ON GLOBAL MARKET
 
3 EXECUTIVE SUMMARY (Page No. - 71)
    TABLE 6 GLOBAL PROCESS MINING MARKET SIZE AND GROWTH RATE, 2018–2022 (USD MILLION, Y-O-Y %) 
    TABLE 7 GLOBAL MARKET SIZE AND GROWTH RATE, 2023–2028 (USD MILLION, Y-O-Y %) 
    FIGURE 8 SOFTWARE SEGMENT TO ACCOUNT FOR LARGER MARKET IN 2023 
    FIGURE 9 INTEGRATION & COLLABORATION TOOLS SEGMENT TO LEAD MARKET DURING FORECAST PERIOD 
    FIGURE 10 PROFESSIONAL SERVICES TO DOMINATE MARKET IN 2023 
    FIGURE 11 TRAINING & CONSULTING SERVICES SEGMENT TO ACCOUNT FOR LARGER SHARE IN 2023 
    FIGURE 12 DISCOVERY ALGORITHMS SEGMENT TO ACCOUNT FOR LARGEST MARKET IN 2023 
    FIGURE 13 ERP SYSTEMS SEGMENT TO LEAD MARKET IN 2023 
    FIGURE 14 MANUFACTURING SEGMENT TO WITNESS HIGHEST GROWTH DURING FORECAST PERIOD 
    FIGURE 15 EUROPE TO ACCOUNT FOR LARGEST SHARE DURING FORECAST PERIOD 
 
4 PREMIUM INSIGHTS (Page No. - 77)
    4.1 ATTRACTIVE OPPORTUNITIES FOR PLAYERS IN PROCESS MINING MARKET 
           FIGURE 16 INCREASING NEED TO AUGMENT CONTINUOUS PROCESS IMPROVEMENT AND AGILITY TO DRIVE MARKET
    4.2 MARKET: KEY MINING ALGORITHMS 
           FIGURE 17 DEEP LEARNING ALGORITHMS SEGMENT TO RECORD HIGHEST GROWTH DURING FORECAST PERIOD
    4.3 EUROPE: MARKET, BY OFFERING AND KEY VERTICAL 
           FIGURE 18 SOFTWARE AND BFSI SEGMENTS TO ACCOUNT FOR SIGNIFICANT SHARE IN 2023
    4.4 MARKET: REGIONAL ANALYSIS 
           FIGURE 19 EUROPE TO ACCOUNT FOR LARGEST SHARE IN 2023
 
5 MARKET OVERVIEW AND INDUSTRY TRENDS (Page No. - 80)
    5.1 INTRODUCTION 
    5.2 MARKET DYNAMICS 
           FIGURE 20 PROCESS MINING MARKET: DRIVERS, RESTRAINTS, OPPORTUNITIES, AND CHALLENGES
           5.2.1 DRIVERS
                    5.2.1.1 Increasing complexity of business processes
                    5.2.1.2 Rising digital transformation
                    5.2.1.3 Growing need for process visibility and control
           5.2.2 RESTRAINTS
                    5.2.2.1 Lack of awareness and understanding among potential users
                    5.2.2.2 Data security and privacy concerns
                    5.2.2.3 Data quality and availability issues
           5.2.3 OPPORTUNITIES
                    5.2.3.1 Artificial intelligence and machine learning integration
                    5.2.3.2 Rising demand for cloud-based solutions
                    5.2.3.3 Increasing focus on sustainability
           5.2.4 CHALLENGES
                    5.2.4.1 Use of legacy systems and integration with other technologies
                    5.2.4.2 Data complexity
                    5.2.4.3 Diverse data sources and intricate process interdependencies
    5.3 EVOLUTION OF PROCESS MINING 
           FIGURE 21 EVOLUTION OF PROCESS MINING
    5.4 VALUE CHAIN ANALYSIS 
           FIGURE 22 VALUE CHAIN ANALYSIS
           TABLE 8 ROLE OF PLAYERS IN VALUE CHAIN
    5.5 ECOSYSTEM ANALYSIS 
           TABLE 9 ROLE OF PLAYERS IN MARKET ECOSYSTEM
           FIGURE 23 ECOSYSTEM MAP
           5.5.1 PROCESS MINING MARKET: SOFTWARE PROVIDERS
           5.5.2 MARKET: SERVICE PROVIDERS
           5.5.3 MARKET: DATA PROVIDERS
           5.5.4 MARKET: SYSTEM INTEGRATORS
           5.5.5 MARKET: END USERS
           5.5.6 MARKET: REGULATORY BODIES
    5.6 PROCESS MINING ARCHITECTURE 
           FIGURE 24 PROCESS MINING ARCHITECTURE
           5.6.1 INFORMATION SYSTEMS
           5.6.2 EVENT LOG DATA PRE-PROCESSING
           5.6.3 PROCESS MAP CREATION
           5.6.4 INSIGHT GENERATION
    5.7 BEST PRACTICES IN PROCESS MINING MARKET 
           TABLE 10 BEST PRACTICES IN MARKET
    5.8 CASE STUDY ANALYSIS 
           5.8.1 HEALTHCARE & LIFE SCIENCES
                    5.8.1.1 Johnson & Johnson adopted Celonis’ process mining and value chain technologies to deliver practical, day-to-day solutions
           5.8.2 ENERGY & UTILITIES
                    5.8.2.1 eRegio implemented Signavio’s Business Transformation Suite to identify process bottlenecks and inefficiencies
           5.8.3 GOVERNMENT & DEFENSE
                    5.8.3.1 US State Government leveraged IBM’s process mining solutions to streamline procurement processes
           5.8.4 MANUFACTURING
                    5.8.4.1 Hitachi partnered with Automation Anywhere to streamline business processes and enhance employee efficiency
           5.8.5 BFSI
                    5.8.5.1 Isbank deployed UiPath Process Mining to discover pockets of value within its processes and provide impactful recommendations to businesses
           5.8.6 EDUCATION
                    5.8.6.1 Munich University of Applied Sciences implemented iGrafx’s solutions to optimize process landscape
    5.9 TECHNOLOGY ANALYSIS 
           5.9.1 KEY TECHNOLOGIES
                    5.9.1.1 Artificial Intelligence (AI) and Machine Learning (ML)
                    5.9.1.2 Robotic Process Automation (RPA)
                    5.9.1.3 Cloud Computing
                    5.9.1.4 IoT
                    5.9.1.5 Big Data Analytics
           5.9.2 ADJACENT TECHNOLOGIES
                    5.9.2.1 Natural Language Processing (NLP)
                    5.9.2.2 Decision Support System (DSS)
                    5.9.2.3 Data Streaming and Real-time Analytics
           5.9.3 COMPLIMENTARY TECHNOLOGIES
                    5.9.3.1 Data Warehousing
                    5.9.3.2 Data Governance
                    5.9.3.3 Encryption and Cybersecurity
                    5.9.3.4 APIs
    5.10 TARIFF AND REGULATORY LANDSCAPE 
           5.10.1 PROCESS MINING SOFTWARE TARIFF
                    TABLE 11 PROCESS MINING SOFTWARE TARIFF, BY COUNTRY, 2022
           5.10.2 REGULATORY LANDSCAPE
                    5.10.2.1 Regulatory bodies, government agencies, and other organizations
                               TABLE 12 NORTH AMERICA: REGULATORY BODIES, GOVERNMENT AGENCIES, AND OTHER ORGANIZATIONS
                               TABLE 13 EUROPE: REGULATORY BODIES, GOVERNMENT AGENCIES, AND OTHER ORGANIZATIONS
                               TABLE 14 ASIA PACIFIC: REGULATORY BODIES, GOVERNMENT AGENCIES, AND OTHER ORGANIZATIONS
                               TABLE 15 MIDDLE EAST & AFRICA: REGULATORY BODIES, GOVERNMENT AGENCIES, AND OTHER ORGANIZATIONS
                               TABLE 16 LATIN AMERICA: REGULATORY BODIES, GOVERNMENT AGENCIES, AND OTHER ORGANIZATIONS
                    5.10.2.2 North America
                               5.10.2.2.1 Data Privacy Compliance (DPC) Act
                               5.10.2.2.2 California Consumer Privacy Act (CCPA)
                               5.10.2.2.3 Personal Information Protection and Electronic Documents Act (PIPEDA)
                    5.10.2.3 Europe
                               5.10.2.3.1 General Data Protection Regulation (GDPR)
                               5.10.2.3.2 Commission nationale de l'informatique et des libertés (France)
                               5.10.2.3.3 Autoriteit Persoonsgegevens (Netherlands)
                               5.10.2.3.4 Data Protection Act (Germany)
                    5.10.2.4 Asia Pacific
                               5.10.2.4.1 Personal Data Protection Act (PDPA)
                               5.10.2.4.2 Personal Information Protection Act (PIPA)
                               5.10.2.4.3 Personal Data Protection Bill (PDPB)
                    5.10.2.5 Middle East & Africa
                               5.10.2.5.1 Protection of Personal Information Act (POPIA)
                               5.10.2.5.2 Data Protection Law (DPL)
                               5.10.2.5.3 DIFC Data Protection Law - Dubai International Financial Centre
                    5.10.2.6 Latin America
                               5.10.2.6.1 Lei Geral de Proteção de Dados (LGPD)
                               5.10.2.6.2 Ley Federal de Protección de Datos Personales en Posesión de los Particulares (LFPDPPP)
                               5.10.2.6.3 Ley de Protección de Datos Personales (LPDP)
    5.11 PATENT ANALYSIS 
           5.11.1 METHODOLOGY
           5.11.2 PATENTS FILED, BY DOCUMENT TYPE, 2013–2023
                    TABLE 17 PATENTS FILED, 2013–2023
           5.11.3 INNOVATION AND PATENT APPLICATIONS
                    FIGURE 25 TOTAL NUMBER OF PATENTS GRANTED, 2013–2023
                    5.11.3.1 Top applicants
                               FIGURE 26 TOP TEN COMPANIES WITH HIGHEST NUMBER OF PATENT APPLICATIONS, 2013–2023
                               FIGURE 27 REGIONAL ANALYSIS OF PATENTS GRANTED, 2013–2023
                               TABLE 18 TOP 20 PATENT OWNERS IN PROCESS MINING MARKET, 2013–2023
                               TABLE 19 LIST OF TOP PATENTS IN MARKET, 2023
    5.12 PRICING ANALYSIS 
           5.12.1 AVERAGE SELLING PRICE TREND OF KEY PLAYERS, BY SOFTWARE TYPE
                    FIGURE 28 AVERAGE SELLING PRICE TREND OF KEY PLAYERS, BY SOFTWARE TYPE
                    TABLE 20 AVERAGE SELLING PRICE TREND OF KEY PLAYERS, BY SOFTWARE TYPE
           5.12.2 INDICATIVE PRICING ANALYSIS, BY PROCESS MINING VENDOR
                    TABLE 21 INDICATIVE PRICING ANALYSIS, BY PROCESS MINING VENDOR
    5.13 TRADE ANALYSIS 
           5.13.1 IMPORT SCENARIO OF COMPUTER SOFTWARE
                    FIGURE 29 COMPUTER SOFTWARE IMPORTS, BY KEY COUNTRY, 2015–2022 (USD BILLION)
           5.13.2 EXPORT SCENARIO OF COMPUTER SOFTWARE
                    FIGURE 30 COMPUTER SOFTWARE EXPORTS, BY KEY COUNTRY, 2015–2022 (USD BILLION)
    5.14 KEY CONFERENCES & EVENTS 
                    TABLE 22 KEY CONFERENCES & EVENTS, 2023–2023
    5.15 PORTER’S FIVE FORCES ANALYSIS 
                    FIGURE 31 PORTER’S FIVE FORCES ANALYSIS
           5.15.1 THREAT OF NEW ENTRANTS
           5.15.2 THREAT OF SUBSTITUTES
           5.15.3 BARGAINING POWER OF SUPPLIERS
           5.15.4 BARGAINING POWER OF BUYERS
           5.15.5 INTENSITY OF COMPETITIVE RIVALRY
    5.16 PROCESS MINING TECHNOLOGY ROADMAP 
                    TABLE 23 PROCESS MINING TECHNOLOGY ROADMAP
    5.17 PROCESS MINING MARKET: BUSINESS MODELS 
                    FIGURE 32 MARKET: BUSINESS MODELS
           5.17.1 SOFTWARE VENDOR MODEL
           5.17.2 CONSULTING SERVICES MODEL
           5.17.3 PLATFORM-AS-A-SERVICE MODEL
           5.17.4 MANAGED SERVICES MODEL
           5.17.5 DATA MONETIZATION MODEL
    5.18 TRENDS/DISRUPTIONS IMPACTING BUYERS/CLIENTS 
                    FIGURE 33 TRENDS/DISRUPTIONS IMPACTING BUYERS/CLIENTS
    5.19 KEY STAKEHOLDERS AND BUYING CRITERIA 
           5.19.1 KEY STAKEHOLDERS IN BUYING PROCESS
                    FIGURE 34 INFLUENCE OF STAKEHOLDERS ON BUYING PROCESS FOR TOP THREE VERTICALS
                    TABLE 24 INFLUENCE OF STAKEHOLDERS ON BUYING PROCESS FOR TOP THREE VERTICALS
           5.19.2 BUYING CRITERIA
                    FIGURE 35 KEY BUYING CRITERIA FOR TOP THREE VERTICALS
                    TABLE 25 KEY BUYING CRITERIA FOR TOP THREE APPLICATIONS
 
6 PROCESS MINING MARKET, BY DATA SOURCE (Page No. - 133)
    6.1 INTRODUCTION 
           6.1.1 DATA SOURCES: MARKET DRIVERS
                    FIGURE 36 ERP SYSTEMS SEGMENT TO LEAD MARKET DURING FORECAST PERIOD
                    TABLE 26 MARKET, BY DATA SOURCE, 2018–2022 (USD MILLION)
                    TABLE 27 MARKET, BY DATA SOURCE, 2023–2028 (USD MILLION)
    6.2 ENTERPRISES RESOURCE PLANNING (ERP) SYSTEMS 
           6.2.1 WIDESPREAD ADOPTION OF ERP SYSTEMS ACROSS INDUSTRIES TO DRIVE MARKET
                    TABLE 28 MARKET, BY ERP SYSTEM, 2018–2022 (USD MILLION)
                    TABLE 29 MARKET, BY ERP SYSTEM, 2023–2028 (USD MILLION)
           6.2.2 FINANCIAL ERP DATA
                    TABLE 30 FINANCIAL ERP DATA: PROCESS MINING MARKET, BY REGION, 2018–2022 (USD MILLION)
                    TABLE 31 FINANCIAL ERP DATA: MARKET, BY REGION, 2023–2028 (USD MILLION)
           6.2.3 INVENTORY ERP DATA
                    TABLE 32 INVENTORY ERP DATA: MARKET, BY REGION, 2018–2022 (USD MILLION)
                    TABLE 33 INVENTORY ERP DATA: MARKET, BY REGION, 2023–2028 (USD MILLION)
           6.2.4 PROCUREMENT ERP DATA
                    TABLE 34 PROCUREMENT ERP DATA: MARKET, BY REGION, 2018–2022 (USD MILLION)
                    TABLE 35 PROCUREMENT ERP DATA: MARKET, BY REGION, 2023–2028 (USD MILLION)
    6.3 CUSTOMER RELATIONSHIP MANAGEMENT (CRM) SYSTEMS 
           6.3.1 NEED TO HARNESS CUSTOMER-CENTRIC DATA FROM CRM SYSTEMS TO PROPEL GROWTH
                    TABLE 36 MARKET, BY CRM SYSTEM, 2018–2022 (USD MILLION)
                    TABLE 37 MARKET, BY CRM SYSTEM, 2023–2028 (USD MILLION)
           6.3.2 SALES CRM DATA
                    TABLE 38 SALES CRM DATA: MARKET, BY REGION, 2018–2022 (USD MILLION)
                    TABLE 39 SALES CRM DATA: MARKET, BY REGION, 2023–2028 (USD MILLION)
           6.3.3 MARKETING CRM DATA
                    TABLE 40 MARKETING CRM DATA: MARKET, BY REGION, 2018–2022 (USD MILLION)
                    TABLE 41 MARKETING CRM DATA: MARKET, BY REGION, 2023–2028 (USD MILLION)
           6.3.4 CUSTOMER SUPPORT CRM DATA
                    TABLE 42 CUSTOMER SUPPORT CRM DATA: MARKET, BY REGION, 2018–2022 (USD MILLION)
                    TABLE 43 CUSTOMER SUPPORT CRM DATA: MARKET, BY REGION, 2023–2028 (USD MILLION)
    6.4 IOT DEVICES & SENSORS 
           6.4.1 RAPID ADOPTION OF IOT TECHNOLOGY ACROSS INDUSTRIES TO DRIVE POPULARITY OF IOT DEVICES AND SENSORS
                    TABLE 44 MARKET, BY IOT DEVICE & SENSOR, 2018–2022 (USD MILLION)
                    TABLE 45 MARKET, BY IOT DEVICE & SENSOR, 2023–2028 (USD MILLION)
           6.4.2 SENSOR DATA ANALYTICS
                    TABLE 46 SENSOR DATA ANALYTICS: MARKET, BY REGION, 2018–2022 (USD MILLION)
                    TABLE 47 SENSOR DATA ANALYTICS: MARKET, BY REGION, 2023–2028 (USD MILLION)
           6.4.3 IOT DEVICE PERFORMANCE DATA
                    TABLE 48 IOT DEVICE PERFORMANCE DATA: PROCESS MINING MARKET, BY REGION, 2018–2022 (USD MILLION)
                    TABLE 49 IOT DEVICE PERFORMANCE DATA: MARKET, BY REGION, 2023–2028 (USD MILLION)
           6.4.4 PREDICTIVE MAINTENANCE DATA
                    TABLE 50 PREDICTIVE MAINTENANCE DATA: MARKET, BY REGION, 2018–2022 (USD MILLION)
                    TABLE 51 PREDICTIVE MAINTENANCE DATA: MARKET, BY REGION, 2023–2028 (USD MILLION)
    6.5 CUSTOM APPLICATIONS & DATABASES 
           6.5.1 RISING NEED TO ANALYZE AND OPTIMIZE SPECIFIC WORKFLOWS TO DRIVE ADOPTION OF CUSTOM APPLICATIONS AND DATABASES
                    TABLE 52 MARKET, BY CUSTOM APPLICATION & DATABASE, 2018–2022 (USD MILLION)
                    TABLE 53 MARKET, BY CUSTOM APPLICATION & DATABASE, 2023–2028 (USD MILLION)
           6.5.2 CUSTOM DATABASE TABLES
                    TABLE 54 CUSTOM DATABASE TABLES: MARKET, BY REGION, 2018–2022 (USD MILLION)
                    TABLE 55 CUSTOM DATABASE TABLES: MARKET, BY REGION, 2023–2028 (USD MILLION)
           6.5.3 LEGACY APPLICATION DATA
                    TABLE 56 LEGACY APPLICATION DATA: MARKET, BY REGION, 2018–2022 (USD MILLION)
                    TABLE 57 LEGACY APPLICATION DATA: MARKET, BY REGION, 2023–2028 (USD MILLION)
           6.5.4 WEB APPLICATION LOGS
                    TABLE 58 WEB APPLICATION LOGS: MARKET, BY REGION, 2018–2022 (USD MILLION)
                    TABLE 59 WEB APPLICATION LOGS: MARKET, BY REGION, 2023–2028 (USD MILLION)
    6.6 WORKFLOW & BPM SYSTEMS 
           6.6.1 GROWING EMPHASIS ON STREAMLINING OPERATIONS AND BOOSTING PRODUCTIVITY FOR SUSTAINABLE BUSINESS EXPANSION TO DRIVE MARKET
                    TABLE 60 MARKET, BY WORKFLOW & BPM SYSTEM, 2018–2022 (USD MILLION)
                    TABLE 61 MARKET, BY WORKFLOW & BPM SYSTEM, 2023–2028 (USD MILLION)
           6.6.2 WORKFLOW PROCESS DATA
                    TABLE 62 WORKFLOW PROCESS DATA: PROCESS MINING MARKET, BY REGION, 2018–2022 (USD MILLION)
                    TABLE 63 WORKFLOW PROCESS DATA: MARKET, BY REGION, 2023–2028 (USD MILLION)
           6.6.3 BUSINESS PROCESS MODEL & NOTATION (BPMN) MODEL EXECUTION
                    TABLE 64 BUSINESS PROCESS MODEL & NOTATION (BPMN) MODEL EXECUTION: MARKET, BY REGION, 2018–2022 (USD MILLION)
                    TABLE 65 BUSINESS PROCESS MODEL & NOTATION (BPMN) MODEL EXECUTION: MARKET, BY REGION, 2023–2028 (USD MILLION)
           6.6.4 PROCESS WORKFLOW METRICS
                    TABLE 66 PROCESS WORKFLOW METRICS: MARKET, BY REGION, 2018–2022 (USD MILLION)
                    TABLE 67 PROCESS WORKFLOW METRICS: MARKET, BY REGION, 2023–2028 (USD MILLION)
    6.7 DOCUMENT MANAGEMENT SYSTEMS 
           6.7.1 RAPID DIGITAL TRANSFORMATION TO PROPEL GROWTH OF DOCUMENT MANAGEMENT SYSTEMS
                    TABLE 68 MARKET, BY DOCUMENT MANAGEMENT SYSTEM, 2018–2022 (USD MILLION)
                    TABLE 69 MARKET, BY DOCUMENT MANAGEMENT SYSTEM, 2023–2028 (USD MILLION)
           6.7.2 DOCUMENT WORKFLOW DATA
                    TABLE 70 DOCUMENT WORKFLOW DATA: MARKET, BY REGION, 2018–2022 (USD MILLION)
                    TABLE 71 DOCUMENT WORKFLOW DATA: MARKET, BY REGION, 2023–2028 (USD MILLION)
           6.7.3 CONTENT MANAGEMENT DATA
                    TABLE 72 CONTENT MANAGEMENT DATA: MARKET, BY REGION, 2018–2022 (USD MILLION)
                    TABLE 73 CONTENT MANAGEMENT DATA: MARKET, BY REGION, 2023–2028 (USD MILLION)
           6.7.4 DIGITAL SIGNATURE WORKFLOWS
                    TABLE 74 DIGITAL SIGNATURE WORKFLOWS: MARKET, BY REGION, 2018–2022 (USD MILLION)
                    TABLE 75 DIGITAL SIGNATURE WORKFLOWS: MARKET, BY REGION, 2023–2028 (USD MILLION)
    6.8 SUPPLY CHAIN & LOGISTICS DATA 
           6.8.1 SURGE IN ECOMMERCE AND GLOBAL TRADE TO BOOST GROWTH OF PROCESS MINING SOLUTIONS ACROSS SUPPLY CHAINS
                    TABLE 76 MARKET, BY SUPPLY CHAIN & LOGISTICS DATA, 2018–2022 (USD MILLION)
                    TABLE 77 MARKET, BY SUPPLY CHAIN & LOGISTICS DATA, 2023–2028 (USD MILLION)
           6.8.2 TRANSPORTATION & SHIPPING DATA
                    TABLE 78 TRANSPORTATION & SHIPPING DATA: PROCESS MINING MARKET, BY REGION, 2018–2022 (USD MILLION)
                    TABLE 79 TRANSPORTATION & SHIPPING DATA: MARKET, BY REGION, 2023–2028 (USD MILLION)
           6.8.3 SUPPLIER & VENDOR INTERACTIONS
                    TABLE 80 SUPPLIER & VENDOR INTERACTIONS: MARKET, BY REGION, 2018–2022 (USD MILLION)
                    TABLE 81 SUPPLIER & VENDOR INTERACTIONS: MARKET, BY REGION, 2023–2028 (USD MILLION)
           6.8.4 COLD CHAIN MONITORING DATA
                    TABLE 82 COLD CHAIN MONITORING DATA: MARKET, BY REGION, 2018–2022 (USD MILLION)
                    TABLE 83 COLD CHAIN MONITORING DATA: MARKET, BY REGION, 2023–2028 (USD MILLION)
    6.9 FINANCIAL SYSTEMS DATA 
           6.9.1 INCREASING COMPLEXITY OF FINANCIAL TRANSACTIONS TO SPUR DEMAND FOR PROCESS MINING TOOLS
                    TABLE 84 MARKET, BY FINANCIAL SYSTEMS DATA, 2018–2022 (USD MILLION)
                    TABLE 85 MARKET, BY FINANCIAL SYSTEMS DATA, 2023–2028 (USD MILLION)
           6.9.2 ACCOUNTING & FINANCIAL TRANSACTIONS
                    TABLE 86 ACCOUNTING & FINANCIAL TRANSACTIONS: MARKET, BY REGION, 2018–2022 (USD MILLION)
                    TABLE 87 ACCOUNTING & FINANCIAL TRANSACTIONS: MARKET, BY REGION, 2023–2028 (USD MILLION)
           6.9.3 EXPENSE MANAGEMENT DATA
                    TABLE 88 EXPENSE MANAGEMENT DATA: MARKET, BY REGION, 2018–2022 (USD MILLION)
                    TABLE 89 EXPENSE MANAGEMENT DATA: MARKET, BY REGION, 2023–2028 (USD MILLION)
           6.9.4 AUDIT & COMPLIANCE RECORDS
                    TABLE 90 AUDIT & COMPLIANCE RECORDS: MARKET, BY REGION, 2018–2022 (USD MILLION)
                    TABLE 91 AUDIT & COMPLIANCE RECORDS: MARKET, BY REGION, 2023–2028 (USD MILLION)
    6.10 OTHER DATA SOURCES 
           TABLE 92 OTHER DATA SOURCES: MARKET, BY REGION, 2018–2022 (USD MILLION)
           TABLE 93 OTHER DATA SOURCES: MARKET, BY REGION, 2023–2028 (USD MILLION)
 
7 PROCESS MINING MARKET, BY MINING ALGORITHM (Page No. - 175)
    7.1 INTRODUCTION 
           7.1.1 MINING ALGORITHMS: MARKET DRIVERS
                    FIGURE 37 DEEP LEARNING ALGORITHMS SEGMENT TO BE FASTEST-GROWING SEGMENT DURING FORECAST PERIOD
                    TABLE 94 MARKET, BY MINING ALGORITHM, 2018–2022 (USD MILLION)
                    TABLE 95 MARKET, BY MINING ALGORITHM, 2023–2028 (USD MILLION)
    7.2 DISCOVERY ALGORITHMS 
           7.2.1 DISCOVERY ALGORITHMS HELP ORGANIZATIONS GAIN INSIGHTS INTO OPERATIONS FOR OPTIMIZATION AND EFFICIENCY
                    TABLE 96 MARKET, BY DISCOVERY ALGORITHM, 2018–2022 (USD MILLION)
                    TABLE 97 MARKET, BY DISCOVERY ALGORITHM, 2023–2028 (USD MILLION)
           7.2.2 HEURISTIC MINING
                    TABLE 98 HEURISTIC MINING: MARKET, BY REGION, 2018–2022 (USD MILLION)
                    TABLE 99 HEURISTIC MINING: MARKET, BY REGION, 2023–2028 (USD MILLION)
                    7.2.2.1 Directly-follows Graph Discovery
                    7.2.2.2 Dependency Graph Discovery
           7.2.3 ALPHA MINER
                    TABLE 100 ALPHA MINER: PROCESS MINING MARKET, BY REGION, 2018–2022 (USD MILLION)
                    TABLE 101 ALPHA MINER: MARKET, BY REGION, 2023–2028 (USD MILLION)
                    7.2.3.1 Enhanced Heuristic Mining
                    7.2.3.2 Noise Filtering
                    7.2.3.3 Loop Handling
           7.2.4 INDUCTIVE MINER
                    TABLE 102 INDUCTIVE MINER: MARKET, BY REGION, 2018–2022 (USD MILLION)
                    TABLE 103 INDUCTIVE MINER: MARKET, BY REGION, 2023–2028 (USD MILLION)
                    7.2.4.1 Directly-follows Graph Induction
                    7.2.4.2 Log Petri Net Conversion
                    7.2.4.3 Noise Tolerance
    7.3 CONFORMANCE CHECKING ALGORITHMS 
           7.3.1 CONFORMANCE CHECKING ALGORITHMS ALIGN PROCESSES WITH INTENDED MODELS, IMPROVING PERFORMANCE AND COMPLIANCE
                    TABLE 104 MARKET, BY CONFORMANCE CHECKING ALGORITHM, 2018–2022 (USD MILLION)
                    TABLE 105 MARKET, BY CONFORMANCE CHECKING ALGORITHM, 2023–2028 (USD MILLION)
           7.3.2 TOKEN-BASED REPLAY
                    TABLE 106 TOKEN-BASED REPLAY: MARKET, BY REGION, 2018–2022 (USD MILLION)
                    TABLE 107 TOKEN-BASED REPLAY: MARKET, BY REGION, 2023–2028 (USD MILLION)
                    7.3.2.1 Token-based Replay Fitness Analysis
                    7.3.2.2 Token-based Replay Alignments
                    7.3.2.3 Token-based Replay Precision & Generalization
           7.3.3 LOG-BASED CONFORMANCE CHECKING
                    TABLE 108 LOG-BASED CONFORMANCE CHECKING: MARKET, BY REGION, 2018–2022 (USD MILLION)
                    TABLE 109 LOG-BASED CONFORMANCE CHECKING: MARKET, BY REGION, 2023–2028 (USD MILLION)
                    7.3.3.1 Deviation Detection
                    7.3.3.2 Conformance Metrics
                    7.3.3.3 Root Cause Analysis
           7.3.4 MODEL-BASED CONFORMANCE CHECKING
                    TABLE 110 MODEL-BASED CONFORMANCE CHECKING: PROCESS MINING MARKET, BY REGION, 2018–2022 (USD MILLION)
                    TABLE 111 MODEL-BASED CONFORMANCE CHECKING: MARKET, BY REGION, 2023–2028 (USD MILLION)
                    7.3.4.1 Process Model Alignment
                    7.3.4.2 Model-based Conformance Checking Fitness Analysis
                    7.3.4.3 Model-based Conformance Checking Precision & Generalization
    7.4 ENHANCEMENT & EXTENSION ALGORITHMS 
           7.4.1 ENHANCEMENT & EXTENSION ALGORITHMS REFINE EXISTING PROCESS MODELS THROUGH IMPROVED OPERATIONAL EFFECTIVENESS
                    TABLE 112 MARKET, BY ENHANCEMENT & EXTENSION ALGORITHM, 2018–2022 (USD MILLION)
                    TABLE 113 MARKET, BY ENHANCEMENT & EXTENSION ALGORITHM, 2023–2028 (USD MILLION)
           7.4.2 PROCESS SIMULATION
                    TABLE 114 PROCESS SIMULATION: MARKET, BY REGION, 2018–2022 (USD MILLION)
                    TABLE 115 PROCESS SIMULATION: MARKET, BY REGION, 2023–2028 (USD MILLION)
                    7.4.2.1 Monte Carlo Simulation
                    7.4.2.2 Process Variability Analysis
                    7.4.2.3 What-If-Analysis
           7.4.3 RECOMMENDATION ALGORITHMS
                    TABLE 116 RECOMMENDATION ALGORITHMS: MARKET, BY REGION, 2018–2022 (USD MILLION)
                    TABLE 117 RECOMMENDATION ALGORITHMS: MARKET, BY REGION, 2023–2028 (USD MILLION)
                    7.4.3.1 Process Optimization Recommendations
                    7.4.3.2 Resource Allocation Recommendations
                    7.4.3.3 Compliance Improvement Guidance
           7.4.4 PREDICTIVE ANALYTICS ALGORITHMS
                    TABLE 118 PREDICTIVE ANALYTICS ALGORITHMS: MARKET, BY REGION, 2018–2022 (USD MILLION)
                    TABLE 119 PREDICTIVE ANALYTICS ALGORITHMS: MARKET, BY REGION, 2023–2028 (USD MILLION)
                    7.4.4.1 Machine Learning for Process Predictions
                    7.4.4.2 Predictive KPI Monitoring
    7.5 CLUSTERING & CLASSIFICATION ALGORITHMS 
           7.5.1 CLUSTERING & CLASSIFICATION ALGORITHMS ENABLE BETTER RESOURCE ALLOCATION AND INFORMED DECISION-MAKING
                    TABLE 120 MARKET, BY CLUSTERING & CLASSIFICATION ALGORITHM, 2018–2022 (USD MILLION)
                    TABLE 121 MARKET, BY CLUSTERING & CLASSIFICATION ALGORITHM, 2023–2028 (USD MILLION)
           7.5.2 PROCESS INSTANCE CLUSTERING
                    TABLE 122 PROCESS INSTANCE CLUSTERING: PROCESS MINING MARKET, BY REGION, 2018–2022 (USD MILLION)
                    TABLE 123 PROCESS INSTANCE CLUSTERING: MARKET, BY REGION, 2023–2028 (USD MILLION)
                    7.5.2.1 Similarity Measures
                    7.5.2.2 Hierarchical Clustering
                    7.5.2.3 K-Means Clustering
           7.5.3 PROCESS VARIANT CLASSIFICATION
                    TABLE 124 PROCESS VARIANT CLASSIFICATION: MARKET, BY REGION, 2018–2022 (USD MILLION)
                    TABLE 125 PROCESS VARIANT CLASSIFICATION: MARKET, BY REGION, 2023–2028 (USD MILLION)
                    7.5.3.1 Decision Tree Classification
                    7.5.3.2 Naive Bayes Classification
                    7.5.3.3 Support Vector Machines (SVM)
           7.5.4 ANOMALY DETECTION
                    TABLE 126 ANOMALY DETECTION: MARKET, BY REGION, 2018–2022 (USD MILLION)
                    TABLE 127 ANOMALY DETECTION: MARKET, BY REGION, 2023–2028 (USD MILLION)
                    7.5.4.1 Statistical Anomaly Detection
                    7.5.4.2 Isolation Forest
                    7.5.4.3 Autoencoders for Sequence Anomalies
    7.6 SEQUENCE ANALYSIS ALGORITHMS 
           7.6.1 SEQUENCE ANALYSIS ALGORITHMS ENABLE BUSINESSES TO IMPROVE SEQUENCING OF CRUCIAL PROCESSES FOR INCREASED EFFICIENCY
                    TABLE 128 MARKET, BY SEQUENCE ANALYSIS ALGORITHM, 2018–2022 (USD MILLION)
                    TABLE 129 MARKET, BY SEQUENCE ANALYSIS ALGORITHM, 2023–2028 (USD MILLION)
           7.6.2 SEQUENTIAL PATTERN MINING
                    TABLE 130 SEQUENTIAL PATTERN MINING: MARKET, BY REGION, 2018–2022 (USD MILLION)
                    TABLE 131 SEQUENTIAL PATTERN MINING: MARKET, BY REGION, 2023–2028 (USD MILLION)
                    7.6.2.1 Frequent Sequential Pattern Discovery
                    7.6.2.2 Parallel Sequence Mining
           7.6.3 SEQUENCE ALIGNMENT
                    TABLE 132 SEQUENCE ALIGNMENT: PROCESS MINING MARKET, BY REGION, 2018–2022 (USD MILLION)
                    TABLE 133 SEQUENCE ALIGNMENT: MARKET, BY REGION, 2023–2028 (USD MILLION)
                    7.6.3.1 Event Log Sequence Alignment
                    7.6.3.2 Sequence Edit Distance Metrics
                    7.6.3.3 Sequence Clustering
           7.6.4 PROCESS PATH ANALYSIS
                    TABLE 134 PROCESS PATH ANALYSIS: MARKET, BY REGION, 2018–2022 (USD MILLION)
                    TABLE 135 PROCESS PATH ANALYSIS: MARKET, BY REGION, 2023–2028 (USD MILLION)
                    7.6.4.1 Path Frequency Analysis
                    7.6.4.2 Process Path Abstraction
                    7.6.4.3 Critical Path Identification
    7.7 DEEP LEARNING ALGORITHMS 
           7.7.1 DEEP LEARNING ALGORITHMS LEVERAGE NEURAL NETWORKS TO ENHANCE PREDICTIVE CAPABILITIES AND OPERATIONAL INTELLIGENCE
                    TABLE 136 MARKET, BY DEEP LEARNING FOR PROCESS MINING, 2018–2022 (USD MILLION)
                    TABLE 137 MARKET, BY DEEP LEARNING FOR PROCESS MINING, 2023–2028 (USD MILLION)
           7.7.2 RECURRENT NEURAL NETWORKS (RNN)
                    TABLE 138 RECURRENT NEURAL NETWORKS: MARKET, BY REGION, 2018–2022 (USD MILLION)
                    TABLE 139 RECURRENT NEURAL NETWORKS: MARKET, BY REGION, 2023–2028 (USD MILLION)
                    7.7.2.1 LSTM-based Process Analysis
                    7.7.2.2 GRU-based Sequence Modeling
                    7.7.2.3 Event Sequence Prediction
           7.7.3 TRANSFORMER MODELS
                    TABLE 140 TRANSFORMER MODELS: MARKET, BY REGION, 2018–2022 (USD MILLION)
                    TABLE 141 TRANSFORMER MODELS: MARKET, BY REGION, 2023–2028 (USD MILLION)
                    7.7.3.1 Attention-based Process Analysis
                    7.7.3.2 Transformer-XL for Long Sequences
                    7.7.3.3 Process Text Mining
           7.7.4 GRAPH NEURAL NETWORKS (GNN)
                    TABLE 142 GRAPH NEURAL NETWORKS: PROCESS MINING MARKET, BY REGION, 2018–2022 (USD MILLION)
                    TABLE 143 GRAPH NEURAL NETWORKS: MARKET, BY REGION, 2023–2028 (USD MILLION)
                    7.7.4.1 Graph-based Process Analysis
                    7.7.4.2 Graph Attention Networks (GAT)
                    7.7.4.3 GNNs for Process Prediction
    7.8 TEMPORAL PROCESS MINING ALGORITHMS 
           7.8.1 GROWING FOCUS ON TIMING AND DURATION OF PROCESS EVENTS AND OPTIMIZING TIMING-BASED PROCESSES TO DRIVE GROWTH
                    TABLE 144 MARKET, BY TEMPORAL PROCESS MINING ALGORITHM, 2018–2022 (USD MILLION)
                    TABLE 145 MARKET, BY TEMPORAL PROCESS MINING ALGORITHM, 2023–2028 (USD MILLION)
           7.8.2 TEMPORAL PATTERN DISCOVERY
                    TABLE 146 TEMPORAL PATTERN DISCOVERY: MARKET, BY REGION, 2018–2022 (USD MILLION)
                    TABLE 147 TEMPORAL PATTERN DISCOVERY: MARKET, BY REGION, 2023–2028 (USD MILLION)
                    7.8.2.1 Time Interval-based Patterns
                    7.8.2.2 Temporal Rules and Constraints
                    7.8.2.3 Duration Analysis
           7.8.3 TIME SERIES ANALYSIS
                    TABLE 148 TIME SERIES ANALYSIS: MARKET, BY REGION, 2018–2022 (USD MILLION)
                    TABLE 149 TIME SERIES ANALYSIS: MARKET, BY REGION, 2023–2028 (USD MILLION)
                    7.8.3.1 Event Log Time Series Analysis
                    7.8.3.2 Process Event Forecasting
                    7.8.3.3 Time-related Process Insights
    7.9 OTHER MINING ALGORITHMS 
           TABLE 150 OTHER MINING ALGORITHMS: MARKET, BY REGION, 2018–2022 (USD MILLION)
           TABLE 151 OTHER MINING ALGORITHMS: MARKET, BY REGION, 2023–2028 (USD MILLION)
 
8 PROCESS MINING MARKET, BY OFFERING (Page No. - 226)
    8.1 INTRODUCTION 
           8.1.1 OFFERINGS: MARKET DRIVERS
                    FIGURE 38 SERVICES SEGMENT TO REGISTER HIGHER CAGR DURING FORECAST PERIOD
                    TABLE 152 MARKET, BY OFFERING, 2018–2022 (USD MILLION)
                    TABLE 153 MARKET, BY OFFERING, 2023–2028 (USD MILLION)
    8.2 SOFTWARE 
           FIGURE 39 CONTINUOUS MONITORING & ANALYTICS TOOLS SEGMENT TO LEAD MARKET IN 2023
           TABLE 154 MARKET, BY SOFTWARE, 2018–2022 (USD MILLION)
           TABLE 155 MARKET, BY SOFTWARE, 2023–2028 (USD MILLION)
           8.2.1 PROCESS DISCOVERY TOOLS
                    8.2.1.1 Process discovery tools empower organizations to enhance and streamline their processes
                               TABLE 156 MARKET, BY PROCESS DISCOVERY TOOL, 2018–2022 (USD MILLION)
                               TABLE 157 MARKET, BY PROCESS DISCOVERY TOOL, 2023–2028 (USD MILLION)
                    8.2.1.2 Event Log-based Discovery
                               TABLE 158 EVENT LOG-BASED DISCOVERY: PROCESS MINING MARKET, BY REGION, 2018–2022 (USD MILLION)
                               TABLE 159 EVENT LOG-BASED DISCOVERY: MARKET, BY REGION, 2023–2028 (USD MILLION)
                               8.2.1.2.1 Automated Discovery
                               8.2.1.2.2 Interactive Discovery
                               8.2.1.2.3 Log Filtering and Preprocessing
                    8.2.1.3 Process Map-based Discovery
                               TABLE 160 PROCESS MAP-BASED DISCOVERY: MARKET, BY REGION, 2018–2022 (USD MILLION)
                               TABLE 161 PROCESS MAP-BASED DISCOVERY: MARKET, BY REGION, 2023–2028 (USD MILLION)
                               8.2.1.3.1 Flowchart Generation
                               8.2.1.3.2 Process Map Visualization
           8.2.2 CONFORMANCE CHECKING TOOLS
                    8.2.2.1 Conformance checking tools bridge gap between theoretical models and actual operational realities
                               TABLE 162 MARKET, BY CONFORMANCE CHECKING TOOL, 2018–2022 (USD MILLION)
                               TABLE 163 MARKET, BY CONFORMANCE CHECKING TOOL, 2023–2028 (USD MILLION)
                    8.2.2.2 Model-checking Conformance
                               TABLE 164 MODEL-CHECKING CONFORMANCE: MARKET, BY REGION, 2018–2022 (USD MILLION)
                               TABLE 165 MODEL-CHECKING CONFORMANCE: MARKET, BY REGION, 2023–2028 (USD MILLION)
                               8.2.2.2.1 Direct Model Comparison
                               8.2.2.2.2 Statistical Model Checking
                               8.2.2.2.3 Automated Rule-based Conformance
                    8.2.2.3 Log-based Conformance
                               TABLE 166 LOG-BASED CONFORMANCE: PROCESS MINING MARKET, BY REGION, 2018–2022 (USD MILLION)
                               TABLE 167 LOG-BASED CONFORMANCE: MARKET, BY REGION, 2023–2028 (USD MILLION)
                               8.2.2.3.1 Deviation Detection
                               8.2.2.3.2 Anomaly Detection
                               8.2.2.3.3 Root Cause Analysis
           8.2.3 PROCESS ENHANCEMENT AND SIMULATION TOOLS
                    8.2.3.1 Need for fostering process enhancement and simulation to drive market growth
                               TABLE 168 MARKET, BY PROCESS ENHANCEMENT AND SIMULATION TOOL, 2018–2022 (USD MILLION)
                               TABLE 169 MARKET, BY PROCESS ENHANCEMENT AND SIMULATION TOOL, 2023–2028 (USD MILLION)
                    8.2.3.2 Simulation & Optimization
                               TABLE 170 SIMULATION & OPTIMIZATION: MARKET, BY REGION, 2018–2022 (USD MILLION)
                               TABLE 171 SIMULATION & OPTIMIZATION: MARKET, BY REGION, 2023–2028 (USD MILLION)
                               8.2.3.2.1 Process Simulation
                               8.2.3.2.2 What-If Analysis
                               8.2.3.2.3 Optimization Algorithms
                    8.2.3.3 Process Enhancement & Automation
                               TABLE 172 PROCESS ENHANCEMENT & AUTOMATION: MARKET, BY REGION, 2018–2022 (USD MILLION)
                               TABLE 173 PROCESS ENHANCEMENT & AUTOMATION: MARKET, BY REGION, 2023–2028 (USD MILLION)
                               8.2.3.3.1 Recommendation Engine
                               8.2.3.3.2 Automation Integration
                               8.2.3.3.3 Process Redesign Tools
           8.2.4 PERFORMANCE ANALYSIS TOOLS
                    8.2.4.1 Performance analysis tools enable businesses to gain valuable insights into efficiency and effectiveness of operational processes
                               TABLE 174 MARKET, BY PERFORMANCE ANALYSIS TOOL, 2018–2022 (USD MILLION)
                               TABLE 175 MARKET, BY PERFORMANCE ANALYSIS TOOL, 2023–2028 (USD MILLION)
                    8.2.4.2 Performance Metrics
                               TABLE 176 PERFORMANCE METRICS: PROCESS MINING MARKET, BY REGION, 2018–2022 (USD MILLION)
                               TABLE 177 PERFORMANCE METRICS: MARKET, BY REGION, 2023–2028 (USD MILLION)
                               8.2.4.2.1 Key Performance Indicator (KPI) Tracking
                               8.2.4.2.2 Process Efficiency Analysis
                               8.2.4.2.3 Bottleneck Identification
                    8.2.4.3 Performance Visualization
                               TABLE 178 PERFORMANCE VISUALIZATION: MARKET, BY REGION, 2018–2022 (USD MILLION)
                               TABLE 179 PERFORMANCE VISUALIZATION: MARKET, BY REGION, 2023–2028 (USD MILLION)
                               8.2.4.3.1 Real-time Performance Dashboard
                               8.2.4.3.2 Historical Performance Trends
                               8.2.4.3.3 Performance Benchmarking
           8.2.5 VISUALIZATION TOOLS
                    8.2.5.1 Growing need for businesses to transform complex data into actionable insights to spur demand
                               TABLE 180 MARKET, BY VISUALIZATION TOOL, 2018–2022 (USD MILLION)
                               TABLE 181 MARKET, BY VISUALIZATION TOOL, 2023–2028 (USD MILLION)
                    8.2.5.2 Process Visualization
                               TABLE 182 PROCESS VISUALIZATION: MARKET, BY REGION, 2018–2022 (USD MILLION)
                               TABLE 183 PROCESS VISUALIZATION: MARKET, BY REGION, 2023–2028 (USD MILLION)
                               8.2.5.2.1 Interactive Process Maps
                               8.2.5.2.2 Process Flowcharts
                               8.2.5.2.3 Heatmaps & Sankey Diagrams
                    8.2.5.3 Data Visualization
                               TABLE 184 DATA VISUALIZATION: PROCESS MINING MARKET, BY REGION, 2018–2022 (USD MILLION)
                               TABLE 185 DATA VISUALIZATION: MARKET, BY REGION, 2023–2028 (USD MILLION)
                               8.2.5.3.1 Data Dashboards
                               8.2.5.3.2 Custom Data Visualizations
                               8.2.5.3.3 Data Exploration Tools
           8.2.6 CONTINUOUS MONITORING & ANALYTICS TOOLS
                    8.2.6.1 Need for companies to drive proactive and strategic decision-making to boost adoption of continuous monitoring & analytics tools
                               TABLE 186 MARKET, BY CONTINUOUS MONITORING & ANALYTICS TOOL, 2018–2022 (USD MILLION)
                               TABLE 187 MARKET, BY CONTINUOUS MONITORING & ANALYTICS TOOL, 2023–2028 (USD MILLION)
                    8.2.6.2 Real-time Monitoring
                               TABLE 188 REAL-TIME MONITORING: MARKET, BY REGION, 2018–2022 (USD MILLION)
                               TABLE 189 REAL-TIME MONITORING: MARKET, BY REGION, 2023–2028 (USD MILLION)
                               8.2.6.2.1 Continuous Event Stream Analytics
                               8.2.6.2.2 Real-time Process Tracking
                               8.2.6.2.3 Alerting & Notification
                    8.2.6.3 Historical Analytics
                               TABLE 190 HISTORICAL ANALYTICS: MARKET, BY REGION, 2018–2022 (USD MILLION)
                               TABLE 191 HISTORICAL ANALYTICS: MARKET, BY REGION, 2023–2028 (USD MILLION)
                               8.2.6.3.1 Trend Analysis
                               8.2.6.3.2 Root Cause Analysis
                               8.2.6.3.3 Historical Process Performance Reports
                    8.2.6.4 Predictive Analytics
                               TABLE 192 PREDICTIVE ANALYTICS: PROCESS MINING MARKET, BY REGION, 2018–2022 (USD MILLION)
                               TABLE 193 PREDICTIVE ANALYTICS: MARKET, BY REGION, 2023–2028 (USD MILLION)
                               8.2.6.4.1 Machine Learning Models
                               8.2.6.4.2 Predictive KPI Forecasting
                    8.2.6.5 Advanced Prediction Models
                               TABLE 194 ADVANCED PREDICTION MODELS: MARKET, BY REGION, 2018–2022 (USD MILLION)
                               TABLE 195 ADVANCED PREDICTION MODELS: MARKET, BY REGION, 2023–2028 (USD MILLION)
                               8.2.6.5.1 Complex Event Processing
                               8.2.6.5.2 Time Series Forecasting
           8.2.7 INTEGRATION & COLLABORATION TOOLS
                    8.2.7.1 Growing demand among organizations to enhance efficiency and foster seamless communication to spur growth
                               TABLE 196 MARKET, BY INTEGRATION & COLLABORATION TOOL, 2018–2022 (USD MILLION)
                               TABLE 197 MARKET, BY INTEGRATION & COLLABORATION TOOL, 2023–2028 (USD MILLION)
                    8.2.7.2 Data Integration
                               TABLE 198 DATA INTEGRATION: MARKET, BY REGION, 2018–2022 (USD MILLION)
                               TABLE 199 DATA INTEGRATION: MARKET, BY REGION, 2023–2028 (USD MILLION)
                               8.2.7.2.1 Data Source Integration
                               8.2.7.2.2 API & Data Connector Support
                               8.2.7.2.3 Data Transformation & Mapping
                    8.2.7.3 Collaboration Tools
                               TABLE 200 COLLABORATION TOOLS: PROCESS MINING MARKET, BY REGION, 2018–2022 (USD MILLION)
                               TABLE 201 COLLABORATION TOOLS: MARKET, BY REGION, 2023–2028 (USD MILLION)
                               8.2.7.3.1 Workflow Collaboration
                               8.2.7.3.2 Team Collaboration
                               8.2.7.3.3 Process Documentation & Sharing
           8.2.8 OTHER SOFTWARE SOLUTIONS
                    TABLE 202 OTHER SOFTWARE SOLUTIONS: MARKET, BY REGION, 2018–2022 (USD MILLION)
                    TABLE 203 OTHER SOFTWARE SOLUTIONS: MARKET, BY REGION, 2023–2028 (USD MILLION)
    8.3 SERVICES 
           FIGURE 40 MANAGED SERVICES SEGMENT TO REGISTER HIGHER CAGR DURING FORECAST PERIOD
           TABLE 204 MARKET, BY SERVICE, 2018–2022 (USD MILLION)
           TABLE 205 MARKET, BY SERVICE, 2023–2028 (USD MILLION)
           8.3.1 PROFESSIONAL SERVICES
                    8.3.1.1 Professional services offer specialized expertise for seamless integration of process mining tools
                               FIGURE 41 SYSTEM INTEGRATION & IMPLEMENTATION SEGMENT TO ACCOUNT FOR LARGEST SHARE BY 2028
                               TABLE 206 PROFESSIONAL SERVICES: MARKET, BY REGION, 2018–2022 (USD MILLION)
                               TABLE 207 PROFESSIONAL SERVICES: MARKET, BY REGION, 2023–2028 (USD MILLION)
                               8.3.1.1.1 System Integration & Implementation Services
                               8.3.1.1.2 Support & Maintenance Services
                               8.3.1.1.3 Training & Consulting Services
           8.3.2 MANAGED SERVICES
                    8.3.2.1 Managed services provide end-to-end management of process mining, helping businesses focus on core competencies
                               TABLE 208 MANAGED SERVICES: MARKET, BY REGION, 2018–2022 (USD MILLION)
                               TABLE 209 MANAGED SERVICES: MARKET, BY REGION, 2023–2028 (USD MILLION)
 
9 PROCESS MINING MARKET, BY VERTICAL (Page No. - 276)
    9.1 INTRODUCTION 
           9.1.1 VERTICALS: MARKET DRIVERS
                    FIGURE 42 MANUFACTURING SEGMENT TO GROW AT HIGHEST CAGR DURING FORECAST PERIOD
                    TABLE 210 MARKET, BY VERTICAL, 2018–2022 (USD MILLION)
                    TABLE 211 MARKET, BY VERTICAL, 2023–2028 (USD MILLION)
    9.2 BFSI 
           9.2.1 FOCUS ON TRANSFORMING BFSI LANDSCAPE WITH OPERATIONAL EXCELLENCE TO DRIVE GROWTH
                    TABLE 212 MARKET, BY BFSI APPLICATION, 2018–2022 (USD MILLION)
                    TABLE 213 MARKET, BY BFSI APPLICATION, 2023–2028 (USD MILLION)
                    9.2.1.1 Loan Origination & Underwriting
                               TABLE 214 LOAN ORIGINATION & UNDERWRITING: PROCESS MINING MARKET, BY REGION, 2018–2022 (USD MILLION)
                               TABLE 215 LOAN ORIGINATION & UNDERWRITING: MARKET, BY REGION, 2023–2028 (USD MILLION)
                               9.2.1.1.1 Credit Risk Assessment
                               9.2.1.1.2 Mortgage Approval Process
                               9.2.1.1.3 Loan Document Verification
                    9.2.1.2 Fraud Detection & Prevention
                               TABLE 216 FRAUD DETECTION & PREVENTION: MARKET, BY REGION, 2018–2022 (USD MILLION)
                               TABLE 217 FRAUD DETECTION & PREVENTION: MARKET, BY REGION, 2023–2028 (USD MILLION)
                               9.2.1.2.1 Transaction Fraud Analysis
                               9.2.1.2.2 Identity Theft Detection
                               9.2.1.2.3 Anti-money Laundering (AML)
                    9.2.1.3 Customer Onboarding & KYC
                               TABLE 218 CUSTOMER ONBOARDING & KYC: MARKET, BY REGION, 2018–2022 (USD MILLION)
                               TABLE 219 CUSTOMER ONBOARDING & KYC: MARKET, BY REGION, 2023–2028 (USD MILLION)
                               9.2.1.3.1 Customer Due Diligence
                               9.2.1.3.2 KYC Process Efficiency
                               9.2.1.3.3 Compliance Monitoring
                    9.2.1.4 Claims Processing
                               TABLE 220 CLAIMS PROCESSING: MARKET, BY REGION, 2018–2022 (USD MILLION)
                               TABLE 221 CLAIMS PROCESSING: MARKET, BY REGION, 2023–2028 (USD MILLION)
                               9.2.1.4.1 Insurance Claims Verification
                               9.2.1.4.2 Claims Settlement Efficiency
                               9.2.1.4.3 Fraudulent Claims Detection
                    9.2.1.5 Others
                               TABLE 222 OTHER BFSI APPLICATIONS: PROCESS MINING MARKET, BY REGION, 2018–2022 (USD MILLION)
                               TABLE 223 OTHER BFSI APPLICATIONS: MARKET, BY REGION, 2023–2028 (USD MILLION)
    9.3 MANUFACTURING 
           9.3.1 PROCESS MINING OFFERS COMPREHENSIVE VIEW OF ENTIRE PRODUCTION CHAIN IN MANUFACTURING SECTOR
                    TABLE 224 MARKET, BY MANUFACTURING APPLICATION, 2018–2022 (USD MILLION)
                    TABLE 225 MARKET, BY MANUFACTURING APPLICATION, 2023–2028 (USD MILLION)
                    9.3.1.1 Production Optimization
                               TABLE 226 PRODUCTION OPTIMIZATION: MARKET, BY REGION, 2018–2022 (USD MILLION)
                               TABLE 227 PRODUCTION OPTIMIZATION: MARKET, BY REGION, 2023–2028 (USD MILLION)
                               9.3.1.1.1 Production Line Efficiency
                               9.3.1.1.2 Workforce Productivity
                               9.3.1.1.3 Equipment Utilization
                    9.3.1.2 Quality Control & Assurance
                               TABLE 228 QUALITY CONTROL & ASSURANCE: MARKET, BY REGION, 2018–2022 (USD MILLION)
                               TABLE 229 QUALITY CONTROL & ASSURANCE: MARKET, BY REGION, 2023–2028 (USD MILLION)
                               9.3.1.2.1 Defect Detection & Prevention
                               9.3.1.2.2 Compliance Monitoring
                               9.3.1.2.3 Root Cause Analysis
                    9.3.1.3 Supply Chain Management
                               TABLE 230 SUPPLY CHAIN MANAGEMENT: MARKET, BY REGION, 2018–2022 (USD MILLION)
                               TABLE 231 SUPPLY CHAIN MANAGEMENT: MARKET, BY REGION, 2023–2028 (USD MILLION)
                               9.3.1.3.1 Inventory Optimization
                               9.3.1.3.2 Supplier Performance Analysis
                               9.3.1.3.3 Demand Forecasting & Planning
                    9.3.1.4 Maintenance & Reliability
                               TABLE 232 MAINTENANCE & RELIABILITY: PROCESS MINING MARKET, BY REGION, 2018–2022 (USD MILLION)
                               TABLE 233 MAINTENANCE & RELIABILITY: MARKET, BY REGION, 2023–2028 (USD MILLION)
                               9.3.1.4.1 Predictive Maintenance
                               9.3.1.4.2 Asset Utilization Analysis
                               9.3.1.4.3 Downtime Reduction
                    9.3.1.5 Others
                               TABLE 234 OTHER MANUFACTURING APPLICATIONS: MARKET, BY REGION, 2018–2022 (USD MILLION)
                               TABLE 235 OTHER MANUFACTURING APPLICATIONS: MARKET, BY REGION, 2023–2028 (USD MILLION)
    9.4 IT & ITES 
           9.4.1 EMPHASIS ON EMPOWERING ORGANIZATIONS TO NAVIGATE COMPLEXITIES OF IT SERVICE DELIVERY TO BOOST GROWTH
                    TABLE 236 MARKET, BY IT & ITES APPLICATION, 2018–2022 (USD MILLION)
                    TABLE 237 MARKET, BY IT & ITES APPLICATION, 2023–2028 (USD MILLION)
                    9.4.1.1 Software Development Lifecycle (SDLC) Analysis
                               TABLE 238 SOFTWARE DEVELOPMENT LIFECYCLE ANALYSIS: MARKET, BY REGION, 2018–2022 (USD MILLION)
                               TABLE 239 SOFTWARE DEVELOPMENT LIFECYCLE ANALYSIS: MARKET, BY REGION, 2023–2028 (USD MILLION)
                               9.4.1.1.1 Code Review & Optimization
                               9.4.1.1.2 Bug & Issue Tracking
                               9.4.1.1.3 Release Cycle Efficiency
                    9.4.1.2 IT Help & Desk Support
                               TABLE 240 IT HELP & DESK SUPPORT: MARKET, BY REGION, 2018–2022 (USD MILLION)
                               TABLE 241 IT HELP & DESK SUPPORT: MARKET, BY REGION, 2023–2028 (USD MILLION)
                               9.4.1.2.1 Ticket Resolution Time Analysis
                               9.4.1.2.2 Incident Trends & Patterns
                               9.4.1.2.3 Service Level Agreement (SLA) Compliance
                    9.4.1.3 IT Infrastructure Management
                               TABLE 242 IT INFRASTRUCTURE MANAGEMENT: MARKET, BY REGION, 2018–2022 (USD MILLION)
                               TABLE 243 IT INFRASTRUCTURE MANAGEMENT: MARKET, BY REGION, 2023–2028 (USD MILLION)
                               9.4.1.3.1 Network Performance Monitoring
                               9.4.1.3.2 Server Resource Utilization
                               9.4.1.3.3 IT Asset Inventory
                    9.4.1.4 Cybersecurity & Threat Detection
                               TABLE 244 CYBERSECURITY & THREAT DETECTION: PROCESS MINING MARKET, BY REGION, 2018–2022 (USD MILLION)
                               TABLE 245 CYBERSECURITY & THREAT DETECTION: MARKET, BY REGION, 2023–2028 (USD MILLION)
                               9.4.1.4.1 Intrusion Detection & Response
                               9.4.1.4.2 Security Incident Analysis
                               9.4.1.4.3 Compliance With Security Policies
                    9.4.1.5 Others
                               TABLE 246 OTHER IT & ITES APPLICATIONS: MARKET, BY REGION, 2018–2022 (USD MILLION)
                               TABLE 247 OTHER IT & ITES APPLICATIONS: MARKET, BY REGION, 2023–2028 (USD MILLION)
    9.5 HEALTHCARE & LIFE SCIENCES 
           9.5.1 NEED FOR IMPROVING PATIENT CARE AND DRIVING INNOVATION TO SPUR ADOPTION OF PROCESS MINING SERVICES
                    TABLE 248 MARKET, BY HEALTHCARE & LIFE SCIENCES APPLICATION, 2018–2022 (USD MILLION)
                    TABLE 249 MARKET, BY HEALTHCARE & LIFE SCIENCES APPLICATION, 2023–2028 (USD MILLION)
                    9.5.1.1 Patient Care & Hospital Management
                               TABLE 250 PATIENT CARE & HOSPITAL MANAGEMENT: MARKET, BY REGION, 2018–2022 (USD MILLION)
                               TABLE 251 PATIENT CARE & HOSPITAL MANAGEMENT: MARKET, BY REGION, 2023–2028 (USD MILLION)
                               9.5.1.1.1 Patient Journey Analysis
                               9.5.1.1.2 Resource Allocation Optimization
                               9.5.1.1.3 Billing & Claims Processing
                    9.5.1.2 Clinical Trials Optimization
                               TABLE 252 CLINICAL TRIALS OPTIMIZATION: MARKET, BY REGION, 2018–2022 (USD MILLION)
                               TABLE 253 CLINICAL TRIALS OPTIMIZATION: MARKET, BY REGION, 2023–2028 (USD MILLION)
                               9.5.1.2.1 Trial Enrollment Efficiency
                               9.5.1.2.2 Adverse Event Analysis
                               9.5.1.2.3 Drug Development Timelines
                    9.5.1.3 Electronic Health Records (EHR) Analysis
                               TABLE 254 ELECTRONIC HEALTH RECORDS ANALYSIS: PROCESS MINING MARKET, BY REGION, 2018–2022 (USD MILLION)
                               TABLE 255 ELECTRONIC HEALTH RECORDS ANALYSIS: MARKET, BY REGION, 2023–2028 (USD MILLION)
                               9.5.1.3.1 EHR Data Accuracy
                               9.5.1.3.2 Regulatory Compliance
                               9.5.1.3.3 Patient Outcome Improvement
                    9.5.1.4 Supply Chain & Pharmaceutical Manufacturing
                               TABLE 256 SUPPLY CHAIN & PHARMACEUTICAL MANUFACTURING: MARKET, BY REGION, 2018–2022 (USD MILLION)
                               TABLE 257 SUPPLY CHAIN & PHARMACEUTICAL MANUFACTURING: MARKET, BY REGION, 2023–2028 (USD MILLION)
                               9.5.1.4.1 Pharmaceutical Production Optimization
                               9.5.1.4.2 Drug Traceability
                               9.5.1.4.3 Inventory Management
                    9.5.1.5 Others
                               TABLE 258 OTHER HEALTHCARE APPLICATIONS: MARKET, BY REGION, 2018–2022 (USD MILLION)
                               TABLE 259 OTHER HEALTHCARE APPLICATIONS: MARKET, BY REGION, 2023–2028 (USD MILLION)
    9.6 RETAIL & ECOMMERCE 
           9.6.1 RISING IMPORTANCE OF IDENTIFYING CUSTOMER PATTERNS AND PREFERENCES TO PROPEL MARKET
                    TABLE 260 MARKET, BY RETAIL & ECOMMERCE APPLICATION, 2018–2022 (USD MILLION)
                    TABLE 261 MARKET, BY RETAIL & ECOMMERCE APPLICATION, 2023–2028 (USD MILLION)
                    9.6.1.1 Customer Experience Enhancement
                               TABLE 262 CUSTOMER EXPERIENCE ENHANCEMENT: MARKET, BY REGION, 2018–2022 (USD MILLION)
                               TABLE 263 CUSTOMER EXPERIENCE ENHANCEMENT: MARKET, BY REGION, 2023–2028 (USD MILLION)
                               9.6.1.1.1 Customer Journey Mapping
                               9.6.1.1.2 Personalization & Recommendations
                               9.6.1.1.3 Cart Abandonment Analysis
                    9.6.1.2 Inventory & Stock Management
                               TABLE 264 INVENTORY & STOCK MANAGEMENT: PROCESS MINING MARKET, BY REGION, 2018–2022 (USD MILLION)
                               TABLE 265 INVENTORY & STOCK MANAGEMENT: MARKET, BY REGION, 2023–2028 (USD MILLION)
                               9.6.1.2.1 Stock-level Optimization
                               9.6.1.2.2 Stock Demand Forecasting
                               9.6.1.2.3 Shelf Space Optimization
                    9.6.1.3 Order Fulfillment & Logistics
                               TABLE 266 ORDER FULFILLMENT & LOGISTICS: MARKET, BY REGION, 2018–2022 (USD MILLION)
                               TABLE 267 ORDER FULFILLMENT & LOGISTICS: MARKET, BY REGION, 2023–2028 (USD MILLION)
                               9.6.1.3.1 Order Process Efficiency
                               9.6.1.3.2 Delivery Time Optimization
                               9.6.1.3.3 Returns Management
                    9.6.1.4 Pricing & Promotion Strategy
                               TABLE 268 PRICING & PROMOTION STRATEGY: MARKET, BY REGION, 2018–2022 (USD MILLION)
                               TABLE 269 PRICING & PROMOTION STRATEGY: MARKET, BY REGION, 2023–2028 (USD MILLION)
                               9.6.1.4.1 Dynamic Pricing Analysis
                               9.6.1.4.2 Promotion Effectiveness
                               9.6.1.4.3 Profit Margin Optimization
                    9.6.1.5 Others
                               TABLE 270 OTHER RETAIL & ECOMMERCE APPLICATIONS: MARKET, BY REGION, 2018–2022 (USD MILLION)
                               TABLE 271 OTHER RETAIL & ECOMMERCE APPLICATIONS: MARKET, BY REGION, 2023–2028 (USD MILLION)
    9.7 ENERGY & UTILITIES 
           9.7.1 PROCESS MINING ENHANCES SUPPLY CHAIN AND MAINTENANCE PROCEDURES IN ENERGY & UTILITIES SECTOR
                    TABLE 272 MARKET, BY ENERGY & UTILITIES APPLICATION, 2018–2022 (USD MILLION)
                    TABLE 273 MARKET, BY ENERGY & UTILITIES APPLICATION, 2023–2028 (USD MILLION)
                    9.7.1.1 Energy Consumption Analysis
                               TABLE 274 ENERGY CONSUMPTION ANALYSIS: PROCESS MINING MARKET, BY REGION, 2018–2022 (USD MILLION)
                               TABLE 275 ENERGY CONSUMPTION ANALYSIS: MARKET, BY REGION, 2023–2028 (USD MILLION)
                               9.7.1.1.1 Energy Efficiency Improvement
                               9.7.1.1.2 Energy Demand Forecasting
                               9.7.1.1.3 Renewable Energy Integration
                    9.7.1.2 Asset Management & Predictive Maintenance
                               TABLE 276 ASSET MANAGEMENT & PREDICTIVE MAINTENANCE: MARKET, BY REGION, 2018–2022 (USD MILLION)
                               TABLE 277 ASSET MANAGEMENT & PREDICTIVE MAINTENANCE: MARKET, BY REGION, 2023–2028 (USD MILLION)
                               9.7.1.2.1 Equipment Reliability Analysis
                               9.7.1.2.2 Asset Performance Optimization
                               9.7.1.2.3 Grid Resilience Enhancement
                    9.7.1.3 Grid & Distribution Optimization
                               TABLE 278 GRID & DISTRIBUTION OPTIMIZATION: MARKET, BY REGION, 2018–2022 (USD MILLION)
                               TABLE 279 GRID & DISTRIBUTION OPTIMIZATION: MARKET, BY REGION, 2023–2028 (USD MILLION)
                               9.7.1.3.1 Grid Performance Analysis
                               9.7.1.3.2 Distribution Network Efficiency
                               9.7.1.3.3 Smart Grid Implementation
                    9.7.1.4 Environmental Compliance
                               TABLE 280 ENVIRONMENTAL COMPLIANCE: MARKET, BY REGION, 2018–2022 (USD MILLION)
                               TABLE 281 ENVIRONMENTAL COMPLIANCE: MARKET, BY REGION, 2023–2028 (USD MILLION)
                               9.7.1.4.1 Emissions Monitoring & Reporting
                               9.7.1.4.2 Regulatory Compliance
                               9.7.1.4.3 Sustainability Initiatives
                    9.7.1.5 Others
                               TABLE 282 OTHER ENERGY & UTILITIES APPLICATIONS: PROCESS MINING MARKET, BY REGION, 2018–2022 (USD MILLION)
                               TABLE 283 OTHER ENERGY & UTILITIES APPLICATIONS: MARKET, BY REGION, 2023–2028 (USD MILLION)
    9.8 TRANSPORTATION & LOGISTICS 
           9.8.1 GROWING DEMAND FOR MORE AGILE AND RESPONSIVE SUPPLY CHAIN TO DRIVE MARKET
                    TABLE 284 MARKET, BY TRANSPORTATION & LOGISTICS APPLICATION, 2018–2022 (USD MILLION)
                    TABLE 285 MARKET, BY TRANSPORTATION & LOGISTICS APPLICATION, 2023–2028 (USD MILLION)
                    9.8.1.1 Route Optimization
                               TABLE 286 ROUTE OPTIMIZATION: MARKET, BY REGION, 2018–2022 (USD MILLION)
                               TABLE 287 ROUTE OPTIMIZATION: MARKET, BY REGION, 2023–2028 (USD MILLION)
                               9.8.1.1.1 Transportation Route Efficiency
                               9.8.1.1.2 Delivery Time Monitoring
                               9.8.1.1.3 Fleet Management
                    9.8.1.2 Inventory & Warehouse Management
                               TABLE 288 INVENTORY & WAREHOUSE MANAGEMENT: MARKET, BY REGION, 2018–2022 (USD MILLION)
                               TABLE 289 INVENTORY & WAREHOUSE MANAGEMENT: MARKET, BY REGION, 2023–2028 (USD MILLION)
                               9.8.1.2.1 Inventory Turnover Optimization
                               9.8.1.2.2 Warehouse Efficiency
                               9.8.1.2.3 Demand Forecasting
                    9.8.1.3 Logistics Visibility & Tracking
                               TABLE 290 LOGISTICS VISIBILITY & TRACKING: PROCESS MINING MARKET, BY REGION, 2018–2022 (USD MILLION)
                               TABLE 291 LOGISTICS VISIBILITY & TRACKING: MARKET, BY REGION, 2023–2028 (USD MILLION)
                               9.8.1.3.1 Supply Chain Visibility
                               9.8.1.3.2 Carrier Performance Analysis
                               9.8.1.3.3 Last-mile Delivery Optimization
                    9.8.1.4 Safety & Compliance
                               TABLE 292 SAFETY & COMPLIANCE: MARKET, BY REGION, 2018–2022 (USD MILLION)
                               TABLE 293 SAFETY & COMPLIANCE: MARKET, BY REGION, 2023–2028 (USD MILLION)
                               9.8.1.4.1 Driver Safety Monitoring
                               9.8.1.4.2 Regulatory Compliance
                               9.8.1.4.3 Incident & Accident Analysis
                    9.8.1.5 Others
                               TABLE 294 OTHER TRANSPORTATION & LOGISTICS APPLICATIONS: MARKET, BY REGION, 2018–2022 (USD MILLION)
                               TABLE 295 OTHER TRANSPORTATION & LOGISTICS APPLICATIONS: MARKET, BY REGION, 2023–2028 (USD MILLION)
    9.9 GOVERNMENT & DEFENSE 
           9.9.1 PROCESS MINING SERVES AS CRITICAL TOOL FOR MAINTAINING OPERATIONAL INTEGRITY IN GOVERNMENT & DEFENSE SECTOR
                    TABLE 296 MARKET, BY GOVERNMENT & DEFENSE APPLICATION, 2018–2022 (USD MILLION)
                    TABLE 297 MARKET, BY GOVERNMENT & DEFENSE APPLICATION, 2023–2028 (USD MILLION)
                    9.9.1.1 Citizen Services Improvement
                               TABLE 298 CITIZEN SERVICES IMPROVEMENT: PROCESS MINING MARKET, BY REGION, 2018–2022 (USD MILLION)
                               TABLE 299 CITIZEN SERVICES IMPROVEMENT: MARKET, BY REGION, 2023–2028 (USD MILLION)
                               9.9.1.1.1 Government Service Efficiency
                               9.9.1.1.2 Citizen Experience Enhancement
                               9.9.1.1.3 Compliance Monitoring
                    9.9.1.2 Public Health & Safety
                               TABLE 300 PUBLIC HEALTH & SAFETY: MARKET, BY REGION, 2018–2022 (USD MILLION)
                               TABLE 301 PUBLIC HEALTH & SAFETY: MARKET, BY REGION, 2023–2028 (USD MILLION)
                               9.9.1.2.1 Emergency Response Optimization
                               9.9.1.2.2 Disease Surveillance
                               9.9.1.2.3 Traffic Management
                    9.9.1.3 Regulatory Compliance & Auditing
                               TABLE 302 REGULATORY COMPLIANCE & AUDITING: MARKET, BY REGION, 2018–2022 (USD MILLION)
                               TABLE 303 REGULATORY COMPLIANCE & AUDITING: MARKET, BY REGION, 2023–2028 (USD MILLION)
                               9.9.1.3.1 Audit Trail Analysis
                               9.9.1.3.2 Data Privacy Compliance
                               9.9.1.3.3 Regulatory Reporting
                    9.9.1.4 Others
                               TABLE 304 OTHER GOVERNMENT & DEFENSE APPLICATIONS: MARKET, BY REGION, 2018–2022 (USD MILLION)
                               TABLE 305 OTHER GOVERNMENT & DEFENSE APPLICATIONS: MARKET, BY REGION, 2023–2028 (USD MILLION)
    9.10 EDUCATION 
           9.10.1 NEED FOR INSTITUTIONS TO MEET NECESSARY BENCHMARKS AND MAINTAIN HIGH STANDARD OF EDUCATION TO PROPEL USE OF PROCESS MINING STRATEGIES
                    TABLE 306 MARKET, BY EDUCATION APPLICATION, 2018–2022 (USD MILLION)
                    TABLE 307 MARKET, BY EDUCATION APPLICATION, 2023–2028 (USD MILLION)
                    9.10.1.1 Student Lifecycle Management
                               TABLE 308 STUDENT LIFECYCLE MANAGEMENT: PROCESS MINING MARKET, BY REGION, 2018–2022 (USD MILLION)
                               TABLE 309 STUDENT LIFECYCLE MANAGEMENT: MARKET, BY REGION, 2023–2028 (USD MILLION)
                               9.10.1.1.1 Enrollment Process Optimization
                               9.10.1.1.2 Academic Performance Analysis
                               9.10.1.1.3 Student Support Services
                    9.10.1.2 Curriculum & Course Optimization
                               TABLE 310 CURRICULUM & COURSE OPTIMIZATION: MARKET, BY REGION, 2018–2022 (USD MILLION)
                               TABLE 311 CURRICULUM & COURSE OPTIMIZATION: MARKET, BY REGION, 2023–2028 (USD MILLION)
                               9.10.1.2.1 Curriculum Design Efficiency
                               9.10.1.2.2 Course Enrollment Analysis
                               9.10.1.2.3 Learning Outcome Improvement
                    9.10.1.3 Resource Allocation
                               TABLE 312 RESOURCE ALLOCATION: MARKET, BY REGION, 2018–2022 (USD MILLION)
                               TABLE 313 RESOURCE ALLOCATION: MARKET, BY REGION, 2023–2028 (USD MILLION)
                               9.10.1.3.1 Faculty Workload Balancing
                               9.10.1.3.2 Infrastructure Utilization
                               9.10.1.3.3 Budget Allocation Efficiency
                    9.10.1.4 Others
                               TABLE 314 OTHER EDUCATION APPLICATIONS: MARKET, BY REGION, 2018–2022 (USD MILLION)
                               TABLE 315 OTHER EDUCATION APPLICATIONS: MARKET, BY REGION, 2023–2028 (USD MILLION)
    9.11 OTHER VERTICALS 
                    TABLE 316 OTHER VERTICALS: MARKET, BY REGION, 2018–2022 (USD MILLION)
                    TABLE 317 OTHER VERTICALS: MARKET, BY REGION, 2023–2028 (USD MILLION)
 
10 PROCESS MINING MARKET, BY REGION (Page No. - 373)
     10.1 INTRODUCTION 
               FIGURE 43 NORTH AMERICA TO REGISTER HIGHEST GROWTH DURING FORECAST PERIOD
               FIGURE 44 US TO REGISTER HIGHEST CAGR DURING FORECAST PERIOD
               TABLE 318 MARKET, BY REGION, 2018–2022 (USD MILLION)
               TABLE 319 MARKET, BY REGION, 2023–2028 (USD MILLION)
     10.2 NORTH AMERICA 
             10.2.1 NORTH AMERICA: MARKET DRIVERS
             10.2.2 NORTH AMERICA: RECESSION IMPACT
                       FIGURE 45 NORTH AMERICA: PROCESS MINING MARKET SNAPSHOT
                       TABLE 320 NORTH AMERICA: MARKET, BY OFFERING, 2018–2022 (USD MILLION)
                       TABLE 321 NORTH AMERICA: MARKET, BY OFFERING, 2023–2028 (USD MILLION)
                       TABLE 322 NORTH AMERICA: MARKET, BY SOFTWARE, 2018–2022 (USD MILLION)
                       TABLE 323 NORTH AMERICA: MARKET, BY SOFTWARE, 2023–2028 (USD MILLION)
                       TABLE 324 NORTH AMERICA: MARKET, BY SERVICE, 2018–2022 (USD MILLION)
                       TABLE 325 NORTH AMERICA: MARKET, BY SERVICE, 2023–2028 (USD MILLION)
                       TABLE 326 NORTH AMERICA: MARKET, BY MINING ALGORITHM, 2018–2022 (USD MILLION)
                       TABLE 327 NORTH AMERICA: MARKET, BY MINING ALGORITHM, 2023–2028 (USD MILLION)
                       TABLE 328 NORTH AMERICA: MARKET, BY DATA SOURCE, 2018–2022 (USD MILLION)
                       TABLE 329 NORTH AMERICA: MARKET, BY DATA SOURCE, 2023–2028 (USD MILLION)
                       TABLE 330 NORTH AMERICA: MARKET, BY VERTICAL, 2018–2022 (USD MILLION)
                       TABLE 331 NORTH AMERICA: MARKET, BY VERTICAL, 2023–2028 (USD MILLION)
                       TABLE 332 NORTH AMERICA: MARKET, BY COUNTRY, 2018–2022 (USD MILLION)
                       TABLE 333 NORTH AMERICA: MARKET, BY COUNTRY, 2023–2028 (USD MILLION)
             10.2.3 US
                       10.2.3.1 Rising demand for process mining solutions to contribute to market growth
                                   TABLE 334 US: MARKET, BY OFFERING, 2018–2022 (USD MILLION)
                                   TABLE 335 US: MARKET, BY OFFERING, 2023–2028 (USD MILLION)
             10.2.4 CANADA
                       10.2.4.1 Growing adoption of insurance solutions by enterprises to drive market
                                   TABLE 336 CANADA: MARKET, BY OFFERING, 2018–2022 (USD MILLION)
                                   TABLE 337 CANADA: MARKET, BY OFFERING, 2023–2028 (USD MILLION)
     10.3 EUROPE 
             10.3.1 EUROPE: MARKET DRIVERS
             10.3.2 EUROPE: RECESSION IMPACT
                       FIGURE 46 EUROPE: PROCESS MINING MARKET SNAPSHOT
                       TABLE 338 EUROPE: MARKET, BY OFFERING, 2018–2022 (USD MILLION)
                       TABLE 339 EUROPE: MARKET, BY OFFERING, 2023–2028 (USD MILLION)
                       TABLE 340 EUROPE: MARKET, BY SOFTWARE, 2018–2022 (USD MILLION)
                       TABLE 341 EUROPE: MARKET, BY SOFTWARE, 2023–2028 (USD MILLION)
                       TABLE 342 EUROPE: MARKET, BY SERVICE, 2018–2022 (USD MILLION)
                       TABLE 343 EUROPE: MARKET, BY SERVICE, 2023–2028 (USD MILLION)
                       TABLE 344 EUROPE: MARKET, BY MINING ALGORITHM, 2018–2022 (USD MILLION)
                       TABLE 345 EUROPE: MARKET, BY MINING ALGORITHM, 2023–2028 (USD MILLION)
                       TABLE 346 EUROPE: MARKET, BY DATA SOURCE, 2018–2022 (USD MILLION)
                       TABLE 347 EUROPE: MARKET, BY DATA SOURCE, 2023–2028 (USD MILLION)
                       TABLE 348 EUROPE: MARKET, BY VERTICAL, 2018–2022 (USD MILLION)
                       TABLE 349 EUROPE: MARKET, BY VERTICAL, 2023–2028 (USD MILLION)
                       TABLE 350 EUROPE: MARKET, BY COUNTRY, 2018–2022 (USD MILLION)
                       TABLE 351 EUROPE: MARKET, BY COUNTRY, 2023–2028 (USD MILLION)
             10.3.3 UK
                       10.3.3.1 Surge in demand for operational efficiency and streamlined business processes across diverse industries to drive growth
                                   TABLE 352 UK: MARKET, BY OFFERING, 2018–2022 (USD MILLION)
                                   TABLE 353 UK: MARKET, BY OFFERING, 2023–2028 (USD MILLION)
             10.3.4 GERMANY
                       10.3.4.1 Growing emphasis on data-driven decision-making and actionable insights to boost market
                                   TABLE 354 GERMANY: PROCESS MINING MARKET, BY OFFERING, 2018–2022 (USD MILLION)
                                   TABLE 355 GERMANY: MARKET, BY OFFERING, 2023–2028 (USD MILLION)
             10.3.5 FRANCE
                       10.3.5.1 Robust combination of economic stability and growing awareness regarding transformative potential of process optimization to drive adoption of process mining technologies
                                   TABLE 356 FRANCE: MARKET, BY OFFERING, 2018–2022 (USD MILLION)
                                   TABLE 357 FRANCE: MARKET, BY OFFERING, 2023–2028 (USD MILLION)
             10.3.6 ITALY
                       10.3.6.1 Need for identifying and addressing inefficiencies in business processes to spur market expansion
                                   TABLE 358 ITALY: MARKET, BY OFFERING, 2018–2022 (USD MILLION)
                                   TABLE 359 ITALY: MARKET, BY OFFERING, 2023–2028 (USD MILLION)
             10.3.7 SPAIN
                       10.3.7.1 Rising emphasis on recognizing importance of optimizing operational processes to strengthen use of process mining technologies
                                   TABLE 360 SPAIN: MARKET, BY OFFERING, 2018–2022 (USD MILLION)
                                   TABLE 361 SPAIN: MARKET, BY OFFERING, 2023–2028 (USD MILLION)
             10.3.8 NETHERLANDS
                       10.3.8.1 Need for continuous improvement in businesses to fuel adoption of process mining solutions
                                   TABLE 362 NETHERLANDS: MARKET, BY OFFERING, 2018–2022 (USD MILLION)
                                   TABLE 363 NETHERLANDS: MARKET, BY OFFERING, 2023–2028 (USD MILLION)
             10.3.9 REST OF EUROPE
                       TABLE 364 REST OF EUROPE: MARKET, BY OFFERING, 2018–2022 (USD MILLION)
                       TABLE 365 REST OF EUROPE: MARKET, BY OFFERING, 2023–2028 (USD MILLION)
     10.4 ASIA PACIFIC 
             10.4.1 ASIA PACIFIC: MARKET DRIVERS
             10.4.2 ASIA PACIFIC: RECESSION IMPACT
                       TABLE 366 ASIA PACIFIC: PROCESS MINING MARKET, BY OFFERING, 2018–2022 (USD MILLION)
                       TABLE 367 ASIA PACIFIC: MARKET, BY OFFERING, 2023–2028 (USD MILLION)
                       TABLE 368 ASIA PACIFIC: MARKET, BY SOFTWARE, 2018–2022 (USD MILLION)
                       TABLE 369 ASIA PACIFIC: MARKET, BY SOFTWARE, 2023–2028 (USD MILLION)
                       TABLE 370 ASIA PACIFIC: MARKET, BY SERVICE, 2018–2022 (USD MILLION)
                       TABLE 371 ASIA PACIFIC: MARKET, BY SERVICE, 2023–2028 (USD MILLION)
                       TABLE 372 ASIA PACIFIC: MARKET, BY MINING ALGORITHM, 2018–2022 (USD MILLION)
                       TABLE 373 ASIA PACIFIC: MARKET, BY MINING ALGORITHM, 2023–2028 (USD MILLION)
                       TABLE 374 ASIA PACIFIC: MARKET, BY DATA SOURCE, 2018–2022 (USD MILLION)
                       TABLE 375 ASIA PACIFIC: MARKET, BY DATA SOURCE, 2023–2028 (USD MILLION)
                       TABLE 376 ASIA PACIFIC: MARKET, BY VERTICAL, 2018–2022 (USD MILLION)
                       TABLE 377 ASIA PACIFIC: MARKET, BY VERTICAL, 2023–2028 (USD MILLION)
                       TABLE 378 ASIA PACIFIC: MARKET, BY COUNTRY, 2018–2022 (USD MILLION)
                       TABLE 379 ASIA PACIFIC: MARKET, BY COUNTRY, 2023–2028 (USD MILLION)
             10.4.3 CHINA
                       10.4.3.1 Rising emphasis on enhancing operational efficiency and gaining competitive edge to drive market
                                   TABLE 380 CHINA: PROCESS MINING MARKET, BY OFFERING, 2018–2022 (USD MILLION)
                                   TABLE 381 CHINA: MARKET, BY OFFERING, 2023–2028 (USD MILLION)
             10.4.4 INDIA
                       10.4.4.1 Growing awareness among businesses regarding potential benefits and transparency of process mining technologies to boost market
                                   TABLE 382 INDIA: MARKET, BY OFFERING, 2018–2022 (USD MILLION)
                                   TABLE 383 INDIA: MARKET, BY OFFERING, 2023–2028 (USD MILLION)
             10.4.5 JAPAN
                       10.4.5.1 Rising demand to streamline production processes to leverage process mining solutions
                                   TABLE 384 JAPAN: MARKET, BY OFFERING, 2018–2022 (USD MILLION)
                                   TABLE 385 JAPAN: MARKET, BY OFFERING, 2023–2028 (USD MILLION)
             10.4.6 SOUTH KOREA
                       10.4.6.1 Increasing investments in advanced analytics and artificial intelligence to drive growth of market
                                   TABLE 386 SOUTH KOREA: MARKET, BY OFFERING, 2018–2022 (USD MILLION)
                                   TABLE 387 SOUTH KOREA: MARKET, BY OFFERING, 2023–2028 (USD MILLION)
             10.4.7 SINGAPORE
                       10.4.7.1 Increasing government initiatives and rising use of data analytics to contribute to market growth
                                   TABLE 388 SINGAPORE: MARKET, BY OFFERING, 2018–2022 (USD MILLION)
                                   TABLE 389 SINGAPORE: MARKET, BY OFFERING, 2023–2028 (USD MILLION)
             10.4.8 AUSTRALIA & NEW ZEALAND
                       10.4.8.1 Strong focus on digital transformation to encourage market expansion
                                   TABLE 390 AUSTRALIA & NEW ZEALAND: MARKET, BY OFFERING, 2018–2022 (USD MILLION)
                                   TABLE 391 AUSTRALIA & NEW ZEALAND: MARKET, BY OFFERING, 2023–2028 (USD MILLION)
             10.4.9 REST OF ASIA PACIFIC
                       TABLE 392 REST OF ASIA PACIFIC: MARKET, BY OFFERING, 2018–2022 (USD MILLION)
                       TABLE 393 REST OF ASIA PACIFIC: MARKET, BY OFFERING, 2023–2028 (USD MILLION)
     10.5 MIDDLE EAST & AFRICA 
             10.5.1 MIDDLE EAST & AFRICA: MARKET DRIVERS
             10.5.2 MIDDLE EAST & AFRICA: RECESSION IMPACT
                       TABLE 394 MIDDLE EAST & AFRICA: PROCESS MINING MARKET, BY OFFERING, 2018–2022 (USD MILLION)
                       TABLE 395 MIDDLE EAST & AFRICA: MARKET, BY OFFERING, 2023–2028 (USD MILLION)
                       TABLE 396 MIDDLE EAST & AFRICA: MARKET, BY SOFTWARE, 2018–2022 (USD MILLION)
                       TABLE 397 MIDDLE EAST & AFRICA: MARKET, BY SOFTWARE, 2023–2028 (USD MILLION)
                       TABLE 398 MIDDLE EAST & AFRICA: MARKET, BY SERVICE, 2018–2022 (USD MILLION)
                       TABLE 399 MIDDLE EAST & AFRICA: MARKET, BY SERVICE, 2023–2028 (USD MILLION)
                       TABLE 400 MIDDLE EAST & AFRICA: MARKET, BY MINING ALGORITHM, 2018–2022 (USD MILLION)
                       TABLE 401 MIDDLE EAST & AFRICA: MARKET, BY MINING ALGORITHM, 2023–2028 (USD MILLION)
                       TABLE 402 MIDDLE EAST & AFRICA: MARKET, BY DATA SOURCE, 2018–2022 (USD MILLION)
                       TABLE 403 MIDDLE EAST & AFRICA: MARKET, BY DATA SOURCE, 2023–2028 (USD MILLION)
                       TABLE 404 MIDDLE EAST & AFRICA: MARKET, BY VERTICAL, 2018–2022 (USD MILLION)
                       TABLE 405 MIDDLE EAST & AFRICA: MARKET, BY VERTICAL, 2023–2028 (USD MILLION)
                       TABLE 406 MIDDLE EAST & AFRICA: MARKET, BY COUNTRY, 2018–2022 (USD MILLION)
                       TABLE 407 MIDDLE EAST & AFRICA: MARKET, BY COUNTRY, 2023–2028 (USD MILLION)
             10.5.3 SAUDI ARABIA
                       10.5.3.1 Government’s commitment to digital transformation and innovation to drive market growth
                                   TABLE 408 SAUDI ARABIA: PROCESS MINING MARKET, BY OFFERING, 2018–2022 (USD MILLION)
                                   TABLE 409 SAUDI ARABIA: MARKET, BY OFFERING, 2023–2028 (USD MILLION)
             10.5.4 UAE
                       10.5.4.1 Increased investments by governments in emerging technologies to boost market growth
                                   TABLE 410 UAE: MARKET, BY OFFERING, 2018–2022 (USD MILLION)
                                   TABLE 411 UAE: MARKET, BY OFFERING, 2023–2028 (USD MILLION)
             10.5.5 SOUTH AFRICA
                       10.5.5.1 Growing recognition of data-driven decision-making to encourage adoption of process mining solutions
                                   TABLE 412 SOUTH AFRICA: MARKET, BY OFFERING, 2018–2022 (USD MILLION)
                                   TABLE 413 SOUTH AFRICA: MARKET, BY OFFERING, 2023–2028 (USD MILLION)
             10.5.6 TURKEY
                       10.5.6.1 Expansion of telecommunications sector to create opportunities for MARKET players
                                   TABLE 414 TURKEY: MARKET, BY OFFERING, 2018–2022 (USD MILLION)
                                   TABLE 415 TURKEY: MARKET, BY OFFERING, 2023–2028 (USD MILLION)
             10.5.7 REST OF MIDDLE EAST & AFRICA
                       TABLE 416 REST OF MIDDLE EAST & AFRICA: MARKET, BY OFFERING, 2018–2022 (USD MILLION)
                       TABLE 417 REST OF MIDDLE EAST & AFRICA: MARKET, BY OFFERING, 2023–2028 (USD MILLION)
     10.6 LATIN AMERICA 
             10.6.1 LATIN AMERICA: MARKET DRIVERS
             10.6.2 LATIN AMERICA: RECESSION IMPACT
                       TABLE 418 LATIN AMERICA: PROCESS MINING MARKET, BY OFFERING, 2018–2022 (USD MILLION)
                       TABLE 419 LATIN AMERICA: MARKET, BY OFFERING, 2023–2028 (USD MILLION)
                       TABLE 420 LATIN AMERICA: MARKET, BY SOFTWARE, 2018–2022 (USD MILLION)
                       TABLE 421 LATIN AMERICA: MARKET, BY SOFTWARE, 2023–2028 (USD MILLION)
                       TABLE 422 LATIN AMERICA: MARKET, BY SERVICE, 2018–2022 (USD MILLION)
                       TABLE 423 LATIN AMERICA: MARKET, BY SERVICE, 2023–2028 (USD MILLION)
                       TABLE 424 LATIN AMERICA: MARKET, BY MINING ALGORITHM, 2018–2022 (USD MILLION)
                       TABLE 425 LATIN AMERICA: MARKET, BY MINING ALGORITHM, 2023–2028 (USD MILLION)
                       TABLE 426 LATIN AMERICA: MARKET, BY DATA SOURCE, 2018–2022 (USD MILLION)
                       TABLE 427 LATIN AMERICA: MARKET, BY DATA SOURCE, 2023–2028 (USD MILLION)
                       TABLE 428 LATIN AMERICA: MARKET, BY VERTICAL, 2018–2022 (USD MILLION)
                       TABLE 429 LATIN AMERICA: MARKET, BY VERTICAL, 2023–2028 (USD MILLION)
                       TABLE 430 LATIN AMERICA: MARKET, BY COUNTRY, 2018–2022 (USD MILLION)
                       TABLE 431 LATIN AMERICA: MARKET, BY COUNTRY, 2023–2028 (USD MILLION)
             10.6.3 BRAZIL
                       10.6.3.1 Growing investments in technology infrastructure to bolster popularity of process mining technologies
                                   TABLE 432 BRAZIL: PROCESS MINING MARKET, BY OFFERING, 2018–2022 (USD MILLION)
                                   TABLE 433 BRAZIL: MARKET, BY OFFERING, 2023–2028 (USD MILLION)
             10.6.4 MEXICO
                       10.6.4.1 Rapid growth of venture capital ecosystem to encourage start-ups to adopt process mining technologies
                                   TABLE 434 MEXICO: MARKET, BY OFFERING, 2018–2022 (USD MILLION)
                                   TABLE 435 MEXICO: MARKET, BY OFFERING, 2023–2028 (USD MILLION)
             10.6.5 ARGENTINA
                       10.6.5.1 Growing awareness among industries regarding benefits of adopting process mining solutions to boost market
                                   TABLE 436 ARGENTINA: MARKET, BY OFFERING, 2018–2022 (USD MILLION)
                                   TABLE 437 ARGENTINA: MARKET, BY OFFERING, 2023–2028 (USD MILLION)
             10.6.6 REST OF LATIN AMERICA
                       TABLE 438 REST OF LATIN AMERICA: MARKET, BY OFFERING, 2018–2022 (USD MILLION)
                       TABLE 439 REST OF LATIN AMERICA: PROCESS MINING MARKET, BY OFFERING, 2023–2028 (USD MILLION)
 
11 COMPETITIVE LANDSCAPE (Page No. - 438)
     11.1 OVERVIEW 
     11.2 STRATEGIES ADOPTED BY KEY PLAYERS 
               TABLE 440 STRATEGIES ADOPTED BY KEY PROCESS MINING VENDORS
     11.3 REVENUE ANALYSIS FOR KEY PLAYERS 
               FIGURE 47 BUSINESS SEGMENT REVENUE ANALYSIS, 2018–2022 (USD BILLION)
     11.4 MARKET SHARE ANALYSIS 
               FIGURE 48 MARKET SHARE ANALYSIS FOR KEY PLAYERS, 2022
               TABLE 441 PROCESS MINING MARKET: INTENSITY OF COMPETITIVE RIVALRY
     11.5 BRAND/PRODUCT COMPARATIVE ANALYSIS 
             11.5.1 BRAND/PRODUCT COMPARATIVE ANALYSIS, BY PROCESS DISCOVERY SOFTWARE
                       FIGURE 49 BRAND/PRODUCT COMPARATIVE ANALYSIS, BY PROCESS DISCOVERY SOFTWARE
                       11.5.1.1 Appian
                       11.5.1.2 UiPath
                       11.5.1.3 Automation Anywhere
                       11.5.1.4 Nintex
             11.5.2 BRAND/PRODUCT COMPARATIVE ANALYSIS, BY CONFORMANCE CHECKING SOFTWARE
                       FIGURE 50 BRAND/PRODUCT COMPARATIVE ANALYSIS, BY CONFORMANCE CHECKING SOFTWARE
                       11.5.2.1 Celonis
                       11.5.2.2 Software AG
                       11.5.2.3 QPR Software
                       11.5.2.4 Workfellow
             11.5.3 BRAND/PRODUCT COMPARATIVE ANALYSIS, BY PROCESS ENHANCEMENT & OPTIMIZATION SOFTWARE
                       FIGURE 51 BRAND/PRODUCT COMPARATIVE ANALYSIS, BY PROCESS ENHANCEMENT & OPTIMIZATION SOFTWARE
                       11.5.3.1 Apromore
                       11.5.3.2 Mehrwerk
                       11.5.3.3 Skan.ai
                       11.5.3.4 Pegasystems
     11.6 COMPANY EVALUATION MATRIX, 2022 
             11.6.1 STARS
             11.6.2 EMERGING LEADERS
             11.6.3 PERVASIVE PLAYERS
             11.6.4 PARTICIPANTS
                       FIGURE 52 COMPANY EVALUATION MATRIX FOR KEY PLAYERS, 2022
             11.6.5 COMPANY FOOTPRINT
                       TABLE 442 PRODUCT FOOTPRINT (17 COMPANIES)
                       TABLE 443 COMPANY FOOTPRINT, BY MINING ALGORITHM (17 COMPANIES)
                       TABLE 444 COMPANY FOOTPRINT, BY REGION (17 COMPANIES)
                       TABLE 445 OVERALL FOOTPRINT (17 COMPANIES)
                       TABLE 446 OVERALL PRODUCT FOOTPRINT ANALYSIS, 2023
     11.7 START-UP/SME EVALUATION MATRIX, 2022 
             11.7.1 PROGRESSIVE COMPANIES
             11.7.2 RESPONSIVE COMPANIES
             11.7.3 DYNAMIC COMPANIES
             11.7.4 STARTING BLOCKS
                       FIGURE 53 START-UP/SME EVALUATION MATRIX, 2022
             11.7.5 COMPETITIVE BENCHMARKING
                       TABLE 447 DETAILED LIST OF START-UPS/SMES
                       TABLE 448 COMPETITIVE BENCHMARKING OF START-UPS/SMES
     11.8 VALUATION AND FINANCIAL METRICS OF KEY PROCESS MINING VENDORS 
               FIGURE 54 EV/EBITDA OF KEY PROCESS MINING VENDORS
               FIGURE 55 YEAR-TO-DATE (YTD) PRICE TOTAL RETURN AND 5-YEAR STOCK BETA OF KEY PROCESS MINING VENDORS
     11.9 COMPETITIVE SCENARIO AND TRENDS 
             11.9.1 PRODUCT LAUNCHES & ENHANCEMENTS
                       TABLE 449 PRODUCT LAUNCHES & ENHANCEMENTS, 2022–2023
             11.9.2 DEALS
                       TABLE 450 DEALS, 2019–2023
 
12 COMPANY PROFILES (Page No. - 467)
     12.1 INTRODUCTION 
(Business overview, Products/Solutions/Services offered, Recent developments & MnM View)*
     12.2 KEY PLAYERS 
             12.2.1 IBM
                       TABLE 451 IBM: BUSINESS OVERVIEW
                       FIGURE 56 IBM: COMPANY SNAPSHOT
                       TABLE 452 IBM: PRODUCTS/SOLUTIONS/SERVICES OFFERED
                       TABLE 453 IBM: PRODUCT LAUNCHES AND ENHANCEMENTS
                       TABLE 454 IBM: DEALS
             12.2.2 ABBYY
                       TABLE 455 ABBYY: BUSINESS OVERVIEW
                       TABLE 456 ABBYY: PRODUCTS/SOLUTIONS/SERVICES OFFERED
                       TABLE 457 ABBYY: PRODUCT LAUNCHES AND ENHANCEMENTS
                       TABLE 458 ABBYY: DEALS
             12.2.3 CELONIS
                       TABLE 459 CELONIS: BUSINESS OVERVIEW
                       TABLE 460 CELONIS: PRODUCTS/SOLUTIONS/SERVICES OFFERED
                       TABLE 461 CELONIS: PRODUCT LAUNCHES AND ENHANCEMENTS
                       TABLE 462 CELONIS: DEALS
             12.2.4 UIPATH
                       TABLE 463 UIPATH: BUSINESS OVERVIEW
                       FIGURE 57 UIPATH: COMPANY SNAPSHOT
                       TABLE 464 UIPATH: PRODUCTS/SOLUTIONS/SERVICES OFFERED
                       TABLE 465 UIPATH: PRODUCT LAUNCHES AND ENHANCEMENTS
                       TABLE 466 UIPATH: DEALS
             12.2.5 SOFTWARE AG
                       TABLE 467 SOFTWARE AG: BUSINESS OVERVIEW
                       FIGURE 58 SOFTWARE AG: COMPANY SNAPSHOT
                       TABLE 468 SOFTWARE AG: PRODUCTS/SOLUTIONS/SERVICES OFFERED
                       TABLE 469 SOFTWARE AG: PRODUCT LAUNCHES AND ENHANCEMENTS
                       TABLE 470 SOFTWARE AG: DEALS
             12.2.6 SAP SIGNAVIO
                       TABLE 471 SAP SIGNAVIO: BUSINESS OVERVIEW
                       TABLE 472 SAP SIGNAVIO: PRODUCTS/SOLUTIONS/SERVICES OFFERED
                       TABLE 473 SAP SIGNAVIO: PRODUCT LAUNCHES AND ENHANCEMENTS
                       TABLE 474 SAP SIGNAVIO: DEALS
             12.2.7 MICROSOFT
                       TABLE 475 MICROSOFT: BUSINESS OVERVIEW
                       FIGURE 59 MICROSOFT: COMPANY SNAPSHOT
                       TABLE 476 MICROSOFT: PRODUCTS/SOLUTIONS/SERVICES OFFERED
                       TABLE 477 MICROSOFT: PRODUCT LAUNCHES AND ENHANCEMENTS
                       TABLE 478 MICROSOFT: DEALS
             12.2.8 QPR SOFTWARE
                       TABLE 479 QPR SOFTWARE: BUSINESS OVERVIEW
                       FIGURE 60 QPR SOFTWARE: COMPANY SNAPSHOT
                       TABLE 480 QPR SOFTWARE: PRODUCTS/SOLUTIONS/SERVICES OFFERED
                       TABLE 481 QPR SOFTWARE: PRODUCT LAUNCHES AND ENHANCEMENTS
                       TABLE 482 QPR SOFTWARE: DEALS
             12.2.9 PEGASYSTEMS
                       TABLE 483 PEGASYSTEMS: BUSINESS OVERVIEW
                       FIGURE 61 PEGASYSTEMS: COMPANY SNAPSHOT
                       TABLE 484 PEGASYSTEMS: PRODUCTS/SOLUTIONS/SERVICES OFFERED
                       TABLE 485 PEGASYSTEMS: PRODUCT LAUNCHES AND ENHANCEMENTS
                       TABLE 486 PEGASYSTEMS: DEALS
             12.2.10 APPIAN
                       TABLE 487 APPIAN: BUSINESS OVERVIEW
                       FIGURE 62 APPIAN: COMPANY SNAPSHOT
                       TABLE 488 APPIAN: PRODUCTS/SOLUTIONS/SERVICES OFFERED
                       TABLE 489 APPIAN: PRODUCT LAUNCHES AND ENHANCEMENTS
                       TABLE 490 APPIAN: DEALS
             12.2.11 SOROCO
             12.2.12 MEHRWERK
             12.2.13 KOFAX
             12.2.14 IGRAFX
             12.2.15 NINTEX
             12.2.16 AUTOMATION ANYWHERE
             12.2.17 HYLAND SOFTWARE
*Details on Business overview, Products/Solutions/Services offered, Recent developments & MnM View might not be captured in case of unlisted companies.
     12.3 START-UPS/SMES 
             12.3.1 APROMORE
             12.3.2 FLUXICON
             12.3.3 BUSINESS OPTIX
             12.3.4 STEREOLOGIC
             12.3.5 WORKSOFT
             12.3.6 DATAPOLIS
             12.3.7 INVERBIS ANALYTICS
             12.3.8 SKAN.AI
             12.3.9 MINDZIE
             12.3.10 CYCLONE ROBOTICS
             12.3.11 UPFLUX
             12.3.12 PUZZLEDATA
             12.3.13 KYP.AI
             12.3.14 WORKFELLOW
 
13 ADJACENT AND RELATED MARKETS (Page No. - 520)
     13.1 INTRODUCTION 
     13.2 BUSINESS PROCESS MANAGEMENT (BPM) MARKET 
             13.2.1 MARKET DEFINITION
             13.2.2 MARKET OVERVIEW
                       13.2.2.1 Business process management market, by component
                                   TABLE 491 BUSINESS PROCESS MANAGEMENT MARKET, BY COMPONENT, 2018–2025 (USD MILLION)
                       13.2.2.2 Business process management market, by business function
                                   TABLE 492 BUSINESS PROCESS MANAGEMENT MARKET, BY BUSINESS FUNCTION, 2018–2025 (USD MILLION)
                       13.2.2.3 Business process management market, by deployment mode
                                   TABLE 493 BUSINESS PROCESS MANAGEMENT MARKET, BY DEPLOYMENT TYPE, 2018–2025 (USD MILLION)
                       13.2.2.4 Business process management market, by organization size
                                   TABLE 494 BUSINESS PROCESS MANAGEMENT MARKET, BY ORGANIZATION SIZE, 2018–2025 (USD MILLION)
                       13.2.2.5 Business process management market, by industry
                                   TABLE 495 BUSINESS PROCESS MANAGEMENT MARKET, BY INDUSTRY, 2018–2025 (USD MILLION)
                       13.2.2.6 Business process management market, by region
                                   TABLE 496 BUSINESS PROCESS MANAGEMENT MARKET, BY REGION, 2018–2025 (USD MILLION)
     13.3 BUSINESS INTELLIGENCE MARKET 
             13.3.1 MARKET DEFINITION
             13.3.2 MARKET OVERVIEW
                       13.3.2.1 Business intelligence market, by component
                                   TABLE 497 BUSINESS INTELLIGENCE MARKET, BY COMPONENT, 2016–2019 (USD MILLION)
                                   TABLE 498 BUSINESS INTELLIGENCE MARKET, BY COMPONENT, 2019–2025 (USD MILLION)
                       13.3.2.2 Business intelligence market, by deployment mode
                                   TABLE 499 BUSINESS INTELLIGENCE MARKET, BY DEPLOYMENT MODE, 2016–2019 (USD MILLION)
                                   TABLE 500 BUSINESS INTELLIGENCE MARKET, BY DEPLOYMENT MODE, 2019–2025 (USD MILLION)
                       13.3.2.3 Business intelligence market, by organization size
                                   TABLE 501 BUSINESS INTELLIGENCE MARKET, BY ORGANIZATION SIZE, 2016–2019 (USD MILLION)
                                   TABLE 502 BUSINESS INTELLIGENCE MARKET, BY ORGANIZATION SIZE, 2019–2025 (USD MILLION)
                       13.3.2.4 Business intelligence market, by business function
                                   TABLE 503 BUSINESS INTELLIGENCE MARKET, BY BUSINESS FUNCTION, 2016–2019 (USD MILLION)
                                   TABLE 504 BUSINESS INTELLIGENCE MARKET, BY BUSINESS FUNCTION, 2019–2025 (USD MILLION)
                       13.3.2.5 Business intelligence market, by industry vertical
                                   TABLE 505 BUSINESS INTELLIGENCE MARKET, BY INDUSTRY VERTICAL, 2016–2019 (USD MILLION)
                                   TABLE 506 BUSINESS INTELLIGENCE MARKET, BY INDUSTRY VERTICAL, 2019–2025 (USD MILLION)
                       13.3.2.6 Business intelligence market, by region
                                   TABLE 507 BUSINESS INTELLIGENCE MARKET, BY REGION, 2016–2019 (USD MILLION)
                                   TABLE 508 BUSINESS INTELLIGENCE MARKET, BY REGION, 2019–2025 (USD MILLION)
 
14 APPENDIX (Page No. - 530)
     14.1 DISCUSSION GUIDE 
     14.2 KNOWLEDGESTORE: MARKETSANDMARKETS’ SUBSCRIPTION PORTAL 
     14.3 CUSTOMIZATION OPTIONS 
     14.4 RELATED REPORTS 
     14.5 AUTHOR DETAILS 

The process mining market research study involved extensive secondary sources, directories, journals, and paid databases. Primary sources were mainly Interviews with experts from the core and related industries, preferred process mining providers, third-party service providers, consulting service providers, end-users, and other commercial enterprises. In-depth interviews were conducted with various primary respondents, including key industry participants and subject matter experts, to obtain and verify critical qualitative and quantitative information and assess the market’s prospects.

Secondary Research

In the secondary research process, various sources were referred to for identifying and collecting information for this study. Secondary sources included annual reports, press releases, and investor presentations of companies; white papers, journals, and certified publications; and articles from recognized authors, directories, and databases. The data was also collected from other secondary sources, such as journals, government websites, blogs, and vendors’ websites. Additionally, Process mining spending of various countries was extracted from the respective sources. Secondary research was mainly used to obtain key information related to the industry’s value chain and supply chain to identify key players based on solutions, services, market classification, and segmentation according to offerings of major players, industry trends related to solutions, services, deployment modes, business functions, applications, verticals, and regions, and key developments from both market- and technology-oriented perspectives.

Primary Research

In the primary research process, various primary sources from both supply and demand sides were interviewed to obtain qualitative and quantitative information on the market. The primary sources from the supply side included various Interviews with Experts, including Chief Experience Officers (CXOs); Vice Presidents (VPs); directors from business development, marketing, and process mining expertise; related key executives from process mining software vendors, SIs, professional service providers, and industry associations; and key opinion leaders.

Primary interviews were conducted to gather insights, such as market statistics, revenue data collected from solutions and services, market breakups, market size estimations, market forecasts, and data triangulation. Primary research also helped understand various trends related to technologies, applications, deployments, and regions. Stakeholders from the demand side, such as Chief Information Officers (CIOs), Chief Technology Officers (CTOs), Chief Strategy Officers (CSOs), and end users using Process mining solutions, were interviewed to understand the buyer’s perspective on suppliers, products, service providers, and their current usage of Process mining solutions and services, which would impact the overall process mining market.
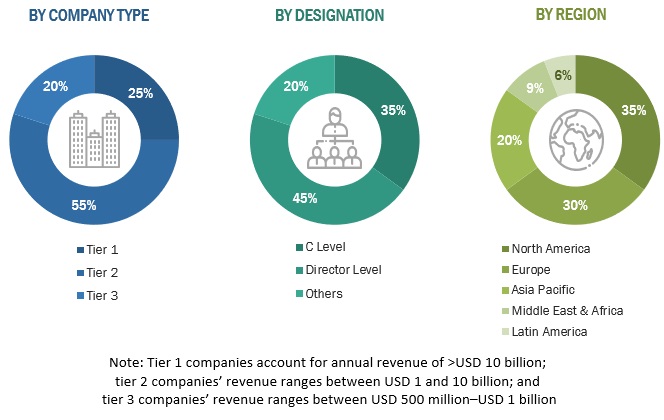
Process Mining Market Size, and Share

To know about the assumptions considered for the study, download the pdf brochure

COMPANY NAME

DESIGNATION

IBM

Business Process Consultant

Celonis

Vice President India COE

Microsoft

Principal Program Manager

UiPath

VP of Engineering - Process Mining

SAP Signavio

Customer Solution Director

Pegasystems

Global Head of Insurance

Market Size Estimation

In the bottom-up approach, the adoption rate of process mining solutions and services among different end users in key countries with respect to their regions contributing the most to the market share was identified. For cross-validation, the adoption of Process mining solutions and services among industries, along with different use cases with respect to their regions, was identified and extrapolated. Weightage was given to use cases identified in different regions for the market size calculation.

Based on the market numbers, the regional split was determined by primary and secondary sources. The procedure included the analysis of the Process mining market’s regional penetration. Based on secondary research, the regional spending on Information and Communications Technology (ICT), socio-economic analysis of each country, strategic vendor analysis of major Process mining providers, and organic and inorganic business development activities of regional and global players were estimated. With the data triangulation procedure and data validation through primaries, the exact values of the overall Process mining market size and segments’ size were determined and confirmed using the study.

Global Process mining Market Size: Bottom-Up and Top-Down Approach:
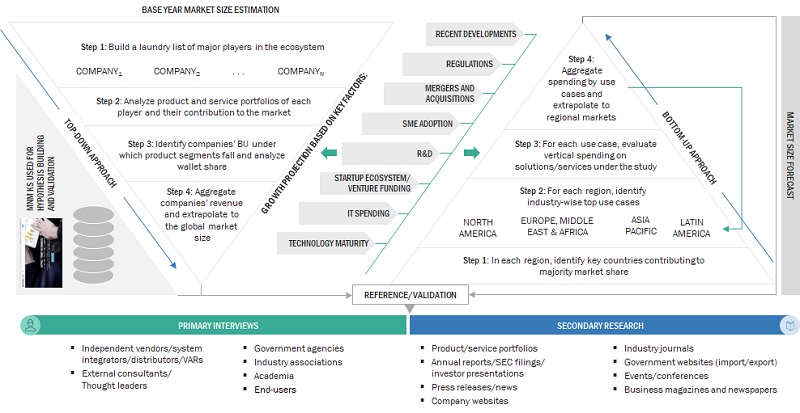
Process Mining Market Size, and Share

To know about the assumptions considered for the study, Request for Free Sample Report

Data Triangulation

Based on the market numbers, the regional split was determined by primary and secondary sources. The procedure included the analysis of the process mining market’s regional penetration. Based on secondary research, the regional spending on Information and Communications Technology (ICT), socio-economic analysis of each country, strategic vendor analysis of major process mining providers, and organic and inorganic business development activities of regional and global players were estimated. With the data triangulation procedure and data validation through primaries, the exact values of the overall Process mining market size and segments’ size were determined and confirmed using the study.

Market Definition

IBM defines process mining as the utilization of specialized algorithms to uncover, validate, and enhance workflows. This approach amalgamates data mining and process analytics, enabling enterprises to extract valuable insights from log data derived from their information systems. This valuable data helps organizations comprehend the efficiency of their processes, unveiling impediments and potential areas for enhancement. Process mining relies on a data-centric strategy for optimizing processes, enabling managers to maintain objectivity in their decisions concerning the allocation of resources to existing processes.

Stakeholders

  • Process mining software vendors
  • Process mining service vendors
  • Managed service providers
  • Support and maintenance service providers
  • System Integrators (SIs)/migration service providers
  • Value-Added Resellers (VARs) and distributors
  • Distributors and Value-added Resellers (VARs)
  • Independent Software Vendors (ISV)
  • Third-party providers
  • Technology providers

Report Objectives

  • To define, describe, and predict the process mining market by offering (software and services), mining algorithm, data source, vertical, and region
  • To provide detailed information related to major factors (drivers, restraints, opportunities, and industry-specific challenges) influencing the market growth
  • To analyze the micro markets with respect to individual growth trends, prospects, and their contribution to the total market
  • To analyze the opportunities in the market for stakeholders by identifying the high-growth segments of the process mining market
  • To analyze opportunities in the market and provide details of the competitive landscape for stakeholders and market leaders
  • To forecast the market size of segments for five main regions: North America, Europe, Asia Pacific, Middle East & Africa, and Latin America
  • To profile key players and comprehensively analyze their market rankings and core competencies.
  • To analyze competitive developments, such as partnerships, new product launches, and mergers and acquisitions, in the process mining market
  • To analyze the impact of recession across all the regions across the process mining market

Available Customizations

With the given market data, MarketsandMarkets offers customizations as per your company’s specific needs. The following customization options are available for the report:

Product Analysis

  • Product quadrant, which gives a detailed comparison of the product portfolio of each company.

Geographic Analysis

  • Further breakup of the North American Process mining market
  • Further breakup of the European market
  • Further breakup of the Asia Pacific market
  • Further breakup of the Middle Eastern & African market
  • Further breakup of the Latin America Process mining market

Company Information

  • Detailed analysis and profiling of additional market players (up to five)
Custom Market Research Services

We will customize the research for you, in case the report listed above does not meet with your exact requirements. Our custom research will comprehensively cover the business information you require to help you arrive at strategic and profitable business decisions.

Request Customization
Report Code
TC 8819
Published ON
Oct, 2023
Choose License Type
BUY NOW
  • SHARE
X
Request Customization
Speak to Analyst
Speak to Analyst
OR FACE-TO-FACE MEETING
PERSONALIZE THIS RESEARCH
  • Triangulate with your Own Data
  • Get Data as per your Format and Definition
  • Gain a Deeper Dive on a Specific Application, Geography, Customer or Competitor
  • Any level of Personalization
REQUEST A FREE CUSTOMIZATION
LET US HELP YOU!
  • What are the Known and Unknown Adjacencies Impacting the Process Mining Market
  • What will your New Revenue Sources be?
  • Who will be your Top Customer; what will make them switch?
  • Defend your Market Share or Win Competitors
  • Get a Scorecard for Target Partners
CUSTOMIZED WORKSHOP REQUEST
  • Call Us
  • +1-888-600-6441 (Corporate office hours)
  • +1-888-600-6441 (US/Can toll free)
  • +44-800-368-9399 (UK office hours)
CONNECT WITH US
ABOUT TRUST ONLINE
©2024 MarketsandMarkets Research Private Ltd. All rights reserved
DMCA.com Protection Status Website Feedback