Produced Water Treatment Market

Produced Water Treatment Market by Application (Onshore, Offshore), Source (Conventional, Unconventional), Treatment (Primary treatment, Secondary treatment, Tertiary treatment) and Region - Global Forecast to 2029

Report Code: EP 2995 Jun, 2024, by marketsandmarkets.com

Produced Water Treatment Market Size, Share, Trends, Growth Report & Forecast

The global produced water treatment market in terms of revenue was estimated to be worth $10.7 billion in 2024 and is poised to reach $13.4 billion by 2029 growing at a CAGR of 4.7% from 2024 to 2029.

Globally, the energy demand is growing significantly with precipitous increase in the population, especially in developing nations. Further, the growing urbanization and industrialization are contributing significantly to global energy requirement. Currently, oil & gas comprise approximately 80% of global energy demand. This drives investment in exploration and production activities, leading to higher demand for produced water treatment solutions, which in turn is expected to boost the market worldwide.

Produced Water Treatment Market

To know about the assumptions considered for the study, Request for Free Sample Report

Produced Water Treatment Market Opportunities

To know about the assumptions considered for the study, download the pdf brochure

Produced Water Treatment Market Dynamics

Driver: Rising global oil and gas production and growing concerns over water resource management

Increasing drilling activities and investments in the oil and gas sector have been a notable trend in recent years. Rising global oil and gas production presents significant growth opportunities for produced water treatment. This is particularly crucial considering the environmental and regulatory concerns associated with untreated water disposal. Efficient water treatment technologies and processes will be essential to mitigate environmental risks and ensure compliance with regulations as oil and gas production escalates globally. The shift towards a more sustainable approach has been driven by the growing concerns over water scarcity and the need to conserve freshwater resources. One of the key strategies employed by the industry is the use of produced water for well completions, reducing the reliance on freshwater sources. This not only conserves freshwater resources but also reduces the costs associated with water disposal and transportation. North America and European markets have comparatively more stringent regulations regarding disposal of produced water. As of 2023, approximately 20% of produced water in the Permian Basin (US) is being recycled and reused for well completions, up from only 10% a few years ago.

Restraint: Requirement of high capital investment and complexity of produced water composition

The high capital investment required for setting up advanced treatment infrastructure is a significant challenge for small and medium-sized oil and gas companies. The economic burden of these investments can be prohibitive for smaller operators, who may not have the financial flexibility of larger companies. This is compounded by the additional costs of pre-treatment, handling, and managing air emissions.

Furthermore, The complexity of produced water composition, which varies significantly depending on the reservoir and production processes, poses a significant challenge for developing standardized treatment solutions. The presence of unidentified organic compounds, due to the lack of comprehensive analytical methods and standard materials, adds another layer of complexity to the treatment process. This diversity in composition necessitates tailored treatment approaches for each site, as a one-size-fits-all solution is impractical, which remains a challenge.

Opportunities: Use of produced water in industrial processes

The use of produced water in industrial applications presents several significant opportunities. By treating produced water, industries can reduce reliance on freshwater sources, thereby alleviating stress on drinking water supplies. Innovations in water treatment and distillation technologies allow produced water to be repurposed for beneficial uses such as offsetting make-up water needs, which can be critical in water-scarce regions. Additionally, treated water can be used in green hydrogen production, contributing to cleaner energy initiatives and reducing overall emissions.

Challenges: Fluctuating oil and gas prices and economic uncertainties

Fluctuating oil and gas prices, exacerbated by economic uncertainties such as geopolitical risks, can significantly impact investment decisions in produced water treatment. The recent large movements and volatility in oil and gas prices, driven by factors like the pandemic, the war in Ukraine, and rising tensions in the Middle East, create uncertainty for investors in the oil and gas industry. During periods of heightened geopolitical risks, investors may become cautious, leading to reduced investment in infrastructure, including produced water treatment facilities. The post-pandemic recovery period saw significant price volatility, further complicating investment decisions in produced water treatment. With oil and gas prices experiencing large-scale fluctuations, companies may prioritize short-term cost-cutting measures over long-term sustainability initiatives like water treatment. Moreover, weak demand and higher non-OPEC production amidst geopolitical tensions can create a challenging operating environment for oil and gas companies, potentially leading to budget constraints and reduced investment in environmental projects.

Produced Water Treatment Market Ecosystem

Leading companies in this market include well-established, financially secure providers of produced water treatment solutions. These corporations have been long operating in the market and have a differentiated product portfolio, advanced technologies, and robust sales and marketing networks. Some of the major companies in this market include SLB (US), Baker Hughes Company (US), TechnipFMC plc (UK), Siemens Energy (Germany), DuPont (UK), and Veolia Environment SA (France).

Top Companies in Produced Water Treatment Market

Tertiary treatment is expected to be the fastest growing segment by treatment type during the forecast period.

Tertiary treatment processes, which include methods like reverse osmosis and advanced oxidation, provide high levels of contaminant removal, making the treated water suitable for reuse in industrial processes or even as potable water. The key factors contributing to this growth include strict environmental laws, the necessity for high-quality water recycling, and advancements in water treatment technologies. Technological innovations in tertiary treatment, such as improved membrane filtration and the integration of multiple treatment techniques, are further driving market development.

By source, offshore is expected to be the fastest segment during the forecast period.

Offshore operations refer to oil and gas activities conducted at oceans or seas. Offshore produced water treatments regularly require more complicated technologies due to the tougher and more varying conditions at sea. This segment is expected to be the fastest in the produced water treatment market due to rising global demand for oil and gas, exploration of new reserves. Major Investments in offshore oil and gas projects are boosting the demand for produced water treatment solutions. For example, Egypt announced an $8.1 billion investment in offshore gas exploration, and Shell has invested $5 billion in Nigeria’s offshore oil production?. These investments indicate a rising focus on offshore extraction, requiring effective water treatment solutions.

“Asia Pacific”: The fastest growing region in the produced water treatment market.

Asia Pacific is the fastest growing region in the produced water treatment market owing to the region experiencing significant population growth and economic development, leading to a corresponding increase in energy demand. The region has vast untapped offshore reserves, particularly in Southeast Asia. Even though Asia Pacific Oil & gas production witnessed a decline during the pandemic years, it is expected to bounce back during the forecast period owing to growing investment in new projects and expansion of shale gas exploration. These are some of the factors that are augmenting the market growth in the region.

Asia Pacific Produced Water Treatment Market Size, and Share

Key Market Players

The produced water treatment market is dominated by a few major players that have a wide regional presence. The major players in the produced water treatment market are SLB (US), Baker Hughes Company (US), TechnipFMC (UK), Siemens Energy (Germany), DuPont (US), and Veolia Environment SA (France).

Between 2020 and 2024, strategies such as product launches, contracts, agreements, partnerships, collaborations, alliances, acquisitions, and expansions are followed by these companies to capture a larger share of the produced water treatment market.

Get online access to the report on the World's First Market Intelligence Cloud

  • Easy to Download Historical Data & Forecast Numbers
  • Company Analysis Dashboard for high growth potential opportunities
  • Research Analyst Access for customization & queries
  • Competitor Analysis with Interactive dashboard
  • Latest News, Updates & Trend analysis
Request Sample

Scope of the Report

Report Metrics

Details

Market size available for years

2021–2029

Base year considered

2023

Forecast period

2024–2029

Forecast units

Value (USD), Volume (Million bbl)

Segments Covered

Source, Application, Treatment

Geographies covered

Asia Pacific, North America, Europe, Middle East & Africa, and South America

Companies covered

SLB (US), Siemens Energy (Germany), Baker Hughes Company (US), Weatherford International ltd (US), Veolia  (France), Nov Inc (US), TechnipFMC Plc (FRANCE), Industrie de nora S.P.A (Italy), Dupont (US), Minerals Technologies Inc. (US), Tetra Technologies, Inc. (US), Ovivo water Ltd (Canada), Alderley Plc (UK), Cannon S.P.A  (Italy), Aquatech (US), BPC (India), Genesis water technologies (US), Diva Envitec (India), Enhydra Ltd (UK), Lewa GMBH (UAE), Filtra system (US), Neer Shakti (India), Enviro Tech Systems (US), Brisbane water (US), Integrated Sustainability consultants Ltd (Canada)

This research report categorizes the Produced water treatment market by Source, Application, Treatment, and region.

On the basis of source:
  • Conventional
  • Unconventional
On the basis of application:
  • Onshore
  • Offshore
On the basis of treatment:
  • Primary treatment
  • Secondary treatment
  • Tertiary treatment
On the basis of region:
  • Asia Pacific
  • Europe
  • North America
  • Middle East & Africa
  • South America

Recent Developments

  • In April 2024, SLB and ChampionX Corporation announced a definitive agreement for SLB to purchase ChampionX in an all-stock transaction. ChampionX Corporation is a global leader in chemistry solutions, artificial lift systems, and highly engineered equipment and technologies that help companies drill for and produce oil and gas safely, efficiently, and sustainably around the world. This acquisition would allow SLB to enhance its product portfolio.
  • In September 2023, SLB signed a subsurface technology partnership with INEOS Energy to collaborate on subsurface technologies, including AI capabilities, to enhance operational performance, growth, acquisitions, and Carbon Capture and Storage (CCS).
  • In April 2022, Veolia water technologies launched barrel, an integrated plug-and-play reverse osmosis (RO) technology, catering to the desalination market and water reuse applications. This technology offers a sustainable source of fresh water meeting all quality standards.
  • In July 2021, TechnipFMC plc acquired the remaining 49% of shares of TIOS AS which provides fully integrated Riserless Light Well Intervention (RLWI) services. TIOS AS is a joint venture between TechnipFMC and Island Offshore which was formed in 2018.

Frequently Asked Questions (FAQ):

To speak to our analyst for a discussion on the above findings, click Speak to Analyst

TABLE OF CONTENTS
 
1 INTRODUCTION (Page No. - 31)
    1.1 STUDY OBJECTIVES 
    1.2 MARKET DEFINITION 
    1.3 STUDY SCOPE 
           1.3.1 MARKETS COVERED
                    FIGURE 1 PRODUCED WATER TREATMENT MARKET SEGMENTATION
           1.3.2 INCLUSIONS AND EXCLUSIONS
           1.3.3 REGIONAL SCOPE
           1.3.4 YEARS CONSIDERED
    1.4 CURRENCY CONSIDERED 
    1.5 UNITS CONSIDERED 
    1.6 LIMITATIONS 
    1.7 STAKEHOLDERS 
    1.8 SUMMARY OF CHANGES 
    1.9 IMPACT OF RECESSION 
 
2 RESEARCH METHODOLOGY (Page No. - 36)
    2.1 RESEARCH DATA 
           FIGURE 2 PRODUCED WATER TREATMENT MARKET: RESEARCH DESIGN
           2.1.1 PRIMARY AND SECONDARY RESEARCH
           2.1.2 SECONDARY DATA
                    2.1.2.1 Key data from secondary sources
                    2.1.2.2 List of key secondary sources
           2.1.3 PRIMARY DATA
                    2.1.3.1 Key data from primary sources
                    2.1.3.2 List of primary interview participants
                    2.1.3.3 Key industry insights
                    2.1.3.4 Breakdown of primaries
    2.2 MARKET BREAKDOWN AND DATA TRIANGULATION 
           FIGURE 3 PRODUCED WATER TREATMENT MARKET: DATA TRIANGULATION
    2.3 MARKET SIZE ESTIMATION METHODOLOGY 
           2.3.1 BOTTOM-UP APPROACH
                    2.3.1.1 Approach to arrive at market size using bottom-up analysis (demand side)
                               FIGURE 4 MARKET: BOTTOM-UP APPROACH
                    2.3.1.2 Demand-side analysis
                               FIGURE 5 KEY METRICS CONSIDERED TO ANALYZE DEMAND FOR PRODUCED WATER TREATMENT SOLUTIONS
                               2.3.1.2.1 Demand-side assumptions
                               2.3.1.2.2 Demand-side calculations
           2.3.2 TOP-DOWN APPROACH
                    2.3.2.1 Approach to arrive at market size using top-down analysis (supply side)
                               FIGURE 6 PRODUCED WATER TREATMENT MARKET: TOP-DOWN APPROACH
                    2.3.2.2 Supply-side analysis
                               2.3.2.2.1 Supply-side assumptions
                               2.3.2.2.2 Supply-side calculations
    2.4 RISK ASSESSMENT 
           TABLE 1 MARKET: RISK ASSESSMENT
    2.5 RESEARCH ASSUMPTIONS 
           TABLE 2 MARKET: RESEARCH ASSUMPTIONS
    2.6 RESEARCH LIMITATIONS 
    2.7 PARAMETERS CONSIDERED TO ANALYZE RECESSION IMPACT ON MARKET 
           TABLE 3 PARAMETERS CONSIDERED TO ANALYZE RECESSION IMPACT ON MARKET
 
3 EXECUTIVE SUMMARY (Page No. - 50)
    TABLE 4 PRODUCED WATER TREATMENT MARKET SNAPSHOT 
    FIGURE 7 NORTH AMERICA TO HOLD LARGEST SHARE OF GLOBAL MARKET IN 2024 
    FIGURE 8 OFFSHORE SEGMENT TO EXHIBIT HIGHER CAGR IN MARKET, BY APPLICATION, DURING FORECAST PERIOD 
    FIGURE 9 PRIMARY SEGMENT TO DOMINATE MARKET, BY TREATMENT, BETWEEN  2024 AND 2029 
    FIGURE 10 CONVENTIONAL SEGMENT TO EXHIBIT HIGHER CAGR FROM 2024 TO 2029 
 
4 PREMIUM INSIGHTS (Page No. - 54)
    4.1 ATTRACTIVE OPPORTUNITIES FOR PLAYERS IN MARKET 
           FIGURE 11 RISING OIL AND GAS EXPLORATION AND PRODUCTION TO DRIVE MARKET
    4.2 MARKET IN NORTH AMERICA,  BY TREATMENT AND COUNTRY 
           FIGURE 12 PRIMARY SEGMENT AND US TO HOLD LARGEST SHARES OF NORTH AMERICAN MARKET IN 2024
    4.3 MARKET, BY APPLICATION 
           FIGURE 13 ONSHORE SEGMENT TO ACCOUNT FOR LARGER MARKET SHARE IN 2029
    4.4 MARKET, BY TREATMENT 
           FIGURE 14 PRIMARY SEGMENT TO HOLD LARGEST SHARE OF MARKET IN 2029
    4.5 MARKET, BY SOURCE 
           FIGURE 15 CONVENTIONAL SEGMENT TO ACCOUNT FOR LARGER MARKET SHARE IN 2029
 
5 MARKET OVERVIEW (Page No. - 57)
    5.1 INTRODUCTION 
    5.2 MARKET DYNAMICS 
           FIGURE 16 PRODUCED WATER TREATMENT MARKET: DRIVERS, RESTRAINTS, OPPORTUNITIES, AND CHALLENGES
           5.2.1 DRIVERS
                    5.2.1.1 Escalating global crude oil and gas production
                               FIGURE 17 CRUDE OIL PRODUCTION, BY COUNTRY (MT)
                               FIGURE 18 GLOBAL OIL DEMAND, BY REGION (MB/D), 2019–2028
                    5.2.1.2 Growing concerns about water scarcity and freshwater management
                    5.2.1.3 Increasing reliance on hydraulic fracturing process for shale gas production
           5.2.2 RESTRAINTS
                    5.2.2.1 Requirement for high capital investments
           5.2.3 OPPORTUNITIES
                    5.2.3.1 Mounting production of natural gas to address blue hydrogen demand
                    5.2.3.2 Increasing use of produced water in industrial applications
                    5.2.3.3 Rising development of shale gas resources
                               FIGURE 19 SHALE GAS AND OTHER NATURAL GAS PRODUCTION IN SELECTED COUNTRIES, 2015 AND 2040
           5.2.4 CHALLENGES
                    5.2.4.1 High salinity and total dissolved solid levels of produced water
                    5.2.4.2 Challenges associated with disposal of treated produced water
                    5.2.4.3 Fluctuating oil & gas prices and economic uncertainties
                    5.2.4.4 Complexities in developing standardized produced water treatment solutions
                               FIGURE 20 PRICES OF BRENT CRUDE OIL (USD/BARREL)
    5.3 TRENDS/DISRUPTIONS IMPACTING CUSTOMERS’ BUSINESSES 
           FIGURE 21 TRENDS/DISRUPTIONS IMPACTING CUSTOMERS’ BUSINESSES
    5.4 PRICING ANALYSIS 
           5.4.1 INDICATIVE PRICING TREND OF PRODUCED WATER TREATMENT SOLUTIONS, BY TREATMENT
                    FIGURE 22 INDICATIVE PRICING TREND OF PRODUCED WATER TREATMENT SOLUTIONS,  BY TREATMENT, 2021–2023 (USD/BBL)
                    TABLE 5 INDICATIVE PRICING TREND OF PRODUCED WATER TREATMENT SOLUTIONS,  BY TREATMENT, 2021–2023 (USD/BBL)
           5.4.2 AVERAGE SELLING PRICE TREND, BY REGION
                    FIGURE 23 AVERAGE SELLING PRICE TREND OF PRODUCED WATER TREATMENT SOLUTIONS, BY REGION, 2021–2023 (USD MILLION)
                    TABLE 6 AVERAGE SELLING PRICE TREND OF PRODUCED WATER TREATMENT SOLUTIONS,  BY REGION, 2021–2023 (USD MILLION)
    5.5 SUPPLY CHAIN ANALYSIS 
           FIGURE 24 SUPPLY CHAIN ANALYSIS
    5.6 ECOSYSTEM ANALYSIS 
           TABLE 7 ROLE OF COMPANIES IN PRODUCED WATER TREATMENT ECOSYSTEM
           FIGURE 25 ECOSYSTEM ANALYSIS
    5.7 REGULATORY LANDSCAPE 
           5.7.1 REGULATORY BODIES, GOVERNMENT AGENCIES,  AND OTHER ORGANIZATIONS
                    TABLE 8 NORTH AMERICA: LIST OF REGULATORY BODIES, GOVERNMENT AGENCIES,  AND OTHER ORGANIZATIONS
                    TABLE 9 EUROPE: LIST OF REGULATORY BODIES, GOVERNMENT AGENCIES,  AND OTHER ORGANIZATIONS
                    TABLE 10 ASIA PACIFIC: LIST OF REGULATORY BODIES, GOVERNMENT AGENCIES,  AND OTHER ORGANIZATIONS
                    TABLE 11 ROW: LIST OF REGULATORY BODIES, GOVERNMENT AGENCIES,  AND OTHER ORGANIZATIONS
           5.7.2 CODES AND REGULATIONS
                    TABLE 12 NORTH AMERICA: CODES AND REGULATIONS
                    TABLE 13 ASIA PACIFIC: CODES AND REGULATIONS
                    TABLE 14 GLOBAL: CODES AND REGULATIONS
    5.8 PATENT ANALYSIS 
           FIGURE 26 PATENTS APPLIED AND GRANTED, 2013–2023
           TABLE 15 LIST OF PATENTS, 2018–2022
    5.9 CASE STUDY ANALYSIS 
           5.9.1 CHAMPIONX DEPLOYS PRODUCED WATER TREATMENT SIMULATOR TO REDUCE CHEMICAL COSTS IN STEAM-ASSISTED GRAVITY DRAINAGE (SAGD) OPERATIONS
           5.9.2 OIL PRODUCER IN MONTNEY IMPLEMENTS CHEMICAL  PRE-TREATMENT AND SWIRLTEX ULTRAFILTRATION  SYSTEM TO PREVENT MEMBRANE FOULING
           5.9.3 GENESIS WATER TECHNOLOGIES USES ELECTROCOAGULATION SYSTEM TO TEST PRODUCED AND FLOWBACK WATER SAMPLES
    5.10 TECHNOLOGY ANALYSIS 
           5.10.1 KEY TECHNOLOGIES
                    5.10.1.1 Corrugated plate separators (CPS)
                    5.10.1.2 Induced gas flotation (IGF)
                    5.10.1.3 Dissolved gas flotation (DGF)
                    5.10.1.4 Activated carbon filters
           5.10.2 ADJACENT TECHNOLOGIES
                    5.10.2.1 Automated variable filtration (AVF)
    5.11 KEY CONFERENCES & EVENTS, 2024–2025 
                    TABLE 16 LIST OF KEY CONFERENCES & EVENTS, 2024–2025
    5.12 TRADE ANALYSIS 
           5.12.1 EXPORT SCENARIO (HS CODE 842199)
                    TABLE 17 EXPORT DATA FOR HS CODE 842199-COMPLIANT PRODUCTS, BY COUNTRY,  2020–2022 (USD THOUSAND)
                    FIGURE 27 EXPORT DATA FOR HS CODE 842199-COMPLIANT PRODUCTS FOR  TOP 5 COUNTRIES, 2020–2022 (USD THOUSAND)
           5.12.2 IMPORT SCENARIO (HS CODE 842199)
                    TABLE 18 IMPORT DATA FOR HS CODE 842199-COMPLIANT PRODUCTS, BY COUNTRY,  2020–2022 (USD THOUSAND)
                    FIGURE 28 IMPORT DATA FOR HS CODE 842199-COMPLIANT PRODUCTS FOR TOP 5 COUNTRIES, 2020–2022 (USD THOUSAND)
    5.13 PORTER’S FIVE FORCES ANALYSIS 
                    FIGURE 29 PORTER’S FIVE FORCES ANALYSIS
                    TABLE 19 PORTER’S FIVE FORCES ANALYSIS
           5.13.1 THREAT OF SUBSTITUTES
           5.13.2 BARGAINING POWER OF SUPPLIERS
           5.13.3 BARGAINING POWER OF BUYERS
           5.13.4 THREAT OF NEW ENTRANTS
           5.13.5 INTENSITY OF COMPETITIVE RIVALRY
    5.14 KEY STAKEHOLDERS AND BUYING CRITERIA 
           5.14.1 KEY STAKEHOLDERS IN BUYING PROCESS
                    FIGURE 30 INFLUENCE OF KEY STAKEHOLDERS ON BUYING PROCESS FOR  TOP THREE TREATMENTS
                    TABLE 20 INFLUENCE OF STAKEHOLDERS ON BUYING PROCESS FOR TOP THREE TREATMENTS
           5.14.2 BUYING CRITERIA
                    FIGURE 31 KEY BUYING CRITERIA, BY APPLICATION
                    TABLE 21 KEY BUYING CRITERIA, BY APPLICATION
    5.15 INVESTMENT AND FUNDING SCENARIO 
                    FIGURE 32 INVESTMENT AND FUNDING SCENARIO (USD THOUSAND)
 
6 PRODUCED WATER TREATMENT MARKET, BY TREATMENT (Page No. - 93)
    6.1 INTRODUCTION 
           FIGURE 33 TERTIARY SEGMENT TO ACCOUNT FOR LARGEST SHARE OF MARKET, BY TREATMENT, IN 2029
           TABLE 22 MARKET, BY TREATMENT, 2021–2023 (USD MILLION)
           TABLE 23 MARKET, BY TREATMENT, 2024–2029 (USD MILLION)
    6.2 PRIMARY 
           6.2.1 ENFORCEMENT OF STRICT ENVIRONMENTAL REGULATIONS TO ACCELERATE SEGMENTAL GROWTH
                    TABLE 24 PRIMARY: MARKET, BY REGION,  2021–2023 (USD MILLION)
                    TABLE 25 PRIMARY: MARKET, BY REGION,  2024–2029 (USD MILLION)
    6.3 SECONDARY 
           6.3.1 RISE IN UNCONVENTIONAL HYDROCARBON EXTRACTION TO CONTRIBUTE TO SEGMENTAL GROWTH
                    TABLE 26 SECONDARY: MARKET, BY REGION,  2021–2023 (USD MILLION)
                    TABLE 27 SECONDARY: MARKET, BY REGION,  2024–2029 (USD MILLION)
    6.4 TERTIARY 
           6.4.1 IMPROVEMENT IN MEMBRANE FILTRATION TECHNIQUES TO FUEL SEGMENTAL GROWTH
                    TABLE 28 TERTIARY: MARKET, BY REGION,  2021–2023 (USD MILLION)
                    TABLE 29 TERTIARY: MARKET, BY REGION,  2024–2029 (USD MILLION)
    6.5 OTHER TREATMENTS 
           TABLE 30 OTHER TREATMENTS: MARKET, BY REGION,  2021–2023 (USD MILLION)
           TABLE 31 OTHER TREATMENTS: MARKET, BY REGION,  2024–2029 (USD MILLION)
 
7 PRODUCED WATER TREATMENT MARKET, BY SOURCE (Page No. - 100)
    7.1 INTRODUCTION 
           FIGURE 34 CONVENTIONAL SEGMENT TO HOLD LARGER MARKET SHARE IN 2029
           TABLE 32 MARKET, BY SOURCE, 2021–2023 (USD MILLION)
           TABLE 33 MARKET, BY SOURCE, 2024–2029 (USD MILLION)
    7.2 CONVENTIONAL 
           7.2.1 RISING EMPHASIS ON HYDROCARBON RECOVERY TO FACILITATE SEGMENTAL GROWTH
                    TABLE 34 CONVENTIONAL: MARKET, BY REGION,  2021–2023 (USD MILLION)
                    TABLE 35 CONVENTIONAL: MARKET, BY REGION,  2024–2029 (USD MILLION)
    7.3 UNCONVENTIONAL 
           7.3.1 INCREASING ENFORCEMENT OF STRICT ENVIRONMENTAL REGULATIONS TO BOOST SEGMENTAL GROWTH
                    TABLE 36 UNCONVENTIONAL: MARKET, BY REGION,  2021–2023 (USD MILLION)
                    TABLE 37 UNCONVENTIONAL: MARKET, BY REGION,  2024–2029 (USD MILLION)
 
8 PRODUCED WATER TREATMENT MARKET, BY APPLICATION (Page No. - 104)
    8.1 INTRODUCTION 
           FIGURE 35 ONSHORE APPLICATIONS TO HOLD LARGER SHARE OF MARKET IN 2029
           TABLE 38 MARKET, BY APPLICATION, 2021–2023 (USD MILLION)
           TABLE 39 MARKET, BY APPLICATION, 2024–2029 (USD MILLION)
    8.2 ONSHORE 
           8.2.1 INCREASE IN OIL & GAS EXTRACTION ACTIVITIES TO CONTRIBUTE TO SEGMENTAL GROWTH
                    TABLE 40 ONSHORE: MARKET, BY REGION,  2021–2023 (USD MILLION)
                    TABLE 41 ONSHORE: MARKET, BY REGION,  2024–2029 (USD MILLION)
    8.3 OFFSHORE 
           8.3.1 ADOPTION OF SUSTAINABLE WATER MANAGEMENT PRACTICES TO AUGMENT SEGMENTAL GROWTH
                    TABLE 42 OFFSHORE: MARKET, BY REGION,  2021–2023 (USD MILLION)
                    TABLE 43 OFFSHORE: MARKET, BY REGION,  2024–2029 (USD MILLION)
 
9 PRODUCED WATER TREATMENT MARKET, BY REGION (Page No. - 109)
    9.1 INTRODUCTION 
           FIGURE 36 ASIA PACIFIC TO REGISTER HIGHEST CAGR BETWEEN 2024 AND 2029
           FIGURE 37 NORTH AMERICA ACCOUNTED FOR LARGEST MARKET SHARE IN 2023
           TABLE 44 MARKET, BY REGION, 2021–2023 (USD MILLION)
           TABLE 45 MARKET, BY REGION, 2024–2029 (USD MILLION)
           TABLE 46 MARKET, BY REGION, 2021–2023 (MILLION BBL)
           TABLE 47 MARKET, BY REGION, 2024–2029 (MILLION BBL)
    9.2 NORTH AMERICA 
           9.2.1 RECESSION IMPACT ON MARKET  IN NORTH AMERICA
                    FIGURE 38 NORTH AMERICA: MARKET SNAPSHOT, 2023
                    TABLE 48 NORTH AMERICA: MARKET, BY APPLICATION,  2021–2023 (USD MILLION)
                    TABLE 49 NORTH AMERICA: MARKET, BY APPLICATION,  2024–2029 (USD MILLION)
                    TABLE 50 NORTH AMERICA: MARKET, BY TREATMENT,  2021–2023 (USD MILLION)
                    TABLE 51 NORTH AMERICA: MARKET, BY TREATMENT,  2024–2029 (USD MILLION)
                    TABLE 52 NORTH AMERICA: MARKET, BY SOURCE,  2021–2023 (USD MILLION)
                    TABLE 53 NORTH AMERICA: MARKET, BY SOURCE,  2024–2029 (USD MILLION)
                    TABLE 54 NORTH AMERICA: MARKET, BY COUNTRY,  2021–2023 (USD MILLION)
                    TABLE 55 NORTH AMERICA: MARKET, BY COUNTRY,  2024–2029 (USD MILLION)
           9.2.2 US
                    9.2.2.1 Reliance on digital solutions to enhance water treatment processes to drive market
                               TABLE 56 US: MARKET, BY APPLICATION,  2021–2023 (USD MILLION)
                               TABLE 57 US: MARKET, BY APPLICATION,  2024–2029 (USD MILLION)
           9.2.3 CANADA
                    9.2.3.1 Emphasis on complying with environmental standards to foster market growth
                               TABLE 58 CANADA: MARKET, BY APPLICATION,  2021–2023 (USD MILLION)
                               TABLE 59 CANADA: MARKET, BY APPLICATION,  2024–2029 (USD MILLION)
           9.2.4 MEXICO
                    9.2.4.1 Deployment of advanced water treatment technologies to boost market growth
                               TABLE 60 MEXICO: MARKET, BY APPLICATION,  2021–2023 (USD MILLION)
                               TABLE 61 MEXICO: MARKET, BY APPLICATION,  2024–2029 (USD MILLION)
    9.3 ASIA PACIFIC 
           9.3.1 RECESSION IMPACT ON MARKET  IN ASIA PACIFIC
                    FIGURE 39 ASIA PACIFIC: MARKET SNAPSHOT, 2023
                    TABLE 62 ASIA PACIFIC: MARKET, BY APPLICATION,  2021–2023 (USD MILLION)
                    TABLE 63 ASIA PACIFIC: MARKET, BY APPLICATION,  2024–2029 (USD MILLION)
                    TABLE 64 ASIA PACIFIC: MARKET, BY TREATMENT,  2021–2023 (USD MILLION)
                    TABLE 65 ASIA PACIFIC: MARKET, BY TREATMENT,  2024–2029 (USD MILLION)
                    TABLE 66 ASIA PACIFIC: MARKET, BY SOURCE,  2021–2023 (USD MILLION)
                    TABLE 67 ASIA PACIFIC: MARKET, BY SOURCE,  2024–2029 (USD MILLION)
                    TABLE 68 ASIA PACIFIC: MARKET, BY COUNTRY,  2021–2023 (USD MILLION)
                    TABLE 69 ASIA PACIFIC: MARKET, BY COUNTRY,  2024–2029 (USD MILLION)
           9.3.2 CHINA
                    9.3.2.1 Rapid advancement in IoT-based monitoring systems to accelerate market growth
                               TABLE 70 CHINA: MARKET, BY APPLICATION,  2021–2023 (USD MILLION)
                               TABLE 71 CHINA: MARKET, BY APPLICATION,  2024–2029 (USD MILLION)
           9.3.3 INDIA
                    9.3.3.1 Availability of onshore and offshore oil and gas reserves to contribute to market growth
                               TABLE 72 INDIA: MARKET, BY APPLICATION,  2021–2023 (USD MILLION)
                               TABLE 73 INDIA: MARKET, BY APPLICATION,  2024–2029 (USD MILLION)
           9.3.4 KAZAKHSTAN
                    9.3.4.1 Emphasis on complying with regulatory standards and safeguarding local environments to fuel market growth
                               TABLE 74 KAZAKHSTAN: MARKET, BY APPLICATION,  2021–2023 (USD MILLION)
                               TABLE 75 KAZAKHSTAN: MARKET, BY APPLICATION,  2024–2029 (USD MILLION)
           9.3.5 INDONESIA
                    9.3.5.1 Focus on meeting sustainability goals through water reuse to boost segmental growth
                               TABLE 76 INDONESIA: MARKET, BY APPLICATION,  2021–2023 (USD MILLION)
                               TABLE 77 INDONESIA: MARKET, BY APPLICATION,  2024–2029 (USD MILLION)
           9.3.6 REST OF ASIA PACIFIC
                    TABLE 78 REST OF ASIA PACIFIC: MARKET, BY APPLICATION,  2021–2023 (USD MILLION)
                    TABLE 79 REST OF ASIA PACIFIC: MARKET, BY APPLICATION,  2024–2029 (USD MILLION)
    9.4 EUROPE 
           9.4.1 RECESSION IMPACT ON MARKET  IN EUROPE
                    TABLE 80 EUROPE: MARKET, BY APPLICATION,  2021–2023 (USD MILLION)
                    TABLE 81 EUROPE: MARKET, BY APPLICATION,  2024–2029 (USD MILLION)
                    TABLE 82 EUROPE: MARKET, BY TREATMENT,  2021–2023 (USD MILLION)
                    TABLE 83 EUROPE: MARKET, BY TREATMENT,  2024–2029 (USD MILLION)
                    TABLE 84 EUROPE: MARKET, BY SOURCE,  2021–2023 (USD MILLION)
                    TABLE 85 EUROPE: MARKET, BY SOURCE,  2024–2029 (USD MILLION)
                    TABLE 86 EUROPE: MARKET, BY COUNTRY,  2021–2023 (USD MILLION)
                    TABLE 87 EUROPE: MARKET, BY COUNTRY,  2024–2029 (USD MILLION)
           9.4.2 RUSSIA
                    9.4.2.1 Increasing oil and gas drilling activities to foster market growth
                               TABLE 88 RUSSIA: MARKET, BY APPLICATION,  2021–2023 (USD MILLION)
                               TABLE 89 RUSSIA: MARKET, BY APPLICATION,  2024–2029 (USD MILLION)
           9.4.3 UK
                    9.4.3.1 Rising commitment to granting offshore licenses to accelerate market growth
                               TABLE 90 UK: MARKET, BY APPLICATION,  2021–2023 (USD MILLION)
                               TABLE 91 UK: MARKET, BY APPLICATION,  2024–2029 (USD MILLION)
           9.4.4 NORWAY
                    9.4.4.1 Growing emphasis on complying with environmental regulations to facilitate market growth
                               TABLE 92 NORWAY: MARKET, BY APPLICATION,  2021–2023 (USD MILLION)
                               TABLE 93 NORWAY: MARKET, BY APPLICATION,  2024–2029 (USD MILLION)
           9.4.5 REST OF EUROPE
                               TABLE 94 REST OF EUROPE: MARKET, BY APPLICATION,  2021–2023 (USD MILLION)
                               TABLE 95 REST OF EUROPE: MARKET, BY APPLICATION,  2024–2029 (USD MILLION)
    9.5 MIDDLE EAST & AFRICA 
           9.5.1 RECESSION IMPACT ON MARKET  IN MIDDLE EAST & AFRICA
                               TABLE 96 MIDDLE EAST & AFRICA: MARKET, BY APPLICATION, 2021–2023 (USD MILLION)
                               TABLE 97 MIDDLE EAST & AFRICA: MARKET, BY APPLICATION, 2024–2029 (USD MILLION)
                               TABLE 98 MIDDLE EAST & AFRICA: MARKET, BY TREATMENT,  2021–2023 (USD MILLION)
                               TABLE 99 MIDDLE EAST & AFRICA: MARKET, BY TREATMENT,  2024–2029 (USD MILLION)
                               TABLE 100 MIDDLE EAST & AFRICA: MARKET, BY SOURCE,  2021–2023 (USD MILLION)
                               TABLE 101 MIDDLE EAST & AFRICA: MARKET, BY SOURCE,  2024–2029 (USD MILLION)
                               TABLE 102 MIDDLE EAST & AFRICA: MARKET, BY COUNTRY,  2021–2023 (USD MILLION)
                               TABLE 103 MIDDLE EAST & AFRICA: MARKET, BY COUNTRY,  2024–2029 (USD MILLION)
           9.5.2 GCC
                    TABLE 104 GCC: MARKET, BY COUNTRY, 2021–2023 (USD MILLION)
                    TABLE 105 GCC: MARKET, BY COUNTRY, 2024–2029 (USD MILLION)
                    TABLE 106 GCC: MARKET, BY APPLICATION,  2021–2023 (USD MILLION)
                    TABLE 107 GCC: MARKET, BY APPLICATION,  2024–2029 (USD MILLION)
                    9.5.2.1 Saudi Arabia
                               9.5.2.1.1 Increasing upstream crude oil and natural gas production to contribute to market growth
                               TABLE 108 SAUDI ARABIA: MARKET, BY APPLICATION,  2021–2023 (USD MILLION)
                               TABLE 109 SAUDI ARABIA: MARKET, BY APPLICATION,  2024–2029 (USD MILLION)
                    9.5.2.2 UAE
                               9.5.2.2.1 Mounting investment in natural gas production projects to fuel market growth
                               TABLE 110 UAE: MARKET, BY APPLICATION,  2021–2023 (USD MILLION)
                               TABLE 111 UAE: MARKET, BY APPLICATION,  2024–2029 (USD MILLION)
                    9.5.2.3 Rest of GCC countries
                               TABLE 112 REST OF GCC COUNTRIES: MARKET, BY APPLICATION, 2021–2023 (USD MILLION)
                               TABLE 113 REST OF GCC COUNTRIES: MARKET, BY APPLICATION, 2024–2029 (USD MILLION)
           9.5.3 IRAQ
                    9.5.3.1 High commitment to boost oil output to drive market
                               TABLE 114 IRAQ: MARKET, BY APPLICATION,  2021–2023 (USD MILLION)
                               TABLE 115 IRAQ: MARKET, BY APPLICATION,  2024–2029 (USD MILLION)
           9.5.4 IRAN
                    9.5.4.1 Digital transformation in oil & gas sector to foster market growth
                               TABLE 116 IRAN: MARKET, BY APPLICATION,  2021–2023 (USD MILLION)
                               TABLE 117 IRAN: MARKET, BY APPLICATION,  2024–2029 (USD MILLION)
           9.5.5 AFRICA & REST OF MIDDLE EAST
                    TABLE 118 AFRICA & REST OF MIDDLE EAST: MARKET,  BY APPLICATION, 2021–2023 (USD MILLION)
                    TABLE 119 AFRICA & REST OF MIDDLE EAST: MARKET,  BY APPLICATION, 2024–2029 (USD MILLION)
    9.6 SOUTH AMERICA 
           9.6.1 RECESSION IMPACT ON PRODUCED WATER TREATMENT MARKET  IN SOUTH AMERICA
                    TABLE 120 SOUTH AMERICA: MARKET, BY APPLICATION,  2021–2023 (USD MILLION)
                    TABLE 121 SOUTH AMERICA: MARKET, BY APPLICATION,  2024–2029 (USD MILLION)
                    TABLE 122 SOUTH AMERICA: MARKET, BY TREATMENT,  2021–2023 (USD MILLION)
                    TABLE 123 SOUTH AMERICA: MARKET, BY TREATMENT,  2024–2029 (USD MILLION)
                    TABLE 124 SOUTH AMERICA: MARKET, BY SOURCE,  2021–2023 (USD MILLION)
                    TABLE 125 SOUTH AMERICA: MARKET, BY SOURCE,  2024–2029 (USD MILLION)
                    TABLE 126 SOUTH AMERICA: MARKET, BY COUNTRY,  2021–2023 (USD MILLION)
                    TABLE 127 SOUTH AMERICA: MARKET, BY COUNTRY,  2024–2029 (USD MILLION)
           9.6.2 BRAZIL
                    9.6.2.1 Mounting investment in oil and gas exploration projects to contribute to market growth
                               TABLE 128 BRAZIL: MARKET, BY APPLICATION,  2021–2023 (USD MILLION)
                               TABLE 129 BRAZIL: MARKET, BY APPLICATION,  2024–2029 (USD MILLION)
           9.6.3 COLOMBIA
                    9.6.3.1 Increasing natural gas and oil production to augment market growth
                               TABLE 130 COLOMBIA: MARKET, BY APPLICATION,  2021–2023 (USD MILLION)
                               TABLE 131 COLOMBIA: MARKET, BY APPLICATION,  2024–2029 (USD MILLION)
           9.6.4 VENEZUELA
                    9.6.4.1 Rising oil extraction and production to foster market growth
                               TABLE 132 VENEZUELA: MARKET, BY APPLICATION,  2021–2023 (USD MILLION)
                               TABLE 133 VENEZUELA: MARKET, BY APPLICATION,  2024–2029 (USD MILLION)
           9.6.5 REST OF SOUTH AMERICA
                    TABLE 134 REST OF SOUTH AMERICA: MARKET, BY APPLICATION, 2021–2023 (USD MILLION)
                    TABLE 135 REST OF SOUTH AMERICA: MARKET, BY APPLICATION, 2024–2029 (USD MILLION)
 
10 COMPETITIVE LANDSCAPE (Page No. - 154)
     10.1 OVERVIEW 
     10.2 KEY PLAYER STRATEGIES/RIGHT TO WIN, 2021–2024 
               TABLE 136 MARKET: OVERVIEW OF STRATEGIES ADOPTED  BY KEY PLAYERS, 2021–2024
     10.3 MARKET SHARE ANALYSIS, 2023 
               FIGURE 40 MARKET SHARE ANALYSIS, 2023
               TABLE 137 TREATMENT MARKET: DEGREE OF COMPETITION, 2023
               FIGURE 41 MARKET SHARE ANALYSIS, 2023
     10.4 REVENUE ANALYSIS, 2019–2023 
               FIGURE 42 REVENUE ANALYSIS OF FIVE KEY PLAYERS, 2019–2023
     10.5 COMPANY EVALUATION MATRIX: KEY PLAYERS, 2023 
             10.5.1 STARS
             10.5.2 EMERGING LEADERS
             10.5.3 PERVASIVE PLAYERS
             10.5.4 PARTICIPANTS
                       FIGURE 43 MARKET: COMPANY EVALUATION MATRIX  (KEY PLAYERS), 2023
             10.5.5 COMPANY FOOTPRINT: KEY PLAYERS, 2023
                       10.5.5.1 Company footprint
                                   FIGURE 44 MARKET: COMPANY FOOTPRINT
                       10.5.5.2 Application footprint
                                   TABLE 138 MARKET: APPLICATION FOOTPRINT
                       10.5.5.3 Treatment footprint
                                   TABLE 139 MARKET: TREATMENT FOOTPRINT
                       10.5.5.4 Source footprint
                                   TABLE 140 MARKET: SOURCE FOOTPRINT
                       10.5.5.5 Region footprint
                                   TABLE 141 MARKET: REGION FOOTPRINT
     10.6 COMPANY EVALUATION MATRIX: START-UPS/SMES, 2023 
             10.6.1 PROGRESSIVE COMPANIES
             10.6.2 RESPONSIVE COMPANIES
             10.6.3 DYNAMIC COMPANIES
             10.6.4 STARTING BLOCKS
                       FIGURE 45 MARKET: COMPANY EVALUATION MATRIX (START-UPS/SMES), 2023
             10.6.5 COMPETITIVE BENCHMARKING: START-UPS/SMES, 2023
                       10.6.5.1 Detailed list of key start-ups/SMEs
                                   TABLE 142 MARKET: DETAILED LIST OF KEY START-UPS/SMES
                       10.6.5.2 Competitive benchmarking of key start-ups/SMEs
                                   TABLE 143 MARKET: COMPETITIVE BENCHMARKING OF KEY START-UPS/SMES
     10.7 COMPETITIVE SCENARIO AND TRENDS 
             10.7.1 PRODUCT LAUNCHES
                       TABLE 144 MARKET: PRODUCT LAUNCHES,  JANUARY 2021–APRIL 2024
             10.7.2 DEALS
                       TABLE 145 MARKET: DEALS, JANUARY 2021–APRIL 2024
             10.7.3 OTHERS
                       TABLE 146 MARKET: OTHERS, JANUARY 2021–APRIL 2024
     10.8 COMPANY VALUATION AND FINANCIAL METRICS 
               FIGURE 46 MARKET: COMPANY VALUATION, 2024
               FIGURE 47 MARKET: FINANCIAL METRICS, 2024
     10.9 BRAND/PRODUCT COMPARISON 
               FIGURE 48 MARKET: BRAND/PRODUCT COMPARISON
 
11 COMPANY PROFILES (Page No. - 174)
     11.1 KEY COMPANIES 
(Business Overview, Products/Services/Solutions Offered, Recent Developments, MnM View, Key Strengths and Right to Win, Strategic Choices Made, Weaknesses and Competitive Threats)*
             11.1.1 BAKER HUGHES COMPANY
                       TABLE 147 BAKER HUGHES COMPANY: COMPANY OVERVIEW
                       FIGURE 49 BAKER HUGHES COMPANY: COMPANY SNAPSHOT
                       TABLE 148 BAKER HUGHES COMPANY: PRODUCTS/SOLUTIONS/SERVICES OFFERED
             11.1.2 TECHNIPFMC PLC
                       TABLE 149 TECHNIPFMC PLC: COMPANY OVERVIEW
                       FIGURE 50 TECHNIPFMC PLC: COMPANY SNAPSHOT
                       TABLE 150 TECHNIPFMC PLC: PRODUCTS/SOLUTIONS/SERVICES OFFERED
                       TABLE 151 TECHNIPFMC PLC: DEALS
             11.1.3 SLB
                       TABLE 152 SLB: COMPANY OVERVIEW
                       FIGURE 51 SLB: COMPANY SNAPSHOT
                       TABLE 153 SLB: PRODUCTS/SOLUTIONS/SERVICES OFFERED
                       TABLE 154 SLB: DEALS
             11.1.4 SIEMENS ENERGY
                       TABLE 155 SIEMENS ENERGY: COMPANY OVERVIEW
                       FIGURE 52 SIEMENS ENERGY: COMPANY SNAPSHOT
                       TABLE 156 SIEMENS ENERGY: PRODUCTS/SOLUTIONS/SERVICES OFFERED
             11.1.5 VEOLIA
                       TABLE 157 VEOLIA: COMPANY OVERVIEW
                       FIGURE 53 VEOLIA: COMPANY SNAPSHOT
                       TABLE 158 VEOLIA: PRODUCTS/SOLUTIONS/SERVICES OFFERED
                       TABLE 159 VEOLIA: PRODUCT LAUNCHES
                       TABLE 160 VEOLIA: DEALS
             11.1.6 WEATHERFORD
                       TABLE 161 WEATHERFORD: COMPANY OVERVIEW
                       FIGURE 54 WEATHERFORD: COMPANY SNAPSHOT
                       TABLE 162 WEATHERFORD: PRODUCTS/SOLUTIONS/SERVICES OFFERED
             11.1.7 NOV
                       TABLE 163 NOV: COMPANY OVERVIEW
                       FIGURE 55 NOV: COMPANY SNAPSHOT
                       TABLE 164 NOV: PRODUCTS/SOLUTIONS/SERVICES OFFERED
             11.1.8 INDUSTRIE DE NORA S.P.A.
                       TABLE 165 INDUSTRIE DE NORA S.P.A.: COMPANY OVERVIEW
                       TABLE 166 INDUSTRIE DE NORA S.P.A.: PRODUCTS/SOLUTIONS/SERVICES OFFERED
                       TABLE 167 INDUSTRIE DE NORA S.P.A.: DEALS
             11.1.9 DUPONT
                       TABLE 168 DUPONT: COMPANY OVERVIEW
                       FIGURE 56 DUPONT: COMPANY SNAPSHOT
                       TABLE 169 DUPONT: PRODUCTS/SOLUTIONS/SERVICES OFFERED
             11.1.10 MINERALS TECHNOLOGIES INC.
                                   TABLE 170 MINERALS TECHNOLOGIES INC.: COMPANY OVERVIEW
                                   FIGURE 57 MINERALS TECHNOLOGIES INC.: COMPANY SNAPSHOT
                                   TABLE 171 MINERALS TECHNOLOGIES INC.: PRODUCTS/SOLUTIONS/SERVICES OFFERED
             11.1.11 TETRA TECHNOLOGIES, INC.
                                   TABLE 172 TETRA TECHNOLOGIES, INC.: COMPANY OVERVIEW
                                   FIGURE 58 TETRA TECHNOLOGIES, INC.: COMPANY SNAPSHOT
                                   TABLE 173 TETRA TECHNOLOGIES, INC.: PRODUCTS/SOLUTIONS/SERVICES OFFERED
             11.1.12 OVIVO
                                   TABLE 174 OVIVO: COMPANY OVERVIEW
                                   TABLE 175 OVIVO: PRODUCTS/SOLUTIONS/SERVICES OFFERED
             11.1.13 ALDERLEY
                                   TABLE 176 ALDERLEY PLC: COMPANY OVERVIEW
                                   TABLE 177 ALDERLEY PLC: PRODUCTS/SOLUTIONS/SERVICES OFFERED
             11.1.14 CANNON S.P.A.
                                   TABLE 178 CANNON S.P.A.: COMPANY OVERVIEW
                                   TABLE 179 CANNON S.P.A.: PRODUCTS/SOLUTIONS/SERVICES OFFERED
                                   TABLE 180 CANNON S.P.A.: OTHERS
             11.1.15 AQUATECH
                                   TABLE 181 AQUATECH: COMPANY OVERVIEW
                                   TABLE 182 AQUATECH: PRODUCTS/SOLUTIONS/SERVICES OFFERED
             11.1.16 BIOPETROCLEAN
                                   TABLE 183 BIOPETROCLEAN: COMPANY OVERVIEW
                                   TABLE 184 BIOPETROCLEAN: PRODUCTS/SOLUTIONS/SERVICES OFFERED
             11.1.17 GENESIS WATER TECHNOLOGIES
                                   TABLE 185 GENESIS WATER TECHNOLOGIES: COMPANY OVERVIEW
                                   TABLE 186 GENESIS WATER TECHNOLOGIES: PRODUCTS/SERVICES/SOLUTIONS OFFERED
                                   TABLE 187 GENESIS WATER TECHNOLOGIES: PRODUCT LAUNCHES
                                   TABLE 188 GENESIS WATER TECHNOLOGIES: DEALS
             11.1.18 DIVA ENVITEC
                                   TABLE 189 DIVA ENVITEC: COMPANY OVERVIEW
                                   TABLE 190 DIVA ENVITEC: PRODUCTS/SERVICES/SOLUTIONS OFFERED
             11.1.19 ENHYDRA LTD
                                   TABLE 191 ENHYDRA LTD: COMPANY OVERVIEW
                                   TABLE 192 ENHYDRA LTD: PRODUCTS/SERVICES/SOLUTIONS OFFERED
             11.1.20 LEWA GMBH
                                   TABLE 193 LEWA GMBH: COMPANY OVERVIEW
                                   TABLE 194 LEWA GMBH: PRODUCTS/SERVICES/SOLUTIONS OFFERED
                                   TABLE 195 LEWA GMBH: DEALS
*Business Overview, Products/Services/Solutions Offered, Recent Developments, MnM View, Key Strengths and Right to Win, Strategic Choices Made, Weaknesses and Competitive Threats might not be captured in case of unlisted companies.
     11.2 OTHER PLAYERS 
             11.2.1 FILTRA SYSTEMS
             11.2.2 NEER SHAKTI
             11.2.3 ENVIRO-TECH SYSTEMS
             11.2.4 BRISBEN WATER
             11.2.5 INTEGRATED SUSTAINABILITY CONSULTANTS LTD.
 
12 APPENDIX (Page No. - 217)
     12.1 INSIGHTS FROM INDUSTRY EXPERTS 
     12.2 DISCUSSION GUIDE 
     12.3 KNOWLEDGESTORE: MARKETSANDMARKETS’  SUBSCRIPTION PORTAL 
     12.4 CUSTOMIZATION OPTIONS 
     12.5 RELATED REPORTS 
     12.6 AUTHOR DETAILS 

The study involved major activities in estimating the current size of the produced water treatment market. Exhaustive secondary research was done to collect information on the peer and parent markets. The next step was to validate these findings, assumptions, and sizing with industry experts across the value chain through primary research. Both top-down and bottom-up approaches were employed to estimate the complete market size. Thereafter, market breakdown and data triangulation were used to estimate the market size of the segments and subsegments.

Secondary Research

This research study on the produced water treatment market involved the use of extensive secondary sources, directories, and databases, such as Hoovers, Bloomberg, Businessweek, Factiva, International Energy Agency, and United States Energy Association, to identify and collect information useful for a technical, market-oriented, and commercial study of the global market. The other secondary sources included annual reports of the companies involved in the market, press releases & investor presentations of companies, white papers, certified publications, articles by recognized authors, manufacturer associations, trade directories, and databases.

Primary Research

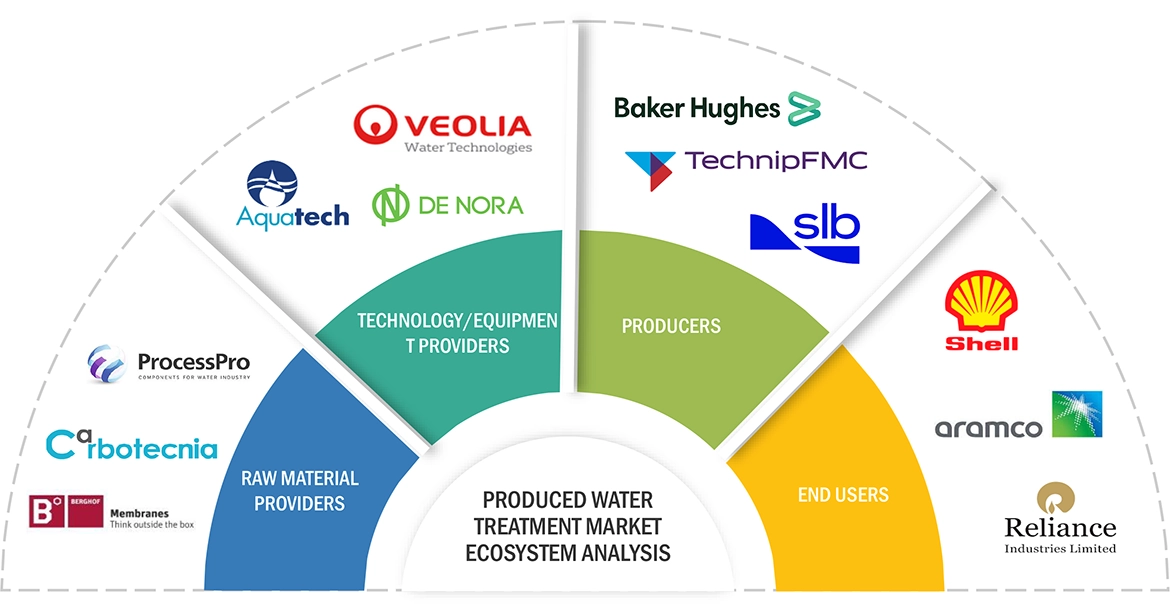
The produced water treatment market comprises several stakeholders such as produced water treatment manufacturers, produced water treatment service companies, suppliers and distributors of produced water treatment in the supply chain. The demand side of this market is characterized by the increasing oil & gas exploration activities. The supply side is characterized by rising demand for contracts from the oil & gas sector and mergers & acquisitions among big players. Various primary sources from both the supply and demand sides of the market were interviewed to obtain qualitative and quantitative information.

Following is the breakdown of primary respondents: 

Produced Water Treatment Market Size, and Share

To know about the assumptions considered for the study, download the pdf brochure

Market Size Estimation

Both top-down and bottom-up approaches were used to estimate and validate the total size of the produced water treatment market. These methods were also used extensively to estimate the size of various subsegments in the market. The research methodology used to estimate the market size includes the following:

  • The key players in the industry and market have been identified through extensive secondary research, and their market share in the respective regions has been determined through both secondary and primary research.
  • The industry’s value chain and market size, in terms of value, have been determined through primary and secondary research processes.
  • All percentage shares, splits, and breakdowns have been determined using secondary sources and verified through primaries.

Global Produced Water Treatment Market Size: Top-down Approach

Produced Water Treatment Market Top Down Approach

Global produced water treatment Market Size: Bottom-Up Approach

Produced Water Treatment Market Bottom Up Approach

Data Triangulation

After arriving at the overall market size from the estimation process explained above, the total market has been split into several segments and subsegments. The complete market engineering process is done to arrive at the exact statistics for all the segments and subsegments, also data triangulation and market breakdown processes have been employed, wherever applicable. The data has been triangulated by examining various factors and trends from both the demand- and supply sides. Along with this, the market has been validated through both the top-down and bottom-up approaches.

Market Definition

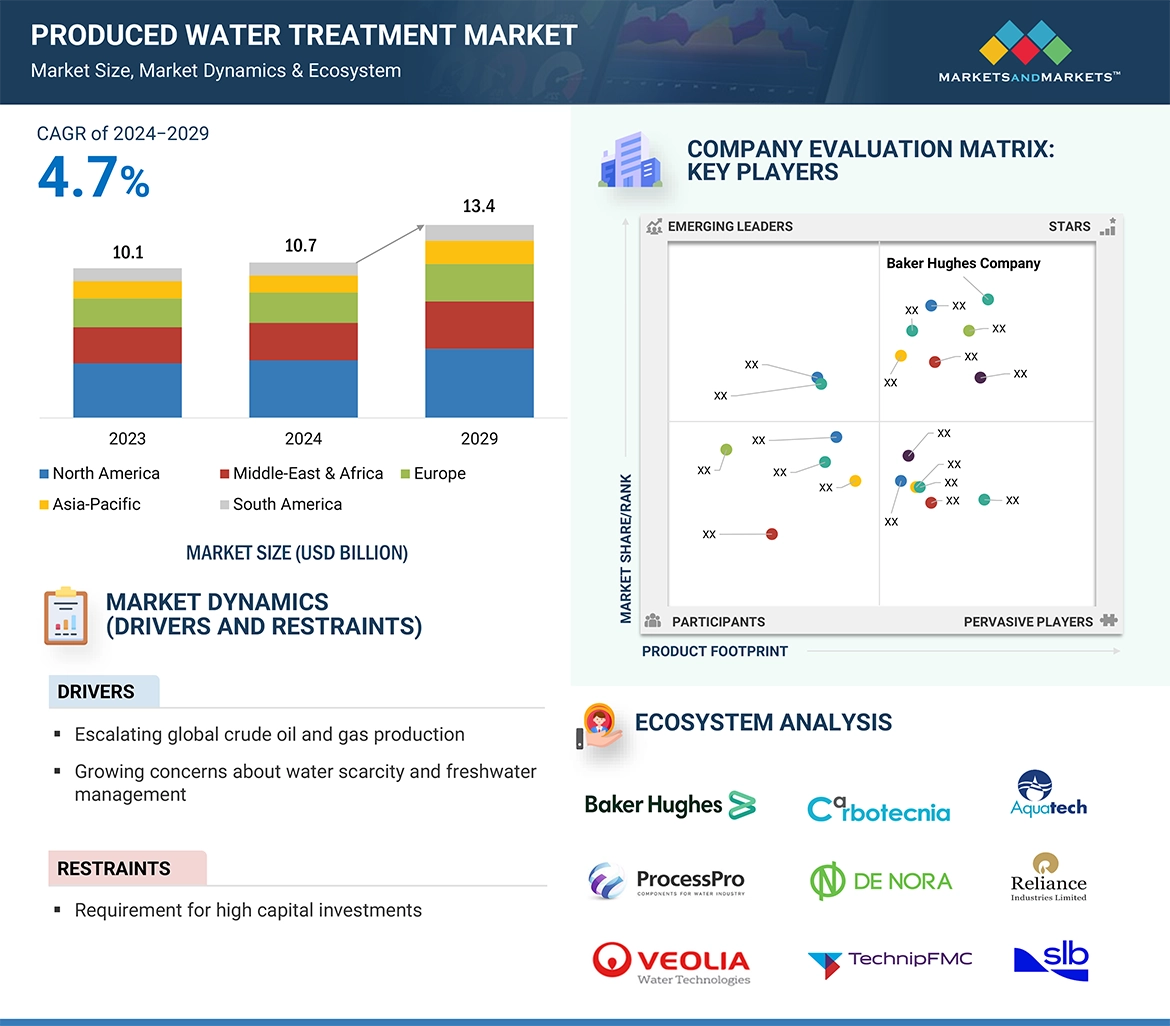
Produced water, which is a byproduct of oil and gas exploration process, requires active treatment to meet environmental regulations and helps in reuse or safe disposal. This produced water has a mixture of injected water, Natural formation water, and any other chemicals used in the exploration and drilling process.

Key Stakeholders

  • Produced water treatment manufacturers and providers
  • Manufacturing industries
  • R&D laboratories
  • Consulting companies from the energy & power sector
  • Distributors of produced water treatment
  • Government and research organizations
  • State and national regulatory authorities

Objectives of the Study

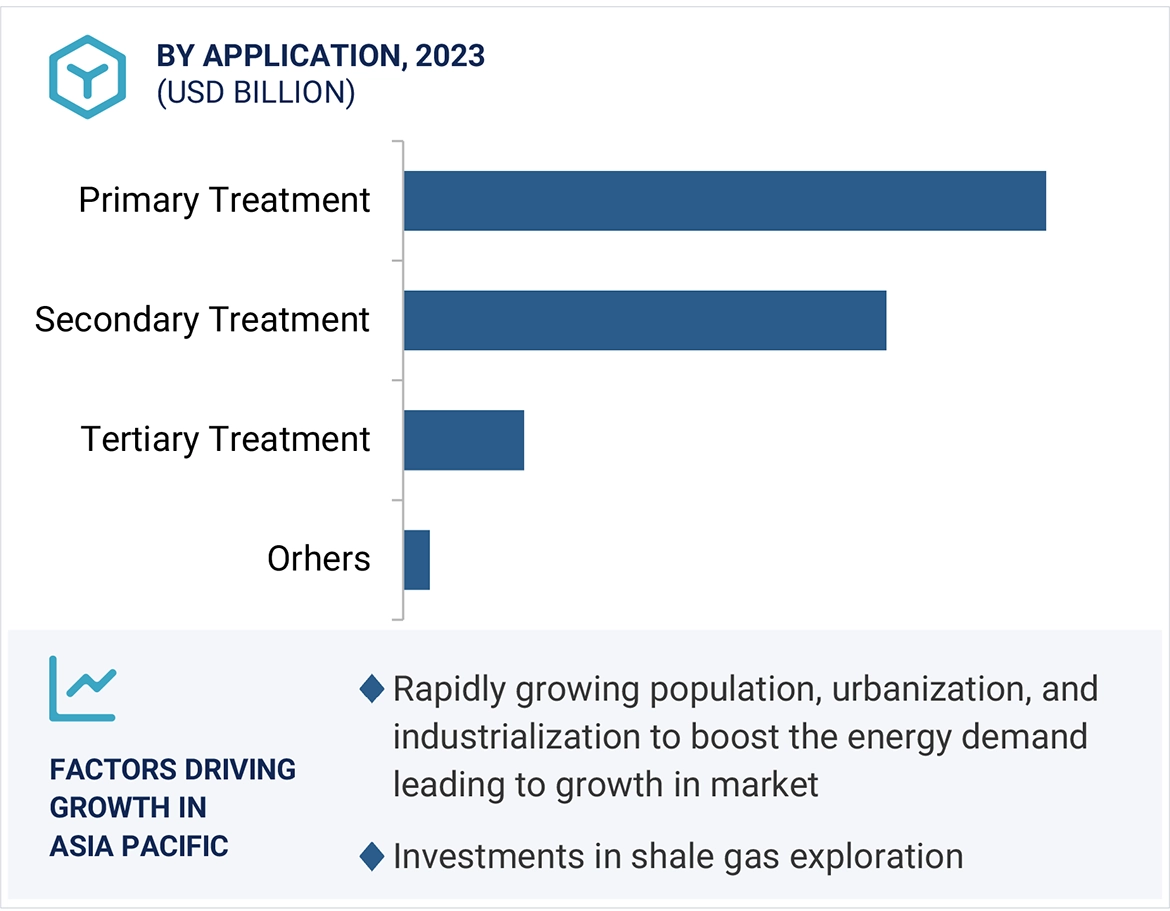
  • To define, describe, segment, and forecast the produced water treatment market by application, by source, and by treatment in terms of value and volume.
  • To describe and forecast the market for six key regions: North America, Europe, Asia Pacific, South America, the Middle East, and Africa, along with their country-level market sizes, in terms of value.
  • To provide detailed information regarding key drivers, restraints, opportunities, and challenges influencing market growth
  • To strategically analyze the micro markets with respect to individual growth trends, prospects, and contributions to the overall market size
  • To provide supply chain analysis, trends/disruptions impacting customer business, ecosystem/market map, pricing analysis, Porter’s five forces analysis, case study analysis, and regulatory standards pertaining to produced water treatment
  • To analyze opportunities for stakeholders in the produced water treatment and draw a competitive landscape of the market.
  • To strategically analyze the ecosystem, tariffs and regulations, patents, and trading scenarios pertaining to produced water treatment
  • To compare key market players based on product specifications and applications.
  • To strategically profile key players and comprehensively analyze their market rankings and core competencies
  • To analyze competitive developments, such as contracts and agreements, investments and expansions, mergers and acquisitions, partnerships, joint ventures, and collaborations, in produced water treatment

Available Customizations:

With the given market data, MarketsandMarkets offers customizations as per the client’s specific needs. The following customization options are available for this report:

Geographic Analysis

  • Further breakdown of region or country-specific analysis

Company Information

  • Detailed analysis and profiling of additional market players (up to 5)
Custom Market Research Services

We will customize the research for you, in case the report listed above does not meet with your exact requirements. Our custom research will comprehensively cover the business information you require to help you arrive at strategic and profitable business decisions.

Request Customization
Report Code
EP 2995
Published ON
Jun, 2024
Choose License Type
BUY NOW
  • SHARE
X
Request Customization
Speak to Analyst
Speak to Analyst
OR FACE-TO-FACE MEETING
PERSONALIZE THIS RESEARCH
  • Triangulate with your Own Data
  • Get Data as per your Format and Definition
  • Gain a Deeper Dive on a Specific Application, Geography, Customer or Competitor
  • Any level of Personalization
REQUEST A FREE CUSTOMIZATION
LET US HELP YOU!
  • What are the Known and Unknown Adjacencies Impacting the Produced Water Treatment Market
  • What will your New Revenue Sources be?
  • Who will be your Top Customer; what will make them switch?
  • Defend your Market Share or Win Competitors
  • Get a Scorecard for Target Partners
CUSTOMIZED WORKSHOP REQUEST
  • Call Us
  • +1-888-600-6441 (Corporate office hours)
  • +1-888-600-6441 (US/Can toll free)
  • +44-800-368-9399 (UK office hours)
CONNECT WITH US
ABOUT TRUST ONLINE
©2024 MarketsandMarkets Research Private Ltd. All rights reserved
DMCA.com Protection Status Website Feedback