The study involved four major activities in estimating the current size of the Robotic Warfare market. Exhaustive secondary research was done to collect information on the market, peer market, and parent market. The next step was to validate these findings, assumptions, and sizing with industry experts across the value chain through primary research. Both top-down and bottom-up approaches were employed to estimate the complete market size. After that, market breakdown and data triangulation were used to estimate the market size of segments and subsegments.
Secondary Research
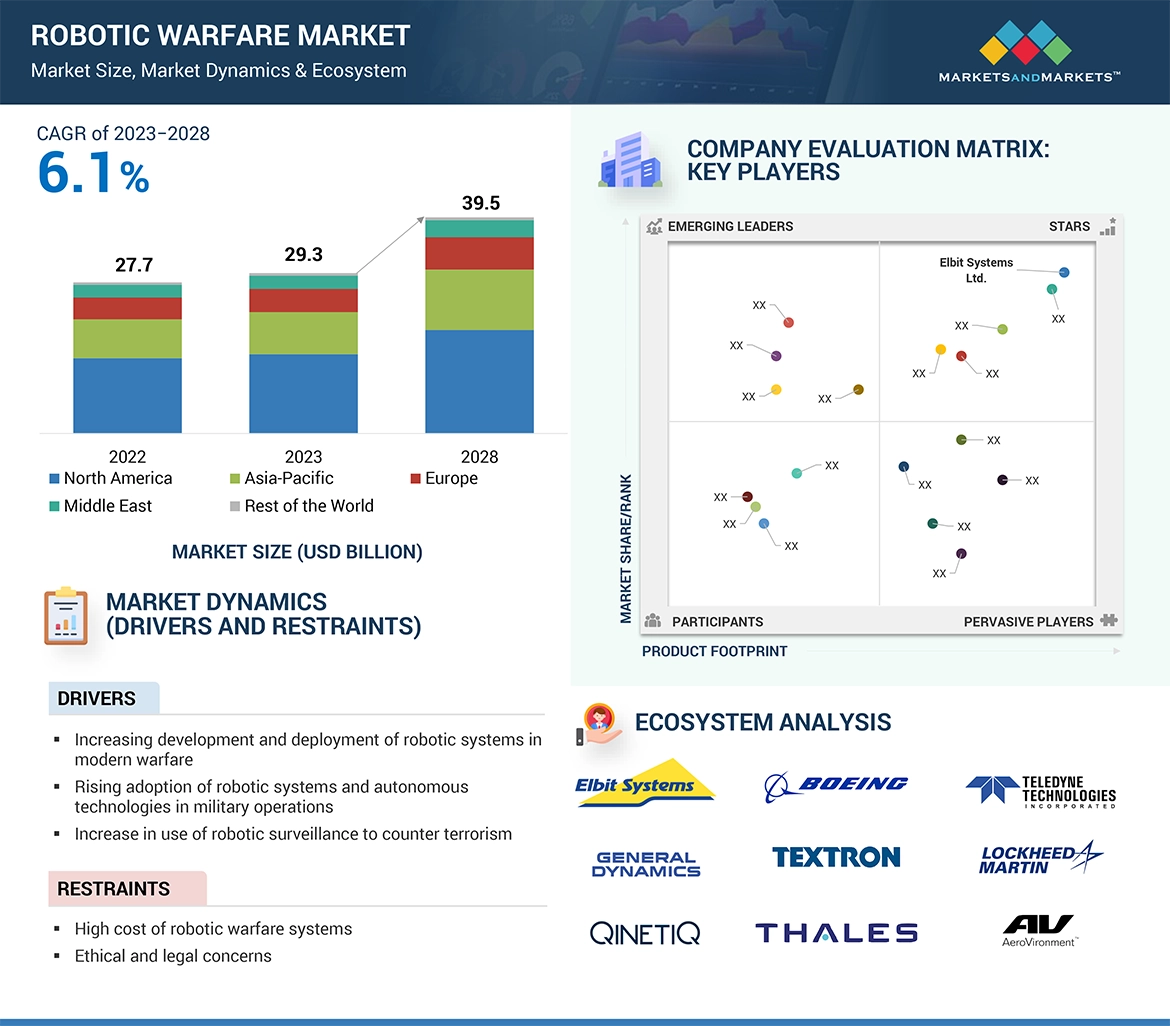
The ranking analysis of companies in the Robotic Warfare market was carried out using secondary data from paid and unpaid sources, as well as by analyzing the product portfolios and service offerings of key companies operating in the market. These companies were rated based on the performance and quality of their products. These data points were further validated by primary sources.
Secondary sources referred for this research study included the conference and Expo of Military Vehicles, corporate filings such as annual reports, investor presentations, and financial statements of trade, business, and professional associations. The secondary data was collected and analyzed to arrive at the overall size of the market, which was validated by primary respondents.
Primary Research
Extensive primary research was conducted after obtaining information regarding the Robotic Warfare market scenario through secondary research. Several primary interviews were conducted with market experts from both the demand and supply sides across major countries of North America, Europe, and Asia Pacific. Primary data was collected through questionnaires, emails, and telephonic interviews. The primary sources from the supply side included various industry experts, such as Chief X Officers (CXOs), Vice Presidents (VPs), Directors from business development, marketing, product development/innovation teams, and related key executives from Robotic Warfare companies; service providers; distributors; and key opinion leaders.
Primary interviews were conducted to gather insights such as market statistics, data on revenue collected from the products and services, market breakdowns, market size estimations, market forecasting, and data triangulation. Primary research also helped in understanding the various trends related to technology, application, vertical, and region. Stakeholders from the demand side, such as CIOs, CTOs, CSOs, and installation teams of the customer/end users who are using Robotic Warfare, were interviewed to understand the buyer’s perspective on the suppliers, products, component providers, and their current usage of Robotic Warfare and future outlook of their business which will affect the overall market.

To know about the assumptions considered for the study, download the pdf brochure
Market Size Estimation
The research methodology used to estimate the size of the Robotic Warfare market includes the following details.
-
The top-down and bottom-up approaches were used to estimate and validate the size of the Robotic Warfare market. The research methodology used to estimate the market size includes the following details.
-
The key players were identified through secondary research, and their market ranking was determined through primary and secondary research. This included a study of the annual and financial reports of the top market players and extensive interviews of leaders, including chief executive officers (CEO), directors, and marketing executives.
-
All percentage shares, splits, and breakdowns were determined using secondary sources and verified through primary sources. All possible parameters that affect the markets covered in this research study were accounted for, viewed in extensive detail, verified through primary research, and analyzed to obtain the final quantitative and qualitative data. This data was consolidated, enhanced with detailed inputs, analyzed by MarketsandMarkets, and presented in this report.
Robotic Warfare Market Size: Bottom-Up Approach
The bottom-up approach was employed to arrive at the overall size of the Robotic Warfare market by determining the revenues of key players and their shares in the market. Calculations based on the revenue of key players identified in the market led to the estimation of the overall market size.
The following steps were used for calculating the military robots market from a bottom-up approach:
-
The types of military robots and equipment per platform were identified and categorized by application
-
The market was sized through the procurement of military robots and equipment and was mapped through contracts, modernization programs, year-on-year growth in platforms, and military budgets.
-
The average selling price for types of military robots and equipment per platform was calculated through product mapping, contract mapping and other available information through secondary research and primary research.
-
The market was arrived at by multiplying the average selling price by the estimated number of military robots and equipment per platform.

Global Robotic Warfare Market Size: Top-Down Approach
In the top-down approach, the overall market size was used to estimate the size of individual. In the top-down approach, the overall market size was used to estimate the size of individual markets through percentage splits obtained from secondary and primary research. For the calculation of sizes of specific market segments, the size of the most appropriate immediate parent market was used to implement the top-down approach. The bottom-up approach was also implemented to validate the revenues obtained for various market segments.
Market shares were estimated for each company to verify revenue shares used earlier in the bottom-up approach. With the data triangulation procedure and validation of data through primaries, the overall parent market size and each individual market size were determined and confirmed in this study.

Data Triangulation
After arriving at the overall market size, the total market has been split into several segments and subsegments. The data triangulation and market breakdown procedures explained below have been implemented, wherever applicable, to complete the overall market engineering process and arrive at the estimated market numbers for Robotic Warfare segments and subsegments. The data has been triangulated by studying various factors and trends from both the demand and supply sides. Along with this, the market size was validated using the top-down and bottom-up approaches.
Market Definition
Robotic warfare, also known as military robotics or autonomous warfare, refers to the use of robotic systems, drones, and artificial intelligence in military operations. These technologies are designed to perform tasks traditionally carried out by humans in the battlefield or other military environments. Robotic warfare encompasses a variety of autonomous or semi-autonomous machines, including drones, ground robots, and robotic weapons systems. This technology involves the development and deployment of autonomous or remotely controlled machines to perform a wide range of military tasks. Which include reconnaissance, surveillance, intelligence gathering, search and rescue operations, bomb disposal, logistics support, and even combat operations. Robotic Warfare includes the use of robotic technologies in warfare to conduct military operations to protect their soldiers by gathering intelligence for ground troops, carrying injured soldiers and supplies in and out of battle, and striking nearby targets by robots. It reduces casualties, costs, and increases situational awareness and can be operated in any critical and harsh situations.
Report Objectives
-
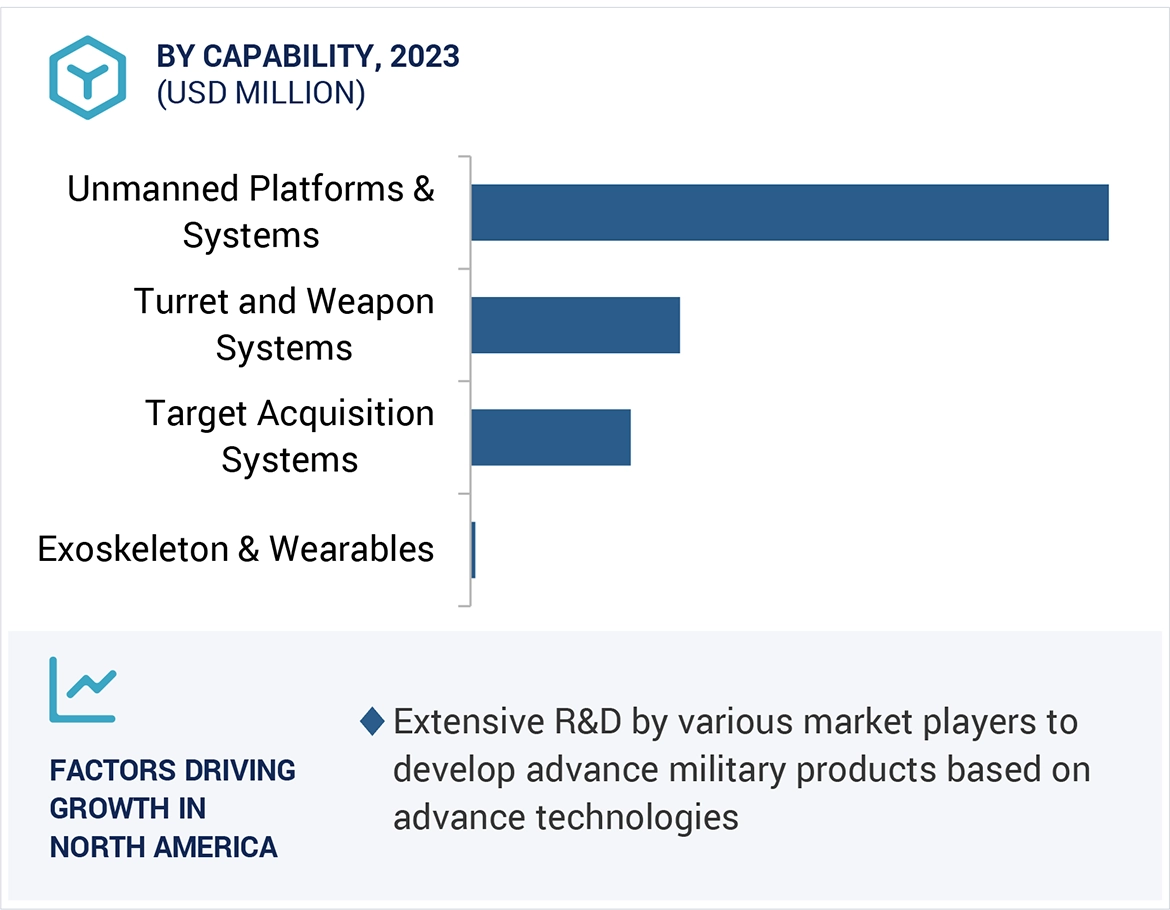
To define, describe, and forecast the size of the Robotic Warfare market based on Application, Capability, Mode of Operation and Domain.
-
To forecast the size of the market segments with respect to four regions: North America, Europe, Asia Pacific, and the Rest of the World (RoW), along with their key countries
-
To identify and analyze drivers, restraints, opportunities, and challenges influencing the growth of the market
-
To identify the industry and technology trends prevailing in the Robotic Warfare market
-
To analyze micromarkets1 with respect to their individual growth trends, prospects, and contribution to the market
-
To profile leading companies in the market based on their product portfolios, market shares, and key growth strategies
-
To track and analyze competitive developments such as joint ventures, mergers, and product launches carried out by the key players in the market
-
To profile leading companies in the market based on their product portfolios, market shares, and key growth strategies
-
To track and analyze competitive developments such as joint ventures, mergers, and product launches carried out by the key players in the market
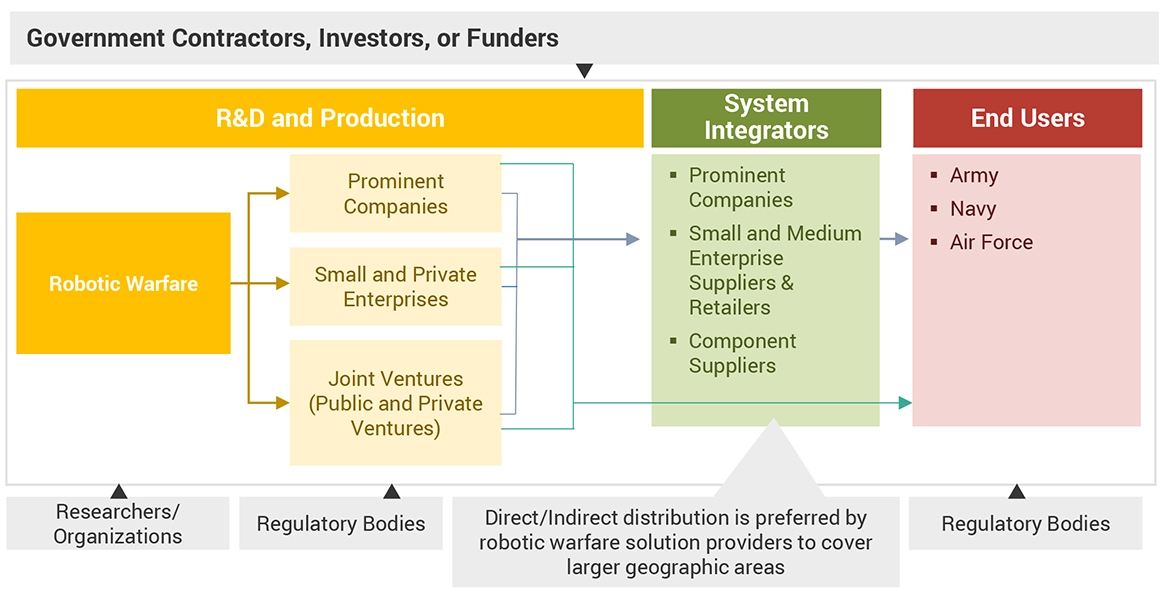
Markets takeholders
-
Suppliers of Robotic Technologies
-
Software/Hardware/Service and Solution Providers
-
Government Agencies
-
Defense Regulatory Bodies
Available Customizations
MarketsAndMarkets offers the following customizations for this market report:
-
Additional country-level analysis of the Robotic Warfare market
-
Profiling of additional market players (up to 5)
Product Analysis
-
Product matrix, which provides a detailed comparison of the product portfolio of each company in the Robotic Warfare market


Growth opportunities and latent adjacency in Robotic Warfare Market