Satellite Solar Cell Materials Market

Satellite Solar Cell Materials Market by Material Type (Silicon, Copper Indium Gallium Selenide (CIGS), Gallium Arsenide (GaAs)), Application (Satellite, Rovers, Space Stations), Orbit (LEO, MEO, GEO, HEO, Polar Orbit), & Region - Global Forecast to 2030

Report Code: CH 8971 Mar, 2024, by marketsandmarkets.com

Updated on : April 23, 2024

Satellite Solar Cell Materials Market

The satellite solar cell materials market was valued at USD 44 million in 2024 and is projected to reach USD 96 million by 2030, growing at 13.7% cagr from 2024 to 2030. The global satellite solar cells materials market is primarily propelled by support and investments by the Government. As countries increasingly recognize the strategic importance of space exploration, communication, and Earth observation, governments worldwide are channeling significant resources into satellite programs, solar cell, which convert sunlight into electricity, are integral components of satellite systems. Additionally increasing satellite deployments and rise in space exploration are also driving the solar cell materials market.

Attractive Opportunities In The Satellite Solar Cell Materials Market

Satellite Solar Cell Materials Market

To know about the assumptions considered for the study, Request for Free Sample Report

Satellite Solar Cell Materials Market

Satellite Solar Cell Materials Market Dynamics

Driver: Rising Space Exploration and Satellite Deployment

The rising tide of space exploration and satellite deployment is a major driver of the satellite solar cell materials market. A 2023 blog published by the Union of Concerned Scientists stated, in 2022, the global count of operational satellites orbiting Earth reached 6,718, signifying a remarkable surge of nearly 2,000 satellites within a single year. As more nations and commercial groups invest in space exploration, the need to launch satellites for communication, navigation, Earth observation, and scientific study grows. This boom in satellite deployments closely correlates with increased demand for solar cell materials, which serve as the major power source for satellites in orbit. Furthermore, advances in satellite technology and propulsion systems make launches more frequent and cost-effective, increasing demand for solar cell materials. Furthermore, the rise of new applications such as satellite-based internet services and remote sensing increases the need for efficient and reliable power production systems, increasing increased demand for solar cell materials.

Restraint: Regulatory and Compliance Standards

The satellite solar cells material market operates within a stringent regulatory and compliance framework to ensure the safety, reliability, and performance of materials used in space applications. Regulatory standards, often set by international organizations and government agencies, encompass various aspects crucial for satellite solar cells.

Space agencies like NASA, ESA (European Space Agency), and others establish guidelines and standards that dictate the materials' quality, durability, and functionality in the harsh space environment. These regulations cover aspects such as radiation tolerance, thermal stability, mechanical resilience, and electrical performance. Materials used in satellite solar cells must comply with these rigorous standards to withstand extreme conditions such as high radiation levels, vacuum, temperature variations, and micrometeoroid impacts.

Moreover, international treaties and agreements govern space activities, emphasizing the need for environmental sustainability and space debris mitigation. Satellites and their components, including solar cells, must adhere to guidelines to minimize the generation of space debris during launch, operation, and end-of-life disposal.

Opportunity:  Increasing Investment in Space based Infrastructure

Increased investment in space-based infrastructure creates a substantial opportunity for the satellite solar cell materials market. NewSpace India Limited (NSIL) has unveiled plans for a substantial USD 1.2 billion investment over the coming five years, aiming to bolster industry participation and foster commercial ventures within the sector. The landscape of India's space sector reflects a remarkable surge in space entrepreneurial enthusiasm

As governments, private enterprises, and international organizations increase their investments in space-related programmes, there is an increasing demand for dependable and efficient power production systems to support these efforts. Satellite solar cell materials, as the principal source of power for satellites in orbit, stand to benefit tremendously from this trend. The infusion of financing into space-based infrastructure projects not only increases demand for solar cell materials, but it also promotes innovation and breakthroughs in solar cell technology. Furthermore, as space-based infrastructure grows to incorporate additional satellites for communication, Earth observation, navigation, and scientific research, the demand for solar cell materials is likely to increase even more. This presents a ripe opportunity for manufacturers and suppliers in the satellite solar cells materials market to capitalize on the growing market demand and establish themselves as key players in the burgeoning space industry.

Challenge: Harsh Space Environment & Limited Supply of Space Grade Solar Cells

Beyond Earth's insulating atmosphere, space presents an incredibly harsh environment. Spacecraft encounter extreme temperature fluctuations, ranging from intense heat to bitter cold, and face a substantially heightened risk of radiation exposure. The prolonged exposure of solar cells to the harsh and unforgiving conditions of space poses a significant challenge in ensuring consistent power generation over a satellite's operational lifespan. Radiation, extreme temperatures, vacuum, and the constant threat of micrometeoroid impacts are among the numerous space-related factors that contribute to the degradation of solar cells. Radiation in space, including solar and cosmic radiation, can cause cumulative damage to solar cell materials. Ionizing radiation can introduce defects in the semiconductor materials, impacting their ability to efficiently convert sunlight into electricity. This degradation over time leads to a decline in the overall performance and power output of the solar cells. On the other hand, the demand for satellite or space-grade solar cells has witnessed a surge in recent years due to the increasing number of satellites launches and space exploration missions. However, this growing demand is met with a significant challenge, as there are limited number of companies that specialize in manufacturing components meeting the stringent requirements for space applications.

Satellite Solar Cells Materials Market Ecosystem

The market ecosystem for satellite solar cell materials is composed of a diverse array of entities and stakeholders that collectively contribute to the development, implementation, and advancement of satellite solar cell materials. At the core of this ecosystem are material providers who focus on research, development, and manufacturing of satellite solar cells materials. They continuously innovate and produce novel materials and their applications to meet the evolving demands of the market.

SPECTROLAB (US), AZUR SPACE Solar Power GmbH (Germany), ROCKET LAB USA (US), Sharp Corporation(Japan), CESI S.p.A (Italy), Thales Alenia Space (France), AIRBUS (France), MicroLink Devices, Inc. (US), Mitsubishi Electric Corporation (Japan), Northrop Grumman (US).


Satellite Solar Cell Materials Market Ecosystem

Source: Secondary Research, Interviews with Experts, and MarketsandMarkets Analysis

GaAs is the fastest sub-segment amongst the materials type segment in the satellite solar cells materials market in 2024, in terms of watt.

Gallium arsenide (GaAs) is emerging as the fastest-growing material in satellite solar cells due to its unique properties that address key challenges in space environments. GaAs solar cells offer superior efficiency compared to traditional silicon-based cells, especially in low-light conditions often experienced in space. This enhanced efficiency ensures optimal power generation even in challenging orbital settings, contributing to the reliability and longevity of satellites.

Moreover, GaAs exhibits exceptional radiation resistance, a crucial factor for satellites exposed to cosmic radiation in space. This resilience enhances the durability of solar cells, reducing the risk of performance degradation over time. Additionally, GaAs solar cells are known for their lightweight and compact design, making them ideal for space applications where minimizing payload weight is critical for launch cost efficiency.

The increasing adoption of GaAs solar cells is also attributed to advancements in manufacturing technologies, allowing for cost-effective production at scale. As space agencies and satellite manufacturers prioritize high-performance, durable, and efficient power solutions, GaAs solar cells have positioned themselves as the material of choice for the next generation of space-based solar technologies. The unique combination of efficiency, radiation resistance, and lightweight design positions GaAs as a driving force behind the rapid growth in satellite solar cell materials.

“Satellite accounted for the fastest growing application share of the satellite solar cells materials market in 2024” in terms of value.

The satellite sector stands out as the fastest-growing application in the satellite solar cell market due to a confluence of technological advancements, increasing satellite launches, and the growing reliance on space-based assets. Satellites are essential components in various domains, including communication, Earth observation, navigation, and scientific research. As the demand for satellite-based services continues to surge globally, there is a proportional need for advanced and efficient power sources to sustain these satellites in orbit.

Solar cells play a pivotal role in powering satellites, converting sunlight into electrical energy to fuel onboard systems. The robust growth in satellite deployments, driven by both government space agencies and private enterprises, amplifies the demand for cutting-edge solar cell technologies. The unique challenges of the space environment, including prolonged exposure to harsh radiation, extreme temperatures, and the necessity for lightweight, reliable power solutions, make advanced solar cells indispensable for satellite missions. As space exploration expands, satellite constellations multiply, and the commercial space industry evolves, the demand for satellite solar cells is projected to maintain its rapid growth trajectory, solidifying satellites as the key driver in the satellite solar cell market's burgeoning success.

“LEO accounted for the second largest share by orbit of the satellite solar cells materials market in 2024” in terms of value.

Low Earth Orbit (LEO) has emerged as the second-largest orbit type in the satellite solar cell market, owing to several key factors that make it an attractive choice for satellite deployments. LEO is characterized by altitudes ranging from approximately 180 to 2,000 kilometers above Earth's surface. This orbit type has gained prominence due to its strategic advantages in terms of accessibility, shorter communication latency, and increased satellite revisit times.

LEO satellites operate at lower altitudes compared to higher orbits like Geostationary Orbit (GEO), which is advantageous for reducing signal latency in communication systems. This low latency is crucial for applications such as broadband internet services, Earth observation, and real-time data transmission, making LEO an ideal choice for constellations of communication satellites.

Furthermore, the proximity of LEO satellites to Earth allows for improved resolution and more frequent revisits in Earth observation missions. Satellites in LEO can capture detailed imagery, monitor environmental changes, and contribute to scientific research with shorter revisit times compared to satellites in higher orbits.

"North America is the largest market for satellite solar cells materials Market in 2024, in terms of watt."

North America holds the distinction of being the largest market for satellite solar cell materials, driven by a multitude of factors that underscore the region's leadership in space technology and satellite deployments. One key reason for North America's dominance in this market is its robust space industry ecosystem, comprising renowned aerospace companies, research institutions, and government agencies like NASA. These entities spearhead numerous satellite projects, ranging from Earth observation and communication to scientific exploration, necessitating the procurement of high-quality solar cell materials.

Additionally, North America boasts a thriving commercial space sector characterized by innovative startups and established players, fueling demand for satellite solar cell materials. The region's conducive regulatory environment and access to capital further facilitate the growth of space ventures, fostering a conducive market for solar cell manufacturers.

Moreover, the strategic focus on national security and defense initiatives drives substantial investments in satellite technology, including advancements in solar power generation. Military applications such as reconnaissance, surveillance, and navigation rely on satellites equipped with efficient solar cells to ensure operational capabilities in space. Furthermore, North America's leadership in satellite mega-constellations, particularly for global broadband internet coverage, significantly contributes to the demand for solar cell materials. Companies like SpaceX are deploying thousands of satellites into orbit, each requiring reliable and high-performance solar cells to sustain uninterrupted power supply throughout their operational lifespan.

Satellite Solar Cell Materials Market by Region

To know about the assumptions considered for the study, download the pdf brochure

Satellite Solar Cell Materials Market Players

The key players in this market are   SPECTROLAB (US), AZUR SPACE Solar Power GmbH (Germany), ROCKET LAB USA (US), Sharp Corporation(Japan), CESI S.p.A (Italy), Thales Alenia Space (France), AIRBUS (France), MicroLink Devices, Inc. (US). Continuous developments in the market—including new product launches, mergers & acquisitions, agreements, and expansions—are expected to help the market grow. Leading manufacturers of satellite solar cells materials have opted for new product launches to sustain their market position.

Satellite Solar Cell Materials Market Report Scope

Report Metric

Details

Years considered for the study

2020-2030

Base Year

2023

Forecast period

2024–2030

Units considered

Value (USD Billion/Million), Volume (WH)

Segments

Material Types, Application, Orbit and Region

Regions

Asia Pacific, North America, Europe, Rest of the World.

Companies

SPECTROLAB (US), AZUR SPACE Solar Power GmbH (Germany), ROCKET LAB USA (US), Sharp Corporation (Japan), CESI S.p.A (Italy), Thales Alenia Space (France), AIRBUS (France), Mitsubishi Electric Corporation (Japan), Northrop Grumman (US), MicroLink Devices, Inc. (US)

Segmentation

This report categorizes the global Satellite solar cells materials market based on material types, application, orbit and region.

On the basis of material types, the market has been segmented as follows:
  • Silicon
  • Copper Indium Gallium Selenide (CIGS)
  • Gallium Arsenide (GaAs)
  • Other Material Types
On the basis of application, the market has been segmented as follows:
  • Satellite
  • Rovers
  • Space Stations
  • Others
On the basis of orbit, the market has been segmented as follows:
  • Low Earth Orbit (LEO)
  • Medium Earth Orbit (MEO)
  • Geostationary Orbit (GEO)
  • Highly Elliptical Orbit (HEO)
  • Polar Orbit
On the basis of region, the market has been segmented as follows:
  • North America
  • Europe
  • Asia Pacific
  • Rest of World

Recent Developments

  • CESI S.p.A made an agreement with Italian Space Agency (August 2023): Italian multinational CESI and the Italian Space Agency have entered into a significant agreement valued at over USD 14.06 Million to support the Space Factory project. With the agreement, CESI is poised to expand its production capacity for solar cells designed for space satellites.
  • Thales Alenia Space (February 2023) launches a product: Thales Alenia Space recently concluded the assembly and testing phase for an engineering model of the solar array designed for their Space INSPIRE product line.
  • ROCKET LAB USA (March 2022) launches a product: Aerospace manufacturer and small satellite launch company, Rocket Lab introduced a novel space-grade solar cell derived from the cell technology pioneered by Solero, a space solar cell manufacturer acquired by Rocket Lab.
  • Airbus invests in Solestial (October 2022): Solestial, a Tempe, Arizona-based company specializing in solar energy solutions for space applications, successfully concluded a funding round, securing USD 10 million in investments with Airbus Ventures taking the lead.
  • ROCKET LAB USA Acquires SolAero Holdings, Inc.  (January 2022): Rocket Lab USA, Inc. successfully finalized the previously disclosed acquisition of SolAero Holdings, Inc. (SolAero).
  • AZUR SPACE Power GmbH acquired by 5N Plus (November 2021): 5N Plus, a prominent global manufacturer of specialty semiconductors and performance materials, successfully completed the acquisition of AZUR SPACE Solar Power GmbH.

Frequently Asked Questions (FAQ):

To speak to our analyst for a discussion on the above findings, click Speak to Analyst

TABLE OF CONTENTS
 
1 INTRODUCTION (Page No. - 28)
    1.1 STUDY OBJECTIVES 
    1.2 MARKET DEFINITION 
    1.3 INCLUSIONS & EXCLUSIONS 
    1.4 MARKET SCOPE 
          FIGURE 1 SATELLITE SOLAR CELL MATERIALS MARKET SEGMENTATION
           1.4.1 REGIONS COVERED
           1.4.2 YEARS CONSIDERED
    1.5 CURRENCY CONSIDERED 
    1.6 UNITS CONSIDERED 
    1.7 LIMITATIONS 
    1.8 STAKEHOLDERS 
 
2 RESEARCH METHODOLOGY (Page No. - 32)
    2.1 RESEARCH DATA 
          FIGURE 2 SATELLITE SOLAR CELL MATERIALS MARKET: RESEARCH DESIGN
           2.1.1 SECONDARY DATA
                    2.1.1.1 Key data from secondary sources
           2.1.2 PRIMARY DATA
                    2.1.2.1 Primary data sources
                    2.1.2.2 Key satellite solar cell material manufacturers
                    2.1.2.3 Breakdown of interviews with experts
                    2.1.2.4 Key industry insights
    2.2 BASE NUMBER CALCULATION 
           2.2.1 APPROACH 1: SUPPLY-SIDE ANALYSIS
           2.2.2 APPROACH 2: DEMAND-SIDE ANALYSIS
    2.3 FORECAST NUMBER CALCULATION 
           2.3.1 SUPPLY SIDE
           2.3.2 DEMAND SIDE
    2.4 MARKET SIZE ESTIMATION 
          FIGURE 3 MARKET SIZE ESTIMATION METHODOLOGY: REVENUE OF MARKET PLAYERS
           2.4.1 BOTTOM-UP APPROACH
           2.4.2 TOP-DOWN APPROACH
    2.5 DATA TRIANGULATION 
          FIGURE 4 SATELLITE SOLAR CELL MATERIALS MARKET: DATA TRIANGULATION
    2.6 ASSUMPTIONS 
    2.7 RECESSION IMPACT 
    2.8 GROWTH FORECAST 
    2.9 RISK ASSESSMENT 
 
3 EXECUTIVE SUMMARY (Page No. - 42)
    FIGURE 5 SILICON SEGMENT TO DOMINATE MARKET BETWEEN 2024 AND 2030
    FIGURE 6 SATELLITE APPLICATION TO LEAD MARKET BETWEEN 2024 AND 2030
    FIGURE 7 POLAR ORBIT SEGMENT TO LEAD MARKET BETWEEN 2024 AND 2030
    FIGURE 8 NORTH AMERICA TO DOMINATE MARKET DURING FORECAST PERIOD
 
4 PREMIUM INSIGHTS (Page No. - 47)
    4.1 ATTRACTIVE OPPORTUNITIES FOR PLAYERS IN SATELLITE SOLAR CELL MATERIALS MARKET 
          FIGURE 9 RISING SPACE EXPLORATION AND SATELLITE DEPLOYMENTS TO DRIVE MARKET
    4.2 SATELLITE SOLAR CELL MATERIALS MARKET, BY MATERIAL TYPE 
          FIGURE 10 GALLIUM ARSENIDE TO BE FASTEST-GROWING SEGMENT DURING FORECAST PERIOD
    4.3 SATELLITE SOLAR CELL MATERIALS MARKET, BY APPLICATION 
          FIGURE 11 SATELLITE TO BE FASTEST-GROWING SEGMENT DURING FORECAST PERIOD
    4.4 SATELLITE SOLAR CELL MATERIALS MARKET, BY ORBIT 
          FIGURE 12 LEO TO BE FASTEST-GROWING SEGMENT DURING FORECAST PERIOD
    4.5 SATELLITE SOLAR CELL MATERIALS MARKET, BY COUNTRY 
          FIGURE 13 FRANCE TO BE FASTEST-GROWING MARKET DURING FORECAST PERIOD
 
5 MARKET OVERVIEW (Page No. - 50)
    5.1 INTRODUCTION 
    5.2 MARKET DYNAMICS 
          FIGURE 14 SATELLITE SOLAR CELL MATERIALS MARKET: DRIVERS, RESTRAINTS, OPPORTUNITIES, AND CHALLENGES
           5.2.1 DRIVERS
                    5.2.1.1 Rising space exploration and satellite deployment
                    5.2.1.2 Technological advancements in solar cell efficiency
                    5.2.1.3 Support and investments by governments
           5.2.2 RESTRAINTS
                    5.2.2.1 Restrictions on weight and size of solar cells
                    5.2.2.2 Stringent regulatory and compliance standards
           5.2.3 OPPORTUNITIES
                    5.2.3.1 Increasing investment in space-based infrastructure
                    5.2.3.2 Growing demand for sustainable energy sources
           5.2.4 CHALLENGES
                    5.2.4.1 Harsh space environment and limited supply of space-grade solar cells
                    5.2.4.2 High cost of satellite solar cell materials
 
6 INDUSTRY TRENDS (Page No. - 57)
    6.1 INTRODUCTION 
    6.2 TRENDS/DISRUPTIONS IMPACTING CUSTOMERS' BUSINESSES 
           6.2.1 REVENUE SHIFT AND NEW REVENUE POCKETS FOR SATELLITE SOLAR CELL MATERIAL MANUFACTURERS
                    FIGURE 15 REVENUE SHIFT IN SATELLITE SOLAR CELL MATERIALS MARKET
    6.3 PRICING ANALYSIS 
           6.3.1 AVERAGE SELLING PRICE TREND, BY REGION
                    TABLE 1 AVERAGE SELLING PRICE, BY REGION, 2020–2030 (PRICE PER WATT)
                    FIGURE 16 SATELLITE SOLAR CELL MATERIALS MARKET: AVERAGE SELLING PRICE TREND, BY REGION
           6.3.2 AVERAGE SELLING PRICE TREND, BY MATERIAL TYPE
                    TABLE 2 AVERAGE SELLING PRICE TREND, BY MATERIAL TYPE, 2020–2030 (PRICE PER WATT)
           6.3.3 AVERAGE SELLING PRICE TREND OF KEY PLAYERS, BY TOP THREE MATERIAL TYPES
                    TABLE 3 AVERAGE SELLING PRICE, BY MATERIAL TYPE, 2023 (PRICE PER WATT)
                    FIGURE 17 AVERAGE SELLING PRICE TREND OF KEY PLAYERS, BY TOP THREE MATERIAL TYPES
    6.4 SUPPLY CHAIN ANALYSIS 
          FIGURE 18 SATELLITE SOLAR CELL MATERIALS MARKET: SUPPLY CHAIN ANALYSIS
           6.4.1 RAW MATERIAL SUPPLIERS
           6.4.2 MANUFACTURERS
           6.4.3 DISTRIBUTORS
           6.4.4 END USERS
    6.5 ECOSYSTEM MAPPING 
          TABLE 4 SATELLITE SOLAR CELL MATERIALS MARKET: ROLE IN ECOSYSTEM
    6.6 INVESTMENT LANDSCAPE: SATELLITE SOLAR CELL MATERIALS MARKET 
          FIGURE 19 SIGNIFICANT INVESTOR DEALS AND FUNDING WITNESSED IN 2021
    6.7 TECHNOLOGY ANALYSIS 
          TABLE 5 KEY TECHNOLOGIES IN SATELLITE SOLAR CELL MATERIALS MARKET
          TABLE 6 COMPLEMENTARY TECHNOLOGIES IN SATELLITE SOLAR CELL MATERIALS MARKET
          TABLE 7 ADJACENT TECHNOLOGIES IN SATELLITE SOLAR CELL MATERIALS MARKET
    6.8 PATENT ANALYSIS 
           6.8.1 INTRODUCTION
           6.8.2 METHODOLOGY
           6.8.3 DOCUMENT TYPE
                    TABLE 8 GRANTED PATENTS ACCOUNT FOR 35.1% OF ALL PATENTS
                    FIGURE 20 PATENT PUBLICATION TRENDS, 2014−2023
           6.8.4 INSIGHTS
           6.8.5 LEGAL STATUS OF PATENTS
           6.8.6 JURISDICTION ANALYSIS
                    FIGURE 21 US JURISDICTION REGISTERED HIGHEST NUMBER OF PATENTS
           6.8.7 TOP COMPANIES/APPLICANTS
                    FIGURE 22 SAMSUNG REGISTERED HIGHEST NUMBER OF PATENTS
                    TABLE 9 LIST OF MAJOR PATENTS FOR SATELLITE SOLAR CELL MATERIALS MARKET
           6.8.8 LIST OF MAJOR PATENTS
                    TABLE 10 MAJOR PATENTS IN SATELLITE SOLAR CELL MATERIALS MARKET
    6.9 TRADE ANALYSIS 
           6.9.1 IMPORT SCENARIO
                    FIGURE 23 IMPORT OF SATELLITE SOLAR CELL MATERIALS, BY COUNTRY (2019−2022)
           6.9.2 EXPORT SCENARIO
                    FIGURE 24 EXPORT OF SATELLITE SOLAR CELL MATERIALS, BY COUNTRY (2019−2022)
    6.10 KEY CONFERENCES & EVENTS IN 2024−25 
           TABLE 11 SATELLITE SOLAR CELL MATERIALS MARKET: DETAILED LIST OF CONFERENCES AND EVENTS
           6.10.1 REGULATORY BODIES, GOVERNMENT AGENCIES, AND OTHER ORGANIZATIONS
                     TABLE 12 NORTH AMERICA: LIST OF REGULATORY BODIES, GOVERNMENT AGENCIES, AND OTHER ORGANIZATIONS
                     TABLE 13 EUROPE: LIST OF REGULATORY BODIES, GOVERNMENT AGENCIES, AND OTHER ORGANIZATIONS
                     TABLE 14 ASIA PACIFIC: LIST OF REGULATORY BODIES, GOVERNMENT AGENCIES, AND OTHER ORGANIZATIONS
                     TABLE 15 REST OF THE WORLD: LIST OF REGULATORY BODIES, GOVERNMENT AGENCIES, AND OTHER ORGANIZATIONS
    6.11 PORTER'S FIVE FORCES ANALYSIS 
           TABLE 16 SATELLITE SOLAR CELL MATERIALS MARKET: PORTER'S FIVE FORCES ANALYSIS
           FIGURE 25 SATELLITE SOLAR CELL MATERIALS MARKET: PORTER'S FIVE FORCES ANALYSIS
           6.11.1 THREAT OF NEW ENTRANTS
           6.11.2 THREATS OF SUBSTITUTES
           6.11.3 BARGAINING POWER OF SUPPLIERS
           6.11.4 BARGAINING POWER OF BUYERS
           6.11.5 MACROECONOMIC INDICATORS
                     TABLE 17 PROJECTED REAL GDP GROWTH (ANNUAL PERCENTAGE CHANGE) OF KEY COUNTRIES, 2018–2025
    6.12 KEY STAKEHOLDERS AND BUYING CRITERIA 
           6.12.1 KEY STAKEHOLDERS IN BUYING PROCESS
                     FIGURE 26 INFLUENCE OF STAKEHOLDERS IN BUYING PROCESS FOR TOP 3 APPLICATIONS
                     TABLE 18 INFLUENCE OF STAKEHOLDERS ON BUYING PROCESS FOR TOP 3 APPLICATIONS
           6.12.2 BUYING CRITERIA
                     FIGURE 27 KEY BUYING CRITERIA FOR TOP 3 APPLICATIONS
                     TABLE 19 KEY BUYING CRITERIA FOR TOP 3 APPLICATIONS
    6.13 CASE STUDY 
           6.13.1 CASE STUDY ABOUT RADIATION-INDUCED DEGRADATION OF III–V PHOTOVOLTAIC CELLS FOR SPACE APPLICATIONS
           6.13.2 CASE STUDY ABOUT PHOTOVOLTAICS-DRIVEN POWER PRODUCTION CAN SUPPORT HUMAN EXPLORATION ON MARS
           6.13.3 CASE STUDY ABOUT SPACE-BASED SOLAR POWER
 
7 SATELLITE SOLAR CELL MATERIALS MARKET, BY MATERIAL TYPE (Page No. - 85)
    7.1 INTRODUCTION 
          FIGURE 28 SILICON TO DOMINATE MARKET DURING FORECAST PERIOD
          TABLE 20 SATELLITE SOLAR CELL MATERIALS MARKET, BY MATERIAL TYPE, 2020–2023 (USD MILLION)
          TABLE 21 SATELLITE SOLAR CELL MATERIALS MARKET, BY MATERIAL TYPE, 2024–2030 (USD MILLION)
          TABLE 22 SATELLITE SOLAR CELL MATERIALS MARKET, BY MATERIAL TYPE, 2020–2023 (MW)
          TABLE 23 SATELLITE SOLAR CELL MATERIALS MARKET, BY MATERIAL TYPE, 2024–2030 (MW)
    7.2 SILICON 
           7.2.1 SILICON SEGMENT TO DOMINATE MARKET DURING FORECAST PERIOD
    7.3 COPPER INDIUM GALLIUM SELENIDE (CIGS) 
           7.3.1 OFFERS HIGH EFFICIENCY LEVELS, EXCEPTIONAL PERFORMANCE IN LOW-LIGHT CONDITIONS
    7.4 GALLIUM ARSENIDE (GAAS) 
           7.4.1 GAAS TO REGISTER HIGHEST GROWTH DURING FORECAST PERIOD
    7.5 OTHER MATERIAL TYPES 
           7.5.1 INDIUM GALLIUM PHOSPHIDE (INGAP)
           7.5.2 GERMANIUM (GE)
 
8 SATELLITE SOLAR CELL MATERIALS MARKET, BY ORBIT (Page No. - 91)
    8.1 INTRODUCTION 
          FIGURE 29 POLAR ORBIT TO ACCOUNT FOR LARGEST MARKET SHARE DURING FORECAST PERIOD
          TABLE 24 SATELLITE SOLAR CELL MATERIALS MARKET, BY ORBIT, 2020–2023 (USD MILLION)
          TABLE 25 SATELLITE SOLAR CELL MATERIALS MARKET, BY ORBIT, 2024–2030 (USD MILLION)
          TABLE 26 SATELLITE SOLAR CELL MATERIALS MARKET, BY ORBIT, 2020–2023 (MW)
          TABLE 27 SATELLITE SOLAR CELL MATERIALS MARKET, BY ORBIT, 2024–2030 (MW)
    8.2 LOW EARTH ORBIT (LEO) 
           8.2.1 LEO SEGMENT TO REGISTER HIGHEST CAGR DURING FORECAST PERIOD
    8.3 MEDIUM EARTH ORBIT (MEO) 
           8.3.1 MARKET CHARACTERIZED BY DEMAND FOR MATERIALS RESILIENT TO HARSH RADIATION ENVIRONMENT
    8.4 GEOSTATIONARY ORBIT (GEO) 
           8.4.1 ROBUST MATERIALS REQUIRED FOR SOLAR ARRAYS FOR SATELLITES IN GEO
    8.5 HIGHLY ELLIPTICAL ORBIT (HEO) 
           8.5.1 ADVANCED MATERIALS AND TECHNOLOGIES REQUIRED FOR HEO SATELLITES
    8.6 POLAR ORBIT 
           8.6.1 POLAR ORBIT SEGMENT TO ACCOUNT FOR LARGEST MARKET SHARE DURING FORECAST PERIOD
 
9 SATELLITE SOLAR CELL MATERIALS MARKET, BY APPLICATION (Page No. - 97)
    9.1 INTRODUCTION 
          FIGURE 30 SATELLITES SEGMENT TO DOMINATE MARKET DURING FORECAST PERIOD
          TABLE 28 SATELLITE SOLAR CELL MATERIALS MARKET, BY APPLICATION, 2020–2023 (USD MILLION)
          TABLE 29 SATELLITE SOLAR CELL MATERIALS MARKET, BY APPLICATION, 2024–2030 (USD MILLION)
          TABLE 30 SATELLITE SOLAR CELL MATERIALS MARKET, BY APPLICATION, 2020–2023 (MW)
          TABLE 31 SATELLITE SOLAR CELL MATERIALS MARKET, BY APPLICATION, 2024–2030 (MW)
    9.2 SATELLITES 
           9.2.1 SATELLITES SEGMENT TO ACCOUNT FOR LARGEST MARKET SHARE DURING FORECAST PERIOD
    9.3 ROVERS 
           9.3.1 DEMAND FOR SATELLITE SOLAR CELL MATERIALS TO WITNESS SIGNIFICANT GROWTH IN ROVER APPLICATION
    9.4 SPACE STATIONS 
           9.4.1 SATELLITE SOLAR ARRAYS CRITICAL IN OPERATION OF SPACE STATIONS
    9.5 OTHER APPLICATIONS 
 
10 SATELLITE SOLAR CELL MATERIALS MARKET, BY REGION (Page No. - 103)
     10.1 INTRODUCTION 
            FIGURE 31 ASIA PACIFIC TO BE FASTEST-GROWING MARKET DURING FORECAST PERIOD
            TABLE 32 SATELLITE SOLAR CELL MATERIALS MARKET, BY REGION, 2020–2023 (USD MILLION)
            TABLE 33 SATELLITE SOLAR CELL MATERIALS MARKET, BY REGION, 2024–2030 (USD MILLION)
            TABLE 34 SATELLITE SOLAR CELL MATERIALS MARKET, BY REGION, 2020–2023 (MW)
            TABLE 35 SATELLITE SOLAR CELL MATERIALS MARKET, BY REGION, 2024–2030 (MW)
     10.2 ASIA PACIFIC 
            FIGURE 32 ASIA PACIFIC: SATELLITE SOLAR CELL MATERIALS MARKET SNAPSHOT
             10.2.1 RECESSION IMPACT
                        TABLE 36 ASIA PACIFIC: SATELLITE SOLAR CELL MATERIALS MARKET, BY COUNTRY, 2020–2023 (USD MILLION)
                        TABLE 37 ASIA PACIFIC: SATELLITE SOLAR CELL MATERIALS MARKET, BY COUNTRY, 2024–2030 (USD MILLION)
                        TABLE 38 ASIA PACIFIC: SATELLITE SOLAR CELL MATERIALS MARKET, BY COUNTRY, 2020–2023 (MW)
                        TABLE 39 ASIA PACIFIC: SATELLITE SOLAR CELL MATERIALS MARKET, BY COUNTRY, 2024–2030 (MW)
                        TABLE 40 ASIA PACIFIC: SATELLITE SOLAR CELL MATERIALS MARKET, BY MATERIAL TYPE, 2020–2023 (USD MILLION)
                        TABLE 41 ASIA PACIFIC: SATELLITE SOLAR CELL MATERIALS MARKET, BY MATERIAL TYPE, 2024–2030 (USD MILLION)
                        TABLE 42 ASIA PACIFIC: SATELLITE SOLAR CELL MATERIALS MARKET, BY MATERIAL TYPE, 2020–2023 (MW)
                        TABLE 43 ASIA PACIFIC: SATELLITE SOLAR CELL MATERIALS MARKET, BY MATERIAL TYPE, 2024–2030 (MW)
                        TABLE 44 ASIA PACIFIC: SATELLITE SOLAR CELL MATERIALS MARKET, BY ORBIT, 2020–2023 (USD MILLION)
                        TABLE 45 ASIA PACIFIC: SATELLITE SOLAR CELL MATERIALS MARKET, BY ORBIT, 2024–2030 (USD MILLION)
                        TABLE 46 ASIA PACIFIC: SATELLITE SOLAR CELL MATERIALS MARKET, BY APPLICATION, 2020–2023 (USD MILLION)
                        TABLE 47 ASIA PACIFIC: SATELLITE SOLAR CELL MATERIALS MARKET, BY APPLICATION, 2024–2030 (USD MILLION)
             10.2.2 CHINA
                        10.2.2.1 Upcoming investments in space exploration to drive growth of market
                                      TABLE 48 CHINA: SATELLITE SOLAR CELL MATERIALS MARKET, BY APPLICATION, 2020–2023 (USD MILLION)
                                      TABLE 49 CHINA: SATELLITE SOLAR CELL MATERIALS MARKET, BY APPLICATION, 2024–2030 (USD MILLION)
             10.2.3 JAPAN
                        10.2.3.1 Increasing satellite launches to fuel demand for PV cells
                                      TABLE 50 JAPAN: SATELLITE SOLAR CELL MATERIALS MARKET, BY APPLICATION, 2020–2023 (USD MILLION)
                                      TABLE 51 JAPAN: SATELLITE SOLAR CELL MATERIALS MARKET, BY APPLICATION, 2024–2030 (USD MILLION)
             10.2.4 INDIA
                        10.2.4.1 Investments in space exploration, including launch of rovers and satellites, to drive market
                                      TABLE 52 INDIA: SATELLITE SOLAR CELL MATERIALS MARKET, BY APPLICATION, 2020–2023 (USD MILLION)
                                      TABLE 53 INDIA: SATELLITE SOLAR CELL MATERIALS MARKET, BY APPLICATION, 2024–2030 (USD MILLION)
             10.2.5 SOUTH KOREA
                        10.2.5.1 Increasing demand from defense sectors to drive satellite solar cell materials market
                                      TABLE 54 SOUTH KOREA: SATELLITE SOLAR CELL MATERIALS MARKET, BY APPLICATION, 2020–2023 (USD MILLION)
                                      TABLE 55 SOUTH KOREA: SATELLITE SOLAR CELL MATERIALS MARKET, BY APPLICATION, 2024–2030 (USD MILLION)
             10.2.6 REST OF ASIA PACIFIC
                        TABLE 56 REST OF ASIA PACIFIC: SATELLITE SOLAR CELL MATERIALS MARKET, BY APPLICATION, 2020–2023 (USD MILLION)
                        TABLE 57 REST OF ASIA PACIFIC: SATELLITE SOLAR CELL MATERIALS MARKET, BY APPLICATION, 2024–2030 (USD MILLION)
     10.3 EUROPE 
             FIGURE 33 EUROPE: SATELLITE SOLAR CELL MATERIALS MARKET SNAPSHOT
             10.3.1 RECESSION IMPACT
                        TABLE 58 EUROPE: SATELLITE SOLAR CELL MATERIALS MARKET, BY COUNTRY, 2020–2023 (USD MILLION)
                        TABLE 59 EUROPE: SATELLITE SOLAR CELL MATERIALS MARKET, BY COUNTRY, 2024–2030 (USD MILLION)
                        TABLE 60 EUROPE: SATELLITE SOLAR CELL MATERIALS MARKET, BY COUNTRY, 2020–2023 (MW)
                        TABLE 61 EUROPE: SATELLITE SOLAR CELL MATERIALS MARKET, BY COUNTRY, 2024–2030 (MW)
                        TABLE 62 EUROPE: SATELLITE SOLAR CELL MATERIALS MARKET, BY MATERIAL TYPE, 2020–2023 (USD MILLION)
                        TABLE 63 EUROPE: SATELLITE SOLAR CELL MATERIALS MARKET, BY MATERIAL TYPE, 2024–2030 (USD MILLION)
                        TABLE 64 EUROPE: SATELLITE SOLAR CELL MATERIALS MARKET, BY MATERIAL TYPE, 2020–2023 (MW)
                        TABLE 65 EUROPE: SATELLITE SOLAR CELL MATERIALS MARKET, BY MATERIAL TYPE, 2024–2030 (MW)
                        TABLE 66 EUROPE: SATELLITE SOLAR CELL MATERIALS MARKET, BY ORBIT, 2020–2023 (USD MILLION)
                        TABLE 67 EUROPE: SATELLITE SOLAR CELL MATERIALS MARKET, BY ORBIT, 2024–2030 (USD MILLION)
                        TABLE 68 EUROPE: SATELLITE SOLAR CELL MATERIALS MARKET, BY APPLICATION, 2020–2023 (USD MILLION)
                        TABLE 69 EUROPE: SATELLITE SOLAR CELL MATERIALS MARKET, BY APPLICATION, 2024–2030 (USD MILLION)
             10.3.2 GERMANY
                        10.3.2.1 Government investments in space sector, including establishment of spaceports, to drive market
                                      TABLE 70 GERMANY: SATELLITE SOLAR CELL MATERIALS MARKET, BY APPLICATION, 2020–2023 (USD MILLION)
                                      TABLE 71 GERMANY: SATELLITE SOLAR CELL MATERIALS MARKET, BY APPLICATION, 2024–2030 (USD MILLION)
             10.3.3 UK
                        10.3.3.1 Increasing support from government for space-based activities to drive market
                                      TABLE 72 UK: SATELLITE SOLAR CELL MATERIALS MARKET, BY APPLICATION, 2020–2023 (USD MILLION)
                                      TABLE 73 UK: SATELLITE SOLAR CELL MATERIALS MARKET, BY APPLICATION, 2024–2030 (USD MILLION)
             10.3.4 FRANCE
                        10.3.4.1 Rising investments in earth mapping and enhanced communication to propel market
                                      TABLE 74 FRANCE: SATELLITE SOLAR CELL MATERIALS MARKET, BY APPLICATION, 2020–2023 (USD MILLION)
                                      TABLE 75 FRANCE: SATELLITE SOLAR CELL MATERIALS MARKET, BY APPLICATION, 2024–2030 (USD MILLION)
             10.3.5 ITALY
                        10.3.5.1 Projected satellite launches to drive market
                                      TABLE 76 ITALY: SATELLITE SOLAR CELL MATERIALS MARKET, BY APPLICATION, 2020–2023 (USD MILLION)
                                      TABLE 77 ITALY: SATELLITE SOLAR CELL MATERIALS MARKET, BY APPLICATION, 2024–2030 (USD MILLION)
             10.3.6 SPAIN
                        10.3.6.1 Surge in satellite launches dedicated to research, defense, and communication to drive market
                                      TABLE 78 SPAIN: SATELLITE SOLAR CELL MATERIALS MARKET, BY APPLICATION, 2020–2023 (USD MILLION)
                                      TABLE 79 SPAIN: SATELLITE SOLAR CELL MATERIALS MARKET, BY APPLICATION, 2024–2030 (USD MILLION)
             10.3.7 RUSSIA
                        10.3.7.1 Surge in launches of satellites for military to boost demand for satellite solar cell materials
                                      TABLE 80 RUSSIA: SATELLITE SOLAR CELL MATERIALS MARKET, BY APPLICATION, 2020–2023 (USD MILLION)
                                      TABLE 81 RUSSIA: SATELLITE SOLAR CELL MATERIALS MARKET, BY APPLICATION, 2024–2030 (USD MILLION)
             10.3.8 REST OF EUROPE
                        TABLE 82 REST OF EUROPE: SATELLITE SOLAR CELL MATERIALS MARKET, BY APPLICATION, 2020–2023 (USD MILLION)
                        TABLE 83 REST OF EUROPE: SATELLITE SOLAR CELL MATERIALS MARKET, BY APPLICATION, 2024–2030 (USD MILLION)
     10.4 NORTH AMERICA 
             FIGURE 34 NORTH AMERICA: SATELLITE SOLAR CELL MATERIALS MARKET SNAPSHOT
             10.4.1 RECESSION IMPACT
                        TABLE 84 NORTH AMERICA: SATELLITE SOLAR CELL MATERIALS MARKET, BY COUNTRY, 2020–2023 (USD MILLION)
                        TABLE 85 NORTH AMERICA: SATELLITE SOLAR CELL MATERIALS MARKET, BY COUNTRY, 2024–2030 (USD MILLION)
                        TABLE 86 NORTH AMERICA: SATELLITE SOLAR CELL MATERIALS MARKET, BY COUNTRY, 2020–2023 (MW)
                        TABLE 87 NORTH AMERICA: SATELLITE SOLAR CELL MATERIALS MARKET, BY COUNTRY, 2024–2030 (MW)
                        TABLE 88 NORTH AMERICA: SATELLITE SOLAR CELL MATERIALS MARKET, BY MATERIAL TYPE, 2020–2023 (USD MILLION)
                        TABLE 89 NORTH AMERICA: SATELLITE SOLAR CELL MATERIALS MARKET, BY MATERIAL TYPE, 2024–2030 (USD MILLION)
                        TABLE 90 NORTH AMERICA: SATELLITE SOLAR CELL MATERIALS MARKET, BY MATERIAL TYPE, 2020–2023 (MW)
                        TABLE 91 NORTH AMERICA: SATELLITE SOLAR CELL MATERIALS MARKET, BY MATERIAL TYPE, 2024–2030 (MW)
                        TABLE 92 NORTH AMERICA: SATELLITE SOLAR CELL MATERIALS MARKET, BY ORBIT, 2020–2023 (USD MILLION)
                        TABLE 93 NORTH AMERICA: SATELLITE SOLAR CELL MATERIALS MARKET, BY ORBIT, 2024–2030 (USD MILLION)
                        TABLE 94 NORTH AMERICA: SATELLITE SOLAR CELL MATERIALS MARKET, BY APPLICATION, 2020–2023 (USD MILLION)
                        TABLE 95 NORTH AMERICA: SATELLITE SOLAR CELL MATERIALS MARKET, BY APPLICATION, 2024–2030 (USD MILLION)
             10.4.2 US
                        10.4.2.1 Thriving space ecosystem to propel demand for space-grade solar cell materials
                                      TABLE 96 US: SATELLITE SOLAR CELL MATERIALS MARKET, BY APPLICATION, 2020–2023 (USD MILLION)
                                      TABLE 97 US: SATELLITE SOLAR CELL MATERIALS MARKET, BY APPLICATION, 2024–2030 (USD MILLION)
             10.4.3 CANADA
                        10.4.3.1 Government investments in space industry to influence satellite solar cell materials market
                                      TABLE 98 CANADA: SATELLITE SOLAR CELL MATERIALS MARKET, BY APPLICATION, 2020–2023 (USD MILLION)
                                      TABLE 99 CANADA: SATELLITE SOLAR CELL MATERIALS MARKET, BY APPLICATION, 2024–2030 (USD MILLION)
             10.4.4 MEXICO
                        10.4.4.1 Government initiatives to invest in satellite technologies to drive market in Mexico
                                      TABLE 100 MEXICO: SATELLITE SOLAR CELL MATERIALS MARKET, BY APPLICATION, 2020–2023 (USD MILLION)
                                      TABLE 101 MEXICO: SATELLITE SOLAR CELL MATERIALS MARKET, BY APPLICATION, 2024–2030 (USD MILLION)
     10.5 REST OF WORLD 
             10.5.1 RECESSION IMPACT
                        TABLE 102 ROW: SATELLITE SOLAR CELL MATERIALS MARKET, BY COUNTRY, 2020–2023 (USD MILLION)
                        TABLE 103 ROW: SATELLITE SOLAR CELL MATERIALS MARKET, BY COUNTRY, 2024–2030 (USD MILLION)
                        TABLE 104 ROW: SATELLITE SOLAR CELL MATERIALS MARKET, BY COUNTRY, 2020–2023 (MW)
                        TABLE 105 ROW: SATELLITE SOLAR CELL MATERIALS MARKET, BY COUNTRY, 2024–2030 (MW)
                        TABLE 106 ROW: SATELLITE SOLAR CELL MATERIALS MARKET, BY MATERIAL TYPE, 2020–2023 (USD MILLION)
                        TABLE 107 ROW: SATELLITE SOLAR CELL MATERIALS MARKET, BY MATERIAL TYPE, 2024–2030 (USD MILLION)
                        TABLE 108 ROW: SATELLITE SOLAR CELL MATERIALS MARKET, BY MATERIAL TYPE, 2020–2023 (MW)
                        TABLE 109 ROW: SATELLITE SOLAR CELL MATERIALS MARKET, BY MATERIAL TYPE, 2024–2030 (MW)
                        TABLE 110 ROW: SATELLITE SOLAR CELL MATERIALS MARKET, BY ORBIT, 2020–2023 (USD MILLION)
                        TABLE 111 ROW: SATELLITE SOLAR CELL MATERIALS MARKET, BY ORBIT, 2024–2030 (USD MILLION)
                        TABLE 112 ROW: SATELLITE SOLAR CELL MATERIALS MARKET, BY APPLICATION, 2020–2023 (USD MILLION)
                        TABLE 113 ROW: SATELLITE SOLAR CELL MATERIALS MARKET, BY APPLICATION, 2024–2030 (USD MILLION)
             10.5.2 BRAZIL
                        10.5.2.1 Increased demand for satellites for earth observation and military applications to drive demand
                                      TABLE 114 BRAZIL: SATELLITE SOLAR CELL MATERIALS MARKET, BY APPLICATION, 2020–2023 (USD MILLION)
                                      TABLE 115 BRAZIL: SATELLITE SOLAR CELL MATERIALS MARKET, BY APPLICATION, 2024–2030 (USD MILLION)
             10.5.3 SOUTH AFRICA
                        10.5.3.1 Growing investments in satellite technologies to drive market in South Africa
                                      TABLE 116 SOUTH AFRICA: SATELLITE SOLAR CELL MATERIALS MARKET, BY APPLICATION, 2020–2023 (USD MILLION)
                                      TABLE 117 SOUTH AFRICA: SATELLITE SOLAR CELL MATERIALS MARKET, BY APPLICATION, 2024–2030 (USD MILLION)
             10.5.4 OTHERS IN REST OF WORLD
                        TABLE 118 OTHERS IN REST OF WORLD: SATELLITE SOLAR CELL MATERIALS MARKET, BY APPLICATION, 2020–2023 (USD MILLION)
                        TABLE 119 OTHERS IN REST OF WORLD: SATELLITE SOLAR CELL MATERIALS MARKET, BY APPLICATION, 2024–2030 (USD MILLION)
 
11 COMPETITIVE LANDSCAPE (Page No. - 150)
     11.1 INTRODUCTION 
     11.2 STRATEGIES ADOPTED BY KEY PLAYERS 
             11.2.1 OVERVIEW OF STRATEGIES ADOPTED BY KEY SATELLITE SOLAR CELL MATERIAL MANUFACTURERS
     11.3 MARKET SHARE ANALYSIS 
             11.3.1 RANKING OF KEY MARKET PLAYERS, 2023
                        FIGURE 35 RANKING OF TOP FIVE PLAYERS IN SATELLITE SOLAR CELL MATERIALS MARKET, 2023
             11.3.2 MARKET SHARE OF KEY PLAYERS
                        TABLE 120 SATELLITE SOLAR CELL MATERIALS MARKET: DEGREE OF COMPETITION
                        FIGURE 36 SHARE OF KEY PLAYERS IN SATELLITE SOLAR CELL MATERIALS MARKET, 2023
                        11.3.2.1 SPECTROLAB (US)
                        11.3.2.2 AZUR SPACE SOLAR POWER GMBH (GERMANY)
                        11.3.2.3 ROCKET LAB USA (US)
                        11.3.2.4 SHARP CORPORATION (JAPAN)
                        11.3.2.5 CESI S.P.A (ITALY)
     11.4 REVENUE ANALYSIS 
             FIGURE 37 REVENUE ANALYSIS OF KEY PLAYERS, 2020–2024
     11.5 COMPANY EVALUATION MATRIX 
             11.5.1 STARS
             11.5.2 EMERGING LEADERS
             11.5.3 PERVASIVE PLAYERS
             11.5.4 PARTICIPANTS
                        FIGURE 38 SATELLITE SOLAR CELL MATERIALS MARKET: COMPANY EVALUATION MATRIX, 2023
             11.5.5 COMPANY FOOTPRINT
                        FIGURE 39 SATELLITE SOLAR CELL MATERIALS MARKET: COMPANY FOOTPRINT
                        TABLE 121 COMPANY APPLICATION FOOTPRINT (10 COMPANIES)
                        TABLE 122 COMPANY COMPONENT FOOTPRINT (10 COMPANIES)
                        TABLE 123 COMPANY MATERIAL TYPE FOOTPRINT (10 COMPANIES)
                        TABLE 124 COMPANY REGION FOOTPRINT (10 COMPANIES)
     11.6 STARTUP/SME EVALUATION MATRIX 
             11.6.1 PROGRESSIVE COMPANIES
             11.6.2 RESPONSIVE COMPANIES
             11.6.3 DYNAMIC COMPANIES
             11.6.4 STARTING BLOCKS
                        FIGURE 40 SATELLITE SOLAR CELL MATERIALS MARKET: STARTUPS/SMES EVALUATION MATRIX, 2022
             11.6.5 COMPETITIVE BENCHMARKING
                        TABLE 125 SATELLITE SOLAR CELL MATERIALS MARKET: DETAILED LIST OF KEY STARTUPS/SMES
                        11.6.5.1 Satellite solar cell materials market: Competitive benchmarking of key startups/SMEs
                                      TABLE 126 STARTUPS/SMES APPLICATION FOOTPRINT (14 COMPANIES)
                                      TABLE 127 STARTUPS/SMES COMPONENT FOOTPRINT (14 COMPANIES)
                                      TABLE 128 STARTUPS/SMES MATERIAL FOOTPRINT (14 COMPANIES)
                                      TABLE 129 STARTUPS/SMES REGION FOOTPRINT (14 COMPANIES)
     11.7 VALUATION AND FINANCIAL METRICS OF KEY SATELLITE SOLAR CELL MATERIAL VENDORS 
             FIGURE 41 EV/EBITDA OF KEY VENDORS
             FIGURE 42 YEAR-TO-DATE (YTD) PRICE TOTAL RETURN AND 5-YEAR STOCK BETA OF KEY VENDORS
     11.8 COMPETITIVE SCENARIO AND TRENDS 
             11.8.1 PRODUCT LAUNCHES
                        TABLE 130 SATELLITE SOLAR CELL MATERIALS MARKET: PRODUCT LAUNCHES (2021−2024)
             11.8.2 DEALS
                        TABLE 131 SATELLITE SOLAR CELL MATERIALS MARKET: DEALS (2020–2023)
             11.8.3 EXPANSIONS
                        TABLE 132 SATELLITE SOLAR CELL MATERIALS MARKET: EXPANSIONS (2022–2023)
 
12 COMPANY PROFILES (Page No. - 178)
(Business Overview, Products/Solutions/Services Offered, Recent Developments, MnM view (Key strengths/Right to win, Strategic choices made, Weakness/competitive threats)*
     12.1 KEY PLAYERS 
             12.1.1 SPECTROLAB
                        TABLE 133 SPECTROLAB: COMPANY OVERVIEW
                        FIGURE 43 SPECTROLAB: COMPANY SNAPSHOT
                        TABLE 134 SPECTROLAB: PRODUCTS/SERVICES/SOLUTIONS OFFERED
                        TABLE 135 SPECTROLAB: DEALS (2020–2023)
             12.1.2 MITSUBISHI ELECTRIC CORPORATION
                        TABLE 136 MITSUBISHI ELECTRIC CORPORATION: COMPANY OVERVIEW
                        FIGURE 44 MITSUBISHI ELECTRIC CORPORATION: COMPANY SNAPSHOT
                        TABLE 137 MITSUBISHI ELECTRIC CORPORATION: PRODUCTS/SOLUTIONS/SERVICES OFFERED
                        TABLE 138 MITSUBISHI ELECTRIC CORPORATION: DEALS (2020–2023)
                        TABLE 139 MITSUBISHI ELECTRIC CORPORATION: OTHER DEVELOPMENTS
             12.1.3 NORTHROP GRUMMAN
                        TABLE 140 NORTHROP GRUMMAN: COMPANY OVERVIEW
                        FIGURE 45 NORTHROP GRUMMAN: COMPANY SNAPSHOT
                        TABLE 141 NORTHROP GRUMMAN: PRODUCTS/SERVICES/SOLUTIONS OFFERED
                        TABLE 142 NORTHROP GRUMMAN: DEALS (2020–2023)
                        TABLE 143 NORTHROP GRUMMAN: OTHER DEVELOPMENTS
             12.1.4 SHARP CORPORATION
                        TABLE 144 SHARP CORPORATION: COMPANY OVERVIEW
                        FIGURE 46 SHARP CORPORATION: COMPANY SNAPSHOT
                        TABLE 145 SHARP CORPORATION: PRODUCTS/SERVICES/SOLUTIONS OFFERED
                        TABLE 146 SHARP CORPORATION: PRODUCT LAUNCHES
             12.1.5 AZUR SPACE SOLAR POWER GMBH
                        TABLE 147 AZUR SPACE SOLAR POWER GMBH: COMPANY OVERVIEW
                        FIGURE 47 AZUR SPACE SOLAR POWER GMBH: COMPANY SNAPSHOT
                        TABLE 148 AZUR SPACE SOLAR POWER GMBH: PRODUCTS/SERVICES/SOLUTIONS OFFERED
                        TABLE 149 AZUR SPACE SOLAR POWER GMBH: DEALS (2020–2023)
             12.1.6 THALES ALENIA SPACE
                        TABLE 150 THALES ALENIA SPACE: COMPANY OVERVIEW
                        FIGURE 48 THALES ALENIA SPACE: COMPANY SNAPSHOT
                        TABLE 151 THALES ALENIA SPACE: PRODUCTS/SERVICES/SOLUTIONS OFFERED
                        TABLE 152 THALES ALENIA SPACE: PRODUCT LAUNCHES
                        TABLE 153 THALES ALENIA SPACE: DEALS (2020–2023)
                        TABLE 154 THALES ALENIA SPACE: OTHER DEVELOPMENTS
             12.1.7 ROCKET LAB USA
                        TABLE 155 ROCKET LAB USA: COMPANY OVERVIEW
                        FIGURE 49 ROCKET LAB USA: COMPANY SNAPSHOT
                        TABLE 156 ROCKET LAB USA: PRODUCTS/SERVICES/SOLUTIONS OFFERED
                        TABLE 157 ROCKET LAB USA: PRODUCT LAUNCHES
                        TABLE 158 ROCKET LAB USA: DEALS (2020–2023)
             12.1.8 CESI S.P.A
                        TABLE 159 CESI S.P.A.: COMPANY OVERVIEW
                        TABLE 160 CESI S.P.A.: PRODUCTS/SERVICES/SOLUTIONS OFFERED
                        TABLE 161 CESI S.P.A.: DEALS (2020–2023)
             12.1.9 AIRBUS
                        TABLE 162 AIRBUS: COMPANY OVERVIEW
                        FIGURE 50 AIRBUS: COMPANY SNAPSHOT
                        TABLE 163 AIRBUS: PRODUCTS/SERVICES/SOLUTIONS OFFERED
                        TABLE 164 AIRBUS: DEALS
             12.1.10 MICROLINK DEVICES, INC.
                        TABLE 165 MICROLINK DEVICES, INC.: COMPANY OVERVIEW
                        TABLE 166 MICROLINK DEVICES, INC.: PRODUCTS/SERVICES/SOLUTIONS OFFERED
                        TABLE 167 MICROLINK DEVICES, INC.: OTHER DEVELOPMENTS
     12.2 OTHER PLAYERS 
             12.2.1 REDWIRE CORPORATION
                        TABLE 168 REDWIRE CORPORATION: COMPANY OVERVIEW
             12.2.2 ASCENT SOLAR TECHNOLOGIES, INC.
                        TABLE 169 ASCENT SOLAR TECHNOLOGIES, INC.: COMPANY OVERVIEW
             12.2.3 N.P.C. NEW PRODUCTION CONCEPT S.R.L. (SPACEMIND)
                        TABLE 170 N.P.C. NEW PRODUCTION CONCEPT S.R.L.(SPACEMIND): COMPANY OVERVIEW
             12.2.4 GOMSPACE
                        TABLE 171 GOMSPACE: COMPANY OVERVIEW
             12.2.5 AAC CLYDE SPACE
                        TABLE 172 AAC CLYDE SPACE: COMPANY OVERVIEW
             12.2.6 SPACETECH
                        TABLE 173 SPACETECH: COMPANY OVERVIEW
             12.2.7 MMA DESIGN LLC
                        TABLE 174 MMA DESIGN LLC: COMPANY OVERVIEW
             12.2.8 DHV TECHNOLOGY
                        TABLE 175 DHV TECHNOLOGY: COMPANY OVERVIEW
             12.2.9 KONGSBERG NANOAVIONICS
                        TABLE 176 KONGSBERG NANOAVIONICS: COMPANY OVERVIEW
             12.2.10 PUMPKIN, INC.
                        TABLE 177 PUMPKIN, INC.: COMPANY OVERVIEW
             12.2.11 ENDUROSAT
                        TABLE 178 ENDUROSAT: COMPANY OVERVIEW
             12.2.12 SIERRA SPACE CORPORATION
                        TABLE 179 SIERRA SPACE CORPORATION: COMPANY OVERVIEW
             12.2.13 MPOWER TECHNOLOGY
                        TABLE 180 MPOWER TECHNOLOGY: COMPANY OVERVIEW
             12.2.14 SHANGHAI FULLSUNS ENERGY TECHNOLOGY CO., LTD.
                        TABLE 181 SHANGHAI FULLSUNS ENERGY TECHNOLOGY CO., LTD.: COMPANY OVERVIEW
 
*Details on Business Overview, Products/Solutions/Services Offered, Recent Developments, MnM view (Key strengths/Right to win, Strategic choices made, Weakness/competitive threats)* might not be captured in case of unlisted companies.
 
13 APPENDIX (Page No. - 232)
     13.1 DISCUSSION GUIDE 
     13.2 KNOWLEDGESTORE: MARKETSANDMARKETS’ SUBSCRIPTION PORTAL 
     13.3 CUSTOMIZATION OPTIONS 
     13.4 RELATED REPORTS 
     13.5 AUTHOR DETAILS 

The study involved four major activities in estimating the market size of the Satellite solar cell materials market. Exhaustive secondary research was done to collect information on the market, the peer market, and the parent market. The next step was to validate these findings, assumptions, and sizing with industry experts across the value chain through primary research. Both top-down and bottom-up approaches were employed to estimate the complete market size. Thereafter, the market breakdown and data triangulation procedures were used to estimate the market size of the segments and subsegments.

Secondary Research

In the secondary research process, various secondary sources have been referred to for identifying and collecting information for this study. These secondary sources include annual reports, press releases, investor presentations of companies, white papers, certified publications, trade directories, articles from recognized authors, the gold standard and silver standard websites, and databases.

Secondary research has been used to obtain key information about the value chain of the industry, the monetary chain of the market, the total pool of key players, market classification, and segmentation according to industry trends to the bottom-most level and regional markets. It was also used to obtain information about the key developments from a market-oriented perspective.

Primary Research

The satellite solar cell materials market comprises several stakeholders in the value chain, which include raw material suppliers, research & development, fabricators/applicators, distribution and logistics, and end users. Various primary sources from the supply and demand sides of the satellite solar cell materials market have been interviewed to obtain qualitative and quantitative information. The primary interviewees from the demand side include key opinion leaders in end-use sectors. The primary sources from the supply side include manufacturers, associations, and institutions involved in the satellite solar cell materials industry.

Primary interviews were conducted to gather insights such as market statistics, data on revenue collected from the products and services, market breakdowns, market size estimations, market forecasting, and data triangulation. Primary research also helped in understanding the various trends related to form, type, application, end-use industry and region. Stakeholders from the demand side, such as CIOs, CTOs, and CSOs, were interviewed to understand the buyer’s perspective on the suppliers, products, fabricators, and their current usage of satellite solar cells materials and the outlook of their business, which will affect the overall market.

The breakdown of profiles of the primary interviewees is illustrated in the figure below:

Satellite Solar Cell Materials Market Size, and Share

Note: Tier 1, Tier 2, and Tier 3 companies are classified based on their market revenue in 2022, available in the public domain, product portfolios, and geographical presence.
Other designations include consultants and sales, marketing, and procurement managers.


To know about the assumptions considered for the study, download the pdf brochure

Company name

Designation

Spectrolab (US)

Individual Industry Expert

AZUR SPACE Solar Power GmbH (Germany)

Director Sales and Marketing

ROCKET LAB USA (US)

Manager

Sharp Corporation (Japan)

Marketing Manager

CESI S.p.A (Italy)

Senior Scientist

Market Size Estimation

The top-down and bottom-up approaches have been used to estimate and validate the size of the Satellite solar cell materials market.

  • The key players in the industry have been identified through extensive secondary research.
  • The industry's supply chain has been determined through primary and secondary research.
  • All percentage shares, splits, and breakdowns have been determined using secondary sources and verified through primary sources.
  • All possible parameters that affect the markets covered in this research study have been accounted for, viewed in extensive detail, verified through primary research, and analyzed to obtain the final quantitative and qualitative data.
  • The research includes the study of reports, reviews, and newsletters of the key market players, along with extensive interviews for opinions with leaders such as directors and marketing executives.

Satellite Solar Cell Materials Market Size, and Share

Note: All the shares are based on the global market size.

Source: Secondary Research, Interviews with Experts, and MarketsandMarkets Analysis

To know about the assumptions considered for the study, Request for Free Sample Report

Satellite Solar Cells Materials Market: Top-Down Approach

Satellite Solar Cell Materials Market Size, and Share

Data Triangulation

After arriving at the total market size from the estimation process explained above, the overall market has been split into several segments and sub-segments. To complete the overall market engineering process and arrive at the exact statistics for all the segments and sub-segments, the data triangulation and market breakdown procedures have been employed, wherever applicable. The data has been triangulated by studying various factors and trends from both the demand and supply sides. Along with this, the market size has been validated by using both the top-down and bottom-up approaches and primary interviews. Hence, for every data segment, there have been three sources—top-down approach, bottom-up approach, and expert interviews. The data was assumed correct when the values arrived from the three sources matched.

Market Definition

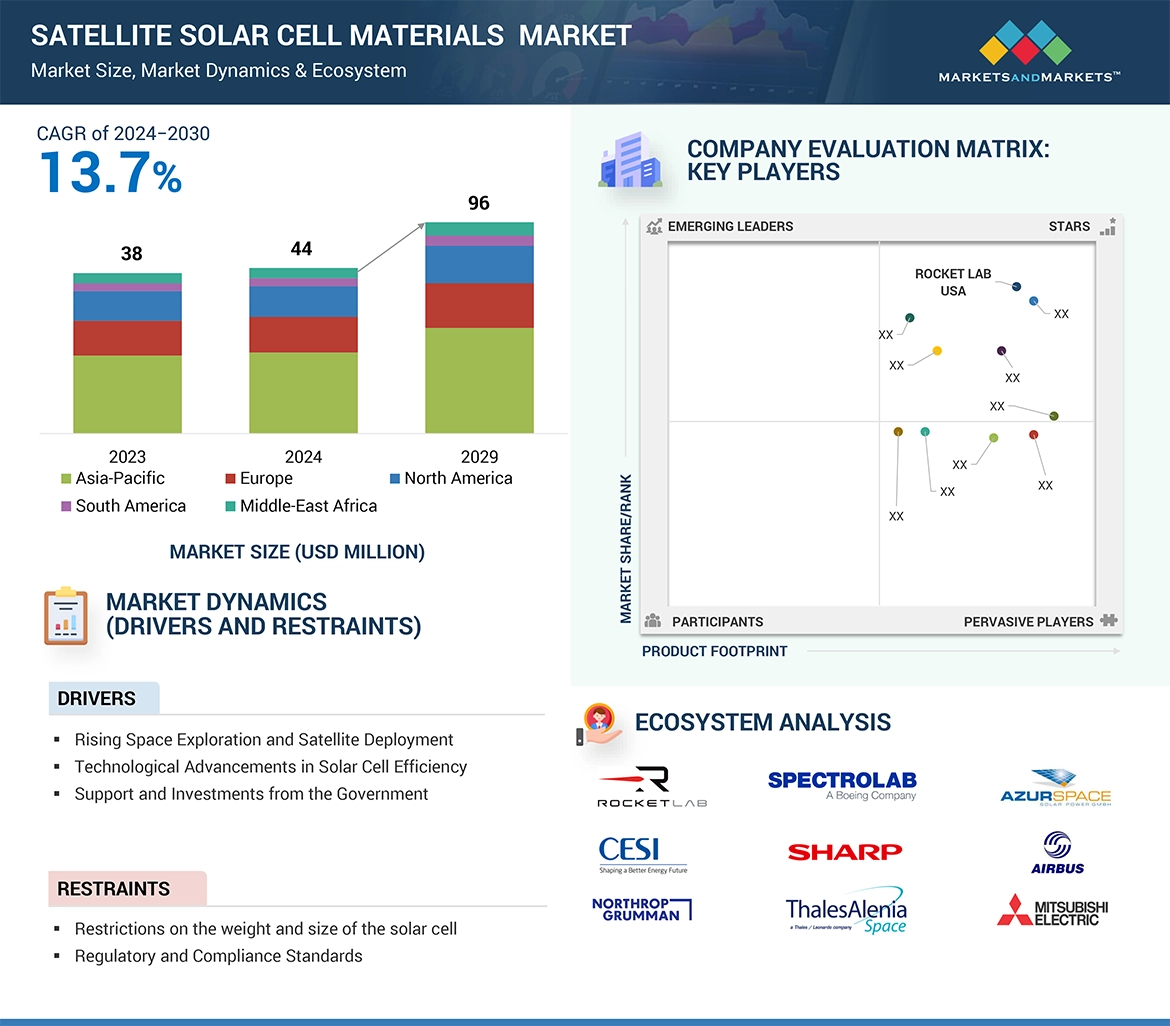
The satellite solar cell materials market  pertains to the array of materials involved in the production of solar cells specifically designed for use in satellites. These materials play a pivotal role in constructing solar cells capable of harnessing solar energy in the harsh and demanding conditions of outer space. The market encompasses a range of advanced materials, including materials like  silicon and GaAs, which are carefully selected for their ability to withstand extreme temperatures, radiation, and vacuum conditions prevalent in space environments. Key components such as coverglass and interconnected cells contribute to the durability and efficiency of these solar cells. The market is characterized by the stringent requirements of the space industry, demanding materials that ensure reliability, longevity, and optimal energy conversion in space applications. As space exploration, satellite deployment, and communication activities continue to rise, the demand for high-performance satellite solar cell materials is expected to grow, making this market integral to the success of various space missions and satellite technologies. Companies operating in this market focus on developing cutting-edge materials to meet the rigorous standards of the space industry, catering to the evolving needs of satellite manufacturers and space agencies worldwide.

Key Stakeholders

  • Satellite solar cells materials manufacturers
  • Satellite solar cells materials traders, distributors, and suppliers
  • End-use industry participants of different segments of the satellite solar cells materials market
  • Government and research organizations
  • Associations and industrial bodies
  • Research and consulting firms.
  • Research & development (R&D) institutions.
  • Environmental support agencies.

Report Objectives

  • To define, describe, and forecast the size of the satellite solar cell materials market, in terms of value and volume.
  • To provide detailed information regarding the major factors (drivers, opportunities, restraints, and challenges) influencing the growth of the market
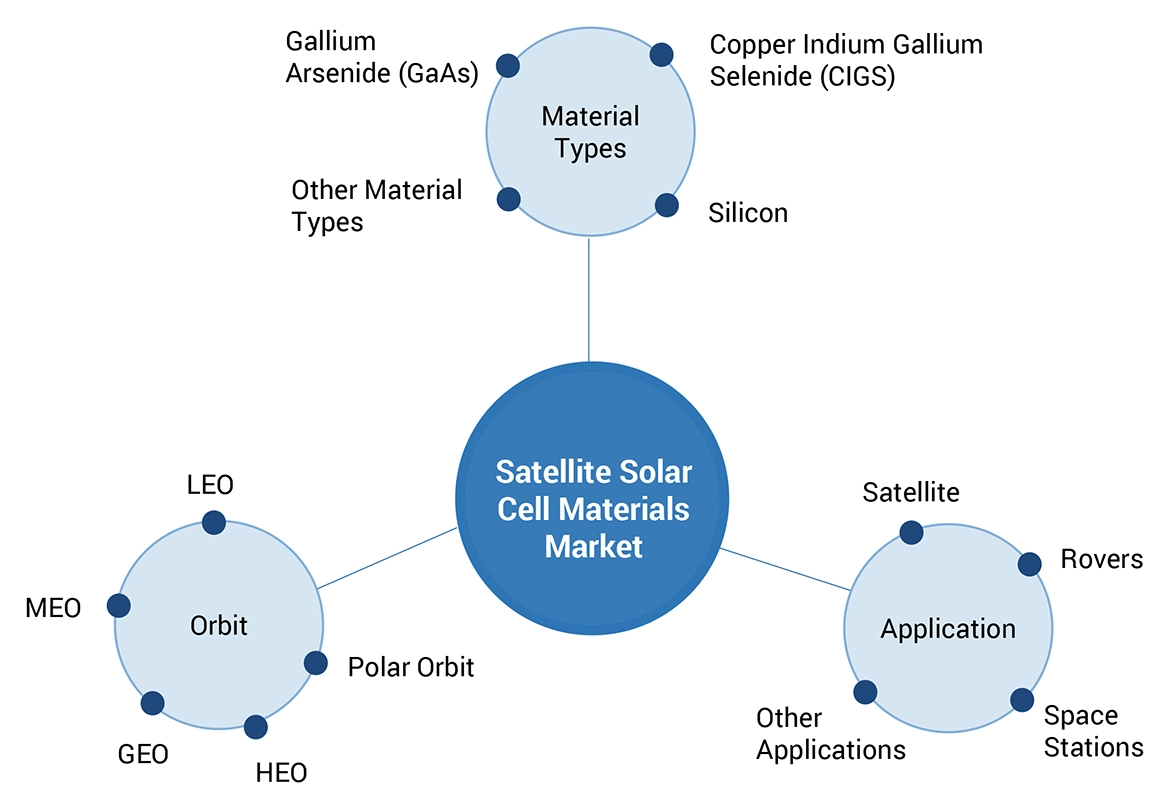
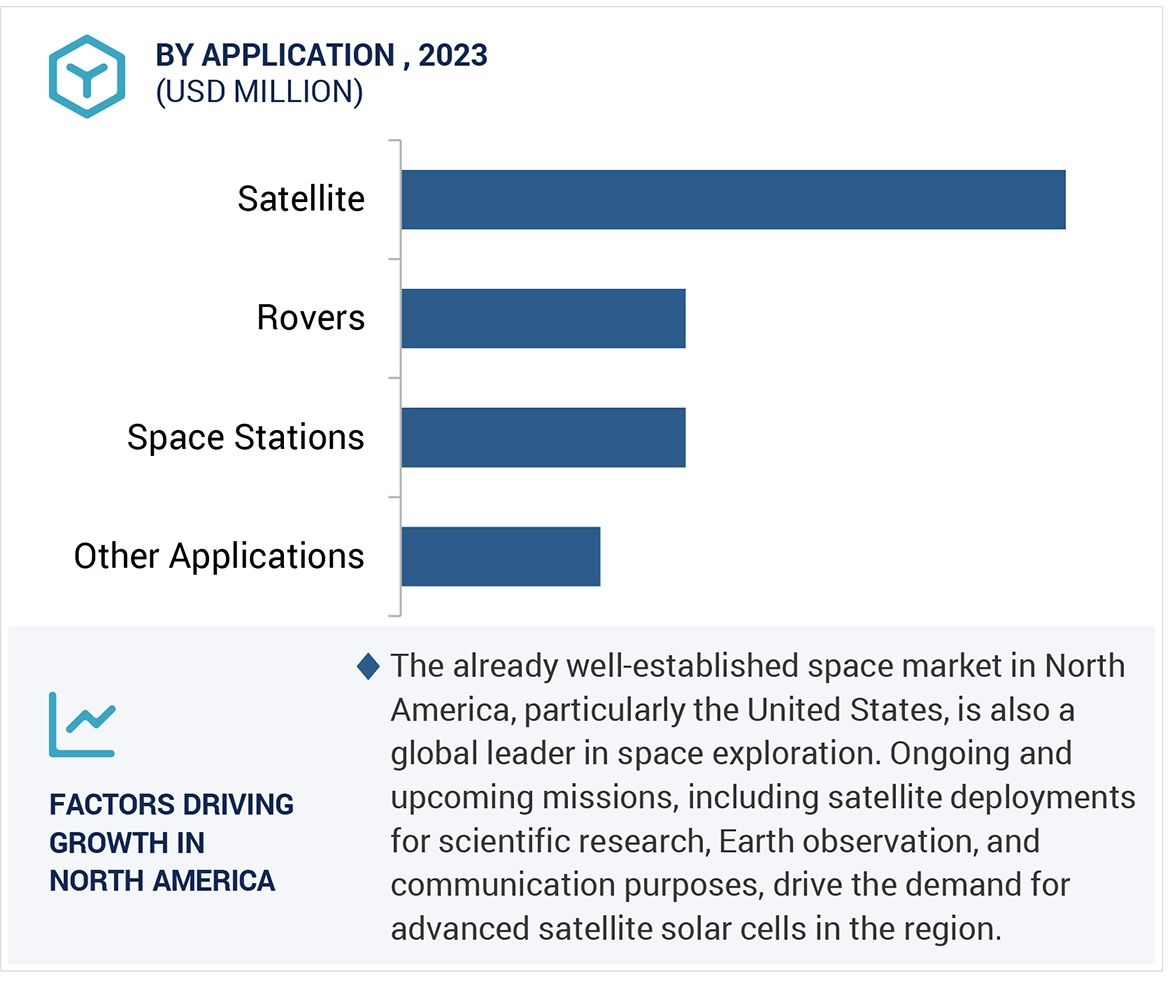
  • To estimate and forecast the market size based on material types, application, orbit and region.
  • To forecast the size of the market with respect to major regions, namely, Europe, North America, Asia Pacific, Rest of the world, along with their key countries.
  • To strategically analyze micromarkets1 with respect to individual growth trends, prospects, and their contribution to the overall market.
  • To analyze opportunities in the market for stakeholders and provide a competitive landscape of market leaders.
  • To track and analyze recent developments such as expansions, new product launches, partnerships & agreements, and acquisitions in the market.
  • To strategically profile key market players and comprehensively analyze their core competencies.

Available Customizations

Along with the given market data, MarketsandMarkets offers customizations according to the company’s specific needs. The following customization options are available for the report:

Regional Analysis

  • Further breakdown of a region with respect to a particular country or additional application

Company Information

  • Detailed analysis and profiles of additional market players
Custom Market Research Services

We will customize the research for you, in case the report listed above does not meet with your exact requirements. Our custom research will comprehensively cover the business information you require to help you arrive at strategic and profitable business decisions.

Request Customization
Report Code
CH 8971
Published ON
Mar, 2024
Choose License Type
BUY NOW
  • SHARE
X
Request Customization
Speak to Analyst
Speak to Analyst
OR FACE-TO-FACE MEETING
PERSONALIZE THIS RESEARCH
  • Triangulate with your Own Data
  • Get Data as per your Format and Definition
  • Gain a Deeper Dive on a Specific Application, Geography, Customer or Competitor
  • Any level of Personalization
REQUEST A FREE CUSTOMIZATION
LET US HELP YOU!
  • What are the Known and Unknown Adjacencies Impacting the Satellite Solar Cell Materials Market
  • What will your New Revenue Sources be?
  • Who will be your Top Customer; what will make them switch?
  • Defend your Market Share or Win Competitors
  • Get a Scorecard for Target Partners
CUSTOMIZED WORKSHOP REQUEST
+1-888-600-6441
  • Call Us
  • +1-888-600-6441 (Corporate office hours)
  • +1-888-600-6441 (US/Can toll free)
  • +44-800-368-9399 (UK office hours)
CONNECT WITH US
ABOUT TRUST ONLINE
©2024 MarketsandMarkets Research Private Ltd. All rights reserved
DMCA.com Protection Status Website Feedback