Space-Based Solar Power Market

Space-Based Solar Power Market by Beam Type (Laser Beam Power Transmission, Microwave Power Transmission), End Users (Government and Defense, Commercial), Application (Terrestrial, Space) and Region - Global Forecast to 2040

Report Code: AS 8953 Feb, 2024, by marketsandmarkets.com

[125 Pages Report] The Space-Based Solar Power Market is estimated to be USD 4.7 Billion in 2030 and is projected to reach USD 6.8 Billion by 2040, at a CAGR of 3.3% from 2030 to 2040. The Space-Based Solar Power Industry is driven by factors such as demand for sustainable energy. Technological advancements, the growing trend towards wireless power transmission contributes to innovation in space-based solar power, fostering a dynamic industry landscape. Overall, the technological evolution of green energy generation will meet evolving industry standards fuels the market's growth.

Space-Based Solar Power Market

Space-Based Solar Power Market

Space-Based Solar Power Market Forecast to 2035

To know about the assumptions considered for the study, Request for Free Sample Report

Space-based solar power Market Dynamics

Driver: Increasing Global Requirement for Energy Consumption

The demand for energy globally has been progressively increasing due to population growth, industrialization, and increased use of electronic devices. The idea of Space-based solar power presents an intriguing prospect for addressing the global energy demand. Unlike traditional energy sources, Space-based solar power has the potential to provide continuous and reliable power without being affected by weather conditions or the day-night cycle. This could be particularly beneficial for meeting the energy needs of densely populated areas, industries, and regions with limited access to conventional power infrastructure. The ability of SBSP to transmit energy wirelessly to various locations on Earth adds to its appeal as a potentially versatile solution. It could contribute to meeting the increasing energy demands of urban centers, remote regions, and disaster-disturbed areas, offering a reliable and sustainable power source.

Restraints: Limited Availability of Orbital Slots

In space-based solar power (SBSP) systems, satellites typically need to be deployed into a specific orbit called the geostationary earth orbit (GEO). This orbit, located approximately 36,000 kilometers above the Earth, synchronizes with the planet's rotation, allowing the satellite to appear stationary from an Earth observer's perspective. This unique characteristic makes GSO ideal for continuous communication without the need for movable antennas.

Given its uninterrupted signal transmission capability, GSO is commonly used for communication satellites, weather satellites, and global positioning satellites. For SBSP satellites, which transmit energy to Earth using microwave or laser beams, leveraging the fixed position over Earth's surface becomes advantageous. However, the challenge lies in the limited capacity of the GSO, with only a finite number of satellites able to occupy it simultaneously.

The GSO spans approximately 265,000 kilometers, and each geostationary satellite is confined to a thirty-kilometer band defining its specific position or "slot." Current technology allows for the coexistence of up to two satellites in the same slot. In total, the GSO can be divided into 1,800 slots without significant risk of collisions or interference between satellites. This delineation highlights the constraints and considerations in allocating orbital positions within the GSO, a critical factor for effective deployment and management of SBSP satellite constellations.

Opportunity: Government Initiatives for Green Energy Ecosystem

Governments worldwide are actively promoting green energy ecosystems through policies and funding initiatives, indirectly benefitting space-based solar power (SBSP) projects. Renewable energy policies, research and development funding, and international collaborations contribute to a supportive environment for innovative technologies like SBSP. While not explicitly targeting SBSP, space exploration programs and climate change mitigation efforts align with the goals of continuous and clean energy generation. Governments may offer incentives for innovation in the renewable energy sector, providing opportunities for companies, including those involved in SBSP research, to access grants and competitions. As the sector advances, it's crucial for businesses to stay abreast of evolving government initiatives that could impact the development and commercialization of space-based solar power solutions.

For Instance, The State Energy Program (SEP) of the U.S. Department of Energy underscores the state's autonomy as the primary decision-maker and executor of program initiatives within its jurisdiction, customized to leverage their distinct resources, operational capabilities, and energy objectives. The primary objective of the State Energy Program (SEP) is to foster energy efficiency and mitigate the escalation of energy demand by formulating and executing targeted state energy initiatives.

Challenges: Expensive GEO/LEO Launch Cost

The integration of space-based solar power (SBSP) into the global energy landscape faces a significant challenge in the form of the high launch costs associated with deploying satellites into both Geostationary Earth Orbit (GEO) and Low Earth Orbit (LEO). The expense of transporting satellites to these orbits is a formidable barrier, impacting the economic viability of SBSP initiatives. GEO, with its stationary position relative to Earth, is optimal for continuous solar energy collection, but the cost of launching and maintaining satellites in this orbit is notably high.

On the other hand, LEO offers a more cost-effective alternative, but the trade-off involves reduced time for solar power collection due to the satellite's orbital motion. Striking a balance between optimal orbit selection and managing launch costs becomes crucial for the successful commercialization of SBSP.

For Instance, the current cost of launching a satellite into Geostationary Earth Orbit (GEO) is approximately $10,000 to $15,000 per kilogram. Given that satellites for space-based solar power (SBSP) can weigh several tons, the total launch cost to GEO can range from tens of millions to over a hundred million USD. Low Earth Orbit (LEO) launches are generally more cost-effective, with prices ranging from $2,500 to $5,000 per kilogram. However, the challenge lies in the fact that LEO satellites have a shorter orbital period, requiring more frequent launches to maintain continuous solar power collection. This increased launch frequency can contribute significantly to the overall cost of establishing and sustaining an SBSP system in LEO.

To put this into perspective, a mid-sized GEO satellite for SBSP could cost anywhere from $100 Million to $300 Million for launch and deployment. In contrast, LEO satellites, while more cost-effective per kilogram, may incur additional costs due to the need for more frequent launches to compensate for their shorter orbital periods. These figures emphasize the substantial financial considerations associated with launching and maintaining satellites for space-based solar power, underscoring the challenge of optimizing costs to make SBSP economically competitive within the energy market.

Space-Based Solar Power Market Ecosystem

In the space-based solar power market ecosystem, key stakeholders range from major space based solar service providers to private enterprises, distributors, suppliers, retailers, and end customers. Influential forces shaping the industry include investors, funders, academic researchers, distributors, service providers, and defense procurement authorities. This intricate network of participants collaboratively drives market dynamics, innovation, and strategic decisions, highlighting the complexity and vitality of the space-based solar power sector

Space-Based Solar Power Market by Ecosystem

Based on End Users, the Government and Defense Segment Are Estimated to Lead the Space-Based Solar Power Market in 2030

Based on the end users the space-based solar power market has been segmented into government and defense, and commercial end users. Here government and defense end user are leading this segment in 2030. The government and defense end user segment in space-based solar power is experiencing robust growth driven by government funding and initiatives, and the partnership taking place between these government agencies and other key players of the market. While Defense agencies prioritize energy security and resilience, relying on continuous power sources for critical operations in remote or austere environments.

Based on the Beam Type, the Microwave Power Transmission Segment is Estimated to Lead the Space-Based Solar Power Market in 2030

Based on the beam type, the space-based solar power market has been segmented into laser beam power transmission, and microwave power transmission beam type. Here microwave power transmission, beam type is leading this segment in 2030. The microwave power transmission  beam type segment in space-based solar power is thriving due the scalability and flexibility of microwave power transmission space-based solar power systems which makes them suitable for a wide range of applications, from powering remote communities to supporting large-scale industrial operations.

The Asia Pacific Market is Projected to Have the Largest Share in 2030 in the Space-Based Solar Power Market

Based on region, the space-based solar power market has been segmented into North America, Europe, Asia Pacific. Asia Pacific's space-based solar power sector will thrive due to a combination of factors. The Asia-Pacific (APAC) region, home to rapidly growing economies, grapples with escalating energy demands alongside pressing environmental challenges like air pollution and climate change. Space-Based Solar Power emerges as a compelling solution, offering clean, reliable energy devoid of fossil fuel emissions. Notably, governments in China and Japan, are actively allocating resources towards space-based solar power research and development, pivotal for its commercialization.

Space-Based Solar Power Market
 by Region

Space-Based Solar Power Market by Region

To know about the assumptions considered for the study, download the pdf brochure

Space-Based Solar Power Industry Companies: Top
Key Market Players

Major players in the Space-Based solar Power Companies include Airbus (Netherlands), Northrop Grumman (US), OHB SE (Germany), Thales Alenia Space (France), Boeing (US), EMROD (New Zealand) to enhance their presence in the market. The report covers various industry trends and new technological innovations in the space-based solar power market.

Get online access to the report on the World's First Market Intelligence Cloud

  • Easy to Download Historical Data & Forecast Numbers
  • Company Analysis Dashboard for high growth potential opportunities
  • Research Analyst Access for customization & queries
  • Competitor Analysis with Interactive dashboard
  • Latest News, Updates & Trend analysis
Request Sample

Scope of the Report

Report Metric

Details

Estimated Market Size

USD 4.7 Billion in 2030

Projected Market Size

USD 6.8 Billion by 2040

Growth Rate

3.3%

Market Size Available for Years

2030-2040

Base Year Considered

2030

Forecast Period

2030-2040

Forecast Units

Value (USD)

Segments Covered

By End Users, Beam Type, Application


Geographies Covered

North America, Europe, Asia Pacific

Companies Covered

Airbus (Netherlands), Northrop Grumman (US), OHB SE (Germany), Thales Alenia Space (France), Boeing (US), EMROD (New Zealand), Airborne (Netherlands), SpaceTech GmbH (Germany), Virtus Solis (US), Azur Space Solar Power GmbH (Germany) and 12 others. (22 companies)

Space-Based Solar Power Market Highlights

This research report categorizes the Space-Based Solar Power markets based on End users, beam type, application.

Segment

Subsegment

By End Users

  • Government and Defense
  • Commercial

By Beam Type

  • Microwave Power Transmission
  • Laser Beam Power Transmission

By Application

  • Terrestrial
  • Space

By Region

  • North America
  • Europe
  • Asia Pacific

Recent Developments

  • In December 2022, Researchers at Airbus' X-Works Innovation Factory in Germany achieved successful electrical power transmission using microwaves from a photovoltaic panel to a receiver. The beamed energy illuminated a model city and powered a hydrogen engine and a fridge with alcohol-free beer. Airbus' wireless transmission system currently reaches approximately 100 feet (30 meters). Engineers express confidence in extending this range to space within the next decade, reflecting ongoing advancements in energy transmission technology.
  • In July 2023, Thales Alenia Space was chosen by European Space Agency (ESA) to do a feasibility study for the SOLARIS initiative, which will determine the viability of a project to provide clean energy from spaceborne solar power plants to meet requirements down on Earth.

Frequently Asked Questions (FAQs) Addressed by the Report:

To speak to our analyst for a discussion on the above findings, click Speak to Analyst

TABLE OF CONTENTS
 
1 INTRODUCTION (Page No. - 18)
    1.1 STUDY OBJECTIVES 
    1.2 MARKET DEFINITION 
    1.3 STUDY SCOPE 
           1.3.1 MARKETS COVERED
                    FIGURE 1 SPACE-BASED SOLAR POWER MARKET SEGMENTATION
           1.3.2 REGIONS COVERED
           1.3.3 YEARS CONSIDERED
    1.4 INCLUSIONS AND EXCLUSIONS 
           TABLE 1 INCLUSIONS AND EXCLUSIONS
    1.5 CURRENCY CONSIDERED 
           TABLE 2 USD EXCHANGE RATES
    1.6 STAKEHOLDERS 
 
2 RESEARCH METHODOLOGY (Page No. - 22)
    2.1 INTRODUCTION 
           FIGURE 2 REPORT PROCESS FLOW
           FIGURE 3 RESEARCH DESIGN
           2.1.1 SECONDARY DATA
                    2.1.1.1 Key data from secondary sources
           2.1.2 PRIMARY DATA
                    2.1.2.1 Key data from primary sources
                               FIGURE 4 BREAKDOWN OF PRIMARY INTERVIEWS: BY COMPANY TYPE, DESIGNATION, AND REGION
    2.2 RECESSION IMPACT ANALYSIS 
           2.2.1 DEMAND-SIDE INDICATORS
           2.2.2 SUPPLY-SIDE INDICATORS
    2.3 FACTOR ANALYSIS 
           2.3.1 INTRODUCTION
           2.3.2 DEMAND-SIDE ANALYSIS
           2.3.3 SUPPLY-SIDE ANALYSIS
    2.4 MARKET SIZE ESTIMATION AND METHODOLOGY 
           2.4.1 BOTTOM-UP APPROACH
                    FIGURE 5 MARKET SIZE ESTIMATION METHODOLOGY: BOTTOM-UP APPROACH
           2.4.2 TOP-DOWN APPROACH
                    FIGURE 6 MARKET SIZE ESTIMATION METHODOLOGY: TOP-DOWN APPROACH
    2.5 DATA TRIANGULATION 
           FIGURE 7 DATA TRIANGULATION
    2.6 RESEARCH ASSUMPTIONS 
           2.6.1 GROWTH RATE ASSUMPTIONS
           2.6.2 PARAMETRIC ASSUMPTIONS FOR MARKET FORECAST
    2.7 RESEARCH LIMITATIONS 
    2.8 RISK ASSESSMENT 
 
3 EXECUTIVE SUMMARY (Page No. - 32)
    FIGURE 8 GOVERNMENT AND DEFENSE SEGMENT TO WITNESS LARGEST MARKET SHARE DURING FORECAST PERIOD
    FIGURE 9 LASER BEAM POWER TRANSMISSION SEGMENT TO REGISTER HIGHEST CAGR DURING FORECAST PERIOD
    FIGURE 10 ASIA PACIFIC TO ACCOUNT FOR LARGEST MARKET SHARE IN 2030
 
4 PREMIUM INSIGHTS (Page No. - 34)
    4.1 ATTRACTIVE OPPORTUNITIES FOR PLAYERS IN SPACE-BASED SOLAR POWER MARKET 
           FIGURE 11 INCREASING FOCUS ON DEVELOPMENT OF MICROWAVE TRANSMISSION TECHNOLOGY TO DRIVE MARKET
    4.2 SPACE-BASED SOLAR POWER MARKET, BY BEAM TYPE 
           FIGURE 12 MICROWAVE POWER TRANSMISSION SEGMENT TO HAVE LARGEST MARKET SHARE IN 2030
    4.3 SPACE-BASED SOLAR POWER MARKET, BY END USER 
           FIGURE 13 GOVERNMENT AND DEFENSE SEGMENT TO LEAD DURING FORECAST PERIOD
 
5 MARKET OVERVIEW (Page No. - 36)
    5.1 INTRODUCTION 
    5.2 MARKET DYNAMICS 
           FIGURE 14 SPACE-BASED SOLAR POWER MARKET: DRIVERS, RESTRAINTS, OPPORTUNITIES, AND CHALLENGES
           5.2.1 DRIVERS
                    5.2.1.1 Rising energy consumption worldwide
                               FIGURE 15 REGIONAL ENERGY CONSUMPTION, 2018–2022
                    5.2.1.2 Growing adoption of green energy
                    5.2.1.3 Increasing development of favorable infrastructure
           5.2.2 RESTRAINTS
                    5.2.2.1 High initial investment cost
                    5.2.2.2 Space debris and maintenance concerns
                               FIGURE 16 SPACE JUNK IN 2023
                    5.2.2.3 Limited availability of orbital slots
           5.2.3 OPPORTUNITIES
                    5.2.3.1 Growing shift toward self-sufficient energy generation
           5.2.4 CHALLENGES
                    5.2.4.1 Technological challenges involved in power transfer
                    5.2.4.2 Political and regulatory obstacles
                    5.2.4.3 Competition with other renewable sources
                    5.2.4.4 Expensive launch cost of geostationary and low earth orbit satellites
                    5.2.4.5 Complex space-based assembly
    5.3 VALUE CHAIN ANALYSIS 
           FIGURE 17 VALUE CHAIN ANALYSIS
    5.4 TRENDS/DISRUPTIONS IMPACTING CUSTOMER BUSINESS 
           FIGURE 18 REVENUE SHIFT AND NEW REVENUE POCKETS FOR PLAYERS IN SPACE-BASED SOLAR POWER MARKET
    5.5 ECOSYSTEM ANALYSIS 
           FIGURE 19 ECOSYSTEM MAPPING
           TABLE 3 ROLE OF COMPANIES IN ECOSYSTEM
    5.6 REGULATORY LANDSCAPE 
           TABLE 4 NORTH AMERICA: REGULATORY BODIES, GOVERNMENT AGENCIES, AND OTHER AGENCIES
           TABLE 5 EUROPE: REGULATORY BODIES, GOVERNMENT AGENCIES, AND OTHER AGENCIES
           TABLE 6 ASIA PACIFIC: REGULATORY BODIES, GOVERNMENT AGENCIES, AND OTHER AGENCIES
    5.7 TRADE DATA ANALYSIS 
           FIGURE 20 TOP 10 COUNTRY-WISE IMPORTS, 2018–2022
           TABLE 7 COUNTRY-WISE IMPORTS, 2018–2022 (USD THOUSAND)
           FIGURE 21 TOP 10 COUNTRY-WISE EXPORTS, 2018–2022
           TABLE 8 COUNTRY-WISE EXPORTS, 2018–2022 (USD THOUSAND)
    5.8 TECHNOLOGY ROADMAP 
           FIGURE 22 TECHNOLOGY ROADMAP, 2020–2050
           FIGURE 23 TECHNOLOGY TRENDS
    5.9 TECHNOLOGY ANALYSIS 
           5.9.1 KEY TECHNOLOGIES
                    5.9.1.1 Photovoltaic and perovskite solar cells
                    5.9.1.2 Wireless power transmission
           5.9.2 SUPPORTING TECHNOLOGIES
                    5.9.2.1 Power distribution network
    5.1 KEY CONFERENCES AND EVENTS 
           TABLE 9 KEY CONFERENCES AND EVENTS, 2024–2025
    5.11 USE CASE ANALYSIS 
           5.11.1 LOW-COST LAUNCH CAPABILITIES
           5.11.2 SATELLITE CONSTELLATION FOR SOLAR POWER
           5.11.3 SPACE-BASED SOLAR POWER PROTOTYPE
    5.12 PATENT ANALYSIS 
           FIGURE 24 PATENT ANALYSIS
           TABLE 10 INNOVATIONS AND PATENT REGISTRATIONS, 2019–2023
 
6 INDUSTRY TRENDS (Page No. - 57)
    6.1 INTRODUCTION 
    6.2 TECHNOLOGY TRENDS 
           6.2.1 ULTRALIGHTWEIGHT CARBON FIBER COMPOSITES
           6.2.2 ADVANCED RECTENNA DESIGN
           6.2.3 MULTI-JUNCTION SOLAR CELLS
           6.2.4 SOLAR ENERGY STORAGE SOLUTIONS
    6.3 IMPACT OF MEGATRENDS 
           6.3.1 3D PRINTING
           6.3.2 SPACE-BASED RESOURCE UTILIZATION
           6.3.3 IN-SPACE MANUFACTURING
    6.4 INFRASTRUCTURE OVERVIEW 
           6.4.1 SATELLITE SUBSYSTEMS
                    6.4.1.1 Solar panel arrays
                    6.4.1.2 Power amplification
                    6.4.1.3 Power transmission
           6.4.2 GROUND STATION SUBSYSTEMS
                    6.4.2.1 Power conversion
                    6.4.2.2 Power storage
                    6.4.2.3 Mission control systems
 
7 SPACE-BASED SOLAR POWER MARKET, BY BEAM TYPE (Page No. - 63)
    7.1 INTRODUCTION 
           FIGURE 25 SPACE-BASED SOLAR POWER MARKET, BY BEAM TYPE, 2030–2040 (USD MILLION)
           TABLE 11 SPACE-BASED SOLAR POWER MARKET, BY BEAM TYPE, 2030–2040 (USD MILLION)
    7.2 MICROWAVE POWER TRANSMISSION 
           7.2.1 HIGH-SCALE TRANSMISSION AND SCALABILITY TO DRIVE MARKET
    7.3 LASER BEAM POWER TRANSMISSION 
           7.3.1 LOW INITIAL INVESTMENT TO DRIVE MARKET
 
8 SPACE-BASED SOLAR POWER MARKET, BY APPLICATION (Page No. - 66)
    8.1 INTRODUCTION 
    8.2 TERRESTRIAL 
           8.2.1 GROWING DEMAND FOR CLEAN ENERGY SOLUTIONS TO DRIVE MARKET
    8.3 SPACE 
           8.3.1 INCREASING NEED FOR COST-EFFECTIVE SPACE POWER SOLUTIONS TO DRIVE MARKET
 
9 SPACE-BASED SOLAR POWER MARKET, BY END USER (Page No. - 69)
    9.1 INTRODUCTION 
           FIGURE 26 SPACE-BASED SOLAR POWER MARKET, BY END USER, 2030–2040 (USD MILLION)
           TABLE 12 SPACE-BASED SOLAR POWER MARKET, BY END USER, 2030–2040 (USD MILLION)
    9.2 GOVERNMENT AND DEFENSE 
           9.2.1 RISING MILITARIZATION OF SPACE-BASED SOLAR POWER TO DRIVE MARKET
    9.3 COMMERCIAL 
           9.3.1 MINING, TOURISM, AND AGRICULTURE APPLICATIONS TO DRIVE MARKET
 
10 SPACE-BASED SOLAR POWER MARKET, BY REGION (Page No. - 72)
     10.1 INTRODUCTION 
             FIGURE 27 SPACE-BASED SOLAR POWER MARKET, BY REGION, 2030–2040
     10.2 REGIONAL RECESSION IMPACT ANALYSIS 
             TABLE 13 SPACE-BASED SOLAR POWER MARKET, BY REGION, 2030–2040 (USD MILLION)
     10.3 NORTH AMERICA 
             10.3.1 NORTH AMERICA: PESTLE ANALYSIS
             10.3.2 NORTH AMERICA: RECESSION IMPACT ANALYSIS
                        FIGURE 28 NORTH AMERICA: SPACE-BASED SOLAR POWER MARKET SNAPSHOT
                        TABLE 14 NORTH AMERICA: SPACE-BASED SOLAR POWER MARKET, BY BEAM TYPE, 2030–2040 (USD MILLION)
                        TABLE 15 NORTH AMERICA: SPACE-BASED SOLAR POWER MARKET, BY END USER, 2030–2040 (USD MILLION)
             10.3.3 US
                        10.3.3.1 Diversified investments in space-based solar power projects to drive market
     10.4 EUROPE 
             10.4.1 EUROPE: PESTLE ANALYSIS
             10.4.2 EUROPE: RECESSION IMPACT ANALYSIS
                        FIGURE 29 EUROPE: SPACE-BASED SOLAR POWER MARKET SNAPSHOT
                        TABLE 16 EUROPE: SPACE-BASED SOLAR POWER MARKET, BY BEAM TYPE, 2030–2040 (USD MILLION)
                        TABLE 17 EUROPE: SPACE-BASED SOLAR POWER MARKET, BY END USER, 2030–2040 (USD MILLION)
             10.4.3 UK
                        10.4.3.1 Space Energy Initiative to drive market
     10.5 ASIA PACIFIC 
             10.5.1 ASIA PACIFIC: PESTLE ANALYSIS
             10.5.2 ASIA PACIFIC: RECESSION IMPACT ANALYSIS
                        FIGURE 30 ASIA PACIFIC: SPACE-BASED SOLAR POWER MARKET SNAPSHOT
                        TABLE 18 ASIA PACIFIC: SPACE-BASED SOLAR POWER MARKET, BY BEAM TYPE, 2030–2040 (USD MILLION)
                        TABLE 19 ASIA PACIFIC: SPACE-BASED SOLAR POWER MARKET, BY END USER, 2030–2040 (USD MILLION)
             10.5.3 CHINA
                        10.5.3.1 Increasing government initiatives and funding to drive market
             10.5.4 JAPAN
                        10.5.4.1 Growing initiatives from Japan Aerospace Exploration Agency to drive market
 
11 COMPETITIVE LANDSCAPE (Page No. - 85)
     11.1 INTRODUCTION 
     11.2 STRATEGIES OF KEY PLAYERS 
             TABLE 20 STRATEGIES OF KEY PLAYERS
     11.3 MARKET RANKING ANALYSIS 
             FIGURE 31 MARKET RANKING ANALYSIS, 2022
     11.4 COMPANY EVALUATION MATRIX 
             11.4.1 STARS
             11.4.2 EMERGING LEADERS
             11.4.3 PERVASIVE PLAYERS
             11.4.4 PARTICIPANTS
                        FIGURE 32 SPACE-BASED SOLAR POWER MARKET: COMPANY EVALUATION MATRIX, 2022
             11.4.5 COMPANY FOOTPRINT
                        TABLE 21 SPACE-BASED SOLAR POWER MARKET: COMPANY FOOTPRINT
                        TABLE 22 SPACE-BASED SOLAR POWER MARKET: BEAM TYPE FOOTPRINT
                        TABLE 23 SPACE-BASED SOLAR POWER MARKET: END USER FOOTPRINT
                        TABLE 24 SPACE-BASED SOLAR POWER MARKET: REGION FOOTPRINT
     11.5 COMPETITIVE SCENARIO 
             11.5.1 PRODUCT LAUNCHES
                        TABLE 25 SPACE-BASED SOLAR POWER MARKET: PRODUCT LAUNCHES, JUNE 2023
             11.5.2 DEALS
                        TABLE 26 SPACE-BASED SOLAR POWER MARKET: DEALS, OCTOBER 2022–OCTOBER 2023
 
12 COMPANY PROFILES (Page No. - 95)
(Business overview, Products/Services/Solutions offered, Recent Developments, MNM view)*  
     12.1 INTRODUCTION 
     12.2 KEY PLAYERS 
             12.2.1 AIRBUS
                        TABLE 27 AIRBUS: COMPANY OVERVIEW
                        FIGURE 33 AIRBUS: COMPANY SNAPSHOT
                        TABLE 28 AIRBUS: PRODUCTS/SOLUTIONS/SERVICES OFFERED
                        TABLE 29 AIRBUS: PRODUCT LAUNCHES
                        TABLE 30 AIRBUS: OTHER DEVELOPMENTS
             12.2.2 NORTHROP GRUMMAN
                        TABLE 31 NORTHROP GRUMMAN: COMPANY OVERVIEW
                        FIGURE 34 NORTHROP GRUMMAN: COMPANY SNAPSHOT
                        TABLE 32 NORTHROP GRUMMAN: PRODUCTS/SOLUTIONS/SERVICES OFFERED
                        TABLE 33 NORTHROP GRUMMAN: OTHER DEVELOPMENTS
             12.2.3 OHB SE
                        TABLE 34 OHB SE: COMPANY OVERVIEW
                        FIGURE 35 OHB SE: COMPANY SNAPSHOT
                        TABLE 35 OHB SE: PRODUCTS/SOLUTIONS/SERVICES OFFERED
             12.2.4 THALES ALENIA SPACE
                        TABLE 36 THALES ALENIA SPACE: COMPANY OVERVIEW
                        FIGURE 36 THALES ALENIA SPACE: COMPANY SNAPSHOT
                        TABLE 37 THALES ALENIA SPACE: PRODUCTS/SOLUTIONS/SERVICES OFFERED
                        TABLE 38 THALES ALENIA SPACE: DEALS
                        TABLE 39 THALES ALENIA SPACE: OTHER DEVELOPMENTS
             12.2.5 BOEING
                        TABLE 40 BOEING: COMPANY OVERVIEW
                        FIGURE 37 BOEING: COMPANY SNAPSHOT
                        TABLE 41 BOEING: PRODUCTS/SOLUTIONS/SERVICES OFFERED
             12.2.6 EMROD
                        TABLE 42 EMROD: COMPANY OVERVIEW
                        TABLE 43 EMROD: PRODUCTS/SOLUTIONS/SERVICES OFFERED
                        TABLE 44 EMROD: DEALS
                        TABLE 45 EMROD: OTHER DEVELOPMENTS
     12.3 OTHER PLAYERS 
             12.3.1 AIRBORNE
                        TABLE 46 AIRBORNE: COMPANY OVERVIEW
             12.3.2 SPACETECH GMBH
                        TABLE 47 SPACETECH GMBH: COMPANY OVERVIEW
             12.3.3 VIRTUS SOLIS
                        TABLE 48 VIRTUS SOLIS: COMPANY OVERVIEW
             12.3.4 AZUR SPACE SOLAR POWER GMBH
                        TABLE 49 AZUR SPACE SOLAR POWER GMBH: COMPANY OVERVIEW
             12.3.5 CESI S.P.A.
                        TABLE 50 CESI S.P.A.: COMPANY OVERVIEW
             12.3.6 CELESTIA ENERGY
                        TABLE 51 CELESTIA ENERGY: COMPANY OVERVIEW
             12.3.7 SIRIN ORBITAL SYSTEMS AG
                        TABLE 52 SIRIN ORBITAL SYSTEMS AG: COMPANY OVERVIEW
             12.3.8 OVERVIEW ENERGY
                        TABLE 53 OVERVIEW ENERGY: COMPANY OVERVIEW
             12.3.9 SPACE SOLAR
                        TABLE 54 SPACE SOLAR: COMPANY OVERVIEW
             12.3.10 SOLAR SPACE TECHNOLOGIES
                        TABLE 55 SOLAR SPACE TECHNOLOGIES: COMPANY OVERVIEW
             12.3.11 METASAT UK
                        TABLE 56 METASAT UK: COMPANY OVERVIEW
             12.3.12 PHOTONICITY PTE. LTD.
                        TABLE 57 PHOTONICITY PTE. LTD.: COMPANY OVERVIEW
             12.3.13 SATELLITE APPLICATIONS CATAPULT LIMITED
                        TABLE 58 SATELLITE APPLICATIONS CATAPULT LIMITED: COMPANY OVERVIEW
             12.3.14 SOLAREN CORPORATION
                        TABLE 59 SOLAREN CORPORATION: COMPANY OVERVIEW
             12.3.15 POWERLIGHT TECHNOLOGIES
                        TABLE 60 POWERLIGHT TECHNOLOGIES: COMPANY OVERVIEW
             12.3.16 FRALOCK LLC
                        TABLE 61 FRALOCK LLC: COMPANY OVERVIEW
*Details on Business overview, Products/Services/Solutions offered, Recent Developments, MNM view might not be captured in case of unlisted companies.  
 
13 APPENDIX (Page No. - 120)
     13.1 DISCUSSION GUIDE 
     13.2 KNOWLEDGESTORE: MARKETSANDMARKETS’ SUBSCRIPTION PORTAL 
     13.3 CUSTOMIZATION OPTIONS 
     13.4 RELATED REPORTS 
     13.5 AUTHOR DETAILS 


The research study conducted on the Space-Based Solar Power market involved extensive use of secondary sources, directories, and databases, such as D&B Hoovers, Bloomberg Businessweek, and Factiva, to identify and collect information relevant to the market. Publications of the International Energy Agency, American Oil & Gas Reporter, and Global Firepower, DNV GL are also considered in these secondary sources. Primary sources included industry experts from the market as well as suppliers, manufacturers, solution providers, technology developers, alliances, and organizations related to all segments of the industry’s value chain. In-dep.th interviews of various primary respondents, including key industry participants, subject matter experts (SMEs), industry consultants, and C-level executives, were conducted to obtain and verify critical qualitative and quantitative information about the market as well as to assess the growth prospects of the market.

Secondary Research

The market share for companies was determined based on secondary data made available through paid and unpaid sources and analysis of product portfolios of major companies and then rating them based on performance and quality. These data points were further validated by primary sources.

Secondary sources that were referred to for this research study included financial statements of companies with on-site hydrogen production, storage and conversion facilities and information from various trade, business, and professional associations, among others. The secondary data was collected and analyzed to arrive at the overall size of the Space-Based Solar Power market, which was validated by primary respondents.

Primary Research

Extensive primary research was conducted after obtaining information about the current scenario of the Space-Based Solar Power market through secondary research. Several primary interviews were conducted with market experts from the demand and supply sides across North America, Europe, and Asia Pacific, to obtain qualitative and quantitative information on the market. This primary data was collected through questionnaires, emails, and telephonic interviews. Primary sources from the supply side included various industry experts, such as vice presidents, directors, regional managers, technology providers, product development teams, distributors, and end users.

Space-Based Solar Power Market
 Size, and Share

To know about the assumptions considered for the study, download the pdf brochure

Market Size Estimation

  • Both top-down and bottom-up approaches were used to estimate and validate the size of the Space-Based Solar Power market.
  • Key players were identified through secondary research, and their market ranking was determined through primary and secondary research. This included a study of annual and financial reports of the top market players and extensive interviews of leaders, including CEOs, directors, and marketing executives.
  • All percentage shares, splits, and breakdowns were determined using secondary sources and verified through primary sources. All possible parameters that affect the markets covered in this research study were accounted for, viewed in extensive detail, verified through primary research, and analyzed to obtain the final quantitative and qualitative data. This data was consolidated, enhanced with detailed inputs, analyzed by MarketsandMarkets, and presented in this report.

Market size estimation methodology: Bottom-up Approach

Space-Based Solar Power Market
 Size, and Bottom-up Approach

Market size estimation methodology: Top-down Approach

Space-Based Solar Power Market
 Size, and Top-down Approach

Data triangulation

After arriving at the overall size from the market size estimation process explained above, the total market was split into several segments and subsegments. The data triangulation and market breakdown procedures explained below were implemented, wherever applicable, to complete the overall market engineering process and arrive at the exact statistics for various market segments and subsegments. The data was triangulated by studying various factors and trends from both the demand and supply sides. Along with this, the market size was validated using both top-down and bottom-up approaches.

Market Definition

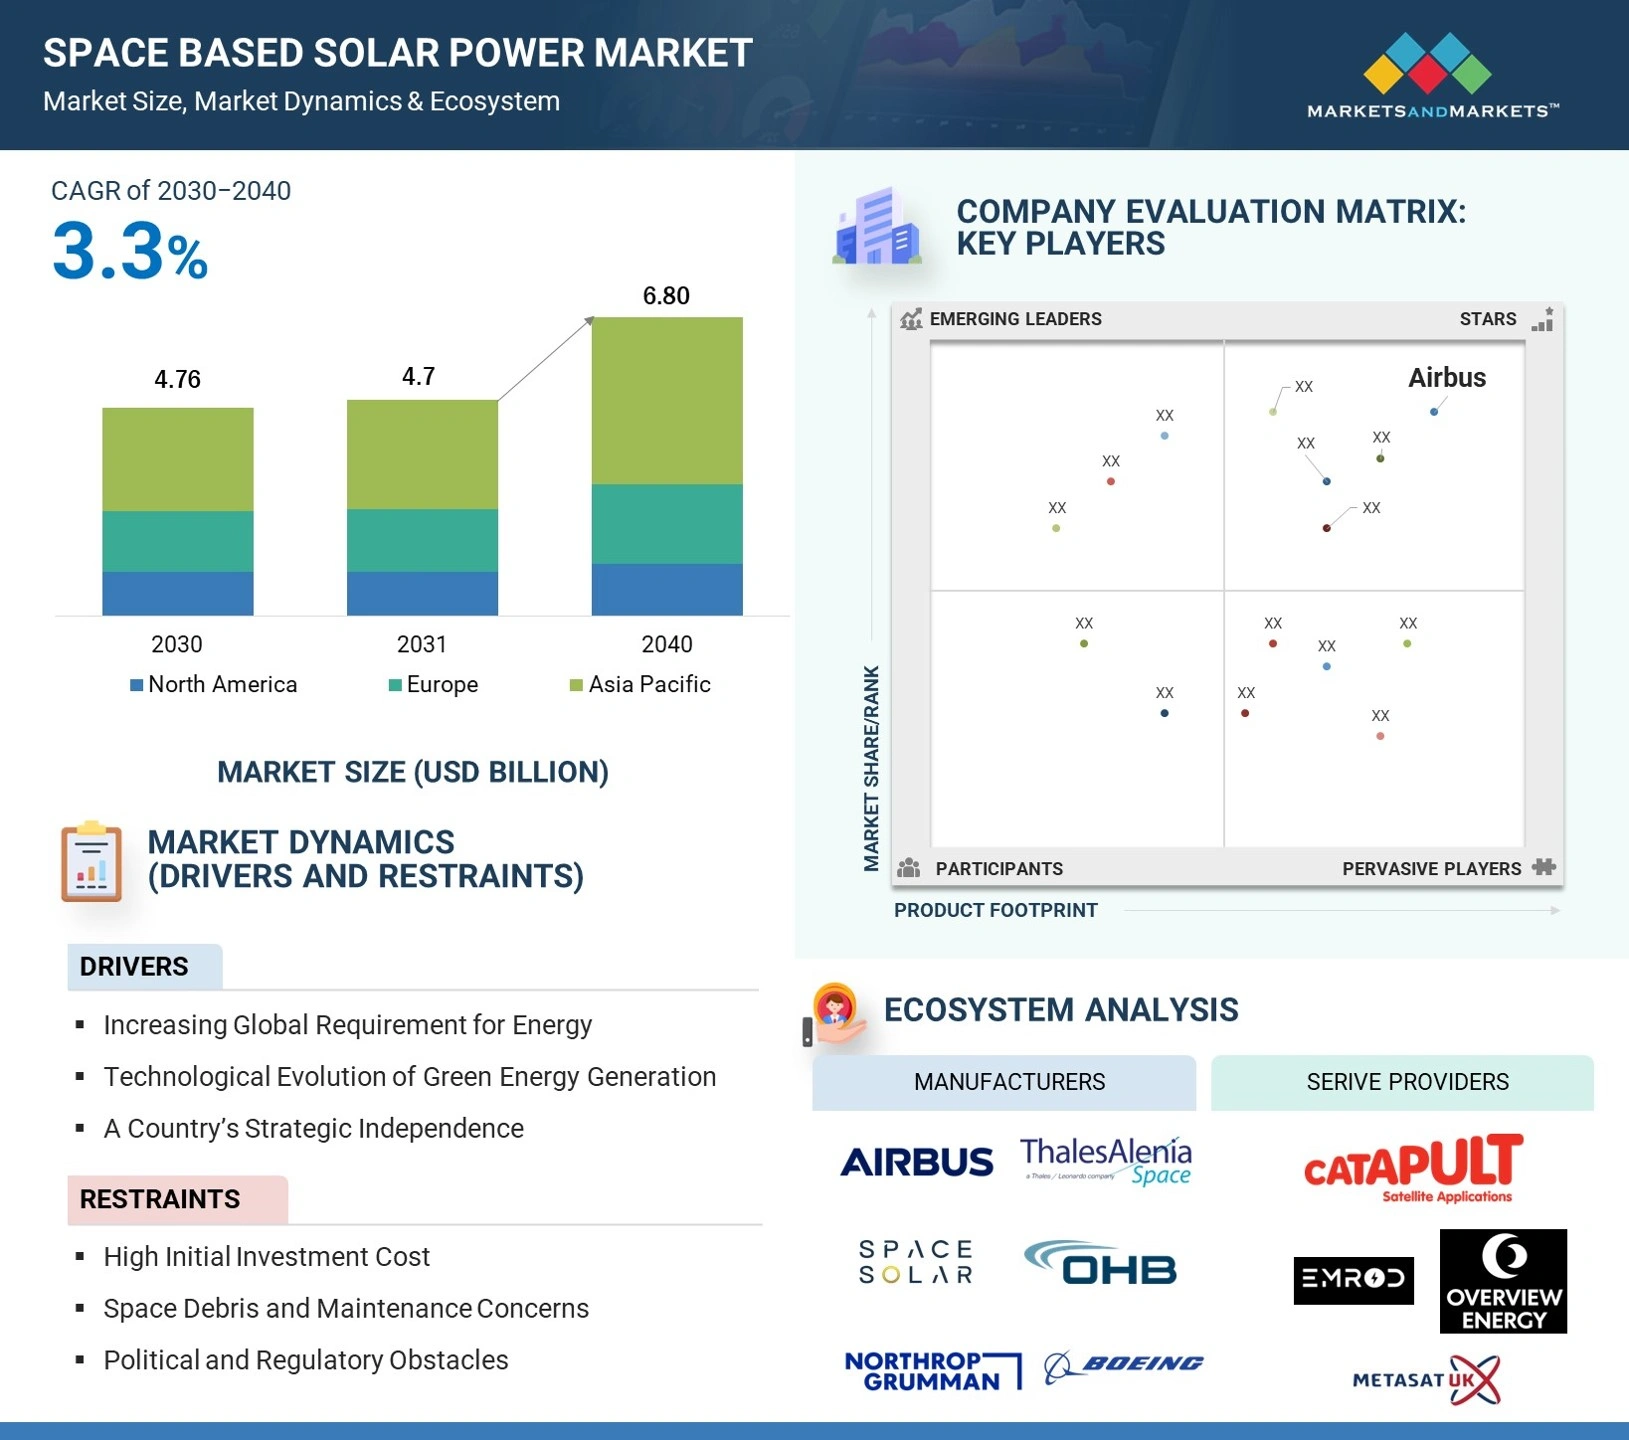
A Space-based solar power system is an energy collection, transmission and distribution hardware that uses satellites as well as ground infrastructure to focus solar radiation energy from the sun using special mirrors and direct the energy to terrestrial rectifying antennas (rectennas) via microwave and laser beams. The received energy can then be used for electricity and power generation for terrestrial uses. The key end users include government, defense and commercial entities that will utilize the novel technique as an alternative to traditional solar energy-based power generation. The technique offers specific advantages over traditional solar panel technologies including day and night operations and higher conversion efficiencies.

Stakeholders

Various stakeholders of the market are listed below:

  • Government Authorities
  • Regulatory Bodies
  • R&D Companies
  • Defense Organizations
  • Subsystem Manufacturers
  • Energy Providers and Utilities
  • Environmental Groups and Policymakers
  • Investors and Financial Institutions
  • Commercial Space Companies

Report Objectives

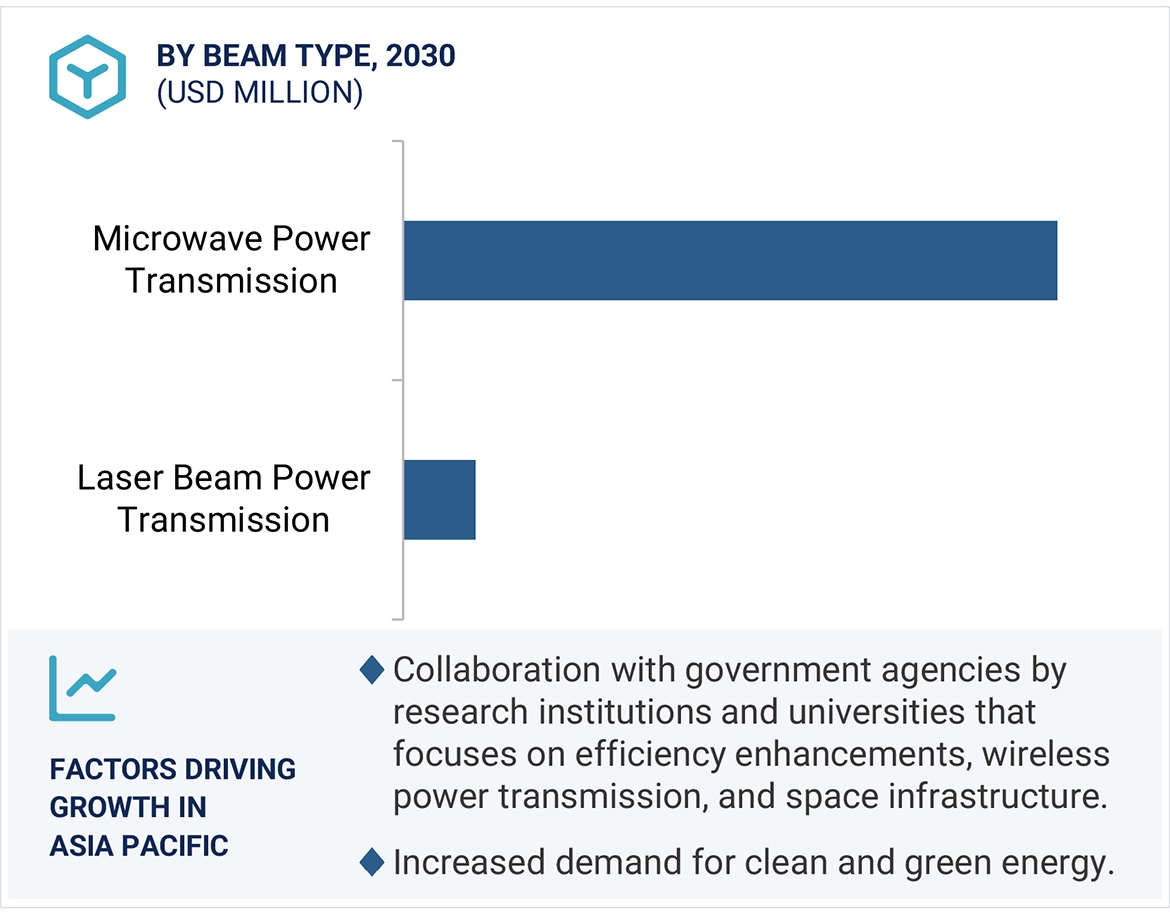
  • To define, describe, and forecast the size of the Space-Based Solar Power market based on beam type, application, end-user, and region from 2030 to 2040.
  • To forecast the size of market segments with respect to major regions, namely North America, Europe, and Asia Pacific
  • To identify and analyze key drivers, restraints, opportunities, and challenges influencing market growth.
  • To analyze opportunities for stakeholders in the market by identifying key market trends
  • To strategically analyze micromarkets1 with respect to individual growth trends, prospects, and their contribution to the global market
  • To analyze competitive developments such as contracts, acquisitions, agreements, and partnerships, product launches, and research and development (R&D) activities in the Space-Based Solar Power market.
  • To provide a detailed competitive landscape of the market, as well as an analysis of business and corporate strategies adopted by leading market players.
  • To strategically profile key market players and comprehensively analyze their core competencies2.

1. Micromarkets are defined as further segments and subsegments of the space-based solar power market included in the report. 

2.Core competencies of the companies have been captured in terms of their key developments, SWOT analysis, and key strategies adopted by them to sustain their position in the market.

Available customizations

Along with the market data, MarketsandMarkets offers customizations as per the specific needs of companies. The following customization options are available for the report:

Product Analysis

  • Product matrix, which gives a detailed comparison of the product portfolio of each company.

Regional Analysis

  • Further breakdown of the market segments at the regional level

Company Information

  • Detailed analysis and profiling of additional market players (up to 5)
Custom Market Research Services

We will customize the research for you, in case the report listed above does not meet with your exact requirements. Our custom research will comprehensively cover the business information you require to help you arrive at strategic and profitable business decisions.

Request Customization
Report Code
AS 8953
Published ON
Feb, 2024
Choose License Type
BUY NOW
  • SHARE
X
Request Customization
Speak to Analyst
Speak to Analyst
OR FACE-TO-FACE MEETING
PERSONALIZE THIS RESEARCH
  • Triangulate with your Own Data
  • Get Data as per your Format and Definition
  • Gain a Deeper Dive on a Specific Application, Geography, Customer or Competitor
  • Any level of Personalization
REQUEST A FREE CUSTOMIZATION
LET US HELP YOU!
  • What are the Known and Unknown Adjacencies Impacting the Space-Based Solar Power Market
  • What will your New Revenue Sources be?
  • Who will be your Top Customer; what will make them switch?
  • Defend your Market Share or Win Competitors
  • Get a Scorecard for Target Partners
CUSTOMIZED WORKSHOP REQUEST
+1-888-600-6441
  • Call Us
  • +1-888-600-6441 (Corporate office hours)
  • +1-888-600-6441 (US/Can toll free)
  • +44-800-368-9399 (UK office hours)
CONNECT WITH US
ABOUT TRUST ONLINE
©2024 MarketsandMarkets Research Private Ltd. All rights reserved
DMCA.com Protection Status Website Feedback