Space Debris Removal Market

Space Debris Removal Market by Technique (Direct Debris Removal, Indirect Debris Removal), Orbit (LEO, MEO, GEO), Debris Size (1mm to 10mm, 10mm to 100mm, Greater than 100mm), End User, Operation and Region - Global Forecast to 2028

Report Code: AS 8865 Nov, 2023, by marketsandmarkets.com

[170 Pages Report] The Space Debris Removal Market size is projected to grow from USD 0.1 billion in 2023 to USD 0.6 billion by 2028, growing at a CAGR of 41.7% from 2023 to 2028.

Space Debris Removal Market

Space Debris Removal Market

Space Debris Removal Market Forecast to 2028

To know about the assumptions considered for the study, Request for Free Sample Report

Space Debris Removal Market Dynamics

Driver: Growing government initiatives

Government initiatives are instrumental in propelling the growth of the space debris removal market. The increasing menace of space debris to operational satellites and spacecraft has prompted governments worldwide to acknowledge the urgency of tackling this challenge. Consequently, they are actively providing financial support and policy frameworks to facilitate space debris removal projects, thereby creating a conducive environment for industry expansion. Government support manifests through substantial investments in research and development, innovative debris removal technologies, and the execution of removal missions. Simultaneously, regulatory frameworks are being established to streamline the coordination of space debris removal endeavors, both domestically and on an international scale. This governmental endorsement not only stimulates innovation but also lends credibility and legitimacy to the industry, encouraging private-sector enterprises to invest in and develop commercial space debris removal solutions. This collaborative approach between the public and private sectors fosters growth and innovation, reinforcing the space debris removal market's potential for expansion and establishing it as a promising sector within the space industry. In September 2022, the UK Space Agency disclosed the allocation of two Phase B demonstration contracts for active debris removal (ADR) to ClearSpace and Astroscale. The awarded contracts hold a value of £2.25 million ($2.4 million) for ClearSpace and £1.7 million ($1.8 million) for Astroscale.

Restraints: The absence of established regulatory standards for space debris removal

The absence of well-defined regulations is a significant challenge for the space debris removal market. Currently, the rules governing space activities are a complex mix of international agreements and national laws. This lack of clear and specific regulations tailored to space debris removal creates uncertainty, hindering market growth. One pressing issue is the lack of clarity regarding liability. When space debris is removed, there is a risk of unintentional damage or consequences. Determining who is responsible and accountable for such events, as well as the dispute resolution process, remains uncertain. This legal ambiguity discourages both private and public entities from investing in space debris removal projects as they seek legal clarity about their actions. Additionally, the absence of a unified regulatory framework hinders international cooperation. Effective collaboration in space debris removal requires shared guidelines and standards. Without such a framework, coordinating removal missions between different countries and organizations becomes less efficient.

Opportunities: Opportunity for robotic Service Providers in the space debris removal market

The space debris removal market presents a valuable opportunity for companies that specialize in robotics systems. These systems play a crucial role in capturing and managing space debris during removal missions. Robotics providers can develop and offer advanced solutions, such as robotic arms, autonomous navigation, and artificial intelligence algorithms, designed to enhance the efficiency and precision of debris removal operations.

Space is a challenging environment with unique conditions, and robotic systems must perform reliably in remote and harsh circumstances. Robotics system providers have the chance to adapt and create technologies tailored to the specific demands of space debris removal. Moreover, the space debris removal market encourages innovation in robotics, providing a platform for companies to develop cutting-edge systems. As the market expands, it opens doors for potential collaborations with space agencies, commercial space ventures, and international organizations.

Challenges: Lack of debris data management a challenge for space industry

A significant obstacle in the space debris removal market is the accurate tracking and data management of space debris. Dealing with the vast and ever-changing population of objects in space presents a complex challenge for industry players, space agencies, and governments. First, it's crucial to precisely identify and track space debris for effective removal efforts. This means knowing exactly where each piece of debris is, where it's headed, and what it's like. However, given the large number of debris pieces, each with its own size and shape, this task is quite formidable. Second, having complete and up-to-date data on all space debris is an ongoing challenge. Many small and hard-to-track objects often go unrecorded, leaving gaps in our knowledge about the debris situation. Accurate data is vital for assessing collision risks and deciding which debris to remove first. Third, sharing debris data and coordinating with other countries can be complicated due to security and national interests. Collaborative efforts require openness and information exchange, which can be hampered by political and strategic concerns. As of July 2023, there are over 128 million pieces of debris smaller than 1 cm, and approximately 800,000 pieces between 1 and 10 cm. Apart from this there are millions of tiny debris pieces which can not be tracked generally smaller than 1mm and can cause damage to satellites.

Space Debris Removal Market by Ecosystem

Based on the technique, the direct debris removal segment is estimated to lead the space debris removal market in 2023

Based on the technique, the space debris removal market has been segmented broadly into direct debris removal and indirect debris removal. Here direct debris removal is leading this segment in 2023. The surge in space debris threats is propelling the demand for direct debris removal techniques. Satellite collisions pose significant risks to operational spacecraft and satellite constellations, urging the need for active removal solutions. As the number of satellites increases, mitigating collision risks becomes critical. These techniques, designed for precise debris capture, cater to the pressing need for proactive measures, ensuring a safer orbital environment and safeguarding valuable space assets.

Based on the orbit, LEO segment is estimated to lead the space debris removal market in 2023.

Based on orbit, the space debris removal market has been segmented into LEO, MEO and GEO. LEO orbit is expected to lead the market in 2023. Increasing satellite constellations and commercial activity in Low Earth Orbit (LEO) are boosting the demand for space debris removal. With more satellites in LEO, the risk of collisions with debris rises. Protecting these valuable assets is crucial, driving the need for precise debris removal methods tailored to LEO. Developing effective technologies for this orbit is vital to safeguard operational satellites and ensure the reliability of LEO-based services. This heightened demand arises from the urgency to maintain satellite functionality and secure the long-term sustainability of LEO activities.

Based on the end user, the government segment dominates the market & is projected to witness the largest share in 2023.

Based on the end user, the space debris removal market has been segmented into Commercial and Government. The government sector seems to dominate the market in 2023. The government end user segment in space debris removal is driven by the imperative to secure national and strategic interests in space. Governments worldwide rely on satellites for defense, communication, and surveillance purposes. Protecting these critical assets from potential collisions with space debris is paramount for national security and continuity of services. Governments invest in advanced space debris removal technologies to mitigate risks, ensuring the resilience of their satellite constellations and preserving their capabilities in space. Safeguarding these assets aligns with governmental agendas aimed at ensuring uninterrupted operations and maintaining a competitive edge in the global space arena.

Based on the operation, single technique to dominate this segment and is estimated to account for the larger share of the space debris removal market in 2023

Based on the operation, the space debris removal market has been segmented into single technique and multiple technique. The single technique segment to dominate the space debris removal market in 2023. The upsurge in satellite launches has propelled the demand for specialized single technique operations in space debris removal. Single technique operations, like using harpoons, nets, or robotic arms, offer focused and efficient methods to capture and remove debris. Also deorbiting systems like drag sail dispose of the satellites after end of its mission. With an increasing amount of debris threatening operational satellites, there's a pressing need for targeted solutions. These specialized techniques cater to the urgency for precise and reliable debris removal, ensuring the safety and sustainability of space activities.

Space Debris Removal Market by Region

Space Debris Removal Market by Region

To know about the assumptions considered for the study, download the pdf brochure

The European market is projected to have the largest share in 2023 in the space debris removal market

Based on region, the space debris removal market has been segmented into North America, Europe, Asia Pacific and Rest of the World (RoW). Europe region seems to dominate the market in 2023. The European region's drive for space debris removal stems from its robust space industry and commitment to sustainability. With prominent space agencies and leading aerospace technology, Europe faces the challenge of safeguarding its space assets. The region's increasing reliance on satellites for navigation, communication, and scientific endeavors accentuates the need to mitigate space debris threats. Europe's emphasis on sustainable space practices aligns with its vision for secure and uninterrupted satellite operations. This impetus propels the development of advanced debris removal technologies, positioning Europe at the forefront of mitigating risks and ensuring the longevity of its space-based activities.

Key Market Players

The space debris removal companies is dominated by a few globally established players such as Astroscale (Japan), ClearSpace (Switzerland), Surrey Satellite Technology Ltd (UK), Northrop Grumman (US), Kall Morris Incorporated (US), among others, are the key players that secured space debris removal contracts in the last few years. The primary focus was given to the contracts and new product development due to the upcoming government regulations about space sustainability across the world.

Get online access to the report on the World's First Market Intelligence Cloud

  • Easy to Download Historical Data & Forecast Numbers
  • Company Analysis Dashboard for high growth potential opportunities
  • Research Analyst Access for customization & queries
  • Competitor Analysis with Interactive dashboard
  • Latest News, Updates & Trend analysis
Request Sample

Scope of the Report

Report Metric

Details

Estimated Value
USD 0.1 billion in 2023
Projected Value USD 0.6 billion by 2028
Growth Rate CAGR of 41.7% 

Market size available for years

2020–2028

Base year considered

2022

Forecast period

2023-2028

Forecast units

Value (USD Million/Billion)

Segments Covered

By debris size, by orbit, by technique, by operation, by end user, and by region

Geographies covered

North America, Europe, Asia Pacific, Rest of the world

Companies covered

Astroscale (Japan), ClearSpace (Switzerland), Surrey Satellite Technology Ltd (UK), Northrop Grumman (US), and Kall Morris Incorporated (US) are some of the major players in the space debris removal market. (25 Companies)

Space Debris Removal Market Highlights

The study categorizes the space debris removal market based on debris size, orbit, operation, technique, end user, and region.

Segment

Subsegment

By Debris Size

  • 1mm to 10mm
  • 10mm to 100mm
  • Greater than 100mm

By Orbit

  • LEO
  • MEO
  • GEO

By Operation

  • Single Technique
  • Multiple Techniques

By Technique

  • Direct Debris Removal
    • Robotic Arms
    • Harpoons and Nets
    • Other Direct Debris Removal Techniques
  • Indirect Debris Removal
    • Drag Sail
    • Electrodynamic Tether
    • Other Indirect Debris Removal Techniques

By End User

  • Commercial
  • Government

By Region

  • North America
  • Europe
  • Asia Pacific
  • Rest of the world

Recent Developments

  • In October 2023, Astroscale Japan has been selected by Japan Ministry of Education, Culture, Sports, Science and Technology (“MEXT”) to inspect and remove a non-operational satellite. It consists of 3 phases of which the first phase is to send a spacecraft and monitor and track the debris for which it has granted 18 million. The total value of the contract is USD 80 million.
  • In August 2023, Trans Astronautica Corporation. announced that it has received a contract from NASA to build an develop an orbital debris removal capture bag. Under this Trans Astronautica Corporation. will build and demonstrate the product.
  • In September 2022, the UK Space Agency granted ClearSpace a significant contract for the design phase of the CLEAR Mission. ClearSpace has secured a contract worth £2.2 million from the UKSA to proceed to the next mission phase. This design phase, scheduled until October 2023, will culminate in a preliminary design review, assessing design progress and the technical suitability of the proposed mission.
  • In September 2022, Kall Morris Incorporated a leading firm in orbital debris research and solution development, has secured three research contracts totaling $750,000 from the United States Space Force (USSF) through the Air Force Research Laboratory (AFRL). These contracts, part of the USSF SpaceWERX Small Business Technology Transfer (STTR) Phase I projects, align with the Orbital Prime initiative, focusing on the emerging market of In-space Servicing, Assembly, and Manufacturing (ISAM).

Frequently Asked Questions (FAQs) Addressed by the Report:

To speak to our analyst for a discussion on the above findings, click Speak to Analyst

TABLE OF CONTENTS
 
1 INTRODUCTION (Page No. - 22)
    1.1 STUDY OBJECTIVES 
    1.2 MARKET DEFINITION 
    1.3 STUDY SCOPE 
           1.3.1 MARKETS COVERED
                    FIGURE 1 SPACE DEBRIS REMOVAL MARKET SEGMENTATION
           1.3.2 REGIONAL SCOPE
    1.4 YEARS CONSIDERED 
    1.5 INCLUSIONS AND EXCLUSIONS 
           TABLE 1 INCLUSIONS AND EXCLUSIONS IN SPACE DEBRIS REMOVAL MARKET
    1.6 CURRENCY & PRICING 
           TABLE 2 USD EXCHANGE RATES
    1.7 STAKEHOLDERS 
 
2 RESEARCH METHODOLOGY (Page No. - 26)
    2.1 RESEARCH DATA 
           FIGURE 2 RESEARCH PROCESS FLOW
           FIGURE 3 RESEARCH DESIGN
           2.1.1 SECONDARY DATA
                    2.1.1.1 Secondary sources
           2.1.2 PRIMARY DATA
                    2.1.2.1 Primary sources
                    2.1.2.2 Key data from primary sources
                               FIGURE 4 BREAKDOWN OF PRIMARY INTERVIEWS
    2.2 FACTOR ANALYSIS 
           2.2.1 INTRODUCTION
           2.2.2 DEMAND-SIDE INDICATORS
           2.2.3 SUPPLY-SIDE INDICATORS
    2.3 RECESSION IMPACT ANALYSIS 
    2.4 MARKET SIZE ESTIMATION 
           2.4.1 BOTTOM-UP APPROACH
                    2.4.1.1 Market size estimation and methodology
                               FIGURE 5 BOTTOM-UP APPROACH
           2.4.2 TOP-DOWN APPROACH
                    FIGURE 6 TOP-DOWN APPROACH
    2.5 DATA TRIANGULATION 
           FIGURE 7 DATA TRIANGULATION
    2.6 RESEARCH ASSUMPTIONS 
    2.7 RESEARCH LIMITATIONS 
    2.8 RISK ANALYSIS 
 
3 EXECUTIVE SUMMARY (Page No. - 36)
    FIGURE 8 DIRECT DEBRIS REMOVAL TECHNIQUE TO ACCOUNT FOR DOMINANT MARKET SHARE DURING FORECAST PERIOD
    FIGURE 9 SINGLE TECHNIQUE OPERATION SEGMENT TO ACCOUNT FOR LARGER SHARE OF MARKET DURING FORECAST PERIOD
    FIGURE 10 GOVERNMENT END USER SEGMENT TO ACCOUNT FOR LARGER MARKET SHARE DURING FORECAST PERIOD
    FIGURE 11 LEO ORBIT SEGMENT TO CAPTURE LARGEST SHARE OF SPACE DEBRIS REMOVAL MARKET DURING FORECAST PERIOD
    FIGURE 12 SPACE DEBRIS REMOVAL MARKET IN NORTH AMERICA TO GROW AT HIGHEST CAGR DURING FORECAST PERIOD
 
4 PREMIUM INSIGHTS (Page No. - 40)
    4.1 ATTRACTIVE GROWTH OPPORTUNITIES FOR PLAYERS IN SPACE DEBRIS REMOVAL MARKET 
           FIGURE 13 INCREASE IN DEMAND FOR SPACE SUSTAINABILITY AND GROWING DEBRIS DENSITY TO DRIVE MARKET
    4.2 SPACE DEBRIS REMOVAL MARKET, BY ORBIT 
           FIGURE 14 LEO ORBIT SEGMENT TO DOMINATE MARKET IN 2023
    4.3 SPACE DEBRIS REMOVAL MARKET, BY END USER 
           FIGURE 15 GOVERNMENT END USER SEGMENT TO HAVE HIGHER MARKET SHARE FROM 2023 TO 2028
 
5 MARKET OVERVIEW (Page No. - 42)
    5.1 INTRODUCTION 
    5.2 MARKET DYNAMICS 
           FIGURE 16 DRIVERS, RESTRAINTS, OPPORTUNITIES, AND CHALLENGES IN SPACE DEBRIS REMOVAL MARKET
           5.2.1 DRIVERS
                    5.2.1.1 Growing government initiatives related to debris removal technologies
                    5.2.1.2 Rise in satellite launches and increasing space junk
                               FIGURE 17 SATELLITE LAUNCHES AND SPACE JUNK ANALYSIS
           5.2.2 RESTRAINTS
                    5.2.2.1 High cost and funding requirement
                    5.2.2.2 Absence of established regulatory standards for space debris removal
           5.2.3 OPPORTUNITIES
                    5.2.3.1 Robotic systems to capture and manage space debris
           5.2.4 CHALLENGES
                    5.2.4.1 Lack of debris data management
                    5.2.4.2 Risk mitigation during debris removal operations
    5.3 RECESSION IMPACT ANALYSIS 
           FIGURE 18 RECESSION IMPACT ANALYSIS
    5.4 VALUE CHAIN ANALYSIS 
           FIGURE 19 VALUE CHAIN ANALYSIS
           5.4.1 RAW MATERIALS
           5.4.2 R&D
           5.4.3 OEMS (COMPONENT MANUFACTURING)
           5.4.4 ASSEMBLERS & INTEGRATORS
           5.4.5 END USERS
    5.5 TRENDS/DISRUPTIONS IMPACTING CUSTOMER BUSINESS 
           FIGURE 20 REVENUE SHIFT AND NEW REVENUE POCKETS IN SPACE DEBRIS REMOVAL MARKET
    5.6 ECOSYSTEM ANALYSIS 
           5.6.1 PROMINENT COMPANIES
           5.6.2 PRIVATE AND SMALL ENTERPRISES
           5.6.3 END USERS
                    FIGURE 21 SPACE DEBRIS REMOVAL MARKET MAP
                    FIGURE 22 SPACE DEBRIS REMOVAL MARKET ECOSYSTEM
                    TABLE 3 ROLE OF COMPANIES IN ECOSYSTEM
    5.7 PORTER’S FIVE FORCES ANALYSIS 
           TABLE 4 IMPACT OF PORTER’S FIVE FORCES
           5.7.1 THREAT OF NEW ENTRANTS
           5.7.2 THREAT OF SUBSTITUTES
           5.7.3 BARGAINING POWER OF SUPPLIERS
           5.7.4 BARGAINING POWER OF BUYERS
           5.7.5 INTENSITY OF COMPETITIVE RIVALRY
    5.8 AVERAGE SELLING PRICE TREND ANALYSIS 
           FIGURE 23 AVERAGE SELLING PRICE TREND ANALYSIS, BY SATELLITE SIZE (ONLY DEORBITING SYSTEMS)
           TABLE 5 SPACE DEBRIS REMOVAL MARKET, BY SATELLITE SIZE (USD MILLION)
           5.8.1 INDICATIVE PRICING ANALYSIS
    5.9 TARIFF AND REGULATORY LANDSCAPE 
           5.9.1 NORTH AMERICA
                    TABLE 6 REGULATORY BODIES, GOVERNMENT AGENCIES, AND OTHER AGENCIES IN NORTH AMERICA
           5.9.2 EUROPE
                    TABLE 7 REGULATORY BODIES, GOVERNMENT AGENCIES, AND OTHER AGENCIES IN EUROPE
           5.9.3 ASIA PACIFIC
                    TABLE 8 REGULATORY BODIES, GOVERNMENT AGENCIES, AND OTHER AGENCIES IN ASIA PACIFIC
           5.9.4 REST OF THE WORLD
                    TABLE 9 REGULATORY BODIES, GOVERNMENT AGENCIES, AND OTHER AGENCIES IN REST OF THE WORLD
    5.10 TRADE ANALYSIS 
           5.10.1 IMPORT DATA
                    FIGURE 24 IMPORT DATA FOR TOP 10 COUNTRIES
                    TABLE 10 COUNTRY-WISE IMPORTS, 2019–2022 (USD THOUSAND)
                    5.10.1.1 Export data
                                FIGURE 25 EXPORT DATA FOR TOP 10 COUNTRIES
                                TABLE 11 COUNTRY-WISE EXPORTS, 2019–2022 (USD THOUSAND)
    5.11 KEY STAKEHOLDERS AND BUYING CRITERIA 
           5.11.1 KEY STAKEHOLDERS IN BUYING PROCESS
                    FIGURE 26 INFLUENCE OF STAKEHOLDERS ON BUYING SPACE DEBRIS REMOVAL TECHNIQUES, BY ORBIT
                    TABLE 12 INFLUENCE OF STAKEHOLDERS ON BUYING SPACE DEBRIS REMOVAL SYSTEMS, BY ORBIT (%)
           5.11.2 BUYING CRITERIA
                    FIGURE 27 KEY BUYING CRITERIA FOR SPACE DEBRIS REMOVAL SYSTEMS, BY TECHNIQUE
                    TABLE 13 KEY BUYING CRITERIA FOR SPACE DEBRIS REMOVAL SYSTEMS, BY TECHNIQUE
    5.12 KEY CONFERENCES AND EVENTS, 2023–2024 
           TABLE 14 KEY CONFERENCES AND EVENTS
    5.13 USE CASE ANALYSIS 
           5.13.1 USE CASE 1: DRAGSAIL SYSTEM FOR SATELLITE DEORBITING
           5.13.2 USE CASE 2: HARPOON & NET SYSTEM FOR DEBRIS REMOVAL
 
6 INDUSTRY TRENDS (Page No. - 63)
    6.1 INTRODUCTION 
    6.2 TECHNOLOGY TRENDS 
           6.2.1 LASER TECHNOLOGY
           6.2.2 ARTIFICIAL INTELLIGENCE AND MACHINE LEARNING
           6.2.3 ADVANCED SENSORS AND IOT
           6.2.4 3D PRINTING
           6.2.5 BLOCKCHAIN TECHNOLOGY
    6.3 IMPACT OF MEGATRENDS 
           6.3.1 SPACE TRAFFIC MANAGEMENT SYSTEMS
           6.3.2 ROBOTICS
           6.3.3 SUSTAINABLE TECHNOLOGIES
    6.4 SUPPLY CHAIN ANALYSIS 
           FIGURE 28 SUPPLY CHAIN ANALYSIS
    6.5 INNOVATIONS AND PATENT ANALYSIS 
           FIGURE 29 LIST OF MAJOR PATENTS RELATED TO SPACE DEBRIS REMOVAL MARKET
           TABLE 15 LIST OF MAJOR PATENTS FOR SPACE DEBRIS REMOVAL (2022−2023)
    6.6 TECHNOLOGICAL ROADMAP 
           FIGURE 30 EVOLUTION OF SPACE DEBRIS REMOVAL TECHNOLOGY: ROADMAP FROM 1950 TO PRESENT
 
7 SPACE DEBRIS REMOVAL MARKET, BY TECHNIQUE (Page No. - 73)
    7.1 INTRODUCTION 
           FIGURE 31 DIRECT DEBRIS REMOVAL SEGMENT TO GROW AT HIGHER CAGR FROM 2023 TO 2028
           TABLE 16 SPACE DEBRIS REMOVAL MARKET, BY TECHNIQUE, 2020–2022 (USD MILLION)
           TABLE 17 SPACE DEBRIS REMOVAL MARKET, BY TECHNIQUE, 2023–2028 (USD MILLION)
    7.2 DIRECT DEBRIS REMOVAL 
           7.2.1 ROBOTIC ARMS
                    7.2.1.1 Growing R&D investments for advanced robotic arms to drive market
           7.2.2 HARPOONS AND NETS
                    7.2.2.1 Ability to lower risk of collisions to drive market
           7.2.3 OTHER DIRECT DEBRIS REMOVAL TECHNIQUES
    7.3 INDIRECT DEBRIS REMOVAL 
           7.3.1 DRAG SAILS
                    7.3.1.1 Increasing deployment to manage space debris to drive market
           7.3.2 ELECTRODYNAMIC TETHERS
                    7.3.2.1 Potential to revolutionize space missions and satellite disposal to drive market
           7.3.3 OTHER INDIRECT DEBRIS REMOVAL TECHNIQUES
 
8 SPACE DEBRIS REMOVAL MARKET, BY OPERATION (Page No. - 77)
    8.1 INTRODUCTION 
           FIGURE 32 MULTIPLE TECHNIQUE SEGMENT TO GROW AT HIGHER CAGR FROM 2023 TO 2028
           TABLE 18 SPACE DEBRIS REMOVAL MARKET, BY OPERATION, 2020–2022 (USD MILLION)
           TABLE 19 SPACE DEBRIS REMOVAL MARKET, BY OPERATION, 2023–2028 (USD MILLION)
    8.2 SINGLE TECHNIQUE 
           8.2.1 NEED FOR PRACTICAL AND STREAMLINED DEBRIS REMOVAL METHODS TO DRIVE MARKET
    8.3 MULTIPLE TECHNIQUE 
           8.3.1 NEED FOR OPERATIONAL EFFICIENCY TO DRIVE MARKET
 
9 SPACE DEBRIS REMOVAL MARKET, BY ORBIT (Page No. - 80)
    9.1 INTRODUCTION 
           FIGURE 33 LEO SEGMENT TO GROW AT HIGHEST CAGR FROM 2023 TO 2028
           TABLE 20 SPACE DEBRIS REMOVAL MARKET, BY ORBIT, 2020–2022 (USD MILLION)
           TABLE 21 SPACE DEBRIS REMOVAL MARKET, BY ORBIT, 2023–2028 (USD MILLION)
    9.2 LOW EARTH ORBIT (LEO) 
           9.2.1 INCREASING SATELLITE LAUNCHES IN LEO ORBIT TO DRIVE MARKET
                    FIGURE 34 SATELLITE LAUNCHES IN LEO ORBIT (2019−2023)
    9.3 MEDIUM EARTH ORBIT (MEO) 
           9.3.1 INCREASING UTILIZATION OF MEO ORBITS BY COMMERCIAL COMPANIES TO DRIVE MARKET
    9.4 GEOSTATIONARY EARTH ORBIT (GEO) 
           9.4.1 SURGE IN GEO SATELLITE LAUNCHES TO DRIVE MARKET
 
10 SPACE DEBRIS REMOVAL MARKET, BY END USER (Page No. - 84)
     10.1 INTRODUCTION 
             FIGURE 35 COMMERCIAL END USER SEGMENT TO GROW AT HIGHER CAGR FROM 2023 TO 2028
             TABLE 22 SPACE DEBRIS REMOVAL MARKET, BY END USER, 2020–2022 (USD MILLION)
             TABLE 23 SPACE DEBRIS REMOVAL MARKET, BY END USER, 2023–2028 (USD MILLION)
     10.2 GOVERNMENT 
             10.2.1 COLLABORATIONS BETWEEN GOVERNMENT ORGANIZATIONS TO ENSURE SPACE SUSTAINABILITY TO DRIVE MARKET
     10.3 COMMERCIAL 
             10.3.1 GOVERNMENT REGULATIONS ON SPACE SUSTAINABILITY TO DRIVE MARKET
 
11 SPACE DEBRIS REMOVAL MARKET, BY DEBRIS SIZE (Page No. - 87)
     11.1 INTRODUCTION 
     11.2 1MM TO 10MM 
     11.3 10MM TO 100MM 
     11.4 GREATER THAN 100 MM 
 
12 SPACE DEBRIS REMOVAL MARKET, BY REGION (Page No. - 88)
     12.1 INTRODUCTION 
             FIGURE 36 SPACE DEBRIS REMOVAL MARKET, BY REGION, 2023–2028
     12.2 REGIONAL RECESSION IMPACT ANALYSIS 
             TABLE 24 REGIONAL RECESSION IMPACT ANALYSIS
             TABLE 25 SPACE DEBRIS REMOVAL MARKET, BY REGION, 2020−2022 (USD MILLION)
             TABLE 26 SPACE DEBRIS REMOVAL MARKET, BY REGION, 2023−2028 (USD MILLION)
     12.3 NORTH AMERICA 
             12.3.1 PESTLE ANALYSIS
             12.3.2 RECESSION IMPACT ANALYSIS
                        FIGURE 37 NORTH AMERICA: SPACE DEBRIS REMOVAL MARKET SNAPSHOT
                        TABLE 27 NORTH AMERICA: SPACE DEBRIS REMOVAL MARKET, BY ORBIT, 2020–2022 (USD MILLION)
                        TABLE 28 NORTH AMERICA: SPACE DEBRIS REMOVAL MARKET, BY ORBIT, 2023–2028 (USD MILLION)
                        TABLE 29 NORTH AMERICA: SPACE DEBRIS REMOVAL MARKET, BY END USER, 2020–2022 (USD MILLION)
                        TABLE 30 NORTH AMERICA: SPACE DEBRIS REMOVAL MARKET, BY END USER, 2023–2028 (USD MILLION)
             12.3.3 US
                        12.3.3.1 Presence of leading space debris removal companies to drive market
                                     FIGURE 38 MONTHLY ORBITAL LAUNCHES BY US IN 2022
             12.3.4 CANADA
                        12.3.4.1 Increasing government investment in space industry to drive market
     12.4 EUROPE 
             12.4.1 PESTLE ANALYSIS
             12.4.2 RECESSION IMPACT ANALYSIS
                        FIGURE 39 EUROPE: SPACE DEBRIS REMOVAL MARKET SNAPSHOT
                        TABLE 31 EUROPE: SPACE DEBRIS REMOVAL MARKET, BY ORBIT, 2020–2022 (USD MILLION)
                        TABLE 32 EUROPE: SPACE DEBRIS REMOVAL MARKET, BY ORBIT, 2023–2028 (USD MILLION)
                        TABLE 33 EUROPE: SPACE DEBRIS REMOVAL MARKET, BY END USER, 2020–2022 (USD MILLION)
                        TABLE 34 EUROPE: SPACE DEBRIS REMOVAL MARKET, BY END USER, 2023–2028 (USD MILLION)
             12.4.3 UK
                        12.4.3.1 Innovations in debris removal technologies to drive market
             12.4.4 FRANCE
                        12.4.4.1 Growing investment in space debris removal R&D to drive market
             12.4.5 GERMANY
                        12.4.5.1 Continuous focus on upgrading space sustainability systems to drive market
             12.4.6 ITALY
                        12.4.6.1 Technological Innovation and collaborative expertise to drive market
             12.4.7 RUSSIA
                        12.4.7.1 Increasing reliability on self-developed space systems to drive market
             12.4.8 REST OF EUROPE
     12.5 ASIA PACIFIC 
             12.5.1 PESTLE ANALYSIS
             12.5.2 RECESSION IMPACT ANALYSIS
                        FIGURE 40 ASIA PACIFIC: SPACE DEBRIS REMOVAL MARKET SNAPSHOT
                        TABLE 35 ASIA PACIFIC: SPACE DEBRIS REMOVAL MARKET, BY ORBIT, 2020–2022 (USD MILLION)
                        TABLE 36 ASIA PACIFIC: SPACE DEBRIS REMOVAL MARKET, BY ORBIT, 2023–2028 (USD MILLION)
                        TABLE 37 ASIA PACIFIC: SPACE DEBRIS REMOVAL MARKET, BY END USER, 2020–2022 (USD MILLION)
                        TABLE 38 ASIA PACIFIC: SPACE DEBRIS REMOVAL MARKET, BY END USER, 2023–2028 (USD MILLION)
             12.5.3 CHINA
                        12.5.3.1 Rising deployment of satellites to drive market
             12.5.4 JAPAN
                        12.5.4.1 Rigorous development of space debris removal systems to drive market
             12.5.5 INDIA
                        12.5.5.1 Active dominance of ISRO in sustainable space operations to drive market
             12.5.6 SOUTH KOREA
                        12.5.6.1 Collaborative partnerships between researchers and government to drive market
             12.5.7 REST OF ASIA PACIFIC
     12.6 REST OF THE WORLD (ROW) 
             12.6.1 RECESSION IMPACT ANALYSIS
                        TABLE 39 REST OF THE WORLD: SPACE DEBRIS REMOVAL MARKET, BY ORBIT, 2020–2022 (USD MILLION)
                        TABLE 40 REST OF THE WORLD: SPACE DEBRIS REMOVAL MARKET, BY ORBIT, 2023–2028 (USD MILLION)
                        TABLE 41 REST OF THE WORLD: SPACE DEBRIS REMOVAL MARKET, BY END USER, 2020–2022 (USD MILLION)
                        TABLE 42 REST OF THE WORLD: SPACE DEBRIS REMOVAL MARKET, BY END USER, 2023–2028 (USD MILLION)
             12.6.2 MIDDLE EAST & AFRICA
                        12.6.2.1 Increasing space situational awareness to drive market
             12.6.3 LATIN AMERICA
                        12.6.3.1 Increased focus on space development to drive market
 
13 COMPETITIVE LANDSCAPE (Page No. - 109)
     13.1 INTRODUCTION 
             TABLE 43 KEY PLAYERS’ STRATEGIES/RIGHT TO WIN
     13.2 SPACE DEBRIS REMOVAL MARKET RANKING ANALYSIS, 2022 
             FIGURE 41 SPACE DEBRIS REMOVAL MARKET RANKING OF TOP 5 PLAYERS, 2022
     13.3 COMPANY EVALUATION MATRIX, 2022 
             13.3.1 STARS
             13.3.2 EMERGING LEADERS
             13.3.3 PERVASIVE PLAYERS
             13.3.4 PARTICIPANTS
                        FIGURE 42 SPACE DEBRIS REMOVAL MARKET: COMPANY EVALUATION MATRIX, 2022
             13.3.5 COMPANY FOOTPRINT
                        TABLE 44 COMPANY TECHNIQUE FOOTPRINT
                        TABLE 45 COMPANY REGION FOOTPRINT
     13.4 START-UP/SME EVALUATION MATRIX, 2022 
             13.4.1 PROGRESSIVE COMPANIES
             13.4.2 RESPONSIVE COMPANIES
             13.4.3 DYNAMIC COMPANIES
             13.4.4 STARTING BLOCKS
                        FIGURE 43 SPACE DEBRIS REMOVAL MARKET: START-UP/SME EVALUATION MATRIX, 2022
             13.4.5 COMPETITIVE BENCHMARKING
                        TABLE 46 SPACE DEBRIS REMOVAL MARKET: LIST OF KEY START-UPS/SMES
                        TABLE 47 SPACE DEBRIS REMOVAL MARKET: COMPETITIVE BENCHMARKING OF KEY START-UPS/SMES
     13.5 COMPETITIVE SCENARIO 
             13.5.1 DEALS
                        TABLE 48 DEALS, 2020–2023
 
14 COMPANY PROFILES (Page No. - 125)
(Business Overview, Products Offered, Recent Developments, MnM View Right to win, Strategic choices made, Weaknesses and competitive threats) *  
     14.1 KEY PLAYERS 
             14.1.1 ASTROSCALE
                        TABLE 49 ASTROSCALE: COMPANY OVERVIEW
                        TABLE 50 ASTROSCALE: PRODUCTS/SOLUTIONS/SERVICES OFFERED
                        TABLE 51 ASTROSCALE: DEALS
                        TABLE 52 ASTROSCALE: OTHERS
             14.1.2 CLEARSPACE
                        TABLE 53 CLEARSPACE: COMPANY OVERVIEW
                        TABLE 54 CLEARSPACE: PRODUCTS/SOLUTIONS/SERVICES OFFERED
                        TABLE 55 CLEARSPACE: DEALS
                        TABLE 56 CLEARSPACE: OTHERS
             14.1.3 SURREY SATELLITE TECHNOLOGY LTD
                        TABLE 57 SURREY SATELLITE TECHNOLOGY LTD: COMPANY OVERVIEW
                        TABLE 58 SURREY SATELLITE TECHNOLOGY LTD: PRODUCTS/SOLUTIONS/SERVICES OFFERED
                        TABLE 59 SURREY SATELLITE TECHNOLOGY LTD: DEALS
             14.1.4 NORTHROP GRUMMAN
                        TABLE 60 NORTHROP GRUMMAN: COMPANY OVERVIEW
                        FIGURE 44 NORTHROP GRUMMAN: COMPANY SNAPSHOT
                        TABLE 61 NORTHROP GRUMMAN: PRODUCTS/SOLUTIONS/SERVICES OFFERED
             14.1.5 KALL MORRIS INCORPORATED
                        TABLE 62 KALL MORRIS INCORPORATED: COMPANY OVERVIEW
                        TABLE 63 KALL MORRIS INCORPORATED: PRODUCTS/SOLUTIONS/SERVICES OFFERED
                        TABLE 64 KALL MORRIS INCORPORATED: DEALS
             14.1.6 D-ORBIT
                        TABLE 65 D-ORBIT: COMPANY OVERVIEW
                        TABLE 66 D-ORBIT: PRODUCTS/SOLUTIONS/SERVICES OFFERED
             14.1.7 ALTIUS SPACE MACHINES
                        TABLE 67 ALTIUS SPACE MACHINES: COMPANY OVERVIEW
                        TABLE 68 ALTIUS SPACE MACHINES: PRODUCTS/SOLUTIONS/SERVICES OFFERED
             14.1.8 OBRUTA SPACE SOLUTIONS CORP.
                        TABLE 69 OBRUTA SPACE SOLUTIONS CORP.: COMPANY OVERVIEW
                        TABLE 70 OBRUTA SPACE SOLUTIONS CORP.: PRODUCTS/SOLUTIONS/SERVICES OFFERED
                        TABLE 71 OBRUTA SPACE SOLUTIONS CORP.: DEALS
             14.1.9 TRANS ASTRONAUTICA CORPORATION. (TRANSASTRA)
                        TABLE 72 TRANS ASTRONAUTICA CORPORATION. (TRANSASTRA): COMPANY OVERVIEW
                        TABLE 73 TRANS ASTRONAUTICA CORPORATION. (TRANSASTRA): PRODUCTS/SOLUTIONS/ SERVICES OFFERED
                        TABLE 74 TRANS ASTRONAUTICA CORPORATION. (TRANSASTRA): DEALS
                        TABLE 75 TRANS ASTRONAUTICA CORPORATION. (TRANSASTRA): OTHERS
             14.1.10 DARK
                        TABLE 76 DARK: COMPANY OVERVIEW
                        TABLE 77 DARK: PRODUCTS/SOLUTIONS/SERVICES OFFERED
                        TABLE 78 DARK: DEALS
             14.1.11 AURORA PROPULSION TECHNOLOGIES OY
                        TABLE 79 AURORA PROPULSION TECHNOLOGIES OY: COMPANY OVERVIEW
                        TABLE 80 AURORA PROPULSION TECHNOLOGIES OY: PRODUCTS/SOLUTIONS/SERVICES OFFERED
                        TABLE 81 AURORA PROPULSION TECHNOLOGIES OY: DEALS
             14.1.12 REDWIRE CORPORATION
                        TABLE 82 REDWIRE CORPORATION: COMPANY OVERVIEW
                        FIGURE 45 REDWIRE CORPORATION: COMPANY SNAPSHOT
                        TABLE 83 REDWIRE CORPORATION: PRODUCTS/SOLUTIONS/SERVICES OFFERED
                        TABLE 84 REDWIRE CORPORATION: DEALS
             14.1.13 HPS GMBH
                        TABLE 85 HPS GMBH: COMPANY OVERVIEW
                        TABLE 86 HPS GMBH: PRODUCTS/SOLUTIONS/SERVICES OFFERED
             14.1.14 ELECTRO OPTIC SYSTEMS
                        TABLE 87 ELECTRO OPTIC SYSTEMS: COMPANY OVERVIEW
                        FIGURE 46 ELECTRO OPTIC SYSTEMS: COMPANY SNAPSHOT
                        TABLE 88 ELECTRO OPTIC SYSTEMS: PRODUCTS/SOLUTIONS/SERVICES OFFERED
                        TABLE 89 ELECTRO OPTIC SYSTEMS: DEALS
             14.1.15 SKY PERFECT JSAT HOLDINGS INC.
                        TABLE 90 SKY PERFECT JSAT HOLDINGS INC.: COMPANY OVERVIEW
                        FIGURE 47 SKY PERFECT JSAT HOLDINGS INC.: COMPANY SNAPSHOT
                        TABLE 91 SKY PERFECT JSAT HOLDINGS INC.: PRODUCTS/SOLUTIONS/SERVICES OFFERED
                        TABLE 92 SKY PERFECT JSAT HOLDINGS INC.: DEALS
     14.2 OTHER PLAYERS 
             14.2.1 NPC SPACEMIND
                        TABLE 93 NPC SPACEMIND: COMPANY OVERVIEW
             14.2.2 ORIGIN.SPACE
                        TABLE 94 ORIGIN.SPACE: COMPANY OVERVIEW
             14.2.3 SKYRORA LIMITED
                        TABLE 95 SKYRORA LIMITED: COMPANY OVERVIEW
             14.2.4 ORBOTIC SYSTEMS INC.
                        TABLE 96 ORBOTIC SYSTEMS INC.: COMPANY OVERVIEW
             14.2.5 ORBITGUARDIANS
                        TABLE 97 ORBITGUARDIANS: COMPANY OVERVIEW
             14.2.6 KURS ORBITAL
                        TABLE 98 KURS ORBITAL: COMPANY OVERVIEW
             14.2.7 TETHERS UNLIMITED, INC.
                        TABLE 99 TETHERS UNLIMITED, INC.: COMPANY OVERVIEW
             14.2.8 GLYCANSPACEXR
                        TABLE 100 GLYCANSPACEXR: COMPANY OVERVIEW
             14.2.9 EXPLORATION LABORATORIES LLC.
                        TABLE 101 EXPLORATION LABORATORIES LLC.: COMPANY OVERVIEW
             14.2.10 KINETIK SPACE
                        TABLE 102 KINETIK SPACE: COMPANY OVERVIEW
*Details on Business Overview, Products Offered, Recent Developments, MnM View, Right to win, Strategic choices made, Weaknesses and competitive threats might not be captured in case of unlisted companies.  
 
15 APPENDIX (Page No. - 164)
     15.1 DISCUSSION GUIDE 
     15.2 KNOWLEDGESTORE: MARKETSANDMARKETS’ SUBSCRIPTION PORTAL 
     15.3 CUSTOMIZATION OPTIONS 
     15.4 RELATED REPORTS 
     15.5 AUTHOR DETAILS 


The study involved four major activities in estimating the current size of the Space Debris Removal Market. Exhaustive secondary research was done to collect information on the space debris removal market, its adjacent markets, and its parent market. The next step was to validate these findings, assumptions, and sizing with industry experts across the value chain through primary research. Demand-side analyses were carried out to estimate the overall size of the market. After that, market breakdown and data triangulation procedures were used to estimate the sizes of different segments and subsegments of the space debris removal market.

Secondary Research

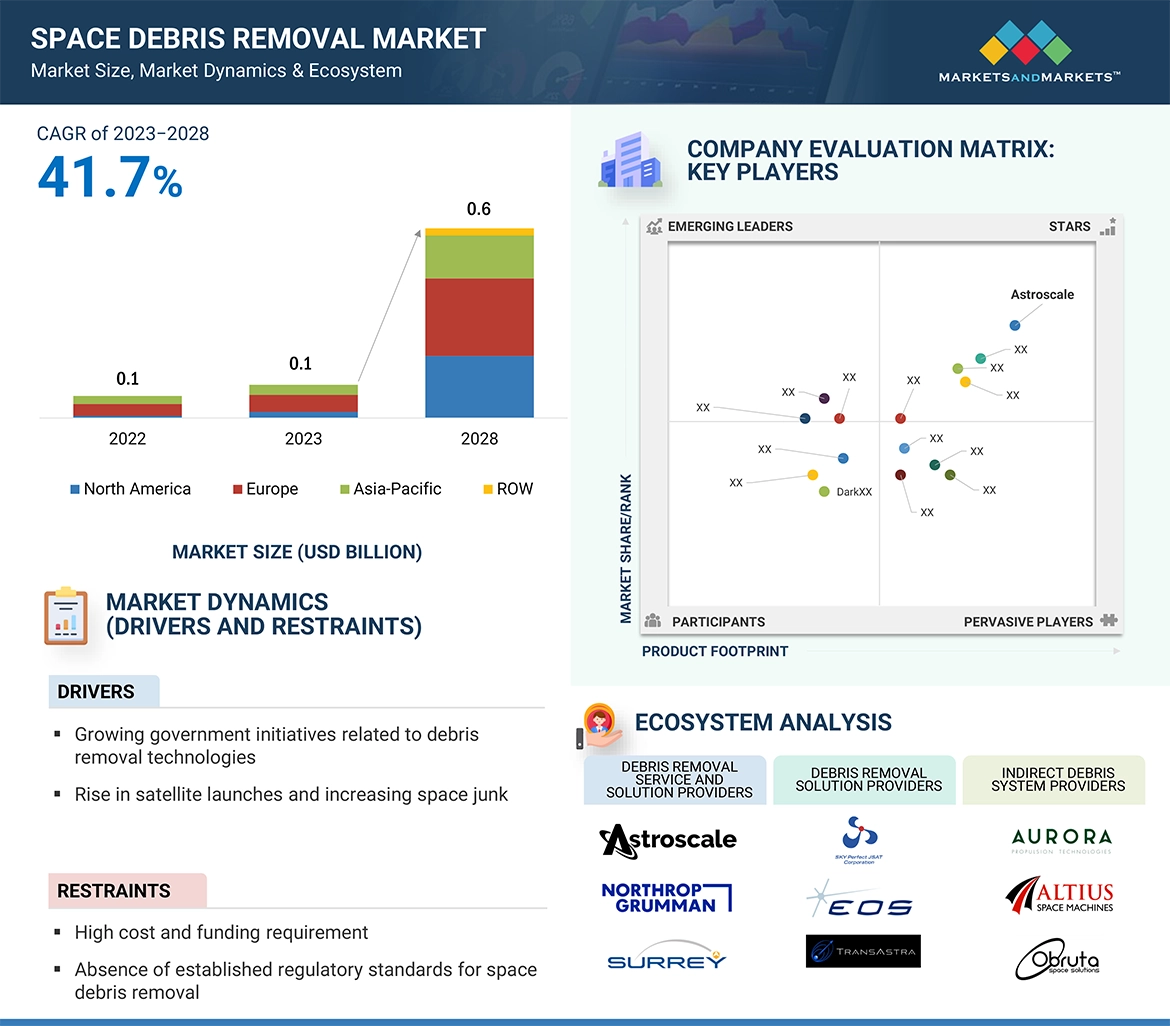
The market ranking of companies was determined using secondary data made available through paid and unpaid sources and by analyzing the product portfolios of major companies. These companies the performance on the basis of the performance and quality of their products. These data points were further validated by primary sources.
Secondary sources referred to for this research study included financial statements of companies offering space debris removal products and services and information from various trade, business, and professional associations. The secondary data was collected and analyzed to arrive at the overall size of the space debris removal market, which was validated by primary respondents.

Primary Research

Extensive primary research was conducted after acquiring information regarding the space debris removal market scenario through secondary research. Several primary interviews were conducted with market experts from both the demand and supply sides across major countries of North America, Europe, Asia Pacific, ROW which includes the Middle East & Africa, and Latin America. Primary data was collected through questionnaires, emails, and telephonic interviews.

Space Debris Removal Market Size, and Share

To know about the assumptions considered for the study, download the pdf brochure

Market Size Estimation

The market sizing of the market was undertaken from the demand side. The market was upsized at a regional level based on procurements and missions planned by the country. Such procurements provide information on each application demand aspects of space debris removal.

Note: An analysis of technological, funding, year-on-year investments, and operational cost was carried out to arrive at the CAGR and understand the market dynamics of all regions in the report. The market share for all technique, orbit, operation, and end user was based on the recent and upcoming planned missions of space debris removal in every region from 2023 to 2028.

Space Debris Removal Market Size: Bottom-up Approach

Space Debris Removal Market Size, and Bottom-up Approach

Space Debris Removal Market Size: Top-Down Approach

Space Debris Removal Market Size, and Top-Down Approach

Data Triangulation

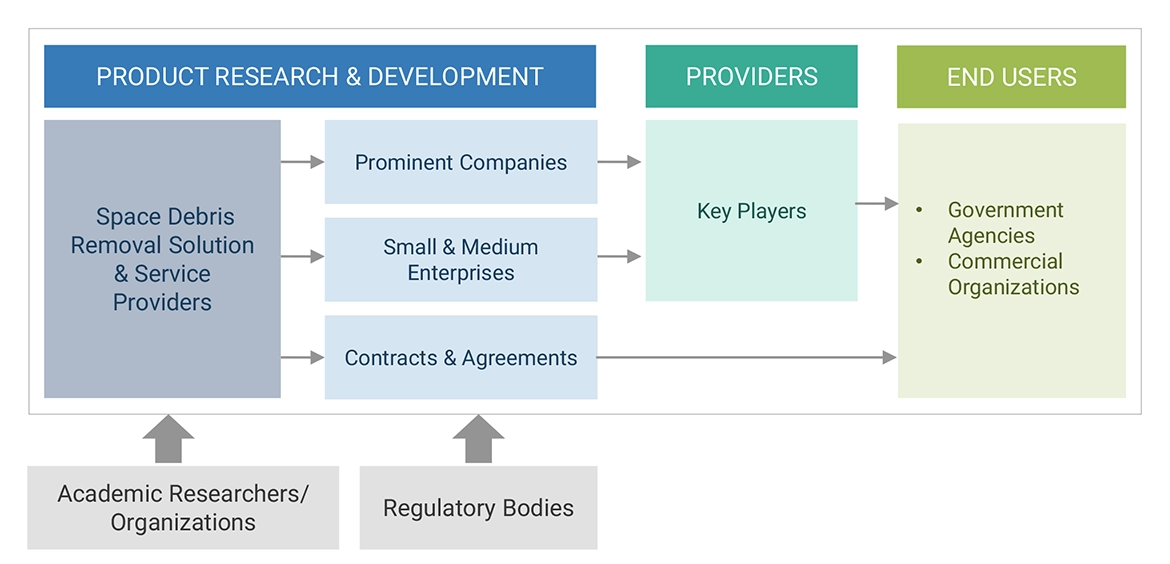
After arriving at the overall size from the market size estimation process explained above, the total market was split into several segments and subsegments. The data triangulation and market breakdown procedures explained below were implemented, wherever applicable, to complete the overall market engineering process and arrive at the exact statistics for various market segments and subsegments. The data was triangulated by studying various factors and trends from both the demand and supply sides. Along with this, the market size was validated using both the top-down and bottom-up approaches.

The following figure indicates the market breakdown structure and the data triangulation procedure that was implemented in the market engineering process to make this report on the space debris removal market.

Market Definition

Space debris removal refers to the strategic process of eliminating defunct satellites, spent rocket stages, and fragments from space orbits and the techniques to safely deorbit the satellites or spacecrafts after their mission. This burgeoning industry aims to mitigate orbital congestion, safeguard operational satellites, and ensure sustainable space exploration. By deploying innovative technologies and retrieval strategies, companies engage in the retrieval, capture, and disposal of space debris, fostering a cleaner orbital environment for continued commercial satellite launches and enhancing the long-term viability of space activities.

Key Stakeholders

  • Manufacturers of space debris removal systems and solutions
  • System Integrators
  • Original Equipment Manufacturers (OEM)
  • Space Organizations
  • Regulatory Authorities

Report Objectives

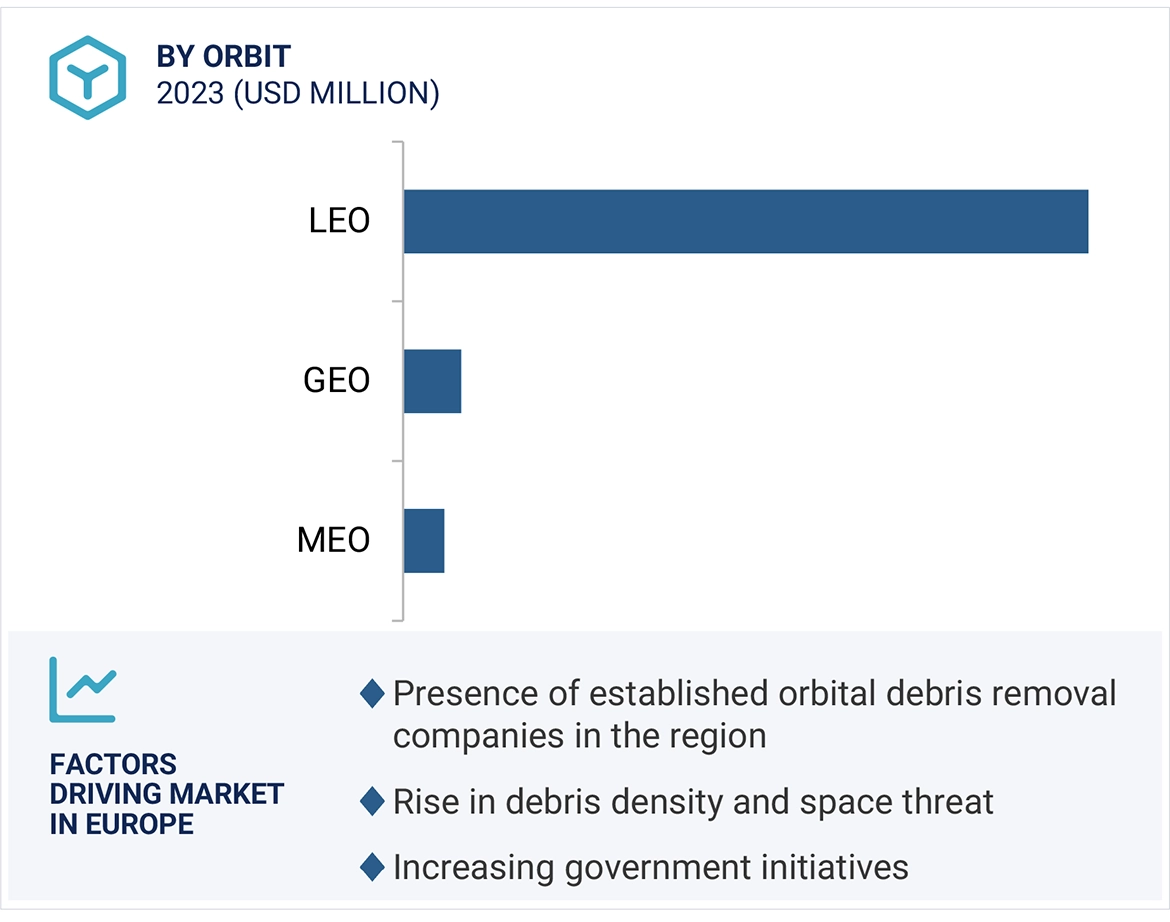
  • To define and describe the Space Debris Removal market based on debris size, orbit, operation, technique, end user, and region.
  • To indicate the size of the various segments of the Space Debris Removal market based on four regions—North America, Europe, Asia Pacific, Rest of the world—along with key countries in each of these regions.
  • To identify and analyze key drivers, restraints, opportunities, and challenges influencing the growth of the market.
  • To determine industry trends, market trends, and technology trends prevailing in the market
  • To analyze micro markets concerning individual technological trends, prospects, and their contribution to the overall market
  • To provide a detailed competitive landscape of the market and analyze competitive growth strategies such as product launches and developments, contracts, partnerships, agreements, and collaborations adopted by key players in the market.
  • To identify the detailed financial positions, product portfolios, and key developments of leading companies in the market
  • To strategically profile key market players and comprehensively analyze their market rank analysis and core competencies.

Available Customizations:

MarketsandMarkets offers the following customizations for this market report:

  • Additional country-level analysis of the Space Debris Removal Market
  • Profiling of other market players (up to 5)

Product Analysis

  • Product matrix, which provides a detailed comparison of the product portfolio of each company in the Space Debris Removal Market.
Custom Market Research Services

We will customize the research for you, in case the report listed above does not meet with your exact requirements. Our custom research will comprehensively cover the business information you require to help you arrive at strategic and profitable business decisions.

Request Customization
Report Code
AS 8865
Published ON
Nov, 2023
Choose License Type
BUY NOW
  • SHARE
X
Request Customization
Speak to Analyst
Speak to Analyst
OR FACE-TO-FACE MEETING
PERSONALIZE THIS RESEARCH
  • Triangulate with your Own Data
  • Get Data as per your Format and Definition
  • Gain a Deeper Dive on a Specific Application, Geography, Customer or Competitor
  • Any level of Personalization
REQUEST A FREE CUSTOMIZATION
LET US HELP YOU!
  • What are the Known and Unknown Adjacencies Impacting the Space Debris Removal Market
  • What will your New Revenue Sources be?
  • Who will be your Top Customer; what will make them switch?
  • Defend your Market Share or Win Competitors
  • Get a Scorecard for Target Partners
CUSTOMIZED WORKSHOP REQUEST
+1-888-600-6441
  • Call Us
  • +1-888-600-6441 (Corporate office hours)
  • +1-888-600-6441 (US/Can toll free)
  • +44-800-368-9399 (UK office hours)
CONNECT WITH US
ABOUT TRUST ONLINE
©2024 MarketsandMarkets Research Private Ltd. All rights reserved
DMCA.com Protection Status Website Feedback