Spatial Computing Market

Spatial Computing Market by Technology Type (AR Technology, VR Technology, MR Technology), Component (Hardware, Software, Services), Vertical (Media & Entertainment, Manufacturing, Retail & eCommerce) and Region - Global Forecast to 2028

Report Code: TC 8839 Nov, 2023, by marketsandmarkets.com

Spatial Computing Market - Analysis, Industry Size & Forecast

The global Spatial Computing Market size was valued at USD 97.9 billion in 2023 and is expected to grow at a CAGR of 23.4% from 2023 to 2028. The revenue forecast for 2028 is projected to reach $280.5 billion. The base year for estimation is 2022, and the historical data spans from 2023 to 2028.

The impact of the recession (before and after the recession) on the market is covered throughout the report.The use of spatial computing in the healthcare sector opens new opportunities for medical practitioners and holds a promising future, especially for modern healthcare organizations. It enables doctors and patients to connect virtually for sessions without geographical limitations and assists virtual wellness, fitness, mental health, and doctor-patient interaction. Moreover, spatial computing can be experienced using advanced HMDs or legacy hardware, such as mobile phones, tablets, and computers. Local companies’ launch of VR devices, such as basic VR devices or cardboard-based DIY (do-it-yourself) VR devices, has helped user equipment affordability parameters. These are critical driving forces for the Spatial computing market.

Spatial Computing Market

To know about the assumptions considered for the study, Request for Free Sample Report

Spatial Computing Market

To know about the assumptions considered for the study, download the pdf brochure

Recession Impact on the global Spatial Computing Market 

A recession can significantly impact the Spatial Computing market, which encompasses technologies like augmented reality (AR), virtual reality (VR), and mixed reality (MR). During economic downturns, consumers reduce discretionary spending, affecting demand for Spatial Computing devices such as VR headsets and AR glasses. Businesses may delay investments in these technologies as they prioritize cost-cutting over innovation. Startups in the field may struggle to secure funding as investors become more risk-averse. However, Spatial Computing technologies can find resilience in some sectors, like gaming and entertainment, as people seek entertainment options during recessions. On the positive side, these technologies can facilitate remote work and collaboration, which may increase demand in a remote-work-focused economy. Government stimulus and investments in technology development can also help mitigate the recession’s impact. In the end, the extent of the impact varies by region, industry, and the severity of the economic downturn.

Spatial Computing Market Dynamics

Drivers: Advancements in real-time rendering engines

The spatial computing market thrives on advancements in real-time rendering technology. These innovations empower AR/VR applications to create lifelike environments, dynamic lighting, and intricate textures in real-time, elevating user immersion and presence. As real-time rendering progresses, it becomes a pivotal driver, pushing the boundaries of what is possible in AR/VR. This results in more captivating, visually striking, and emotionally engaging experiences across industries, ranging from gaming and education to simulation training, ultimately fueling the global market’s growth.

Restraints: Diversity of AR/VR platforms and complex development landscape

The diversity of AR/VR platforms, including standalone headsets, PC-based systems, and mobile devices, each with its unique hardware capabilities and operating systems, creates a complex development landscape. Ensuring that AR/VR software is used across spatial computing implementation/practice functions seamlessly across this wide array of devices demands substantial effort in optimization, compatibility testing, and customization. Developers must navigate the technical intricacies and the varying user interfaces and interaction methods inherent to different platforms. Consequently, the challenge lies in striking a delicate balance between delivering a consistent, high-quality experience and capitalizing on each platform’s strengths while managing the ever-evolving AR/VR ecosystem.

Opportunities: Incorporation of spatial computing and adjacent technologies in the aerospace & defense sector

Technologies such as XR, AI, digital twins, and analytics in the aerospace and defense sector are expected to be be of maasive significance for training and simulating applications. Digital twins are already accelerating progress for aerospace, defense, and government applications. The technology is gradually becoming more important in the development cycle as electronics usage surge in complexity and expand to multi-die systems. A crucial technology in Spatial computing, digital twin, is a virtual representation of a physical system and replicates/reflects/duplicates functionalities of the actual hardware and software. In the aerospace industry, digital twins provide a virtual representation of systems such as an aircraft, a satellite, a semiconductor subsystem that is contained within a larger system. The technology can augment or replace the physical systems which were critically required for prototyping in the past. Further, combined technologies can be used to inspect airplanes, analyze the data, and find malfunctions before take-off, ensuring increased safety. In integration with XR, the metaverse can also help in weapon training, flight training, and simulations, thereby boosting the market growth. 

Challenges: Strict maintenance and challenge in preservation of consumer privacy

Spatial computing is supported by adjacent technologies, primarily cloud computing, blockchain, AI/ML, and XR.    Privacy is a significant challenge in the extended reality market because XR technologies, such as VR and AR, collect a vast amount of personal data about their users. This data includes sensitive information like user movements, biometric data, and even personal preferences. One of the primary concerns in the XR market is that users’ data can be collected without their knowledge or consent. This can happen with XR devices, which may track and record a user’s location, movements, and actions. These devices can also capture audio and visual information, which can be used for various purposes. Another challenge is the potential for XR technology to be used for malicious purposes, such as cyberstalking or identity theft. The personal data collected through XR devices can be exploited to gain access to sensitive information, steal identities, or track individuals’ movements.

Spatial Computing Market Ecosystem

Spatial Computing Market

Based on the services, the professional services will hold the largest market share in the Spatial computing market during the forecast period.

Services play a significant role in processes, such as solutions deployment, onboarding, training, software handling, and maintenance. Professional services include designing, planning, upgradation, and a host of consulting services offered to clients. Companies are offering these services to engage consultants, solutions experts, and dedicated project management teams to specialize in designing and delivering critical decision-support solutions and services. The professional service team ensures smooth project management and precise on-site installation for spatial computing hardware and software. The growth of the professional services segment is governed by the complexity of understanding new business models and process efficiencies in the face of new imperatives, such as increasing demand, new technological interventions, and changing regulatory policies.

Based on technology type, the MR technology segment to hold a higher CAGR in the Spatial computing market during the forecast period

MR is being implemented in numerous innovative ways in the spatial computing market. Industries such as healthcare use MR for medical visualization, enabling doctors to see 3D models of patient anatomy during surgeries. In design and engineering, MR enhances the creation and testing of prototypes. Remote collaboration is improved as MR devices enable individuals to interact as if they were in the exact location, transforming the way teams work together. MR also has applications in training and education, offering hands-on and immersive learning experiences.  

North America to hold the largest market share in the Spatial computing market in 2023.

Spatial computing adoption in North America has gained considerable momentum, positioning the region as a leader in the field. The United States, in particular, has seen widespread adoption of augmented and virtual reality technologies driven by a vibrant ecosystem of tech giants, startups, and research institutions. These technologies find applications in diverse sectors, including entertainment, healthcare, education, and enterprise solutions. Major players like Microsoft, Meta, and Magic Leap have introduced spatial computing devices, such as HoloLens and Oculus, which have been instrumental in popularizing the technology. Additionally, North America’s investment in 5G infrastructure and cloud computing capabilities has further facilitated the growth of spatial computing, enabling real-time, high-quality immersive experiences. With active support from both the public and private sectors, North America continues to be a hub for spatial computing innovation and serves as a global benchmark for its adoption and advancement.

Spatial Computing Market by Region

Key market players

The spatial computing market is dominated both by established companies as well as startups such as Meta (US), Microsoft (US), Apple (US), Sony (Japan), Qualcomm (US), Google (US), Epson (Japan), Samsung (South Korea), Magic Leap (US), and PTC (US). These vendors have a large customer base, a strong geographic footprint, and organized distribution channels. They incorporate organic and inorganic growth strategies, including product launches, deals, and business expansions, boosting revenue generation.

The study includes an in-depth competitive analysis of these key players in the Spatial computing market with their company profiles, recent developments, and key market strategies. 

Get online access to the report on the World's First Market Intelligence Cloud

  • Easy to Download Historical Data & Forecast Numbers
  • Company Analysis Dashboard for high growth potential opportunities
  • Research Analyst Access for customization & queries
  • Competitor Analysis with Interactive dashboard
  • Latest News, Updates & Trend analysis
Request Sample

Scope of the Report

Report Metrics

Details

Market size value in 2023

USD 97.9 billion

Revenue forecast for 2028

USD 280.5 billion

Growth Rate

23.4% CAGR

Market size available for years

2019–2028

Base year considered

2022

Forecast period

2023–2028

Forecast units

Value (USD Billion)

Key Market Drivers

  • Virtualization in fashion, art, and retail industries
  • Increase in adoption of extended reality in healthcare sector

Key Market Opportunities

  • Increase in government initiatives toward cloud computing
  • Continuous development in 5G technology

Segments Covered

Technology Type, Component, and Vertical

Regions covered

North America, Europe, Asia Pacific, Middle East & Africa, and Latin America

Companies covered

Meta, Microsoft, Apple, Sony, Qualcomm, Google, Samsung, Epson, Magic Leap, PTC, HTC, Intel, NVIDIA, Unity, Epic Games, Lenovo, Varjo, EON Reality, Ultraleap, Zappar, Vuzix, Avegant, Taqtile, Blippar, 3D Cloud by Marxent, and 4Experience

This research report categorizes the spatial computing market to forecast revenue and analyze trends in each of the following submarkets:

Based on Component:
  • Hardware
    • AR devices
    • VR devices
    • MR devices
  • Software
    • Software Development Kit
    • Game Engine
    • Modeling & Visualization Software
    • Content Management System
    • Training Simulation Software
    • Other Softwares
  • Services
    • Professional Services
      • Training & Consulting
      • Support & Maintenance
      • System Integration & Implementation
    • Managed Services
  • Security
  • Content Management
  • Performance Monitoring
Based on Technology Type:
  • AR Technology
  • VR Technology
  • MR Technology
Based on Vertical:
  • Media & Entertainment
  • Manufacturing
  • Retail & eCommerce
  • Education & Training
  • Real Estate
  • Healthcare
  • Aerospace & Defense
  • Travel & Hospitality
  • Other Verticals
Based on Region:
  • North America
    • US
    • Canada
  • Europe
    • UK
    • Germany
    • France
    • Italy
    • Rest of Europe
  • Asia Pacific
    • China
    • Japan
    • Australia & New Zealand
    • South Korea
    • Rest of Asia Pacific
  • Middle East & Africa
    • Saudi Arabia
    • UAE
    • Rest of the Middle East & Africa
  • Latin America
    • Brazil
    • Mexico
    • Rest of Latin America

Recent Developments

  • In March 2022, Google acquired Raxium. This acquisition added to Google’s AR hardware portfolio as Raxium develops AR display devices. With this acquisition, Google focuses on developing AR glasses and headsets.
  • In February 2022, Sony collaborated with Niantic to develop and expand its AR hardware portfolio. The collaboration would mainly focus on the development of AR for headphones.
  • In February 2022, Samsung acquired a German-based AR developer, Apostera, to expand its business in the car technology market, for example, for Head-up Displays in cars.
  • In December 2021, Meta worked with game engine developer Unity to create AR and VR content. Unity partnered with Meta Audience Network to offer Unity ads through Unity mediation to in-app bidding. Through the partnership, Unity creators could optimize further revenue potential, and developers would have access to more than 60 ad ecosystem partners and Meta Audience Network.
  • In September 2021, Qualcomm acquired Wikitude, a provider of AR SDK that enables developers to create and build AR solutions and experiences that can be deployed across multiple platforms.

Frequently Asked Questions (FAQ):

To speak to our analyst for a discussion on the above findings, click Speak to Analyst

TABLE OF CONTENTS
 
1 INTRODUCTION (Page No. - 38)
    1.1 STUDY OBJECTIVES 
    1.2 MARKET DEFINITION 
           1.2.1 INCLUSIONS & EXCLUSIONS
    1.3 MARKET SCOPE 
           1.3.1 MARKET SEGMENTATION
           1.3.2 REGIONS COVERED
           1.3.3 YEARS CONSIDERED
    1.4 CURRENCY 
           TABLE 1 USD EXCHANGE RATES, 2018–2022
    1.5 STAKEHOLDERS 
    1.6 RECESSION IMPACT 
 
2 RESEARCH METHODOLOGY (Page No. - 44)
    2.1 RESEARCH APPROACH 
           FIGURE 1 SPATIAL COMPUTING MARKET: RESEARCH DESIGN
           2.1.1 SECONDARY DATA
           2.1.2 PRIMARY DATA
                    2.1.2.1 Breakup of primary profiles
                               FIGURE 2 BREAKUP OF PRIMARY INTERVIEWS, BY COMPANY TYPE, DESIGNATION,  AND REGION
                    2.1.2.2 Key industry insights
    2.2 MARKET FORECAST 
           TABLE 2 FACTOR ANALYSIS
    2.3 MARKET SIZE ESTIMATION 
           FIGURE 3 SPATIAL COMPUTING MARKET: TOP-DOWN AND BOTTOM-UP APPROACHES
           FIGURE 4 MARKET SIZE ESTIMATION METHODOLOGY: SUPPLY-SIDE ANALYSIS
           FIGURE 5 BOTTOM-UP APPROACH (SUPPLY SIDE): COLLECTIVE REVENUE OF SPATIAL COMPUTING VENDORS
           FIGURE 6 SUPPLY-SIDE ANALYSIS: ILLUSTRATION OF VENDOR REVENUE ESTIMATION
           FIGURE 7 DEMAND-SIDE ANALYSIS: REVENUE GENERATED FROM SPATIAL COMPUTING PRODUCTS AND SERVICES
           FIGURE 8 APPROACH 2 (DEMAND SIDE): SPATIAL COMPUTING MARKET
    2.4 DATA TRIANGULATION 
    2.5 RESEARCH ASSUMPTIONS 
    2.6 STUDY LIMITATIONS 
    2.7 IMPACT OF RECESSION ON GLOBAL SPATIAL COMPUTING MARKET 
           TABLE 3 RECESSION IMPACT
 
3 EXECUTIVE SUMMARY (Page No. - 57)
    3.1 RECESSION IMPACT 
           FIGURE 9 TOP-GROWING SEGMENTS IN SPATIAL COMPUTING MARKET
           FIGURE 10 SPATIAL COMPUTING MARKET, BY REGION, 2023 VS. 2028 (USD MILLION)
 
4 PREMIUM INSIGHTS (Page No. - 62)
    4.1 ATTRACTIVE GROWTH OPPORTUNITIES FOR SPATIAL COMPUTING MARKET PLAYERS 
           FIGURE 11 EMERGENCE OF ADVANCED TECHNOLOGIES AND DIGITAL INITIATIVES TO DRIVE ADOPTION OF SPATIAL COMPUTING
    4.2 SPATIAL COMPUTING MARKET, BY HARDWARE 
           FIGURE 12 VR DEVICES TO BE LARGEST SPATIAL COMPUTING TECHNOLOGY DURING FORECAST PERIOD
    4.3 SPATIAL COMPUTING MARKET, BY COMPONENT 
           FIGURE 13 SPATIAL COMPUTING SOFTWARE TO ACCOUNT FOR LARGEST MARKET  SHARE IN 2023 AND 2028
    4.4 SPATIAL COMPUTING MARKET, BY VERTICAL 
           FIGURE 14 MEDIA & ENTERTAINMENT VERTICAL TO BE LARGEST IN 2023 AND 2028
    4.5 SPATIAL COMPUTING MARKET: REGIONAL SCENARIO 
           FIGURE 15 ASIA PACIFIC TO EMERGE AS BEST MARKET FOR INVESTMENTS IN  NEXT FIVE YEARS
 
5 MARKET OVERVIEW AND INDUSTRY TRENDS (Page No. - 65)
    5.1 INTRODUCTION 
    5.2 MARKET DYNAMICS 
           FIGURE 16 DRIVERS, RESTRAINTS, OPPORTUNITIES, AND CHALLENGES:  SPATIAL COMPUTING MARKET
           5.2.1 DRIVERS
                    5.2.1.1 Virtualization in fashion, art, and retail industries
                    5.2.1.2 Increase in adoption of extended reality in healthcare sector
                    5.2.1.3 Availability of affordable hardware
                    5.2.1.4 Advancements in real-time rendering engines
                    5.2.1.5 Replacement technology to reduce ‘virtual meeting fatigue’
           5.2.2 RESTRAINTS
                    5.2.2.1 Rise in health concerns associated with excessive usage of VR/XR devices
                    5.2.2.2 Diversity of AR/VR platforms and complex development landscape
                    5.2.2.3 Lack of technical knowledge and expertise
           5.2.3 OPPORTUNITIES
                    5.2.3.1 Increase in government initiatives toward cloud computing
                    5.2.3.2 Continuous development in 5G technology
                    5.2.3.3 Incorporation of spatial computing and adjacent technologies in aerospace & defense sector
           5.2.4 CHALLENGES
                    5.2.4.1 Low-latency imaging displays
                    5.2.4.2 Local government restrictions coupled with environmental impact
                    5.2.4.3 Strict maintenance and preservation of consumer privacy
    5.3 CASE STUDY ANALYSIS 
           5.3.1 MICROSOFT REVOLUTIONIZED CHEMICAL RECYCLING INDUSTRY WITH ENCINA
           5.3.2 PTC IMPLEMENTED ROBUST PLM SYSTEM TO BRIDGE DEVELOPMENT GAPS AND PROVIDE BETTER SUPPORT TO CONGATEC
           5.3.3 MAGIC LEAP AIMED TO ACE SPATIAL COMPUTING TECHNIQUES USING JABIL’S ADVANCED TECHNOLOGIES AND TOOLS
           5.3.4 ALTOURA ENABLED QANTAS OFFER PILOTS VISUAL TRAINING
           5.3.5 ANSYS HELPED BOSCH REDUCE TIME-TO-MARKET
    5.4 ECOSYSTEM MAPPING 
           FIGURE 17 SPATIAL COMPUTING MARKET: ECOSYSTEM
    5.5 SUPPLY CHAIN ANALYSIS 
           FIGURE 18 SPATIAL COMPUTING MARKET: SUPPLY CHAIN
    5.6 TECHNOLOGY ANALYSIS 
           5.6.1 ARTIFICIAL INTELLIGENCE
           5.6.2 BIG DATA
           5.6.3 INTERNET OF THINGS
           5.6.4 DATA ANALYTICS
           5.6.5 MACHINE LEARNING
           5.6.6 5G TECHNOLOGY
           5.6.7 DEPTH SENSING CAMERAS
           5.6.8 LIDAR SENSORS
           5.6.9 SLAM
           5.6.10 3D MODELING AND VISUALIZATION
           5.6.11 GESTURAL AND VOICE INTERFACES
           5.6.12 HUMAN-COMPUTER INTERACTION
           5.6.13 3D PRINTING
    5.7 PRICING ANALYSIS 
           5.7.1 AVERAGE SELLING PRICE TREND OF KEY PLAYERS, BY HARDWARE
                    TABLE 4 AVERAGE SELLING PRICE OF SPATIAL COMPUTING HEADSETS OFFERED BY KEY PLAYERS
                    FIGURE 19 AVERAGE SELLING PRICE OF MR HEADSETS OFFERED BY KEY PLAYERS,  2023 (USD)
           5.7.2 AVERAGE SELLING PRICE TREND OF KEY PLAYERS, BY SOFTWARE
                    TABLE 5 AVERAGE SELLING PRICE TREND OF SDKS OFFERED BY KEY PLAYERS
                    TABLE 6 AVERAGE SELLING PRICE TREND OF SPATIAL COMPUTING SOFTWARE OFFERED  BY KEY PLAYERS
           5.7.3 AVERAGE SELLING PRICE TREND OF HARDWARE, BY REGION
                    FIGURE 20 AVERAGE SELLING PRICE TREND OF MR DEVICES, BY REGION, 2023 (USD)
    5.8 TRADE ANALYSIS 
           5.8.1 IMPORT SCENARIO
                    TABLE 7 IMPORT DATA, BY COUNTRY, 2017–2021 (USD MILLION)
           5.8.2 EXPORT SCENARIO
                    TABLE 8 EXPORT DATA, BY COUNTRY, 2017–2021 (USD MILLION)
    5.9 BUSINESS MODEL ANALYSIS 
           FIGURE 21 SPATIAL COMPUTING MARKET: BUSINESS MODELS
           5.9.1 BUSINESS MODEL FOR HARDWARE VENDORS
           5.9.2 BUSINESS MODEL FOR SOFTWARE VENDORS
           5.9.3 BUSINESS MODEL FOR SERVICE VENDORS
           5.9.4 REVENUE GENERATION MODELS
           5.9.5 PARTNERSHIPS & ECOSYSTEM
    5.10 PATENT ANALYSIS 
           FIGURE 22 NUMBER OF PATENTS PUBLISHED, 2012–2023
           FIGURE 23 TOP FIVE GLOBAL PATENT OWNERS
           TABLE 9 TOP TEN PATENT OWNERS
           TABLE 10 PATENTS GRANTED TO VENDORS IN SPATIAL COMPUTING MARKET
    5.11 PORTER’S FIVE FORCES ANALYSIS 
                    FIGURE 24 PORTER’S FIVE FORCES ANALYSIS
                    TABLE 11 IMPACT OF PORTER’S FIVE FORCES
           5.11.1 THREAT OF NEW ENTRANTS
           5.11.2 THREAT OF SUBSTITUTES
           5.11.3 BARGAINING POWER OF SUPPLIERS
           5.11.4 BARGAINING POWER OF BUYERS
           5.11.5 INTENSITY OF COMPETITIVE RIVALRY
    5.12 TARIFF & REGULATORY LANDSCAPE 
           5.12.1 TARIFF ANALYSIS
                    TABLE 12 US: MFN TARIFFS FOR HS CODE: 9004 EXPORTED
                    TABLE 13 US: MFN TARIFFS FOR HS CODE: 9004 IMPORTED
           5.12.2 REGULATIONS, BY REGION
                    5.12.2.1 North America
                               TABLE 14 NORTH AMERICA: LIST OF REGULATORY BODIES, GOVERNMENT AGENCIES, AND OTHER ORGANIZATIONS
                    5.12.2.2 Europe
                               TABLE 15 EUROPE: LIST OF REGULATORY BODIES, GOVERNMENT AGENCIES, AND OTHER ORGANIZATIONS
                    5.12.2.3 Asia Pacific
                               TABLE 16 ASIA PACIFIC: LIST OF REGULATORY BODIES, GOVERNMENT AGENCIES, AND OTHER ORGANIZATIONS
                    5.12.2.4 Rest of the World
                               TABLE 17 REST OF THE WORLD: LIST OF REGULATORY BODIES, GOVERNMENT AGENCIES, AND  OTHER ORGANIZATIONS
    5.13 KEY CONFERENCES AND EVENTS 
                    TABLE 18 SPATIAL COMPUTING MARKET: DETAILED LIST OF CONFERENCES AND EVENTS,  2023–2024
    5.14 TRENDS/DISRUPTIONS IMPACTING BUYERS 
                    FIGURE 25 MAJOR YCC TRENDS TO DRIVE FUTURE REVENUE PROSPECTS IN SPATIAL COMPUTING MARKET
    5.15 KEY STAKEHOLDERS AND BUYING CRITERIA 
           5.15.1 KEY STAKEHOLDERS IN BUYING PROCESS
                    FIGURE 26 INFLUENCE OF STAKEHOLDERS ON BUYING PROCESS FOR TOP END USERS
                    TABLE 19 INFLUENCE OF STAKEHOLDERS ON BUYING PROCESS FOR TOP END USER VERTICALS
           5.15.2 BUYING CRITERIA
                    FIGURE 27 KEY BUYING CRITERIA FOR TOP END USER VERTICALS
                    TABLE 20 KEY BUYING CRITERIA FOR TOP END USERS
 
6 SPATIAL COMPUTING MARKET, BY TECHNOLOGY TYPE (Page No. - 102)
    6.1 INTRODUCTION 
           6.1.1 TECHNOLOGY TYPE: SPATIAL COMPUTING MARKET DRIVERS
                    FIGURE 28 MR TECHNOLOGY TO GROW AT HIGHER CAGR DURING FORECAST PERIOD
                    TABLE 21 SPATIAL COMPUTING MARKET, BY TECHNOLOGY TYPE, 2019–2022 (USD MILLION)
                    TABLE 22 SPATIAL COMPUTING MARKET, BY TECHNOLOGY TYPE, 2023–2028 (USD MILLION)
    6.2 AR TECHNOLOGY 
           6.2.1 INCREASE IN ADOPTION OF AR IN ENTERTAINMENT, RETAIL, AND GAMING
                    TABLE 23 AR TECHNOLOGY IN SPATIAL COMPUTING MARKET, BY REGION,  2019–2022 (USD MILLION)
                    TABLE 24 AR TECHNOLOGY IN SPATIAL COMPUTING MARKET, BY REGION,  2023–2028 (USD MILLION)
           6.2.2 MARKER-BASED AR
           6.2.3 MARKERLESS AR
    6.3 VR TECHNOLOGY 
           6.3.1 HIGH TRACTION IN GAMING WITH EXPANSION TO DIVERSE APPLICATIONS
                    TABLE 25 VR TECHNOLOGY IN SPATIAL COMPUTING MARKET, BY REGION,  2019–2022 (USD MILLION)
                    TABLE 26 VR TECHNOLOGY IN SPATIAL COMPUTING MARKET, BY REGION,  2023–2028 (USD MILLION)
           6.3.2 SEMI-IMMERSIVE VR
           6.3.3 FULLY IMMERSIVE VR
    6.4 MR TECHNOLOGY 
           6.4.1 COMBINING PHYSICAL AND DIGITAL ELEMENTS TO AUGMENT HEALTHCARE PROCEDURES WITH MEDICAL VISUALIZATION
                    TABLE 27 MR TECHNOLOGY IN SPATIAL COMPUTING MARKET, BY REGION,  2019–2022 (USD MILLION)
                    TABLE 28 MR TECHNOLOGY IN SPATIAL COMPUTING MARKET, BY REGION,  2023–2028 (USD MILLION)
           6.4.2 OBJECT INTERACTION MR
           6.4.3 DIGITAL OVERLAY MR
 
7 SPATIAL COMPUTING MARKET, BY COMPONENT (Page No. - 111)
    7.1 INTRODUCTION 
           7.1.1 COMPONENT: SPATIAL COMPUTING MARKET DRIVERS
                    FIGURE 29 HARDWARE SEGMENT TO GROW AT HIGHER CAGR DURING FORECAST PERIOD
                    TABLE 29 SPATIAL COMPUTING MARKET, BY COMPONENT, 2019–2022 (USD MILLION)
                    TABLE 30 SPATIAL COMPUTING MARKET, BY COMPONENT, 2023–2028 (USD MILLION)
    7.2 HARDWARE 
           FIGURE 30 MR DEVICES SEGMENT TO GROW AT HIGHEST CAGR DURING FORECAST PERIOD
           TABLE 31 SPATIAL COMPUTING HARDWARE MARKET, BY TYPE, 2019–2022 (USD MILLION)
           TABLE 32 SPATIAL COMPUTING HARDWARE MARKET, BY TYPE, 2023–2028 (USD MILLION)
           TABLE 33 SPATIAL COMPUTING HARDWARE MARKET, BY REGION, 2019–2022 (USD MILLION)
           TABLE 34 SPATIAL COMPUTING HARDWARE MARKET, BY REGION, 2023–2028 (USD MILLION)
           7.2.1 AR DEVICES
                    7.2.1.1 Growth in use of mobile phones for 3D navigation with real-time overlay
                    7.2.1.2 Smartphone-based AR
                    7.2.1.3 AR Glasses
                    7.2.1.4 AR Headsets
                    7.2.1.5 Other AR Devices
                               TABLE 35 AR DEVICES IN SPATIAL COMPUTING HARDWARE MARKET, BY REGION,  2019–2022 (USD MILLION)
                               TABLE 36 AR DEVICES IN SPATIAL COMPUTING HARDWARE MARKET, BY REGION,  2023–2028 (USD MILLION)
           7.2.2 VR DEVICES
                    7.2.2.1 Increased demand for VR HMDs across verticals for different applications
                    7.2.2.2 Tethered VR Headsets
                    7.2.2.3 Standalone VR Headsets
                    7.2.2.4 Smartphone-based VR Headsets
                    7.2.2.5 Other VR Devices
                               TABLE 37 VR DEVICES IN SPATIAL COMPUTING HARDWARE MARKET, BY REGION,  2019–2022 (USD MILLION)
                               TABLE 38 VR DEVICES IN SPATIAL COMPUTING HARDWARE MARKET, BY REGION,  2023–2028 (USD MILLION)
           7.2.3 MR DEVICES
                    7.2.3.1 Ability to visualize and manipulate 3D models in real-time, enhancing spatial understanding
                    7.2.3.2 Smartphone-based MR
                    7.2.3.3 MR Glasses
                    7.2.3.4 MR Headsets
                    7.2.3.5 Other MR Devices
                               TABLE 39 MR DEVICES IN SPATIAL COMPUTING HARDWARE MARKET, BY REGION,  2019–2022 (USD MILLION)
                               TABLE 40 MR DEVICES IN SPATIAL COMPUTING HARDWARE MARKET, BY REGION,  2023–2028 (USD MILLION)
    7.3 SOFTWARE 
           FIGURE 31 TRAINING SIMULATION SOFTWARE TO GROW AT HIGHEST CAGR DURING FORECAST PERIOD
           TABLE 41 SPATIAL COMPUTING SOFTWARE MARKET, BY TYPE, 2019–2022 (USD MILLION)
           TABLE 42 SPATIAL COMPUTING SOFTWARE MARKET, BY TYPE, 2023–2028 (USD MILLION)
           TABLE 43 SPATIAL COMPUTING SOFTWARE MARKET, BY REGION, 2019–2022 (USD MILLION)
           TABLE 44 SPATIAL COMPUTING SOFTWARE MARKET, BY REGION, 2023–2028 (USD MILLION)
           7.3.1 SOFTWARE DEVELOPMENT KIT (SDK)
                    7.3.1.1 Tools and kits to engineer more AR/VR experiences and applications
                               TABLE 45 SOFTWARE DEVELOPMENT KIT IN SPATIAL COMPUTING MARKET, BY REGION,  2019–2022 (USD MILLION)
                               TABLE 46 SOFTWARE DEVELOPMENT KIT IN SPATIAL COMPUTING MARKET, BY REGION,  2023–2028 (USD MILLION)
           7.3.2 GAME ENGINE
                    7.3.2.1 Frameworks to build virtual worlds and immersive gaming adventures
                               TABLE 47 GAME ENGINE IN SPATIAL COMPUTING MARKET, BY REGION, 2019–2022 (USD MILLION)
                               TABLE 48 GAME ENGINE IN SPATIAL COMPUTING MARKET, BY REGION, 2023–2028 (USD MILLION)
           7.3.3 MODELING & VISUALIZATION SOFTWARE
                    7.3.3.1 Designing interactive visual experiences with extreme precision and detail
                               TABLE 49 MODELING & VISUALIZATION SOFTWARE IN SPATIAL COMPUTING MARKET, BY REGION, 2019–2022 (USD MILLION)
                               TABLE 50 MODELING & VISUALIZATION SOFTWARE IN SPATIAL COMPUTING MARKET, BY REGION, 2023–2028 (USD MILLION)
           7.3.4 CONTENT MANAGEMENT SYSTEM (CMS)
                    7.3.4.1 Management of VR and AR multimedia content across multiple platforms
                               TABLE 51 CONTENT MANAGEMENT SYSTEM IN SPATIAL COMPUTING MARKET,  BY REGION, 2019–2022 (USD MILLION)
                               TABLE 52 CONTENT MANAGEMENT SYSTEM IN SPATIAL COMPUTING MARKET, BY REGION,  2023–2028 (USD MILLION)
           7.3.5 TRAINING SIMULATION SOFTWARE
                    7.3.5.1 Simulating realistic training modules to save time and cost
                               TABLE 53 TRAINING SIMULATION SOFTWARE IN SPATIAL COMPUTING MARKET,  BY REGION, 2019–2022 (USD MILLION)
                               TABLE 54 TRAINING SIMULATION SOFTWARE IN SPATIAL COMPUTING MARKET,  BY REGION, 2023–2028 (USD MILLION)
           7.3.6 OTHER SOFTWARE
                    TABLE 55 OTHER SPATIAL COMPUTING SOFTWARE MARKET, BY REGION,  2019–2022 (USD MILLION)
                    TABLE 56 OTHER SPATIAL COMPUTING SOFTWARE MARKET, BY REGION,  2023–2028 (USD MILLION)
    7.4 SERVICES 
           FIGURE 32 MANAGED SERVICES SEGMENT TO GROW AT HIGHER CAGR DURING  FORECAST PERIOD
           TABLE 57 SPATIAL COMPUTING SERVICES MARKET, BY TYPE, 2019–2022 (USD MILLION)
           TABLE 58 SPATIAL COMPUTING SERVICES MARKET, BY TYPE, 2023–2028 (USD MILLION)
           TABLE 59 SPATIAL COMPUTING SERVICES MARKET, BY REGION, 2019–2022 (USD MILLION)
           TABLE 60 SPATIAL COMPUTING SERVICES MARKET, BY REGION, 2023–2028 (USD MILLION)
           7.4.1 PROFESSIONAL SERVICES
                    7.4.1.1 Lack of in-house expertise and increase in complexity of solutions
                               TABLE 61 SPATIAL COMPUTING PROFESSIONAL SERVICES MARKET, BY REGION,  2019–2022 (USD MILLION)
                               TABLE 62 SPATIAL COMPUTING PROFESSIONAL SERVICES MARKET, BY REGION,  2023–2028 (USD MILLION)
                    7.4.1.2 Consulting
                    7.4.1.3 System Integration & Implementation
                    7.4.1.4 Support & Maintenance
           7.4.2 MANAGED SERVICES
                    7.4.2.1 Enabling organizations to focus on core competencies
                               TABLE 63 SPATIAL COMPUTING MANAGED SERVICES MARKET, BY REGION,  2019–2022 (USD MILLION)
                               TABLE 64 SPATIAL COMPUTING MANAGED SERVICES MARKET, BY REGION,  2023–2028 (USD MILLION)
                    7.4.2.2 Security
                    7.4.2.3 Content management
                    7.4.2.4 Performance monitoring
 
8 SPATIAL COMPUTING MARKET, BY VERTICAL (Page No. - 135)
    8.1 INTRODUCTION 
           8.1.1 VERTICAL: SPATIAL COMPUTING MARKET DRIVERS
                    FIGURE 33 TRAVEL & HOSPITALITY TO GROW AT THE HIGHEST CAGR DURING  FORECAST PERIOD
                    TABLE 65 SPATIAL COMPUTING MARKET, BY VERTICAL, 2019–2022 (USD MILLION)
                    TABLE 66 SPATIAL COMPUTING MARKET, BY VERTICAL, 2023–2028 (USD MILLION)
    8.2 MEDIA & ENTERTAINMENT 
           8.2.1 INCREASE IN POPULARITY OF IMMERSIVE GAMING
                    TABLE 67 SPATIAL COMPUTING MARKET IN MEDIA & ENTERTAINMENT, BY REGION,  2019–2022 (USD MILLION)
                    TABLE 68 SPATIAL COMPUTING MARKET IN MEDIA & ENTERTAINMENT, BY REGION,  2023–2028 (USD MILLION)
           8.2.2 MEDIA & ENTERTAINMENT: APPLICATIONS OF SPATIAL COMPUTING
                    8.2.2.1 Gaming
                    8.2.2.2 Sports
                    8.2.2.3 Social Media
                    8.2.2.4 Other Media & Entertainment Applications
    8.3 RETAIL & ECOMMERCE 
           8.3.1 RESTRUCTURING VIRTUAL SHOPPING EXPERIENCES
                    TABLE 69 SPATIAL COMPUTING MARKET IN RETAIL & ECOMMERCE, BY REGION,  2019–2022 (USD MILLION)
                    TABLE 70 SPATIAL COMPUTING MARKET IN RETAIL & ECOMMERCE, BY REGION,  2023–2028 (USD MILLION)
           8.3.2 RETAIL & ECOMMERCE: APPLICATIONS OF SPATIAL COMPUTING
                    8.3.2.1 Jewelry
                    8.3.2.2 Beauty & Cosmetics
                    8.3.2.3 Apparel fitting
                    8.3.2.4 Other Retail & eCommerce Applications
    8.4 MANUFACTURING 
           8.4.1 IMPROVED TRAINING FOR WORKFORCE BY VISUALIZING CONTENT
                    TABLE 71 SPATIAL COMPUTING MARKET IN MANUFACTURING, BY REGION,  2019–2022 (USD MILLION)
                    TABLE 72 SPATIAL COMPUTING MARKET IN MANUFACTURING, BY REGION,  2023–2028 (USD MILLION)
           8.4.2 MANUFACTURING: APPLICATIONS OF SPATIAL COMPUTING
                    8.4.2.1 Digital Factory
                    8.4.2.2 Digital Twin
                    8.4.2.3 Industrial Training
                    8.4.2.4 Other Manufacturing Applications
    8.5 EDUCATION & TRAINING 
           8.5.1 AR/VR LABORATORIES AND MUSEUMS TO OFFER IMMERSIVE LEARNING EXPERIENCES
                    TABLE 73 SPATIAL COMPUTING MARKET IN EDUCATION & TRAINING, BY REGION,  2019–2022 (USD MILLION)
                    TABLE 74 SPATIAL COMPUTING MARKET IN EDUCATION & TRAINING, BY REGION,  2023–2028 (USD MILLION)
           8.5.2 EDUCATION & TRAINING: APPLICATIONS OF SPATIAL COMPUTING
                    8.5.2.1 Immersive Learning
                    8.5.2.2 Training Simulations
                    8.5.2.3 Virtual Field Trips
                    8.5.2.4 Other Education & Training Applications
    8.6 REAL ESTATE 
           8.6.1 AR-BASED INSIGHTS AND PROPERTY TOURS
                    TABLE 75 SPATIAL COMPUTING MARKET IN REAL ESTATE, BY REGION, 2019–2022 (USD MILLION)
                    TABLE 76 SPATIAL COMPUTING MARKET IN REAL ESTATE, BY REGION, 2023–2028 (USD MILLION)
           8.6.2 REAL ESTATE: APPLICATIONS OF SPATIAL COMPUTING
                    8.6.2.1 Virtual Property Tours
                    8.6.2.2 Remote Property Viewing
                    8.6.2.3 Design Visualization & Customization
                    8.6.2.4 Other Applications
    8.7 HEALTHCARE 
           8.7.1 SAVING LIVES, TIME, AND COSTS WITH SPATIAL COMPUTING TECHNOLOGIES
                    TABLE 77 SPATIAL COMPUTING MARKET IN HEALTHCARE, BY REGION, 2019–2022 (USD MILLION)
                    TABLE 78 SPATIAL COMPUTING MARKET IN HEALTHCARE, BY REGION, 2023–2028 (USD MILLION)
           8.7.2 HEALTHCARE: APPLICATIONS OF SPATIAL COMPUTING
                    8.7.2.1 Surgery
                    8.7.2.2 Patient Management
                    8.7.2.3 Medical Training
                    8.7.2.4 Other Healthcare Applications
    8.8 AEROSPACE & DEFENSE 
           8.8.1 IMPROVING SITUATIONAL AWARENESS AND PLANNING EFFECTIVE RESPONSE WITH IMMERSIVE SIMULATIONS
                    TABLE 79 SPATIAL COMPUTING MARKET IN AEROSPACE & DEFENSE, BY REGION,  2019–2022 (USD MILLION)
                    TABLE 80 SPATIAL COMPUTING MARKET IN AEROSPACE & DEFENSE, BY REGION,  2023–2028 (USD MILLION)
           8.8.2 AEROSPACE & DEFENSE: APPLICATIONS OF SPATIAL COMPUTING
                    8.8.2.1 Flight simulations
                    8.8.2.2 Design & prototyping
                    8.8.2.3 Remote assistance & maintenance
                    8.8.2.4 Other aerospace & defense applications
    8.9 TRAVEL & HOSPITALITY 
           8.9.1 USHERING IN ERA OF VIRTUAL TOURISM AND BEFOREHAND TRAVEL EXPERIENCES
                    TABLE 81 SPATIAL COMPUTING MARKET IN TRAVEL & HOSPITALITY, BY REGION,  2019–2022 (USD MILLION)
                    TABLE 82 SPATIAL COMPUTING MARKET IN TRAVEL & HOSPITALITY, BY REGION,  2023–2028 (USD MILLION)
           8.9.2 TRAVEL & HOSPITALITY: APPLICATIONS OF SPATIAL COMPUTING
                    8.9.2.1 Virtual hotel tours
                    8.9.2.2 Virtual theme parks
                    8.9.2.3 Museums, zoos, and other cultural institutions
                    8.9.2.4 Other travel & hospitality applications
    8.10 OTHER VERTICALS 
           TABLE 83 SPATIAL COMPUTING MARKET IN OTHER VERTICALS, BY REGION,  2019–2022 (USD MILLION)
           TABLE 84 SPATIAL COMPUTING MARKET IN OTHER VERTICALS, BY REGION,  2023–2028 (USD MILLION)
 
9 SPATIAL COMPUTING MARKET, BY REGION (Page No. - 160)
    9.1 INTRODUCTION 
           FIGURE 34 ASIA PACIFIC TO GROW AT HIGHEST CAGR DURING FORECAST PERIOD
           TABLE 85 SPATIAL COMPUTING MARKET, BY REGION, 2019–2022 (USD MILLION)
           TABLE 86 SPATIAL COMPUTING MARKET, BY REGION, 2023–2028 (USD MILLION)
    9.2 NORTH AMERICA 
           9.2.1 NORTH AMERICA: SPATIAL COMPUTING MARKET DRIVERS
           9.2.2 NORTH AMERICA: RECESSION IMPACT
                    FIGURE 35 NORTH AMERICA: MARKET SNAPSHOT
                    TABLE 87 NORTH AMERICA: SPATIAL COMPUTING MARKET, BY COMPONENT,  2019–2022 (USD MILLION)
                    TABLE 88 NORTH AMERICA: SPATIAL COMPUTING MARKET, BY COMPONENT,  2023–2028 (USD MILLION)
                    TABLE 89 NORTH AMERICA: SPATIAL COMPUTING HARDWARE MARKET, BY TYPE,  2019–2022 (USD MILLION)
                    TABLE 90 NORTH AMERICA: SPATIAL COMPUTING HARDWARE MARKET, BY TYPE,  2023–2028 (USD MILLION)
                    TABLE 91 NORTH AMERICA: SPATIAL COMPUTING SOFTWARE MARKET, BY TYPE,  2019–2022 (USD MILLION)
                    TABLE 92 NORTH AMERICA: SPATIAL COMPUTING SOFTWARE MARKET, BY TYPE,  2023–2028 (USD MILLION)
                    TABLE 93 NORTH AMERICA: SPATIAL COMPUTING SERVICES MARKET, BY TYPE,  2019–2022 (USD MILLION)
                    TABLE 94 NORTH AMERICA: SPATIAL COMPUTING SERVICES MARKET, BY TYPE,  2023–2028 (USD MILLION)
                    TABLE 95 NORTH AMERICA: SPATIAL COMPUTING MARKET, BY TECHNOLOGY TYPE,  2019–2022 (USD MILLION)
                    TABLE 96 NORTH AMERICA: SPATIAL COMPUTING MARKET, BY TECHNOLOGY TYPE,  2023–2028 (USD MILLION)
                    TABLE 97 NORTH AMERICA: SPATIAL COMPUTING MARKET, BY VERTICAL,  2019–2022 (USD MILLION)
                    TABLE 98 NORTH AMERICA: SPATIAL COMPUTING MARKET, BY VERTICAL,  2023–2028 (USD MILLION)
                    TABLE 99 NORTH AMERICA: SPATIAL COMPUTING MARKET, BY COUNTRY,  2019–2022 (USD MILLION)
                    TABLE 100 NORTH AMERICA: SPATIAL COMPUTING MARKET, BY COUNTRY,  2023–2028 (USD MILLION)
           9.2.3 US
                    9.2.3.1 Convergence of spatial computing with MR, XR to encourage US service providers to scale
                               TABLE 101 US: SPATIAL COMPUTING MARKET, BY COMPONENT, 2019–2022 (USD MILLION)
                               TABLE 102 US: SPATIAL COMPUTING MARKET, BY COMPONENT, 2023–2028 (USD MILLION)
           9.2.4 CANADA
                    9.2.4.1 Emerging startups to provide innovative platforms and solutions
                               TABLE 103 CANADA: SPATIAL COMPUTING MARKET, BY COMPONENT, 2019–2022 (USD MILLION)
                               TABLE 104 CANADA: SPATIAL COMPUTING MARKET, BY COMPONENT, 2023–2028 (USD MILLION)
    9.3 EUROPE 
           9.3.1 EUROPE: SPATIAL COMPUTING MARKET DRIVERS
           9.3.2 EUROPE: RECESSION IMPACT
                    TABLE 105 EUROPE: SPATIAL COMPUTING MARKET, BY COMPONENT,  2019–2022 (USD MILLION)
                    TABLE 106 EUROPE: SPATIAL COMPUTING MARKET, BY COMPONENT,  2023–2028 (USD MILLION)
                    TABLE 107 EUROPE: SPATIAL COMPUTING HARDWARE MARKET, BY TYPE,  2019–2022 (USD MILLION)
                    TABLE 108 EUROPE: SPATIAL COMPUTING HARDWARE MARKET, BY TYPE,  2023–2028 (USD MILLION)
                    TABLE 109 EUROPE: SPATIAL COMPUTING SOFTWARE MARKET, BY TYPE,  2019–2022 (USD MILLION)
                    TABLE 110 EUROPE: SPATIAL COMPUTING SOFTWARE MARKET, BY TYPE,  2023–2028 (USD MILLION)
                    TABLE 111 EUROPE: SPATIAL COMPUTING SERVICES MARKET, BY TYPE,  2019–2022 (USD MILLION)
                    TABLE 112 EUROPE: SPATIAL COMPUTING MARKET, BY TYPE,  2023–2028 (USD MILLION)
                    TABLE 113 EUROPE: SPATIAL COMPUTING MARKET, BY TECHNOLOGY TYPE,  2019–2022 (USD MILLION)
                    TABLE 114 EUROPE: SPATIAL COMPUTING MARKET, BY TECHNOLOGY TYPE,  2023–2028 (USD MILLION)
                    TABLE 115 EUROPE: SPATIAL COMPUTING MARKET, BY VERTICAL,  2019–2022 (USD MILLION)
                    TABLE 116 EUROPE: SPATIAL COMPUTING MARKET, BY VERTICAL, 2023–2028 (USD MILLION)
                    TABLE 117 EUROPE: SPATIAL COMPUTING MARKET, BY COUNTRY,  2019–2022 (USD MILLION)
                    TABLE 118 EUROPE: SPATIAL COMPUTING MARKET, BY COUNTRY,  2023–2028 (USD MILLION)
           9.3.3 UK
                    9.3.3.1 Companies to adopt spatial computing solutions to enhance operational efficiency
                               TABLE 119 UK: SPATIAL COMPUTING MARKET, BY COMPONENT, 2019–2022 (USD MILLION)
                               TABLE 120 UK: SPATIAL COMPUTING MARKET, BY COMPONENT, 2023–2028 (USD MILLION)
           9.3.4 GERMANY
                    9.3.4.1 German spatial computing and telecom companies to witness increased collaborations to build robust solutions
                               TABLE 121 GERMANY: SPATIAL COMPUTING MARKET, BY COMPONENT, 2019–2022 (USD MILLION)
                               TABLE 122 GERMANY: SPATIAL COMPUTING MARKET, BY COMPONENT, 2023–2028 (USD MILLION)
           9.3.5 FRANCE
                    9.3.5.1 Huge investments by global spatial computing providers because of changing customer behavior
                               TABLE 123 FRANCE: SPATIAL COMPUTING MARKET, BY COMPONENT, 2019–2022 (USD MILLION)
                               TABLE 124 FRANCE: SPATIAL COMPUTING MARKET, BY COMPONENT, 2023–2028 (USD MILLION)
           9.3.6 ITALY
                    9.3.6.1 Higher demand for AR/VR-based tourism
                               TABLE 125 FRANCE: SPATIAL COMPUTING MARKET, BY COMPONENT, 2019–2022 (USD MILLION)
                               TABLE 126 FRANCE: SPATIAL COMPUTING MARKET, BY COMPONENT, 2023–2028 (USD MILLION)
           9.3.7 REST OF EUROPE
                    TABLE 127 REST OF EUROPE: SPATIAL COMPUTING MARKET, BY COMPONENT,  2019–2022 (USD MILLION)
                    TABLE 128 REST OF EUROPE: SPATIAL COMPUTING MARKET, BY COMPONENT,  2023–2028 (USD MILLION)
    9.4 ASIA PACIFIC 
           9.4.1 ASIA PACIFIC: SPATIAL COMPUTING MARKET DRIVERS
           9.4.2 ASIA PACIFIC: RECESSION IMPACT
                    FIGURE 36 ASIA PACIFIC: MARKET SNAPSHOT
                    TABLE 129 ASIA PACIFIC: SPATIAL COMPUTING MARKET, BY COMPONENT,  2019–2022 (USD MILLION)
                    TABLE 130 ASIA PACIFIC: SPATIAL COMPUTING MARKET, BY COMPONENT,  2023–2028 (USD MILLION)
                    TABLE 131 ASIA PACIFIC: SPATIAL COMPUTING HARDWARE MARKET, BY TYPE,  2019–2022 (USD MILLION)
                    TABLE 132 ASIA PACIFIC: SPATIAL COMPUTING HARDWARE MARKET, BY TYPE,  2023–2028 (USD MILLION)
                    TABLE 133 ASIA PACIFIC: SPATIAL COMPUTING SOFTWARE MARKET, BY TYPE,  2019–2022 (USD MILLION)
                    TABLE 134 ASIA PACIFIC: SPATIAL COMPUTING SOFTWARE MARKET, BY TYPE,  2023–2028 (USD MILLION)
                    TABLE 135 ASIA PACIFIC: SPATIAL COMPUTING SERVICES MARKET, BY TYPE,  2019–2022 (USD MILLION)
                    TABLE 136 ASIA PACIFIC: SPATIAL COMPUTING MARKET, BY TYPE,  2023–2028 (USD MILLION)
                    TABLE 137 ASIA PACIFIC: SPATIAL COMPUTING MARKET, BY TECHNOLOGY TYPE,  2019–2022 (USD MILLION)
                    TABLE 138 ASIA PACIFIC: SPATIAL COMPUTING MARKET, BY TECHNOLOGY TYPE,  2023–2028 (USD MILLION)
                    TABLE 139 ASIA PACIFIC: SPATIAL COMPUTING MARKET, BY VERTICAL, 2019–2022 (USD MILLION)
                    TABLE 140 ASIA PACIFIC: SPATIAL COMPUTING MARKET, BY VERTICAL, 2023–2028 (USD MILLION)
                    TABLE 141 ASIA PACIFIC: SPATIAL COMPUTING MARKET, BY COUNTRY,  2019–2022 (USD MILLION)
                    TABLE 142 ASIA PACIFIC: SPATIAL COMPUTING MARKET, BY COUNTRY,  2023–2028 (USD MILLION)
           9.4.3 CHINA
                    9.4.3.1 Adoption of spatial computing in China to help achieve resiliency and scalability
                               TABLE 143 CHINA: SPATIAL COMPUTING MARKET, BY COMPONENT, 2019–2022 (USD MILLION)
                               TABLE 144 CHINA: SPATIAL COMPUTING MARKET, BY COMPONENT, 2023–2028 (USD MILLION)
           9.4.4 JAPAN
                    9.4.4.1 Focus on cloud systems, IoT, and spatial computing with growing competitiveness in automotive and industrial robots industries
                               TABLE 145 JAPAN: SPATIAL COMPUTING MARKET, BY COMPONENT, 2019–2022 (USD MILLION)
                               TABLE 146 JAPAN: SPATIAL COMPUTING MARKET, BY COMPONENT, 2023–2028 (USD MILLION)
           9.4.5 AUSTRALIA & NEW ZEALAND
                    9.4.5.1 Initiatives by governments and startups toward technology adoption
                               TABLE 147 AUSTRALIA & NEW ZEALAND: SPATIAL COMPUTING MARKET, BY COMPONENT,  2019–2022 (USD MILLION)
                               TABLE 148 AUSTRALIA & NEW ZEALAND: SPATIAL COMPUTING MARKET, BY COMPONENT,  2023–2028 (USD MILLION)
           9.4.6 SOUTH KOREA
                    9.4.6.1 Immense investments across verticals, especially gaming, healthcare, and military
                               TABLE 149 SOUTH KOREA: SPATIAL COMPUTING MARKET, BY COMPONENT,  2019–2022 (USD MILLION)
                               TABLE 150 SOUTH KOREA: SPATIAL COMPUTING MARKET, BY COMPONENT,  2023–2028 (USD MILLION)
           9.4.7 REST OF ASIA PACIFIC
                    TABLE 151 REST OF ASIA PACIFIC: SPATIAL COMPUTING MARKET, BY COMPONENT,  2019–2022 (USD MILLION)
                    TABLE 152 REST OF ASIA PACIFIC: SPATIAL COMPUTING MARKET, BY COMPONENT,  2023–2028 (USD MILLION)
    9.5 MIDDLE EAST & AFRICA 
           9.5.1 MIDDLE EAST & AFRICA: SPATIAL COMPUTING MARKET DRIVERS
           9.5.2 MIDDLE EAST & AFRICA: RECESSION IMPACT
                    TABLE 153 MIDDLE EAST & AFRICA: SPATIAL COMPUTING MARKET, BY COMPONENT,  2019–2022 (USD MILLION)
                    TABLE 154 MIDDLE EAST & AFRICA: SPATIAL COMPUTING MARKET, BY COMPONENT,  2023–2028 (USD MILLION)
                    TABLE 155 MIDDLE EAST & AFRICA: SPATIAL COMPUTING HARDWARE MARKET, BY TYPE,  2019–2022 (USD MILLION)
                    TABLE 156 MIDDLE EAST & AFRICA: SPATIAL COMPUTING HARDWARE MARKET, BY TYPE,  2023–2028 (USD MILLION)
                    TABLE 157 MIDDLE EAST & AFRICA: SPATIAL COMPUTING SOFTWARE MARKET, BY TYPE,  2019–2022 (USD MILLION)
                    TABLE 158 MIDDLE EAST & AFRICA: SPATIAL COMPUTING SOFTWARE MARKET, BY TYPE,  2023–2028 (USD MILLION)
                    TABLE 159 MIDDLE EAST & AFRICA: SPATIAL COMPUTING SERVICES MARKET, BY TYPE,  2019–2022 (USD MILLION)
                    TABLE 160 MIDDLE EAST & AFRICA: SPATIAL COMPUTING MARKET, BY TYPE,  2023–2028 (USD MILLION)
                    TABLE 161 MIDDLE EAST & AFRICA: SPATIAL COMPUTING MARKET, BY TECHNOLOGY TYPE,  2019–2022 (USD MILLION)
                    TABLE 162 MIDDLE EAST & AFRICA: SPATIAL COMPUTING MARKET, BY TECHNOLOGY TYPE,  2023–2028 (USD MILLION)
                    TABLE 163 MIDDLE EAST & AFRICA: SPATIAL COMPUTING MARKET, BY VERTICAL,  2019–2022 (USD MILLION)
                    TABLE 164 MIDDLE EAST & AFRICA: SPATIAL COMPUTING MARKET, BY VERTICAL,  2023–2028 (USD MILLION)
                    TABLE 165 MIDDLE EAST & AFRICA: SPATIAL COMPUTING MARKET, BY COUNTRY,  2019–2022 (USD MILLION)
                    TABLE 166 MIDDLE EAST & AFRICA: SPATIAL COMPUTING MARKET, BY COUNTRY,  2023–2028 (USD MILLION)
           9.5.3 SAUDI ARABIA
                    9.5.3.1 Increase in purchasing power and inclination toward advanced technologies
                               TABLE 167 SAUDI ARABIA: SPATIAL COMPUTING MARKET, BY COMPONENT,  2019–2022 (USD MILLION)
                               TABLE 168 SAUDI ARABIA: SPATIAL COMPUTING MARKET, BY COMPONENT,  2023–2028 (USD MILLION)
           9.5.4 UAE
                    9.5.4.1 IT resource deployment, intelligent storage services, and remote monitoring capabilities
                               TABLE 169 UAE: SPATIAL COMPUTING MARKET, BY COMPONENT, 2019–2022 (USD MILLION)
                               TABLE 170 UAE: SPATIAL COMPUTING MARKET, BY COMPONENT, 2023–2028 (USD MILLION)
           9.5.5 REST OF MIDDLE EAST & AFRICA
                    TABLE 171 REST OF MIDDLE EAST & AFRICA: SPATIAL COMPUTING MARKET, BY COMPONENT,  2019–2022 (USD MILLION)
                    TABLE 172 REST OF MIDDLE EAST & AFRICA: SPATIAL COMPUTING MARKET, BY COMPONENT,  2023–2028 (USD MILLION)
    9.6 LATIN AMERICA 
           9.6.1 LATIN AMERICA: SPATIAL COMPUTING MARKET DRIVERS
           9.6.2 LATIN AMERICA: RECESSION IMPACT
                    TABLE 173 LATIN AMERICA: SPATIAL COMPUTING MARKET, BY COMPONENT,  2019–2022 (USD MILLION)
                    TABLE 174 LATIN AMERICA: SPATIAL COMPUTING MARKET, BY COMPONENT,  2023–2028 (USD MILLION)
                    TABLE 175 LATIN AMERICA: SPATIAL COMPUTING HARDWARE MARKET, BY TYPE,  2019–2022 (USD MILLION)
                    TABLE 176 LATIN AMERICA: SPATIAL COMPUTING HARDWARE MARKET, BY TYPE,  2023–2028 (USD MILLION)
                    TABLE 177 LATIN AMERICA: SPATIAL COMPUTING SOFTWARE MARKET, BY TYPE,  2019–2022 (USD MILLION)
                    TABLE 178 LATIN AMERICA: SPATIAL COMPUTING SOFTWARE MARKET, BY TYPE,  2023–2028 (USD MILLION)
                    TABLE 179 LATIN AMERICA: SPATIAL COMPUTING SERVICES MARKET, BY TYPE,  2019–2022 (USD MILLION)
                    TABLE 180 LATIN AMERICA: SPATIAL COMPUTING SERVICES MARKET, BY TYPE,  2023–2028 (USD MILLION)
                    TABLE 181 LATIN AMERICA: SPATIAL COMPUTING MARKET, BY TECHNOLOGY TYPE,  2019–2022 (USD MILLION)
                    TABLE 182 LATIN AMERICA: SPATIAL COMPUTING MARKET, BY TECHNOLOGY TYPE,  2023–2028 (USD MILLION)
                    TABLE 183 LATIN AMERICA: SPATIAL COMPUTING MARKET, BY VERTICAL,  2019–2022 (USD MILLION)
                    TABLE 184 LATIN AMERICA: SPATIAL COMPUTING MARKET, BY VERTICAL,  2023–2028 (USD MILLION)
                    TABLE 185 LATIN AMERICA: SPATIAL COMPUTING MARKET, BY COUNTRY,  2019–2022 (USD MILLION)
                    TABLE 186 LATIN AMERICA: SPATIAL COMPUTING MARKET, BY COUNTRY,  2023–2028 (USD MILLION)
           9.6.3 BRAZIL
                    9.6.3.1 Rise in technology assimilation among enterprises and consumers
                               TABLE 187 BRAZIL: SPATIAL COMPUTING MARKET, BY COMPONENT, 2019–2022 (USD MILLION)
                               TABLE 188 BRAZIL: SPATIAL COMPUTING MARKET, BY COMPONENT, 2023–2028 (USD MILLION)
           9.6.4 MEXICO
                    9.6.4.1 Emerging 3D integrated industries, AR, VR, and advanced technologies embedded industries
                               TABLE 189 MEXICO: SPATIAL COMPUTING MARKET, BY COMPONENT, 2019–2022 (USD MILLION)
                               TABLE 190 MEXICO: SPATIAL COMPUTING MARKET, BY COMPONENT, 2023–2028 (USD MILLION)
           9.6.5 REST OF LATIN AMERICA
                    TABLE 191 REST OF LATIN AMERICA: SPATIAL COMPUTING MARKET, BY COMPONENT,  2019–2022 (USD MILLION)
                    TABLE 192 REST OF LATIN AMERICA: SPATIAL COMPUTING MARKET, BY COMPONENT,   2023–2028 (USD MILLION)
 
10 COMPETITIVE LANDSCAPE (Page No. - 209)
     10.1 OVERVIEW 
     10.2 STRATEGIES ADOPTED BY KEY PLAYERS/RIGHT TO WIN 
               TABLE 193 OVERVIEW OF STRATEGIES ADOPTED BY KEY SPATIAL COMPUTING VENDORS
     10.3 REVENUE ANALYSIS 
               FIGURE 37 HISTORICAL FIVE-YEAR REVENUE ANALYSIS OF LEADING PLAYERS,  2018–2022 (USD BILLION)
     10.4 COMPANY FINANCIAL METRICS 
               FIGURE 38 TRADING COMPARABLES, 2023 (EV/EBITDA)
     10.5 GLOBAL SNAPSHOT OF KEY MARKET PARTICIPANTS 
               FIGURE 39 SPATIAL COMPUTING MARKET: GLOBAL SNAPSHOT OF KEY MARKET PARTICIPANTS, 2022
     10.6 MARKET SHARE ANALYSIS 
               FIGURE 40 SPATIAL COMPUTING MARKET SHARE ANALYSIS, 2022
               TABLE 194 SPATIAL COMPUTING MARKET: DEGREE OF COMPETITION
     10.7 COMPARISON OF VENDOR PRODUCTS/BRANDS 
               TABLE 195 VENDOR PRODUCT/BRAND COMPARISON
     10.8 COMPANY EVALUATION MATRIX 
               FIGURE 41 COMPANY EVALUATION MATRIX FOR KEY PLAYERS: CRITERIA WEIGHTAGE
             10.8.1 STARS
             10.8.2 EMERGING LEADERS
             10.8.3 PERVASIVE PLAYERS
             10.8.4 PARTICIPANTS
                       FIGURE 42 SPATIAL COMPUTING MARKET: KEY COMPANY EVALUATION MATRIX, 2022
             10.8.5 COMPANY PRODUCT FOOTPRINT ANALYSIS
                       TABLE 196 KEY COMPANY FOOTPRINT
     10.9 STARTUP/SME EVALUATION MATRIX 
               FIGURE 43 STARTUP/SME EVALUATION MATRIX: CRITERIA WEIGHTAGE
             10.9.1 PROGRESSIVE COMPANIES
             10.9.2 RESPONSIVE COMPANIES
             10.9.3 DYNAMIC COMPANIES
             10.9.4 STARTING BLOCKS
                       FIGURE 44 SPATIAL COMPUTING MARKET: STARTUP/SME EVALUATION MATRIX, 2022
             10.9.5 COMPETITIVE BENCHMARKING
                       TABLE 197 SPATIAL COMPUTING MARKET: DETAILED LIST OF KEY STARTUP/SMES
                       TABLE 198 STARTUP/SME FOOTPRINT
     10.1 KEY MARKET DEVELOPMENTS 
               10.10.1 PRODUCT LAUNCHES & ENHANCEMENTS
                       TABLE 199 PRODUCT LAUNCHES & ENHANCEMENTS, 2020–2023
               10.10.2 DEALS
                       TABLE 200 DEALS, 2020–2023
 
11 COMPANY PROFILES (Page No. - 229)
(Business overview, Products/Services/Solutions offered, Recent Developments, MNM view)*
     11.1 INTRODUCTION 
     11.2 KEY PLAYERS 
             11.2.1 META (FACEBOOK)
                       TABLE 201 META: BUSINESS OVERVIEW
                       FIGURE 45 META: COMPANY SNAPSHOT
                       TABLE 202 META: PRODUCTS OFFERED
                       TABLE 203 META: PRODUCT LAUNCHES
                       TABLE 204 META: DEALS
             11.2.2 MICROSOFT
                       TABLE 205 MICROSOFT: BUSINESS OVERVIEW
                       FIGURE 46 MICROSOFT: COMPANY SNAPSHOT
                       TABLE 206 MICROSOFT: PRODUCTS OFFERED
                       TABLE 207 MICROSOFT: PRODUCT LAUNCHES
                       TABLE 208 MICROSOFT: DEALS
             11.2.3 APPLE
                       TABLE 209 APPLE: BUSINESS OVERVIEW
                       FIGURE 47 APPLE: COMPANY SNAPSHOT
                       TABLE 210 APPLE: PRODUCTS/SOLUTIONS/SERVICES OFFERED
                       TABLE 211 APPLE: PRODUCT LAUNCHES
                       TABLE 212 APPLE: DEALS
             11.2.4 SONY
                       TABLE 213 SONY: BUSINESS OVERVIEW
                       FIGURE 48 SONY: COMPANY SNAPSHOT
                       TABLE 214 SONY: PRODUCTS/SOLUTIONS/SERVICES OFFERED
                       TABLE 215 SONY: PRODUCT LAUNCHES
                       TABLE 216 SONY: DEALS
             11.2.5 QUALCOMM
                       TABLE 217 QUALCOMM: BUSINESS OVERVIEW
                       FIGURE 49 QUALCOMM: COMPANY SNAPSHOT
                       TABLE 218 QUALCOMM: PRODUCTS/SOLUTIONS/SERVICES OFFERED
                       TABLE 219 QUALCOMM: DEALS
                       TABLE 220 QUALCOMM: OTHERS
             11.2.6 GOOGLE
                       TABLE 221 GOOGLE: BUSINESS OVERVIEW
                       FIGURE 50 GOOGLE: COMPANY SNAPSHOT
                       TABLE 222 GOOGLE: PRODUCTS/SOLUTIONS/SERVICES OFFERED
                       TABLE 223 GOOGLE: PRODUCT LAUNCHES
                       TABLE 224 GOOGLE: DEALS
             11.2.7 SAMSUNG
                       TABLE 225 SAMSUNG: BUSINESS OVERVIEW
                       FIGURE 51 SAMSUNG: COMPANY SNAPSHOT
                       TABLE 226 SAMSUNG: PRODUCTS/SOLUTIONS/SERVICES OFFERED
                       TABLE 227 SAMSUNG: PRODUCT LAUNCHES
                       TABLE 228 SAMSUNG: DEALS
             11.2.8 EPSON
                       TABLE 229 EPSON: BUSINESS OVERVIEW
                       FIGURE 52 EPSON: COMPANY SNAPSHOT
                       TABLE 230 EPSON: PRODUCTS/SOLUTIONS/SERVICES OFFERED
                       TABLE 231 EPSON: PRODUCT LAUNCHES
                       TABLE 232 EPSON: DEALS
             11.2.9 PTC
                       TABLE 233 PTC: BUSINESS OVERVIEW
                       FIGURE 53 PTC: COMPANY SNAPSHOT
                       TABLE 234 PTC: PRODUCTS/SOLUTIONS/SERVICES OFFERED
                       TABLE 235 PTC: PRODUCT LAUNCHES
                       TABLE 236 PTC: DEALS
             11.2.10 EPIC GAMES
                       TABLE 237 EPIC GAMES: BUSINESS OVERVIEW
                       TABLE 238 EPIC GAMES: PRODUCTS OFFERED
                       TABLE 239 EPIC GAMES: PRODUCT LAUNCHES
                       TABLE 240 EPIC GAMES: DEALS
     11.3 OTHER PLAYERS 
             11.3.1 MAGIC LEAP
             11.3.2 HTC
             11.3.3 LENOVO
             11.3.4 INTEL
             11.3.5 NVIDIA
             11.3.6 EON REALITY
             11.3.7 ULTRALEAP
             11.3.8 VUZIX
             11.3.9 VARJO
             11.3.10 ZAPPAR
             11.3.11 TAQTILE
             11.3.12 BLIPPAR
             11.3.13 3D CLOUD BY MARXENT
             11.3.14 4EXPERIENCE
             11.3.15 AVEGANT
*Details on Business overview, Products/Services/Solutions offered, Recent Developments, MNM view might not be captured in case of unlisted companies.
 
12 ADJACENT AND RELATED MARKETS (Page No. - 282)
     12.1 INTRODUCTION 
             12.1.1 RELATED MARKETS
     12.2 AR VR SOFTWARE MARKET 
               TABLE 241 AR VR SOFTWARE MARKET, BY TECHNOLOGY TYPE, 2017–2022 (USD MILLION)
               TABLE 242 AR VR SOFTWARE MARKET, BY TECHNOLOGY TYPE, 2023–2028 (USD MILLION)
               TABLE 243 AR VR SOFTWARE MARKET, BY SOFTWARE TYPE, 2017–2022 (USD MILLION)
               TABLE 244 AR VR SOFTWARE MARKET, BY SOFTWARE TYPE, 2023–2028 (USD MILLION)
               TABLE 245 AR VR SOFTWARE MARKET, BY VERTICAL, 2017–2022 (USD MILLION)
               TABLE 246 AR VR SOFTWARE MARKET, BY VERTICAL, 2023–2028 (USD MILLION)
               TABLE 247 AR VR SOFTWARE MARKET, BY REGION, 2017–2022 (USD MILLION)
               TABLE 248 AR VR SOFTWARE MARKET, BY REGION, 2023–2028 (USD MILLION)
     12.3 METAVERSE MARKET 
               TABLE 249 METAVERSE MARKET, BY COMPONENT, 2018–2021 (USD BILLION)
               TABLE 250 METAVERSE MARKET, BY COMPONENT, 2022–2027 (USD BILLION)
               TABLE 251 METAVERSE MARKET, BY VERTICAL, 2018–2021 (USD BILLION)
               TABLE 252 METAVERSE MARKET, BY VERTICAL, 2022–2027 (USD BILLION)
               TABLE 253 METAVERSE MARKET, BY REGION, 2018–2021 (USD BILLION)
               TABLE 254 METAVERSE MARKET, BY REGION, 2022–2027 (USD BILLION)
 
13 APPENDIX (Page No. - 288)
     13.1 DISCUSSION GUIDE 
     13.2 KNOWLEDGESTORE: MARKETSANDMARKETS’  SUBSCRIPTION PORTAL 
     13.3 CUSTOMIZATION OPTIONS 
     13.4 RELATED REPORTS 
     13.5 AUTHOR DETAILS 

The study involved four major activities in estimating the current market size of the Spatial computing market. We performed extensive secondary research to collect information on the market, the competitive market, and the parent market. The next step was to validate these findings, assumptions, and sizing with industry experts across the value chain through primary research. Both top-down and bottom-up approaches were employed to estimate the complete market size. After that, we used the market breakup and data triangulation procedures to estimate the market size of the various segments in the Spatial computing market.

Secondary Research

This research study used extensive secondary sources, directories, and databases, such as D&B Hoovers, DiscoverOrg, Factiva, vendor data sheets, product demos, Cloud Computing Association (CCA), Vendor Surveys, Asia Cloud Computing Association, and The Software Alliance. We referred to sources for identifying and collecting valuable information for this technical, market-oriented, and commercial study of the Spatial computing market.

Primary Research

Primary sources were several industry experts from the core and related industries, preferred software providers, hardware manufacturers, distributors, service providers, technology developers, alliances, and organizations related to all segments of the industry’s value chain. In-depth interviews were conducted with primary respondents, including key industry participants, subject-matter experts, C-level executives of key market players, and industry consultants, to obtain and verify critical qualitative and quantitative information and assess the market’s prospects.

We conducted primary interviews to gather insights, such as market statistics, the latest trends disrupting the market, new use cases implemented, data on revenue collected from products and services, market breakups, market size estimations, market forecasts, and data triangulation. Primary research also helped understand various technology trends, segmentation types, industry trends, and regions. Demand-side stakeholders, such as Chief Executive Officers (CEOs), Chief Information Officers (CIOs), Chief Technology Officers (CTOs), Vice Presidents (VPs), and Chief Security Officers (CSOs); the installation teams of governments/end users using asset performance management; and digital initiatives project teams, were interviewed to understand the buyer’s perspective on suppliers, products, service providers, and their current use of services, which would affect the overall Spatial computing market.

Spatial Computing Market Size, and Share

To know about the assumptions considered for the study, download the pdf brochure

Spatial Computing Market Size Estimation

We used top-down and bottom-up approaches to estimate and forecast the Spatial computing market and other dependent submarkets. The bottom-up procedure helped arrive at the overall market size using the revenues and offerings of key companies in the market. With data triangulation methods and validation through primary interviews, this study determined and confirmed the exact value of the overall parent market size. We used the overall market size in the top-down procedure to estimate the size of other individual markets via percentage splits of the market segments.

The bottom-up approach identified the trend of Spatial computing adoption among industry verticals in critical countries that contribute the most to the market. The adoption trend of asset performance management and varying cases of use concerning their business segments were identified and extrapolated for cross-validation. We gave weightage to the use cases identified in different solution areas for the calculation. We prepared an exhaustive list of all vendors offering Spatial computing in the market. We estimated the revenue contribution of all vendors in the market through annual reports, press releases, funding, investor presentations, paid databases, and primary interviews. We evaluated each vendor based on its service offerings across verticals. We extrapolated the aggregate of all companies’ revenue to reach the overall market size. Each subsegment was studied and analyzed for its market size and regional penetration. Based on these numbers, we determined the region split through primary and secondary sources.

The top-down approach prepared an exhaustive list of all vendors in the Spatial computing market. We estimated the revenue contribution of all vendors in the market through their annual reports, press releases, funding, investor presentations, paid databases, and primary interviews. We estimated the market size from revenues generated by vendors from different Spatial computing offerings. We identified other vendors and revenue generated from each service type with the help of secondary and primary sources and combined them to determine the market size. Further, the procedure included an analysis of the Spatial computing market’s regional penetration. With the data triangulation procedure and data validation through primaries, the exact values of the overall Spatial computing market size and its segments’ market size were determined and confirmed using the study. The primary procedure included extensive interviews for key insights from industry leaders, such as CEOs, CTOs, CIOs, VPs, directors, and marketing executives. We further triangulated market numbers with the existing MarketsandMarkets repository for validation.

Spatial computing Market: Top-Down and Bottom-Up approaches

Spatial Computing Market Size, and Share

To know about the assumptions considered for the study, Request for Free Sample Report

Data Triangulation

After arriving at the overall market size, the market was split into several segments and subsegments—using the market size estimation processes as explained above. To complete the overall market engineering process and arrive at the exact statistics of each market segment and subsegment, data triangulation and market breakup procedures were employed, wherever applicable. The data was triangulated by studying several factors and trends from the Spatial computing market’s demand and supply sides.


Market Definition

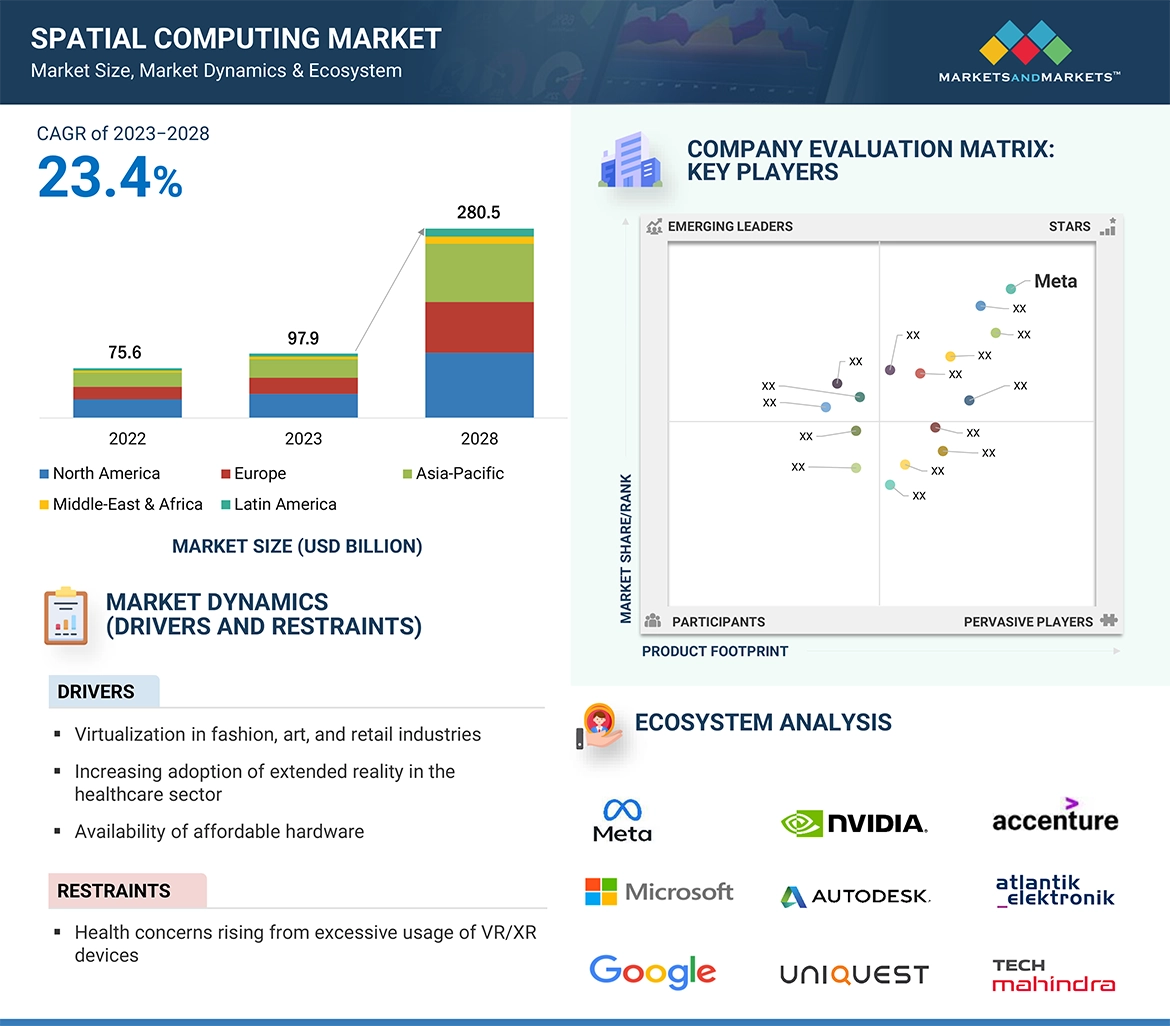
Considering the views of various sources and associations on spatial computing, MarketsandMarkets defines spatial computing as “a technology that blends the physical and digital worlds by integrating digital information and experiences into the physical environment. It encompasses a range of technologies and techniques, including augmented reality (AR), virtual reality (VR), mixed reality (MR), and various sensor technologies. In Spatial Computing, digital information and virtual objects are overlaid onto the real world, allowing users to interact with and manipulate them as if they were part of the physical environment. This technology often relies on devices such as head-mounted displays, smartphones, or smart glasses to provide users with immersive and interactive experiences.”

Key Stakeholders

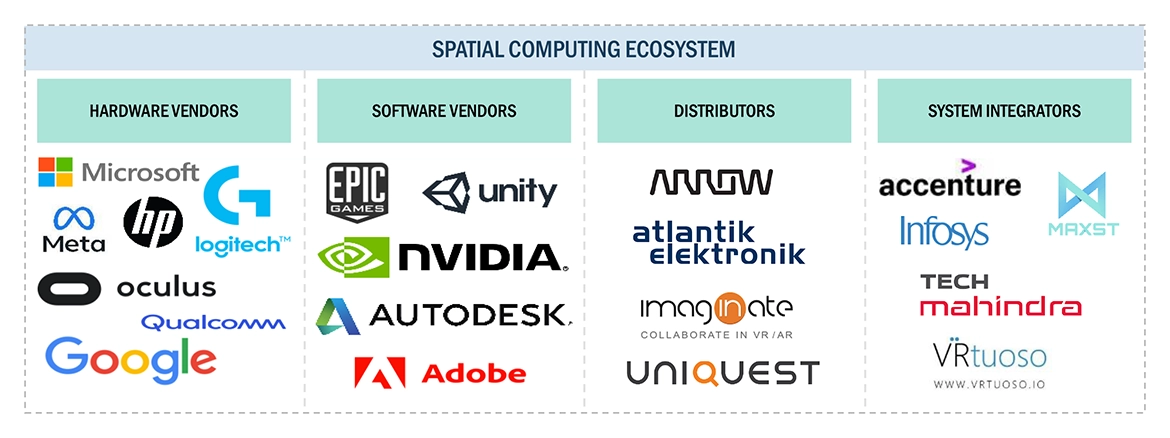
  • Spatial Computing hardware and software providers
  • Augmented reality (AR), virtual reality (VR), and mixed reality (MR) device manufacturers
  • Professional service providers and consulting companies
  • Raw material suppliers
  • Semiconductor foundries
  • Original Equipment Manufacturers (OEM)
  • Government organizations, forums, alliances, and associations
  • System Integrators (SIs)
  • Value-added Resellers (VARs)
  • Research organizations
  • Technology standard organizations, forums, alliances, and associations
  • Technology investors
  • End-use verticals

Report Objectives

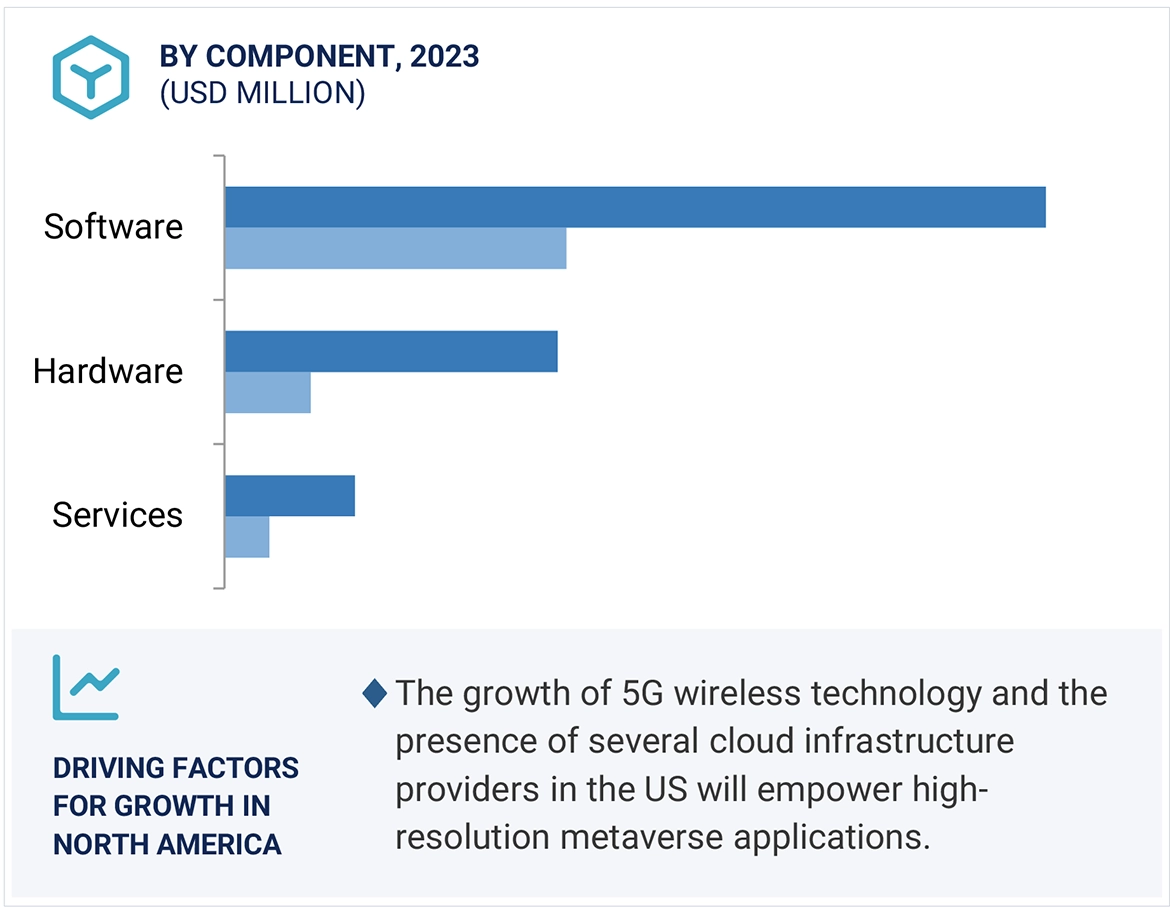
  • To define, describe, and forecast the global spatial computing market based on component, technology type, vertical, and region.
  • To forecast the market size of the five major regional segments: North America, Europe, Asia Pacific, Middle East & Africa, and Latin America
  • To strategically analyze the market subsegments with respect to individual growth trends, prospects, and contributions to the total market
  • To provide detailed information related to the major factors influencing the growth of the market (drivers, restraints, opportunities, and challenges)
  • To strategically analyze macro and micromarkets1 with respect to growth trends, prospects, and their contributions to the overall market
  • To analyze industry trends, patents and innovations, and pricing data related to the spatial computing market.
  • To analyze the opportunities in the market for stakeholders and provide details of the competitive landscape for major players.
  • To profile key players in the market and comprehensively analyze their market share/ranking and core competencies
  • To track and analyze competitive developments, such as mergers & acquisitions, product developments, and partnerships & collaborations in the market.

Note 1. Micromarkets are defined as the further segments and subsegments of the market included in the report.
Note 2. The companies’ Core competencies are captured in terms of their key developments and essential strategies to sustain their position in the market.

Available Customizations

With the given market data, MarketsandMarkets offers customizations per the company’s specific needs. The following customization options are available for the report:

Product Analysis

  • The product matrix provides a detailed comparison of the product portfolio of each company.

Geographic Analysis

  • Further breakup of the Asia Pacific market into countries contributing 75% to the regional market size
  • Further breakup of the North American market into countries contributing 75% to the regional market size
  • Further breakup of the Latin American market into countries contributing 75% to the regional market size
  • Further breakup of the Middle Eastern & African market into countries contributing 75% to the regional market size
  • Further breakup of the European market into countries contributing 75% to the regional market size

Company Information

  • Detailed analysis and profiling of additional market players (up to 5)
Custom Market Research Services

We will customize the research for you, in case the report listed above does not meet with your exact requirements. Our custom research will comprehensively cover the business information you require to help you arrive at strategic and profitable business decisions.

Request Customization
Report Code
TC 8839
Published ON
Nov, 2023
Choose License Type
BUY NOW
  • SHARE
X
Request Customization
Speak to Analyst
Speak to Analyst
OR FACE-TO-FACE MEETING
PERSONALIZE THIS RESEARCH
  • Triangulate with your Own Data
  • Get Data as per your Format and Definition
  • Gain a Deeper Dive on a Specific Application, Geography, Customer or Competitor
  • Any level of Personalization
REQUEST A FREE CUSTOMIZATION
LET US HELP YOU!
  • What are the Known and Unknown Adjacencies Impacting the Spatial Computing Market
  • What will your New Revenue Sources be?
  • Who will be your Top Customer; what will make them switch?
  • Defend your Market Share or Win Competitors
  • Get a Scorecard for Target Partners
CUSTOMIZED WORKSHOP REQUEST
+1-888-600-6441
  • Call Us
  • +1-888-600-6441 (Corporate office hours)
  • +1-888-600-6441 (US/Can toll free)
  • +44-800-368-9399 (UK office hours)
CONNECT WITH US
ABOUT TRUST ONLINE
©2024 MarketsandMarkets Research Private Ltd. All rights reserved
DMCA.com Protection Status Website Feedback