Synthetic Fuels Market

Synthetic Fuels Market by Fuel Type (Methanol to liquid (MTL), Power to liquid (PTL), Gas to liquid (GTL)), Application (Gasoline, Diesel, Kerosene), End Use (Transportation, Industrial, Chemical ), and Region - Global Forecast to 2030

Report Code: CH 8814 Oct, 2023, by marketsandmarkets.com

Updated on : April 23, 2024

Synthetic Fuels Market

The global synthetic fuels market was valued at USD 48.4 billion in 2023 and is projected to reach USD 70.1 billion by 2030, growing at 5.4% cagr from 2023 to 2030. The push for carbon neutrality and decarbonization in various sectors, including automotive, transportation, and heavy industry, is driving interest in synthetic fuels. Synthetic fuels offer a way to reduce emissions and transition away from fossil fuels, which propels the market expansion.

Attractive Opportunities in the Synthetic Fuels Market

Synthetic Fuels Market

To know about the assumptions considered for the study, Request for Free Sample Report

Synthetic Fuels Market

Synthetic Fuels Market Dynamics

Driver: Investment from private players boosting research and development

As the world seeks sustainable energy alternatives to combat climate change and enhance energy security, private players have emerged as crucial contributors to the growth and innovation in this sector. For instance, Sunfire, a German energy technology company, received private funding to scale up its power-to-liquids technology, demonstrating the potential for synthetic fuel commercialization. These investments from private players are expected to boost the synthetic fuel market during the forecast period.

Restraint: High cost of synthetic fuel

While synthetic fuels offer promising solutions for reducing greenhouse gas emissions and enhancing energy security, the high cost of production remains a significant restraint on the growth of the synthetic fuels market. . Building facilities for synthetic fuel production, especially those employing advanced technologies like carbon capture, gasification, and Fischer-Tropsch synthesis, requires substantial capital investment. Thus, higher pricing of synthetic fuel is expected to hamper the growth of market.

Opportunity: High potential of different applications of synthetic fuels

The synthetic fuels market is poised for significant growth, driven by the high potential of various applications that extend beyond traditional transportation fuels. For instance, United Airlines, Inc. is a major American airline has committed to using sustainable aviation fuels (SAFs) to reduce its carbon footprint, signaling a growing demand for synthetic aviation fuels.

Challenge: Difficulty in achieving economies of scale in synthetic fuel production

One of the significant challenges facing the synthetic fuels market is the difficulty in achieving economies of scale in production.  Smaller-scale synthetic fuel production facilities often experience higher unit production costs, making it challenging to compete with larger, more established facilities. These factors act as a challenge to the further growth of synthetic fuel market.

Synthetic Fuels Market Ecosystem

Prominent companies in this market include well-established, and financially stable manufacturers of synthetic fuels. These companies have been operating in the market for several years and possess a diversified product portfolio and strong global sales and marketing networks. Prominent companies in this market include Shell (UK), SASOL (South Africa), CHN Energy Investment Group Co., Ltd. (China), Chevron Renewable Energy Group (US) and ExxonMobil Corporation (US).

Synthetic Fuels Market Ecosystem

Based on fuel type, the power to liquid fuel segment is projected to register highest CAGR during forecast period

The power to liquid fuel (PTL) segment is estimated to be the fastest-growing segment of the global synthetic fuels market in forecast period. PTL offer several advantages including low consumption of water and land for power to liquid production plants, as well as very low lifecycle emissions. These factores make PTL as the most sustainable option in the long term.

Based on application, the diesel segment held the largest share of global synthetic fuels market in 2022

The diesel segment accounted for the largest share of the global synthetic fuels market in 2022. Manufacturers are focusing on the development of carbon-neutral synthetic diesel produced through renewable energy sources and carbon capture and utilization (CCU) technologies. Thus formed synthetic diesel has the ability to cater to various applications, including heavy-duty transportation, shipping, and off-road vehicles, where electrification may be challenging.

Based on end use, the transportation segment is estimated to account for the largest share in 2023

The transportation segment is estimated to have the largest share of the global synthetic fuels market in 2023 in terms of value. Usage of synthetic fuels has the advantage of producing fewer emissions than traditional aviation fuels. This is essential for reducing the carbon footprint of the aviation industry. Moreover, synthetic fuel can also be employed in internal combustion engines, such as those found in cars, trucks, and ships, without significant modifications. These factors are anticipated to attract consumers towards synthetic fuels during forecast period.

Based on region, Asia Pacific region is projected to be the largest region for synthetic fuels market during the forecast period

Asia-Pacific has been witnessing high growth in the synthetic fuels market and is projected to be the largest region from 2023 to 2030. Several countries in the region such as India, China, Japan, South Korea, and Australia, are actively investing in synthetic fuel technologies. In 2022, Japan's state-backed New Energy and Industrial Technology Development Organization (NEDO) granted 114.5 billion yen (USD 892 million) to support the development of new fuels including synthetic ones that emit lower carbon dioxide. These factors are expected to boost the synthetic fuels market in Asia Pacific.

Synthetic Fuels Market by Region

To know about the assumptions considered for the study, download the pdf brochure

Synthetic Fuels Market Report Scope

Report Metric

Details

Market Size Value in 2023

USD 48.4 billion

Revenue Forecast in 2030

USD 70.1 billion

CAGR

5.4%

Market Size Available for Years

2019 to 2030

Base Year Considered

2022

Forecast Period

2023–2030

Forecast Units

Value (USD Million/Billion)

Segments Covered

Fuel Type, Application, End Use, and Region

Geographies Covered

North America, Europe, Asia Pacific, Rest of World (South America, and the Middle East & Africa)

Companies Covered

Shell (UK), SASOL (South Africa), CHN Energy Investment Group Co., Ltd. (China), Chevron Renewable Energy Group (US), ExxonMobil Corporation (US), TotalEnergies (France), Neste (Finland), Petro SA (South Africa),  Linde Engineering (Ireland), Synthesis Energy Systems, Inc. (US), Dakota Gasification Company (US), TOPSOE (Denmark), MaireTecnimont S.p.A. (Italy), Sunfire GmbH (Germany), RWE (Germany), QatarEnergy (Qatar), Inner Mongolia Yital Coal Co., Ltd. (China) and others.

This research report categorizes the synthetic fuels market based on type, textile type, application, and region.

Based on fuel type, the synthetic fuels market has been segmented as follows:
  • Gas to Liquid Fuel (GTL)
  • Methanol to Liquid (MTL)
  • Power to Liquid Fuel (PTL)
  • Others (BTL AND CTL)
Based on application, the synthetic fuels market has been segmented as follows:
  • Gasoline
  • Diesel
  • Kerosene
Based on end use, the synthetic fuels market has been segmented as follows:
Based on the region, the synthetic fuels market has been segmented as follows:
  • Asia Pacific
    • China
    • India
    • Japan
    • South Korea
    • Rest of Asia Pacific
  • Europe
    • Germany
    • France
    • Uk
    • Russia
    • Rest of Europe
  • North America
    • US
    • Canada
    • Mexico
  • Middle East & Africa
    • Middle East & Africa
    • South America

Recent Developments

  • In April 2023, Envalior started off as a brand-new business, one of the major global providers of engineering materials. DSM Engineering Materials (DEM) and LANXESS High Performance Materials (HPM), two highly complementary market leaders in engineering materials, have merged to become Envalior, which is owned by Advent International (around 60% share), a worldwide private equity firm, and LANXESS (around 40% share), a manufacturer of specialty chemicals.
  • In February 2023, Asahi Kasei's Board of Directors approved a Final Agreement regarding the transfer of business related to the development, production, and sale of spunbond nonwoven products to a newly formed joint venture company, which will be established by joint incorporation-type company separation (The Separation) with Mitsui Chemicals, Inc. The Separation is expected to take place on October 2, 2023. Through this joint venture both the companies aim to strengthen their spunbond business in Asia.

Frequently Asked Questions (FAQ):

To speak to our analyst for a discussion on the above findings, click Speak to Analyst

TABLE OF CONTENTS
 
1 INTRODUCTION (Page No. - 29)
    1.1 STUDY OBJECTIVES 
    1.2 MARKET DEFINITION 
           1.2.1 INCLUSIONS AND EXCLUSIONS
                    TABLE 1 SYNTHETIC FUELS MARKET: INCLUSIONS AND EXCLUSIONS
    1.3 MARKET SCOPE 
          FIGURE 1 SYNTHETIC FUELS MARKET SEGMENTATION
           1.3.1 REGIONAL SCOPE
           1.3.2 YEARS CONSIDERED
    1.4 CURRENCY CONSIDERED 
    1.5 UNITS CONSIDERED 
    1.6 LIMITATIONS 
    1.7 STAKEHOLDERS 
 
2 RESEARCH METHODOLOGY (Page No. - 33)
    2.1 RESEARCH DATA 
          FIGURE 2 SYNTHETIC FUELS MARKET: RESEARCH DESIGN
           2.1.1 SECONDARY DATA
                    2.1.1.1 Key data from secondary sources
           2.1.2 PRIMARY DATA
                    2.1.2.1 Key data from primary sources
                    2.1.2.2 Breakdown of primary interviews
                    2.1.2.3 Key industry insights
    2.2 MATRIX CONSIDERED FOR DEMAND SIDE 
          FIGURE 3 MAIN MATRIX CONSIDERED FOR ASSESSING DEMAND FOR SYNTHETIC FUELS
    2.3 MARKET SIZE ESTIMATION 
           2.3.1 BOTTOM-UP APPROACH
                    FIGURE 4 MARKET SIZE ESTIMATION: BOTTOM-UP APPROACH
           2.3.2 TOP-DOWN APPROACH
                    FIGURE 5 MARKET SIZE ESTIMATION: TOP-DOWN APPROACH
    2.4 METHODOLOGY FOR SUPPLY-SIDE SIZING OF SYNTHETIC  FUELS MARKET 
    2.5 ANALYSIS OF SUPPLY-SIDE SIZING OF SYNTHETIC FUELS MARKET 
           2.5.1 CALCULATIONS BASED ON SUPPLY-SIDE ANALYSIS
           2.5.2 GROWTH FORECAST
    2.6 MARKET BREAKDOWN AND DATA TRIANGULATION 
          FIGURE 6 SYNTHETIC FUELS MARKET: DATA TRIANGULATION
    2.7 IMPACT OF RECESSION 
    2.8 RESEARCH ASSUMPTIONS 
    2.9 RESEARCH LIMITATIONS 
    2.10 RISK ANALYSIS 
 
3 EXECUTIVE SUMMARY (Page No. - 42)
    TABLE 2 SYNTHETIC FUELS MARKET SNAPSHOT: 2023 VS. 2030
    FIGURE 7 METHANOL TO LIQUID (MTL) TO HOLD LARGEST MARKET DURING  FORECAST PERIOD
    FIGURE 8 TRANSPORTATION SEGMENT TO REGISTER HIGHEST CAGR DURING  FORECAST PERIOD
    FIGURE 9 DIESEL SEGMENT TO ACCOUNT FOR LARGEST MARKET DURING  FORECAST PERIOD
    FIGURE 10 NORTH AMERICA TO WITNESS HIGHEST CAGR DURING FORECAST PERIOD
 
4 PREMIUM INSIGHTS (Page No. - 47)
    4.1 ATTRACTIVE OPPORTUNITIES FOR PLAYERS IN SYNTHETIC  FUELS MARKET 
          FIGURE 11 SYNTHETIC FUELS MARKET DRIVEN BY INCREASE IN DEMAND FROM AEROSPACE & DEFENSE, MARINE, AND OTHER SECTORS
    4.2 SYNTHETIC FUELS MARKET, BY REGION 
          FIGURE 12 ASIA PACIFIC TO ACCOUNT FOR LARGEST MARKET DURING FORECAST PERIOD
    4.3 SYNTHETIC FUELS MARKET, BY FUEL TYPE 
          FIGURE 13 POWER TO LIQUID FUEL TO REGISTER HIGHEST CAGR DURING  FORECAST PERIOD
    4.4 SYNTHETIC FUELS MARKET, BY END USE 
          FIGURE 14 TRANSPORTATION SEGMENT ACCOUNTED FOR LARGEST MARKET  SHARE IN 2023
    4.5 SYNTHETIC FUELS MARKET, BY APPLICATION 
          FIGURE 15 KEROSENE TO REGISTER HIGHEST CAGR DURING FORECAST PERIOD
 
5 MARKET OVERVIEW (Page No. - 49)
    5.1 MARKET DYNAMICS 
          FIGURE 16 DRIVERS, RESTRAINTS, OPPORTUNITIES, AND CHALLENGES IN SYNTHETIC FUELS MARKET
           5.1.1 DRIVERS
                    5.1.1.1 Investment by private players boosting research and development
                    5.1.1.2 Diversification in primary energy mix
           5.1.2 RESTRAINTS
                    5.1.2.1 High cost of synthetic fuel
                    5.1.2.2 Growing market for electric vehicles and alternative fuel
           5.1.3 OPPORTUNITIES
                    5.1.3.1 High potential use of synthetic fuels in various applications
                    5.1.3.2 Introduction of carbon pricing mechanism and tax credits for synthetic fuel production
           5.1.4 CHALLENGES
                    5.1.4.1 Difficulty in achieving economies of scale in synthetic fuel production
    5.2 VALUE CHAIN ANALYSIS 
          FIGURE 17 VALUE CHAIN ANALYSIS OF SYNTHETIC FUELS MARKET
    5.3 ECOSYSTEM MAPPING 
          FIGURE 18 ECOSYSTEM MAPPING OF SYNTHETIC FUELS MARKET
          TABLE 3 ECOSYSTEM OF SYNTHETIC FUELS MARKET
    5.4 PORTER’S FIVE FORCES ANALYSIS 
          FIGURE 19 PORTER’S FIVE FORCES ANALYSIS OF SYNTHETIC FUELS MARKET
          TABLE 4 IMPACT OF PORTER’S FIVE FORCES ON SYNTHETIC FUELS MARKET
           5.4.1 BARGAINING POWER OF SUPPLIERS
           5.4.2 THREAT OF NEW ENTRANTS
           5.4.3 THREAT OF SUBSTITUTES
           5.4.4 BARGAINING POWER OF BUYERS
           5.4.5 INTENSITY OF COMPETITIVE RIVALRY
    5.5 PRICING ANALYSIS 
           5.5.1 AVERAGE SELLING PRICE TREND, BY REGION
                    FIGURE 20 SYNTHETIC FUELS MARKET: AVERAGE SELLING PRICE TREND, BY REGION
           5.5.2 INDICATIVE PRICE TREND, BY FUEL TYPE
                    FIGURE 21 SYNTHETIC FUELS MARKET: INDICATIVE PRICE TREND, BY FUEL TYPE
    5.6 TARIFF AND REGULATORY LANDSCAPE 
           5.6.1 REGULATORY BODIES, GOVERNMENT AGENCIES,  AND OTHER ORGANIZATIONS
                    TABLE 5 NORTH AMERICA: REGULATORY BODIES, GOVERNMENT AGENCIES,  AND OTHER ORGANIZATIONS
                    TABLE 6 EUROPE: REGULATORY BODIES, GOVERNMENT AGENCIES, AND OTHER ORGANIZATIONS
                    TABLE 7 ASIA PACIFIC: REGULATORY BODIES, GOVERNMENT AGENCIES, AND OTHER ORGANIZATIONS
                    TABLE 8 REST OF THE WORLD: REGULATORY BODIES, GOVERNMENT AGENCIES, AND OTHER ORGANIZATIONS
           5.6.2 MARKET REGULATIONS AND STANDARDS
                    TABLE 9 REGULATIONS AND STANDARDS FOR FUELS
    5.7 KEY CONFERENCES AND EVENTS (2023–2024) 
          TABLE 10 SYNTHETIC FUELS MARKET: KEY CONFERENCES AND EVENTS (2023–2024)
    5.8 KEY STAKEHOLDERS AND BUYING CRITERIA 
           5.8.1 KEY STAKEHOLDERS IN BUYING PROCESS
                    FIGURE 22 INFLUENCE OF STAKEHOLDERS ON BUYING PROCESS FOR  TOP THREE END USES
                    TABLE 11 INFLUENCE OF STAKEHOLDERS ON BUYING PROCESS FOR TOP THREE END USES (%)
                    FIGURE 23 KEY BUYING CRITERIA FOR TOP THREE END USES
                    TABLE 12 KEY BUYING CRITERIA FOR TOP THREE END USES
    5.9 PATENT ANALYSIS 
           5.9.1 METHODOLOGY
                    FIGURE 24 LIST OF MAJOR PATENTS FOR SYNTHETIC FUELS
           5.9.2 JURISDICTION ANALYSIS
                    FIGURE 25 US ACCOUNTED FOR HIGHEST PATENT COUNT
                    5.9.2.1 Major patents
                                TABLE 13 LIST OF RECENT PATENTS BY GENERAL ELECTRIC
                                TABLE 14 LIST OF RECENT PATENTS BY EXXONMOBIL
                                TABLE 15 LIST OF RECENT PATENTS BY BASF SE
    5.10 TECHNOLOGY ANALYSIS 
           5.10.1 SYNTHETIC BIOLOGY PROJECT PAVES WAY FOR CARBON-NEGATIVE BIOFUELS
           5.10.2 PIONEERING CARBON-NEUTRAL SYNTHETIC FUEL FOR NET-ZERO AVIATION
    5.11 CASE STUDY ANALYSIS 
           5.11.1 PORSCHE’S CARBON-NEUTRAL SYNTHETIC FUELS FROM THIN AIR
           5.11.2 HONEYWELL’S UOP EFINING TECHNOLOGY PIONEERS SUSTAINABLE AVIATION FUEL
    5.12 TRADE DATA 
           5.12.1 EXPORT SCENARIO
                     TABLE 16 EXPORT DATA ON HS CODE: 27101951: MINERAL FUELS, MINERAL OILS, AND PRODUCTS OF THEIR DISTILLATION; BITUMINOUS SUBSTANCES; MINERAL WAXES (USD THOUSAND)
           5.12.2 IMPORT SCENARIO
                     TABLE 17 IMPORT DATA ON HS CODE: 27101951: MINERAL FUELS, MINERAL OILS, AND PRODUCTS OF THEIR DISTILLATION; BITUMINOUS SUBSTANCES; MINERAL WAXES  (USD THOUSAND)
    5.13 TRENDS/DISRUPTIONS IMPACTING CUSTOMER BUSINESS 
           5.13.1 REVENUE SHIFTS AND NEW REVENUE POCKETS FOR SYNTHETIC FUEL MANUFACTURERS/SUPPLIERS
                     FIGURE 26 REVENUE SHIFT FOR SYNTHETIC FUEL MANUFACTURERS
 
6 SYNTHETIC FUELS MARKET, BY FEEDSTOCK (Page No. - 78)
    6.1 INTRODUCTION 
          FIGURE 27 SYNTHETIC FUELS MARKET, BY FEEDSTOCK
    6.2 NATURAL GAS 
    6.3 METHANOL 
    6.4 POWER 
    6.5 OTHER FEEDSTOCKS 
 
7 SYNTHETIC FUELS MARKET, BY PROCESS (Page No. - 81)
    7.1 INTRODUCTION 
    7.2 FISCHER-TROPSCH SYNTHESIS 
    7.3 METHANOL SYNTHESIS 
    7.4 ELECTROLYSIS 
          FIGURE 28 SYNTHETIC FUELS MARKET, BY PROCESS (ELECTROLYSIS)
    7.5 COAL LIQUEFACTION 
 
8 SYNTHETIC FUELS MARKET, BY FUEL TYPE (Page No. - 85)
    8.1 INTRODUCTION 
          FIGURE 29 METHANOL TO LIQUID SEGMENT TO BE LARGEST MARKET DURING  FORECAST PERIOD
          TABLE 18 SYNTHETIC FUELS MARKET, BY FUEL TYPE, 2019–2022 (USD MILLION)
          TABLE 19 SYNTHETIC FUEL MARKET, BY FUEL TYPE, 2023–2030 (USD MILLION)
          TABLE 20 SYNTHETIC FUELS MARKET, BY FUEL TYPE, 2019–2022 (MILLION LITER)
          TABLE 21 SYNTHETIC FUEL MARKET, BY FUEL TYPE, 2023–2030 (MILLION LITER)
    8.2 GAS TO LIQUID FUEL 
           8.2.1 INCREASING DEMAND FOR HIGH ENERGY DENSITY FUEL TO PROMOTE MARKET GROWTH
                    TABLE 22 GAS TO LIQUID: SYNTHETIC FUELS MARKET, BY REGION,  2019–2022 (USD MILLION)
                    TABLE 23 GAS TO LIQUID: SYNTHETIC FUEL MARKET, BY REGION,  2023–2030 (USD MILLION)
    8.3 METHANOL TO LIQUID 
           8.3.1 CLEAN-BURNING AND HIGH-OCTANE RATING OFFERED BY METHANOL TO BOOST MARKET
                    TABLE 24 METHANOL TO LIQUID: SYNTHETIC FUELS MARKET, BY REGION,  2019–2022 (USD MILLION)
                    TABLE 25 METHANOL TO LIQUID: SYNTHETIC FUEL MARKET, BY REGION,  2023–2030 (USD MILLION)
    8.4 POWER TO LIQUID FUEL 
           8.4.1 VERY LOW LIFECYCLE EMISSIONS TO DRIVE DEMAND
                    TABLE 26 POWER TO LIQUID: SYNTHETIC FUELS MARKET, BY REGION,  2019–2022 (USD MILLION)
                    TABLE 27 POWER TO LIQUID: SYNTHETIC FUEL MARKET, BY REGION,  2023–2030 (USD MILLION)
    8.5 OTHER FUEL TYPES 
          TABLE 28 OTHERS: SYNTHETIC FUELS MARKET, BY REGION, 2019–2022 (USD MILLION)
          TABLE 29 OTHERS: SYNTHETIC FUEL MARKET, BY REGION, 2023–2030 (USD MILLION)
 
9 SYNTHETIC FUELS MARKET, BY APPLICATION (Page No. - 93)
    9.1 INTRODUCTION 
          FIGURE 30 DIESEL SEGMENT TO LEAD SYNTHETIC FUELS MARKET DURING  FORECAST PERIOD
          TABLE 30 SYNTHETIC FUEL MARKET, BY APPLICATION, 2019–2022 (USD MILLION)
          TABLE 31 SYNTHETIC FUELS MARKET, BY APPLICATION, 2023–2030 (USD MILLION)
    9.2 GASOLINE 
           9.2.1 COMPATIBILITY WITH EXISTING INTERNAL COMBUSTION ENGINES  & INFRASTRUCTURE TO BOOST DEMAND
    9.3 DIESEL 
           9.3.1 REDUCED SULFUR EMISSIONS AIDED BY LOW SULFUR CONTENT  TO DRIVE MARKET
    9.4 KEROSENE 
           9.4.1 ENHANCED ENERGY SECURITY AND SUSTAINABILITY TO CREATE GROWTH OPPORTUNITIES
 
10 SYNTHETIC FUELS MARKET, BY END USE (Page No. - 97)
     10.1 INTRODUCTION 
             FIGURE 31 TRANSPORTATION SEGMENT TO GROW AT HIGHEST CAGR DURING  FORECAST PERIOD
             TABLE 32 SYNTHETIC FUELS MARKET, BY END USE, 2019–2022 (USD MILLION)
             TABLE 33 SYNTHETIC FUEL MARKET, BY END USE, 2023–2030 (USD MILLION)
     10.2 TRANSPORTATION 
             10.2.1 GROWING VEHICLE PRODUCTION WORLDWIDE TO DRIVE DEMAND
     10.3 INDUSTRIAL 
             10.3.1 AIM TO REDUCE CARBON EMISSIONS AND ACHIEVE CARBON NEUTRALITY TO BOOST DEMAND
     10.4 CHEMICAL & OTHERS 
             10.4.1 INCREASING PREFERENCE FOR SUSTAINABLE AND ECO-FRIENDLY PRACTICES TO PROPEL DEMAND
 
11 SYNTHETIC FUELS MARKET, BY MARKET MATURITY (Page No. - 101)
     11.1 INTRODUCTION 
     11.2 PROTOTYPING/INTRODUCTORY 
     11.3 EMERGING 
     11.4 MATURE 
 
12 SYNTHETIC FUELS MARKET, BY ENVIRONMENTAL IMPACT (Page No. - 104)
     12.1 INTRODUCTION 
     12.2 CARBON-NEUTRAL/CAPTURE TECHNOLOGIES 
     12.3 LOW-CARBON/CONVENTIONAL 
 
13 SYNTHETIC FUELS MARKET, BY REGION (Page No. - 106)
     13.1 INTRODUCTION 
             FIGURE 32 ASIA PACIFIC TO LEAD SYNTHETIC FUELS MARKET DURING FORECAST PERIOD
             TABLE 34 SYNTHETIC FUEL MARKET, BY REGION, 2019–2022 (USD MILLION)
             TABLE 35 SYNTHETIC FUELS MARKET, BY REGION, 2023–2030 (USD MILLION)
     13.2 NORTH AMERICA 
             13.2.1 RECESSION IMPACT
                        FIGURE 33 NORTH AMERICA: SYNTHETIC FUELS MARKET SNAPSHOT
                        TABLE 36 NORTH AMERICA: SYNTHETIC FUEL MARKET, BY COUNTRY, 2019–2022 (USD MILLION)
                        TABLE 37 NORTH AMERICA: MARKET, BY COUNTRY, 2023–2030 (USD MILLION)
                        TABLE 38 NORTH AMERICA: MARKET, BY FUEL TYPE, 2019–2022 (USD MILLION)
                        TABLE 39 NORTH AMERICA: MARKET, BY FUEL TYPE, 2023–2030 (USD MILLION)
                        TABLE 40 NORTH AMERICA: MARKET, BY END USE, 2019–2022 (USD MILLION)
                        TABLE 41 NORTH AMERICA: MARKET, BY END USE, 2023–2030 (USD MILLION)
             13.2.2 US
                        13.2.2.1 Robust investments, technological innovation, and government support to drive market
                                      TABLE 42 US: SYNTHETIC FUELS MARKET, BY FUEL TYPE, 2019–2022 (USD MILLION)
                                      TABLE 43 US: SYNTHETIC FUEL MARKET, BY FUEL TYPE, 2023–2030 (USD MILLION)
             13.2.3 CANADA
                        13.2.3.1 Investments and global partnerships to drive market
                                      TABLE 44 CANADA: SYNTHETIC FUELS MARKET, BY FUEL TYPE, 2019–2022 (USD MILLION)
                                      TABLE 45 CANADA: SYNTHETIC FUEL MARKET, BY FUEL TYPE, 2023–2030 (USD MILLION)
             13.2.4 MEXICO
                        13.2.4.1 Strategic initiatives, partnerships, and investments to drive market
                                      TABLE 46 MEXICO: SYNTHETIC FUELS MARKET, BY FUEL TYPE, 2019–2022 (USD MILLION)
                                      TABLE 47 MEXICO: SYNTHETIC FUEL MARKET, BY FUEL TYPE, 2023–2030 (USD MILLION)
     13.3 EUROPE 
             13.3.1 RECESSION IMPACT
                        FIGURE 34 EUROPE: SYNTHETIC FUELS MARKET SNAPSHOT
                        TABLE 48 EUROPE: SYNTHETIC FUEL MARKET, BY COUNTRY, 2019–2022 (USD MILLION)
                        TABLE 49 EUROPE: MARKET, BY COUNTRY, 2023–2030 (USD MILLION)
                        TABLE 50 EUROPE: MARKET, BY FUEL TYPE, 2019–2022 (USD MILLION)
                        TABLE 51 EUROPE: MARKET, BY FUEL TYPE, 2023–2030 (USD MILLION)
                        TABLE 52 EUROPE: MARKET, BY END USE, 2019–2022 (USD MILLION)
                        TABLE 53 EUROPE: MARKET, BY END USE, 2023–2030 (USD MILLION)
             13.3.2 GERMANY
                        13.3.2.1 Private investments and commitment to green energy solutions to drive market
                                      TABLE 54 GERMANY: SYNTHETIC FUELS MARKET, BY FUEL TYPE, 2019–2022 (USD MILLION)
                                      TABLE 55 GERMANY: SYNTHETIC FUEL MARKET, BY FUEL TYPE, 2023–2030 (USD MILLION)
             13.3.3 UK
                        13.3.3.1 Alignment with decarbonization policies, low-carbon fuel adoption, investments, and technological advancements to  drive market
                                      TABLE 56 UK: SYNTHETIC FUELS MARKET, BY FUEL TYPE, 2019–2022 (USD MILLION)
                                      TABLE 57 UK: SYNTHETIC FUEL MARKET, BY FUEL TYPE, 2023–2030 (USD MILLION)
             13.3.4 RUSSIA
                        13.3.4.1 Government and industry backing to drive market
             13.3.5 FRANCE
                        13.3.5.1 Tax incentives and industry collaborations to drive market
                                      TABLE 58 FRANCE: SYNTHETIC FUELS MARKET, BY FUEL TYPE, 2019–2022 (USD MILLION)
                                      TABLE 59 FRANCE: SYNTHETIC FUEL MARKET, BY FUEL TYPE, 2023–2030 (USD MILLION)
             13.3.6 REST OF EUROPE
                        TABLE 60 REST OF EUROPE: SYNTHETIC FUELS MARKET, BY FUEL TYPE, 2019–2022 (USD MILLION)
                        TABLE 61 REST OF EUROPE: SYNTHETIC FUEL MARKET, BY FUEL TYPE, 2023–2030 (USD MILLION)
     13.4 ASIA PACIFIC 
             13.4.1 RECESSION IMPACT
                        FIGURE 35 ASIA PACIFIC: SYNTHETIC FUELS MARKET SNAPSHOT
                        TABLE 62 ASIA PACIFIC: SYNTHETIC FUEL MARKET, BY COUNTRY, 2019–2022 (USD MILLION)
                        TABLE 63 ASIA PACIFIC: MARKET, BY COUNTRY, 2023–2030 (USD MILLION)
                        TABLE 64 ASIA PACIFIC: MARKET, BY FUEL TYPE, 2019–2022 (USD MILLION)
                        TABLE 65 ASIA PACIFIC: MARKET, BY FUEL TYPE, 2023–2030 (USD MILLION)
                        TABLE 66 ASIA PACIFIC: MARKET, BY END USE, 2019–2022 (USD MILLION)
                        TABLE 67 ASIA PACIFIC: MARKET, BY END USE, 2023–2030 (USD MILLION)
             13.4.2 CHINA
                        13.4.2.1 Government support and investments in synthetic fuel technologies, such as MTO and SAF, to drive market
                                      TABLE 68 CHINA: SYNTHETIC FUELS MARKET, BY FUEL TYPE, 2019–2022 (USD MILLION)
                                      TABLE 69 CHINA: SYNTHETIC FUEL MARKET, BY FUEL TYPE, 2023–2030 (USD MILLION)
             13.4.3 JAPAN
                        13.4.3.1 Green Growth Strategy, advanced hydrogen tech, and maritime focus to drive market
                                      TABLE 70 JAPAN: SYNTHETIC FUELS MARKET, BY FUEL TYPE, 2019–2022 (USD MILLION)
                                      TABLE 71 JAPAN: SYNTHETIC FUEL MARKET, BY FUEL TYPE, 2023–2030 (USD MILLION)
             13.4.4 INDIA
                        13.4.4.1 Strategic initiatives, research progress, and government support to drive market
                                      TABLE 72 INDIA: SYNTHETIC FUELS MARKET, BY FUEL TYPE, 2019–2022 (USD MILLION)
                                      TABLE 73 INDIA: SYNTHETIC FUEL MARKET, BY FUEL TYPE, 2023–2030 (USD MILLION)
             13.4.5 SOUTH KOREA
                        13.4.5.1 Government policies, research, and corporate partnerships to drive market
                                      TABLE 74 SOUTH KOREA: SYNTHETIC FUELS MARKET, BY FUEL TYPE, 2019–2022 (USD MILLION)
                                      TABLE 75 SOUTH KOREA: SYNTHETIC FUEL MARKET, BY FUEL TYPE, 2023–2030 (USD MILLION)
             13.4.6 REST OF ASIA PACIFIC
                        TABLE 76 REST OF ASIA PACIFIC: SYNTHETIC FUELS MARKET, BY FUEL TYPE,  2019–2022 (USD MILLION)
                        TABLE 77 REST OF ASIA PACIFIC: SYNTHETIC FUEL MARKET, BY FUEL TYPE,  2023–2030 (USD MILLION)
     13.5 REST OF WORLD 
             13.5.1 RECESSION IMPACT
                        TABLE 78 REST OF WORLD: SYNTHETIC FUELS MARKET, BY REGION, 2019–2022 (USD MILLION)
                        TABLE 79 REST OF WORLD: SYNTHETIC FUEL MARKET, BY REGION, 2023–2030 (USD MILLION)
                        TABLE 80 REST OF WORLD: MARKET, BY FUEL TYPE, 2019–2022 (USD MILLION)
                        TABLE 81 REST OF WORLD: MARKET, BY FUEL TYPE, 2023–2030 (USD MILLION)
                        TABLE 82 REST OF WORLD: MARKET, BY END USE, 2019–2022 (USD MILLION)
                        TABLE 83 REST OF WORLD: MARKET, BY END USE, 2023–2030 (USD MILLION)
 
14 COMPETITIVE LANDSCAPE (Page No. - 134)
     14.1 INTRODUCTION 
     14.2 STRATEGIES ADOPTED BY KEY PLAYERS 
             TABLE 84 OVERVIEW OF STRATEGIES ADOPTED BY KEY MANUFACTURERS
     14.3 REVENUE ANALYSIS 
             FIGURE 36 REVENUE ANALYSIS OF KEY COMPANIES (2018–2022)
     14.4 MARKET SHARE ANALYSIS 
             14.4.1 RANKING OF KEY MARKET PLAYERS, 2022
                        FIGURE 37 RANKING OF TOP FIVE PLAYERS IN SYNTHETIC FUELS MARKET, 2022
             14.4.2 MARKET SHARE OF KEY PLAYERS
                        FIGURE 38 SYNTHETIC FUEL MARKET SHARE ANALYSIS
                        TABLE 85 SYNTHETIC FUELS MARKET: DEGREE OF COMPETITION
     14.5 COMPANY EVALUATION QUADRANT (TIER 1) 
             14.5.1 STARS
             14.5.2 EMERGING LEADERS
             14.5.3 PERVASIVE PLAYERS
             14.5.4 PARTICIPANTS
                        FIGURE 39 COMPANY EVALUATION QUADRANT: SYNTHETIC FUELS MARKET  (TIER 1 COMPANIES)
             14.5.5 COMPANY FOOTPRINT
                        FIGURE 40 SYNTHETIC FUELS MARKET: COMPANY FOOTPRINT
                        TABLE 86 SYNTHETIC FUEL MARKET: END USE FOOTPRINT
                        TABLE 87 SYNTHETIC FUELS MARKET: COMPANY REGION FOOTPRINT
     14.6 START-UP/SME EVALUATION QUADRANT 
             14.6.1 PROGRESSIVE COMPANIES
             14.6.2 RESPONSIVE COMPANIES
             14.6.3 DYNAMIC COMPANIES
             14.6.4 STARTING BLOCKS
                        FIGURE 41 START-UP/SME EVALUATION QUADRANT: SYNTHETIC FUELS MARKET
             14.6.5 COMPETITIVE BENCHMARKING
                        TABLE 88 SYNTHETIC FUELS MARKET: DETAILED LIST OF KEY START-UPS/SMES
                        TABLE 89 SYNTHETIC FUEL MARKET: COMPETITIVE BENCHMARKING OF KEY START-UPS/SMES
     14.7 COMPETITIVE SCENARIOS AND TRENDS 
             14.7.1 DEALS
                        TABLE 90 SYNTHETIC FUELS MARKET: DEALS (2019–AUGUST 2023)
             14.7.2 OTHER DEVELOPMENTS
                        TABLE 91 SYNTHETIC FUELS MARKET: EXPANSIONS, INVESTMENTS, AND INNOVATIONS (2019–AUGUST 2023)
 
15 COMPANY PROFILES (Page No. - 159)
(Business overview, Products/Solutions/Services offered, Recent Developments, MnM view, Key strengths, Strategic choices, Weaknesses and competitive threats)* 
     15.1 KEY PLAYERS 
             15.1.1 SHELL
                        TABLE 92 SHELL: COMPANY OVERVIEW
                        FIGURE 42 SHELL: COMPANY SNAPSHOT
                        TABLE 93 SHELL: PRODUCTS OFFERED
                        TABLE 94 SHELL: DEALS
                        TABLE 95 SHELL: OTHERS
             15.1.2 SASOL
                        TABLE 96 SASOL: COMPANY OVERVIEW
                        FIGURE 43 SASOL: COMPANY SNAPSHOT
                        TABLE 97 SASOL: PRODUCTS OFFERED
                        TABLE 98 SASOL: DEALS
             15.1.3 CHN ENERGY INVESTMENT GROUP CO., LTD.
                        TABLE 99 CHN ENERGY INVESTMENT GROUP CO., LTD.: COMPANY OVERVIEW
                        TABLE 100 CHN ENERGY INVESTMENT GROUP CO., LTD: PRODUCTS OFFERED
                        TABLE 101 CHN ENERGY INVESTMENT GROUP CO., LTD.: DEALS
                        TABLE 102 CHN ENERGY INVESTMENT GROUP CO., LTD.: OTHERS
             15.1.4 CHEVRON RENEWABLE ENERGY GROUP
                        TABLE 103 CHEVRON RENEWABLE ENERGY GROUP: COMPANY OVERVIEW
                        TABLE 104 CHEVRON RENEWABLE ENERGY GROUP: PRODUCTS OFFERED
                        TABLE 105 CHEVRON RENEWABLE ENERGY GROUP: DEALS
                        TABLE 106 CHEVRON RENEWABLE ENERGY GROUP: OTHERS
             15.1.5 EXXONMOBIL CORPORATION
                        TABLE 107 EXXONMOBIL CORPORATION: COMPANY OVERVIEW
                        FIGURE 44 EXXONMOBIL CORPORATION: COMPANY SNAPSHOT
                        TABLE 108 EXXONMOBIL CORPORATION: PRODUCTS OFFERED
                        TABLE 109 EXXONMOBIL CORPORATION: DEALS
             15.1.6 TOTALENERGIES
                        TABLE 110 TOTALENERGIES: COMPANY OVERVIEW
                        FIGURE 45 TOTALENERGIES: COMPANY SNAPSHOT
                        TABLE 111 TOTALENERGIES: PRODUCTS OFFERED
                        TABLE 112 TOTALENERGIES: DEALS
             15.1.7 NESTE
                        TABLE 113 NESTE: COMPANY OVERVIEW
                        FIGURE 46 NESTE: COMPANY SNAPSHOT
                        TABLE 114 NESTE: PRODUCTS OFFERED
                        TABLE 115 NESTE: DEALS
                        TABLE 116 NESTE: OTHERS
             15.1.8 PETRO SA
                        TABLE 117 PETRO SA: COMPANY OVERVIEW
                        TABLE 118 PETRO SA: PRODUCTS OFFERED
             15.1.9 LINDE ENGINEERING
                        TABLE 119 LINDE ENGINEERING: COMPANY OVERVIEW
                        FIGURE 47 LINDE ENGINEERING: COMPANY SNAPSHOT
                        TABLE 120 LINDE ENGINEERING: PRODUCTS OFFERED
             15.1.10 SYNTHESIS ENERGY SYSTEMS, INC.
                        TABLE 121 SYNTHESIS ENERGY SYSTEMS, INC.: COMPANY OVERVIEW
                        TABLE 122 SYNTHESIS ENERGY SYSTEMS, INC.: PRODUCTS OFFERED
             15.1.11 DAKOTA GASIFICATION COMPANY
                        TABLE 123 DAKOTA GASIFICATION COMPANY: COMPANY OVERVIEW
                        FIGURE 48 DAKOTA GASIFICATION COMPANY: COMPANY SNAPSHOT
                        TABLE 124 DAKOTA GASIFICATION COMPANY: PRODUCTS OFFERED
             15.1.12 TOPSOE
                        TABLE 125 TOPSOE: COMPANY OVERVIEW
                        FIGURE 49 TOPSOE: COMPANY SNAPSHOT
                        TABLE 126 TOPSOE: PRODUCTS OFFERED
                        TABLE 127 TOPSOE: DEALS
                        TABLE 128 TOPSOE: OTHERS
             15.1.13 MAIRE TECNIMONT S.P.A.
                        TABLE 129 MAIRE TECNIMONT S.P.A.: COMPANY OVERVIEW
                        FIGURE 50 MAIRE TECNIMONT S.P.A.: COMPANY SNAPSHOT
                        TABLE 130 MAIRE TECNIMONT S.P.A.: PRODUCTS OFFERED
                        TABLE 131 MAIRE TECNIMONT S.P.A.: DEALS
             15.1.14 SUNFIRE GMBH
                        TABLE 132 SUNFIRE GMBH: COMPANY OVERVIEW
                        TABLE 133 SUNFIRE GMBH: PRODUCTS OFFERED
                        TABLE 134 SUNFIRE GMBH: DEALS
             15.1.15 RWE
                        TABLE 135 RWE: COMPANY OVERVIEW
                        FIGURE 51 RWE: COMPANY SNAPSHOT
                        TABLE 136 RWE: PRODUCTS OFFERED
                        TABLE 137 RWE: DEALS
             15.1.16 QATARENERGY
                        TABLE 138 QATARENERGY: COMPANY OVERVIEW
                        FIGURE 52 QATARENERGY: COMPANY SNAPSHOT
                        TABLE 139 QATARENERGY: PRODUCTS OFFERED
                        TABLE 140 QATARENERGY: DEALS
                        TABLE 141 QATARENERGY: OTHERS
             15.1.17 INNER MONGOLIA YITAI COAL CO., LTD.
                        TABLE 142 INNER MONGOLIA YITAI COAL CO., LTD.: COMPANY OVERVIEW
                        FIGURE 53 INNER MONGOLIA YITAI COAL CO., LTD.: COMPANY SNAPSHOT
                        TABLE 143 INNER MONGOLIA YITAI COAL CO., LTD.: PRODUCTS OFFERED
     15.2 OTHER PLAYERS 
             15.2.1 NORSK E-FUEL
                        TABLE 144 NORSK E-FUEL: COMPANY OVERVIEW
                        TABLE 145 NORSK E-FUEL: PRODUCTS OFFERED
                        TABLE 146 NORSK E-FUEL: DEALS
                        TABLE 147 NORSK E-FUEL: OTHERS
             15.2.2 PROMETHEUS FUELS
                        TABLE 148 PROMETHEUS FUELS: COMPANY OVERVIEW
                        TABLE 149 PROMETHEUS FUELS: PRODUCTS OFFERED
                        TABLE 150 PROMETHEUS FUELS: DEALS
             15.2.3 SKYNRG
                        TABLE 151 SKYNRG: COMPANY OVERVIEW
                        TABLE 152 SKYNRG: PRODUCTS OFFERED
             15.2.4 SYNHELION SA
                        TABLE 153 SYNHELION SA: COMPANY OVERVIEW
                        TABLE 154 SYNHELION SA: PRODUCTS OFFERED
                        TABLE 155 SYNHELION SA: DEALS
             15.2.5 SAF+ CONSORTIUM
                        TABLE 156 SAF+ CONSORTIUM: COMPANY OVERVIEW
                        TABLE 157 SAF+ CONSORTIUM: PRODUCTS OFFERED
                        TABLE 158 SAF+ CONSORTIUM: DEALS
             15.2.6 VIRENT, INC.
                        TABLE 159 VIRENT, INC.: COMPANY OVERVIEW
                        TABLE 160 VIRENT, INC.: PRODUCTS OFFERED
 
*Details on Business overview, Products/Solutions/Services offered, Recent Developments, MnM view, Key strengths, Strategic choices, Weaknesses and competitive threats might not be captured in case of unlisted companies.
 
16 ADJACENT AND RELATED MARKETS (Page No. - 218)
     16.1 INTRODUCTION 
     16.2 LIMITATIONS 
     16.3 SYNTHETIC FUELS INTERCONNECTED MARKETS 
             16.3.1 AVIATION FUEL MARKET
                        16.3.1.1 Market definition
                        16.3.1.2 Market overview
     16.4 AVIATION FUEL MARKET, BY FUEL TYPE 
             16.4.1 CONVENTIONAL FUEL
                        16.4.1.1 Aviation turbine fuel
                        16.4.1.2 Jet A
                                     16.4.1.2.1 Extensive use of Jet A fuel in US
                        16.4.1.3 Jet A1
                                     16.4.1.3.1 Rising demand for Jet A1 fuel outside US
             16.4.2 AVGAS
                        16.4.2.1 Demand for aviation gasoline for piston engine aircraft
     16.5 SUSTAINABLE FUEL 
             16.5.1 BIOFUEL
                        16.5.1.1 Drop-in capability with no changes in aircraft infrastructure to drive demand
             16.5.2 HYDROGEN FUEL
                        16.5.2.1 Advantage of being true zero-carbon solution to drive demand
                                      TABLE 161 CURRENT HYDROGEN-POWERED AIRCRAFT DEVELOPMENTS
             16.5.3 POWER-TO-LIQUID
                        16.5.3.1 Benefits like very low lifecycle emissions to drive demand
             16.5.4 GAS-TO-LIQUID
                        16.5.4.1 Technological advancements to drive demand
                                      TABLE 162 AVIATION FUEL MARKET, BY FUEL TYPE, 2018–2021 (USD MILLION)
                                      TABLE 163 AVIATION FUEL MARKET, BY FUEL TYPE, 2022–2030 (USD MILLION)
 
17 APPENDIX (Page No. - 223)
     17.1 DISCUSSION GUIDE 
     17.2 KNOWLEDGESTORE: MARKETSANDMARKETS’ SUBSCRIPTION PORTAL 
     17.3 CUSTOMIZATION OPTIONS 
     17.4 RELATED REPORTS 
     17.5 AUTHOR DETAILS 

The study involved four major activities in estimating the current market size of synthetic fuels. Exhaustive secondary research was done to collect information on the market, the peer market, and the parent market. The next step was to validate these findings, assumptions, and sizes with industry experts across the value chain of synthetic fuels through primary research. Both top-down and bottom-up approaches were employed to estimate the complete market size. After that, market breakdown and data triangulation were used to estimate the size of the segments and sub-segments of the market.

Secondary Research

The research methodology used to estimate and forecast the access control market begins with capturing data on revenues of key vendors in the market through secondary research. BusinessWeek, Factiva, World Bank, and Industry Journals, such as Hoovers, Bloomberg BusinessWeek, Factiva, World Bank, and Industry Journals, were referred to for identifying and collecting information for this study. These secondary sources included annual reports, press releases & investor presentations of companies; white papers; certified publications; articles by recognized authors; notifications by regulatory bodies; trade directories; and databases. Vendor offerings have also been taken into consideration to determine market segmentation.

Primary Research

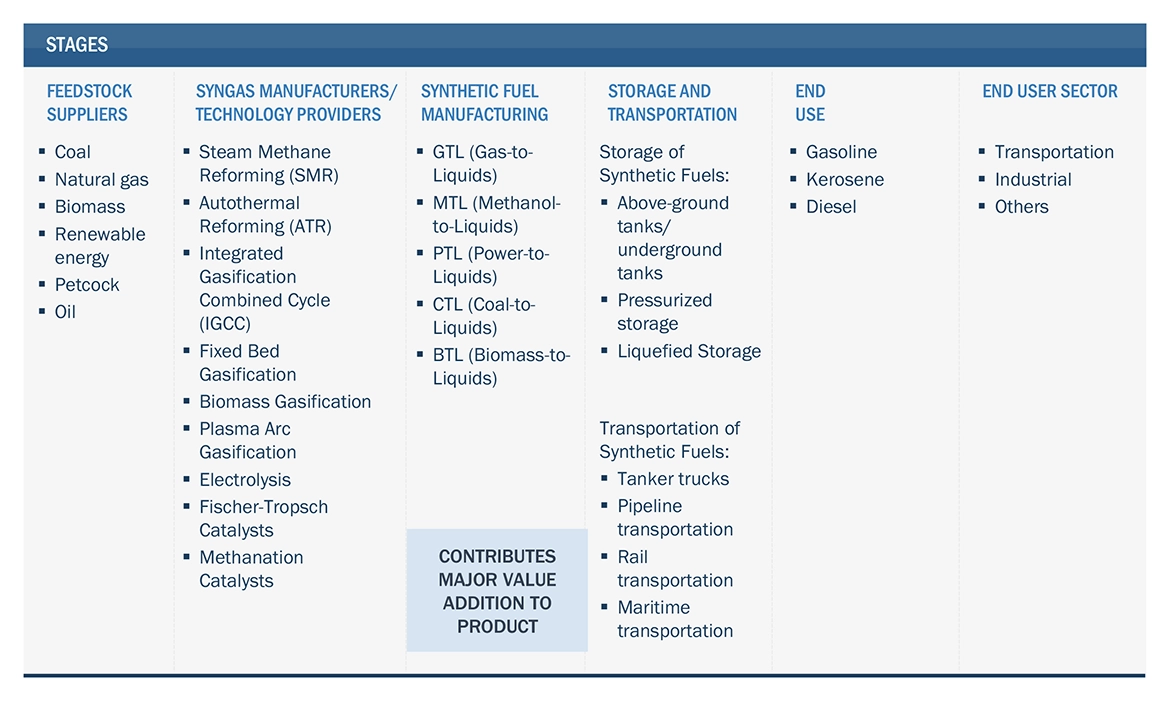
The synthetic fuels market comprises several stakeholders, such as such as raw material suppliers, technology support providers, synthetic fuels manufacturers, and regulatory organizations in the supply chain. Various primary sources from both the supply and demand sides of the market were interviewed to obtain qualitative and quantitative information. Primary sources from the supply side included industry experts such as Chief Executive Officers (CEOs), vice presidents, marketing directors, technology and innovation directors, and related key executives from various key companies and organizations operating in the synthetic fuels market. Primary sources from the demand side included directors, marketing heads, and purchase managers from various sourcing industries. Following is the breakdown of the primary respondents:

Synthetic Fuels Market Size, and Share

To know about the assumptions considered for the study, download the pdf brochure

Market Size Estimation

Both the top-down and bottom-up approaches were used to estimate and validate the total size of the synthetic fuels market. These methods were also used extensively to determine the size of various sub-segments in the market. The research methodology used to estimate the market size included the following:

  • The key players were identified through extensive primary and secondary research.
  • The value chain and market size of the synthetic fuels market, in terms of value, were determined through primary and secondary research.
  • All percentage shares, splits, and breakdowns were determined using secondary sources and verified through primary sources.
  • All possible parameters that affect the market covered in this research study were accounted for, viewed in extensive detail, verified through primary research, and analyzed to obtain the final quantitative and qualitative data.
  • The research included the study of reports, reviews, and newsletters of top market players, along with extensive interviews for opinions from key leaders, such as CEOs, directors, and marketing executives.

Global Synthetic Fuels Market Size: Bottom-Up Approach

Synthetic Fuels Market Size, and Share

To know about the assumptions considered for the study, Request for Free Sample Report

Global Synthetic Fuels Market Size: Top-Down Approach

Synthetic Fuels Market Size, and Share

Data Triangulation

After arriving at the overall market size using the market size estimation processes as explained above, the market was split into several segments and sub-segments. To complete the overall market engineering process and arrive at the exact statistics of each market segment and subsegment, the data triangulation and market breakdown procedures were employed, wherever applicable. The data was triangulated by studying various factors and trends from both the demand and supply sides in the oil & gas sector.

Market definition

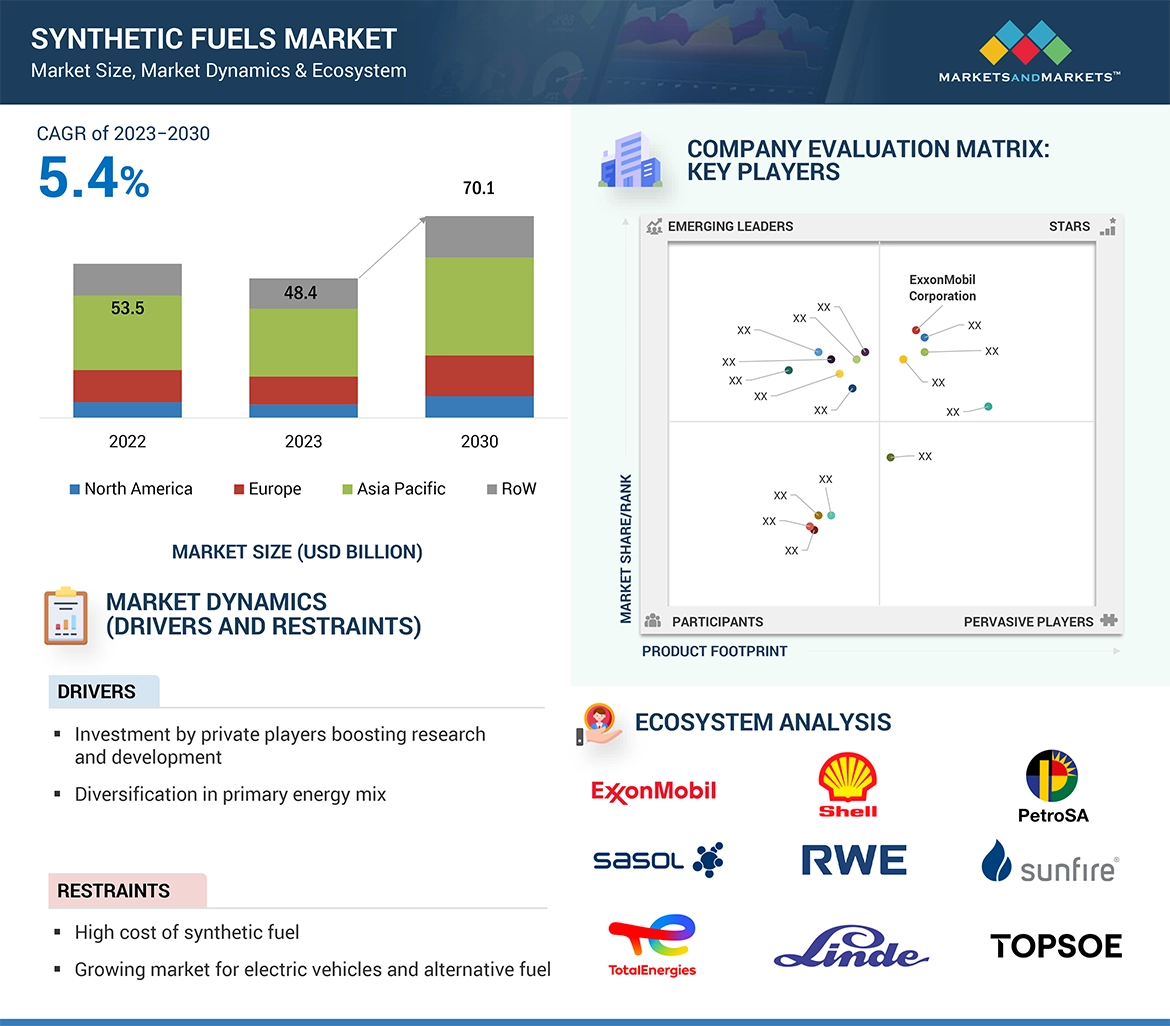
Synthetic fuel, also known as synfuel or synthetic petroleum, refers to a type of fuel that is produced from non-petroleum sources through chemical processes. Unlike traditional fossil fuels such as gasoline, diesel, or natural gas, which are derived from crude oil and natural gas reservoirs, synthetic fuels are artificially created. They are designed to have similar properties and characteristics to conventional fossil fuels, making them compatible with existing combustion engines and infrastructure.

Synthetic fuels can be produced from a variety of feedstocks, including coal, natural gas, biomass, and even carbon dioxide (CO2) captured from industrial processes or the atmosphere. The production of synthetic fuels typically involves a series of chemical reactions, such as Fischer-Tropsch synthesis or methanol-to-gasoline conversion, to transform these feedstocks into liquid or gaseous fuels. These fuels can then be used in vehicles, aircraft, power generation, and other applications where conventional fossil fuels are traditionally utilized.

Key Stakeholders

  • Raw material manufacturers
  • Technology support providers
  • Manufacturers of synthetic fuel
  • Traders, distributors, and suppliers
  • Regulatory Bodies and Government Agencies
  • Research & Development (R&D) Institutions
  • End-use Industries
  • Consulting Firms, Trade Associations, and Industry Bodies
  • Investment Banks and Private Equity Firms

Report Objectives:

  • To analyze and forecast the market size of synthetic fuels in terms of value
  • To provide detailed information regarding the major factors (drivers, restraints, challenges, and opportunities) influencing the regional market
  • To analyze and forecast the global synthetic fuels market on the basis of fuel type, application, end use, and region
  • To analyze the opportunities in the market for stakeholders and provide details of a competitive landscape for market leaders
  • To forecast the size of various market segments based on four major regions: North America, Europe, Asia Pacific, Rest of World (South America, and the Middle East & Africa), along with their respective key countries
  • To track and analyze the competitive developments, such as acquisitions, partnerships, investments, and expansions in the market
  • To strategically profile the key players and comprehensively analyze their market shares and core competencies

Available Customizations:

With the given market data, MarketsandMarkets offers customizations according to the client-specific needs.

The following customization options are available for the report:

  • Additional country-level analysis of the synthetic fuels market
  • Profiling of additional market players (up to 5)

Product Analysis

  • Product matrix, which gives a detailed comparison of the product portfolio of each company.
Custom Market Research Services

We will customize the research for you, in case the report listed above does not meet with your exact requirements. Our custom research will comprehensively cover the business information you require to help you arrive at strategic and profitable business decisions.

Request Customization
Report Code
CH 8814
Published ON
Oct, 2023
Choose License Type
BUY NOW
  • SHARE
X
Request Customization
Speak to Analyst
Speak to Analyst
OR FACE-TO-FACE MEETING
PERSONALIZE THIS RESEARCH
  • Triangulate with your Own Data
  • Get Data as per your Format and Definition
  • Gain a Deeper Dive on a Specific Application, Geography, Customer or Competitor
  • Any level of Personalization
REQUEST A FREE CUSTOMIZATION
LET US HELP YOU!
  • What are the Known and Unknown Adjacencies Impacting the Synthetic Fuels Market
  • What will your New Revenue Sources be?
  • Who will be your Top Customer; what will make them switch?
  • Defend your Market Share or Win Competitors
  • Get a Scorecard for Target Partners
CUSTOMIZED WORKSHOP REQUEST
+1-888-600-6441
  • Call Us
  • +1-888-600-6441 (Corporate office hours)
  • +1-888-600-6441 (US/Can toll free)
  • +44-800-368-9399 (UK office hours)
CONNECT WITH US
ABOUT TRUST ONLINE
©2024 MarketsandMarkets Research Private Ltd. All rights reserved
DMCA.com Protection Status Website Feedback