Thermo Compression Forming Market

Thermo Compression Forming Market by Foam Type (Thermoplastic Foam, Needle-Punch Nonwovens, Light Weight Glass Mat Thermoplastic), End-use Industry (Automotive, Aerospace, Construction, Medical, Electrical & Electronics) - Global Forecast to 2029

Report Code: CH 9143 Sep, 2024, by marketsandmarkets.com

Updated on : October 04, 2024

Thermo Compression Forming Market

The global thermo compression forming market is valued at USD 11.0 billion in 2024 and is projected to reach USD 13.37 billion by 2029, growing at 4.09% cagr from 2024 to 2029. The thermo-compression forming market has been experiencing growth due to new and increasing demand across various sectors such as transportation, construction, medical, and electrical & electronics. The enhanced formulation has led to the development of new and improved products that are highly efficient. In addition, the expansion of infrastructure and construction projects, along with the urgent need for sustainable products, are also contributing to the market growth.

Automotive is the key demanding sector for thermo compression forming due to the rising need for lightweight, high-strength materials for enhanced fuel efficiency. The needle punch nonwoven segment is a boon for the thermo compression forming market as it offers lightweight, high-strength, and cost-effective products perfect for car interiors and insulation.

Attractive Opportunities in Thermo Compression Forming Market

Thermo Compression Forming Market

Source: Interviews with Experts, Secondary Sources, and MarketsandMarkets Analysis

To know about the assumptions considered for the study, Request for Free Sample Report

Thermo Compression Forming Market

Source: Interviews with Experts, Secondary Sources, and MarketsandMarkets Analysis

Thermo Compression Forming Market Dynamics

Driver: Rising demand for lightweight materials

Demand for various thermo compression forming products from the manufacturing sector has been increasing, specifically due to the rising trend of lightweight materials in producing different commodities. As manufacturing industries continue to reduce the weight of products for performance and energy conservation, thermo compression forming is widely preferred, particularly in the automobile, aerospace, and electronic industries.

Thermo-plastic bonding (TPB) is in demand due to the high degree of customization of molded parts and components offered by producers. This technique is preferred because it is accurate and fast, making it suitable mainly for fabricating components with intricate shapes common in cars and aircraft. Thus, by producing lightweight structures and components, this method contributes to lower fuel consumption rates and enhanced performance of cars and flying machines. In the electronics industry, TPB supports the production of thin and light products that are essential for current technologies, such as smartphones and other wearable devices.

Thermo compression forming has vast applications in vehicles and thermal and acoustic insulations of electronics, improving product performance in various aspects. As more industries seek ways to improve productivity, shorten production cycles, and meet regulatory requirements, this trend is expected to continue in manufacturing techniques.

Restraints: Instability in raw material prices

The thermo-compression forming market heavily relies on thermoplastic composites and foam, which are extensively used in various forms. However, this market segment is susceptible to changes in the global supply and demand pipeline. These materials, which are used to form lightweight and high–strength parts necessary for automotive and aerospace applications, depend on numerous factors, such as disruption in the supply chain, geopolitical risks, and fluctuation in the price of petrochemicals.

Natural catastrophes, political instabilities, or any other hindrances to the transportation process may result in raw material scarcities or high instabilities, leading to a rise in costs; Pestel analysis revealed that trade barriers or conflict may also affect the availability and price of thermoplastics.

The cost of petrochemicals, which is subject to frequent changes, is the second factor attributed to price fluctuation. Furthermore, the rising need for products with high-performance properties and specialty materials in various industries, including automotive and aerospace, stresses the supply chain even more due to limited manufacturing capabilities.

Manufacturers using thermo compression forming face challenges in controlling costs due to fluctuations in raw material prices. These variations can affect the pricing and profitability of their products, making it difficult for firms to control their pricing. As emerging markets demand more sophisticated materials, supply chain risks will be crucial to the stability of the thermo compression forming market.

Opportunities: Growing demand for thermo compression forming in emerging economies

As developing countries are experiencing rapid industrialization, there is an increase in thermo compression forming due to the growth of the automotive, aerospace, and construction industries. In particular, the emerging markets of India, China, and Brazil have experienced rapid industrialization and urbanization in recent years, substantiating the need to adopt highly sophisticated manufacturing technologies. Thermo compression forming, widely used for creating high-performance, lightweight, and durable products, is preferred in these regions to cope with the changing trends in modern sectors.

Thus, recognizing international competition, newly industrialized countries need higher production levels to increase production efficiency and product quality. Thermo compression forming effectively manufactures intricate, high-precision parts for automotive applications and aerospace structures. The automotive industry benefits from this technique because it enables the production of lightweight yet strong parts for vehicles, leading to higher fuel efficiency and lower emissions.

Another application area of thermo compression forming is in the construction industry, where it is used to manufacture strong, long-lasting materials that can sustain critical and unfavorable external climate conditions.

Challenges: Issues related to supply chain disruption

The market is affected by disruptions in the supply chain, which may occur at the supply end of raw materials or during the transportation of the final thermo compression forming product. These disruptions comprise political instabilities, disasters, and economic barriers, which can significantly affect the availability and price of materials such as thermoplastic composites and foam required in thermo-compression forming applications.

Supply chain disruptions can lead to delays due to unpredictable material supply, posing a significant challenge for manufacturing organizations. Supply management is vital for acquiring and maintaining quality products to support production schedules and meet clients’ needs. Disruptions can cause manufacturers to struggle to obtain necessary supplies if their initial suppliers run out of stock, leading to increased expenses and longer production times.

These disruptions affect the production rate and manufacturing capacity, putting pressure on the ability to meet customer demands. This is concerning because it leads to unpredictable delivery times, which may frustrate clients and impact business customer relations. Manufacturers are often forced to react and strive to maintain production levels while dealing with increased costs. Therefore, disruption in the supply chain impacts the thermo compression forming market by leading to higher costs, low production capacity, and failure to meet consumer needs.

Thermo Compression Forming Market Ecosystem

Thermo Compression Forming Market Ecosystem

Thermo compression forming ecosystem centralizes end-use segments such as consumer durables, electronics and electrical, medical products, automotive, aerospace, and others.

Thermo-compression forming is widely used in construction, electronics, medical, automotive, aerospace, and consumer goods industries. This process can manufacture various products, including crosslinked polyethylene foam (XLPE) and polypropylene foam (XLPP), thermoplastic foam, and EVA foam. The application of this technology allows for the creation of durable and lightweight parts, which are valuable in multiple high-performance industries. Polyurethane and other types of thermoplastic foams are essential materials that support the production of items meeting specific industrial standards and improving cushioning, protection, and insulation.

Thermo-compression forming in needle-punch nonwovens offers increased strength and sustainability. This technology can be used in the production of consumer products and construction materials. Innovation is driven by sustainability challenges and the development of eco-friendly substitutes in the material engineering industries.

Polyurethane foam to be largest foam type of thermo compression forming market during forecast period

Recent developments in polyurethane foam have been marked due to its thermal stability, mechanical strength, and durability surpassing all the standard features of thermo compression forming. These thermo-compressed components are applied extensively in automobile, civil engineering, aerospace, medical equipment, and electronics industries, where components with high performance and reliability are prerequisites. Polyurethane foam enables the manufacturing of lightweight but strong and highly resistant parts.

In North America, particularly in the US, the thermo compression forming process is highly in demand in infrastructure, medical, and construction industries. The automotive and aerospace sectors also benefit from this process, allowing for the production of lighter, cheaper parts without compromising performance. These advantages prompt industries to embrace thermo compression forming techniques as creating sustainable, energy-efficient, and cost-effective parts becomes increasingly important in today’s industrial era.

Moreover, the new entrant economies are instrumental in the global thermo compression forming market growth due to technological advancements and burgeoning industrial uses. Growing industrialization in the Asia Pacific and Latin America, along with the increasing demand for high-performance materials in global industries, contribute to the growth of this market. Thermo-compression forming is increasingly being adopted due to its contribution to sustainable product solutions in response to the growing demand for sustainable products in the market.

Due to continuous technological developments and increasing industrial uses, the thermo compression forming market is expected to grow significantly. This growth is primarily driven by demand in the automotive, aerospace, and construction industries for lightweight, strong, and economical materials.

Construction to be largest end-use industry of thermo compression forming market during forecast period

The growth of the construction industry and the thermo compression forming market is driven by customer demand for lightweight, strong, and eco-friendly alternatives to traditional industrial materials, offering more design flexibility. New-age materials, such as thermoplastic composites and foams, are well-known for their exceptional durability, which is crucial for developing modern structures. These materials possess high energy efficiency, helping to reduce energy bills and minimize environmental impact, thereby promoting the construction of green buildings and sustainable construction practices.

One of the most important benefits of thermo compression forming for construction materials is the ability to deliver materials that meet sensitive fire safety requirements in today’s construction codes. Additionally, these materials offer more flexibility for architects and builders to design complex structures without compromising performance. Thermo-compressed components also transport and install more efficiently than traditional materials, reducing costs for large-scale construction projects.

With increased urban development, particularly in developing nations, thermo-compression forming is crucial for creating high-quality, long-lasting materials for modern construction. Its growing demand makes it an important technology for the global construction sector.

North America to account for largest share of thermo compression forming market during forecast period

North America is the largest regional market for thermo compression forming due to the growth witnessed in the construction and medical sectors in the region. With the expansion of construction operations in the US and Canadian markets, the use of compression-molded components in construction applications has increased. These lightweight and strong materials make them essential for modern structural development due to their energy efficiency, affordability, and flexible designs, which are integral to sustainable structures.

The medical device industry in the US has been growing due to government support and progress in the health sector. The need for thermo compression forming in manufacturing medical equipment is growing, as thermo compression forming allows the creation of high-quality and durable medical instruments at a reasonable price. Other needs in the healthcare industry, such as the rising elderly population, are likely to drive the demand for better medical instruments and devices in the future, thus driving the market.

Several factors can be attributed to the high growth rate of thermo compression forming in North America. The region is currently seeing a rise in the middle-class population, which is creating a demand for better infrastructure, healthcare, and consumer goods. The production of these goods requires high-performance thermo-compression forming. In addition, there is a push for energy-saving measures, promoting the use of lightweight materials in various sectors, such as the construction and automotive industries. Global technological development in material science, as well as manufacturing technologies, also contributes to the market’s growth due to enhanced innovation in product and process designs.

Thermo Compression Forming Market by Region

To know about the assumptions considered for the study, download the pdf brochure

Thermo Compression Forming Market Players

FLEXTECH (US), Janco, Inc. (US), Formed Solutions (US), Core Molding Technologies (US), and UFP Technologies, Inc. (US), Ray Products Company Inc. (US), Engineered Plastic Products Inc. (US), Present Advanced Composites Inc. (US), Tooling Tech Group (US), Tech Plaastic Industrie (India), Toray Advanced Composites (US), Trident Components LLC (US), RCO Engineering (US), Sonfarrel Aerospace LLC (US), and Tri-Mack Plastics Manufacturing Corporation (US) are the key players in the global thermo compression forming market.

Currently, FLEXTECH acts as one of the key market players that addresses the challenges of thermo compression forming globally and focuses on the production of lightweight and highly durable components. The manufacturing company was established in 1992 and specializes in offering various custom foam products to emerging sectors, including automotive, aerospace, construction, medical, and electrical & electronics. It integrates the latest engineering and designing concepts with more focused foam lamination, fabrication, and thermoforming services. Africa-based FLEXTECH dominates the thermo compression forming market worldwide, with a particular focus on innovation and the sustainability of manufacturing processes.

Thermo Compression Forming Market Report Scope

Report Metric

Details

Market Size Available for Years

2021–2029

Base Year Considered

2023

Forecast Period

2024–2029

Forecast Units

Value (USD Million/Billion)

Segments Covered

By Foam Type, By End-use Industry, and By Region

Geographies Covered

North America, Europe, Asia Pacific, South America, and Middle East & Africa

Companies Covered

FLEXTECH, JANCO, INC., Intertech Products, Inc., Formed Solutions, Ray Products, Core Molding Technologies, UFP Technologies Inc., Present Advanced Composites Inc., Tooling Tech Group, and Engineered Plastic Products
A total of 15+ players are covered.

Based on foam type, the thermo compression forming market has been segmented as follows:
  • Thermoplastic Foams
  • Needle-Punch Nonwovens
  • Light Weight Glass Mat Thermoplastic
Based on End-use Industry, the thermo compression forming market has been segmented as follows:
  • Automotive
  • Aerospace
  • Medical
  • Construction
  • Electrical & Electronics
  • Other End-use Industries
Based on the region, the thermo compression forming market has been segmented as follows:
  • Asia Pacific
  • Europe
  • North America
  • Middle East & Africa
  • South America

Recent Developments

  • In July 2024, FLEXTECH collaborated with Sun Path Products, Inc. This collaboration focused on designing and selecting materials for the laminated and molded Spyn System foam components integral to skydivers’ equipment.
  • In July 2023, Toray Advanced Composites announced the expansion of its plant operations in Morgan Hill. The upcoming facility will encompass an additional 74,000 square feet (6,800 square meters) within the existing campus. This expansion focuses on enhancing the company’s operations to meet the growing demand of the aerospace, urban air mobility, defense, commercial, and industrial markets for high-quality advanced composites.
  • In October 2021, Intertech Products, Inc. acquired Oji Intertech, Inc., which will operate as Intertech Products, Inc. This acquisition focuses on effectively serving the automotive, transportation, and industrial packaging sectors.
  • In February 2024, Janco, Inc. started Janco Medical, a dedicated division focusing on cleanroom manufacturing and medical packaging. The division leverages ISO 13485 and FDA registrations, boasting ISO 14644-1 Class 7 and 8 certified cleanrooms.
  • In January 2021, Tooling Tech Group (TTG) started a new 72,000-square-foot facility in La Vergne, Tennessee, consolidating its Automation division previously spread across two buildings in Murfreesboro, Tennessee. This new facility specializes in the design and manufacturing of assembly, material handling, dispensing, sorting, testing, welding, and fastening solutions to serve the automotive, cosmetic, electrical, construction, and life sciences industries.

Frequently Asked Questions (FAQ):

To speak to our analyst for a discussion on the above findings, click Speak to Analyst

TABLE OF CONTENTS
 
1 INTRODUCTION 
2 RESEARCH METHODOLOGY
3 EXECUTIVE SUMMARY
 
4 PREMIUM INSIGHTS (Page No. - 48)
    4.1 ATTRACTIVE OPPORTUNITIES FOR PLAYERS IN THERMO COMPRESSION FORMING MARKET 
    4.2 THERMO COMPRESSION FORMING MARKET, BY TYPE (VOLUME) 
    4.3 NORTH AMERICAN THERMO COMPRESSION FORMING MARKET,  BY END-USE INDUSTRY AND COUNTRY (VOLUME) 
    4.4 THERMO COMPRESSION FORMING MARKET: DEVELOPED VS. DEVELOPING ECONOMIES (VOLUME) 
    4.5 THERMO COMPRESSION FORMING MARKET, BY COUNTRY (VOLUME) 
 
5 MARKET OVERVIEW (Page No. - 51)
    5.1 INTRODUCTION 
    5.2 KEY PLASTIC PRODUCTION FIGURES 
    5.3 KEY EMERGING ECONOMIES VS. EU27 AND US 
    5.4 MARKET DYNAMICS 
           5.4.1 DRIVERS
                    5.4.1.1 Increasing demand for lightweight materials upscaling industrial growth
                    5.4.1.2 Pressing need for weight reduction in EVs
                    5.4.1.3 Technological advancements in manufacturing and process optimization
           5.4.2 RESTRAINTS
                    5.4.2.1 Volatility in raw material prices
           5.4.3 OPPORTUNITIES
                    5.4.3.1 Increasing demand for thermo compression forming in emerging economies
                    5.4.3.2 Pressing need for advanced composite materials in aerospace industry
           5.4.4 CHALLENGES
                    5.4.4.1 Supply chain disruptions
    5.5 PORTER’S FIVE FORCES ANALYSIS 
           5.5.1 THREAT OF NEW ENTRANTS
           5.5.2 THREAT OF SUBSTITUTES
           5.5.3 BARGAINING POWER OF BUYERS
           5.5.4 BARGAINING POWER OF SUPPLIERS
           5.5.5 INTENSITY OF COMPETITIVE RIVALRY
    5.6 KEY STAKEHOLDERS AND BUYING CRITERIA 
           5.6.1 KEY STAKEHOLDERS IN BUYING PROCESS
           5.6.2 BUYING CRITERIA
    5.7 MACROECONOMIC OUTLOOK 
           5.7.1 INTRODUCTION
           5.7.2 GDP TRENDS AND FORECAST
           5.7.3 TRENDS IN GLOBAL CONSTRUCTION INDUSTRY
           5.7.4 TRENDS IN GLOBAL AUTOMOTIVE INDUSTRY
    5.8 VALUE CHAIN ANALYSIS 
    5.9 PRICING ANALYSIS 
           5.9.1 AVERAGE SELLING PRICE TREND, BY REGION
           5.9.2 AVERAGE SELLING PRICE TREND, BY TYPE
           5.9.3 AVERAGE SELLING PRICE TREND, BY END-USE INDUSTRY
           5.9.4 AVERAGE SELLING PRICE TREND OF KEY PLAYERS, BY END-USE INDUSTRY
    5.10 TRADE ANALYSIS 
           5.10.1 EXPORT SCENARIO (HS CODE 390950)
           5.10.2 IMPORT SCENARIO (HS CODE 390950)
    5.11 REGULATORY LANDSCAPE AND STANDARDS 
           5.11.1 REGULATIONS IMPACTING THERMO COMPRESSION FORMING BUSINESS
           5.11.2 REGULATORY BODIES, GOVERNMENT AGENCIES, AND OTHER ORGANIZATIONS
    5.12 ECOSYSTEM ANALYSIS 
    5.13 TRENDS/DISRUPTIONS IMPACTING CUSTOMER BUSINESS 
    5.14 INVESTMENT AND FUNDING SCENARIO 
    5.15 PATENT ANALYSIS 
           5.15.1 METHODOLOGY
           5.15.2 PUBLICATION TRENDS
           5.15.3 JURISDICTION ANALYSIS
           5.15.4 TOP APPLICANTS
    5.16 TECHNOLOGY ANALYSIS 
           5.16.1 KEY TECHNOLOGIES
                    5.16.1.1 Polyurethane foam
                    5.16.1.2 Cross-linked polyethylene (XLPE) foam
                    5.16.1.3 Cross-linked polypropylene (XLPP) foam
                    5.16.1.4 Ethylene vinyl acetate (EVA)
           5.16.2 COMPLIMENTARY TECHNOLOGIES
                    5.16.2.1 PET/Bicomponent PET blends
                    5.16.2.2 Natural fiber/PP blends
           5.16.3 ADJACENT TECHNOLOGIES
                    5.16.3.1 Extrusion molding
                    5.16.3.2 Injection molding
    5.17 IMPACT OF AI/GEN AI ON THERMO COMPRESSION FORMING MARKET 
    5.18 GLOBAL ECONOMIC SCENARIO AFFECTING MARKET GROWTH 
           5.18.1 RUSSIA–UKRAINE WAR
           5.18.2 CHINA
                    5.18.2.1 Decreasing FDI cooling China’s growth trajectory
                    5.18.2.2 Environmental commitments
           5.18.3 EUROPE
                    5.18.3.1 Energy crisis in Europe
           5.18.4 CRISIS THREATENING GLOBAL TRADE
           5.18.5 OUTLOOK FOR CHEMICAL INDUSTRY
           5.18.6 OPEC+ EXTENDS OIL OUTPUT CUTS TILL 2025
    5.19 CASE STUDY ANALYSIS 
           5.19.1 STAHLIN’S PRESS SUCCESS GOES WELL BEYOND DESIGN AND MANUFACTURING
           5.19.2 INFLUENCE OF COMPRESSION MOLDING ON MECHANICAL AND TRIBOLOGICAL BEHAVIOR OF HYBRID POLYMER MATRIX COMPOSITES
           5.19.3 STUDY OF COMPRESSION MOLDING METHOD FOR MANUFACTURING UHMWPE LINER
    5.20 KEY CONFERENCES AND EVENTS, 2024–2025 
 
6 THERMO COMPRESSION FORMING MARKET, BY TYPE (Page No. - 97)
    6.1 INTRODUCTION 
    6.2 THERMOPLASTIC FOAMS 
           6.2.1 EXPANDING AUTOMOTIVE SECTOR TO PROPEL DEMAND
           6.2.2 POLYURETHANE FOAM
           6.2.3 CROSS-LINKED POLYETHYLENE (XLPE) FOAM
           6.2.4 CROSS-LINKED POLYPROPYLENE (XLPP) FOAM
           6.2.5 ETHYL VINYL ACETATE (EVA) FOAM
           6.2.6 OTHER THERMOPLASTIC FOAMS
    6.3 NEEDLE-PUNCH NONWOVENS 
           6.3.1 HIGH USE IN VARIOUS APPLICATIONS DUE TO SEVERAL DISTINCTIVE CHARACTERISTICS TO BOOST MARKET GROWTH
           6.3.2 PET/BICOMPONENT PET BLEND
           6.3.3 PET/BICOMPONENT PET BLEND
           6.3.4 OTHER NEEDLE-PUNCH NONWOVENS
    6.4 LIGHTWEIGHT GLASS MAT THERMOPLASTIC (LWGMT) 
           6.4.1 ABILITY TO SIGNIFICANTLY REDUCE COMPONENT WEIGHT AND HIGH ACOUSTIC RESISTANCE TO BOOST DEMAND
 
7 THERMO COMPRESSION FORMING MARKET, BY END-USE INDUSTRY (Page No. - 124)
    7.1 INTRODUCTION 
    7.2 AUTOMOTIVE 
           7.2.1 BOOMING AUTOMOTIVE SECTOR TO DRIVE DEMAND
    7.3 CONSTRUCTION 
           7.3.1 INCREASED URBANIZATION AND PROACTIVE GOVERNMENT-LED INVESTMENTS IN CONSTRUCTION ACTIVITIES TO DRIVE DEMAND
    7.4 AEROSPACE 
           7.4.1 RISING PASSENGER TRAFFIC AND INCREASING JET DEMAND TO DRIVE MARKET
    7.5 MEDICAL 
           7.5.1 INCREASING DISPOSABLE INCOME AND CHANGING CONSUMER PREFERENCES TO DRIVE MARKET
    7.6 ELECTRICAL & ELECTRONICS 
           7.6.1 INCREASING DEMAND FOR HIGH-PERFORMANCE COMPONENTS TO FUEL MARKET GROWTH
    7.7 OTHER END-USE INDUSTRIES 
 
8 THERMO COMPRESSION FORMING MARKET, BY REGION (Page No. - 143)
    8.1 INTRODUCTION 
    8.2 ASIA PACIFIC 
           8.2.1 CHINA
                    8.2.1.1 Significant growth in sales and manufacturing of automobiles to drive demand
           8.2.2 INDIA
                    8.2.2.1 Increasing infrastructure development and demand for energy-efficient materials to drive market
           8.2.3 JAPAN
                    8.2.3.1 Increasing focus on enhancing reliability and durability of medical devices to fuel market growth
           8.2.4 SOUTH KOREA
                    8.2.4.1 Developing aerospace industry and adoption of lightweight aircraft components to boost demand
           8.2.5 REST OF ASIA PACIFIC
    8.3 NORTH AMERICA 
           8.3.1 US
                    8.3.1.1 Expansion of medical sector to boost demand
           8.3.2 CANADA
                    8.3.2.1 Increasing investments in construction industry to fuel demand
           8.3.3 MEXICO
                    8.3.3.1 Rising investments in infrastructure, energy, and commercial construction projects to drive market
    8.4 EUROPE 
           8.4.1 GERMANY
                    8.4.1.1 Increasing demand for advanced building insulation materials to drive market
           8.4.2 UK
                    8.4.2.1 Increasing demand for lightweight, durable, and highly efficient materials to drive market
           8.4.3 FRANCE
                    8.4.3.1 Innovations in medical sector to drive demand
           8.4.4 SPAIN
                    8.4.4.1 Recovery of construction industry to increase demand
           8.4.5 ITALY
                    8.4.5.1 Substantial growth in medical device industry to boost market growth
           8.4.6 REST OF EUROPE
    8.5 SOUTH AMERICA 
           8.5.1 BRAZIL
                    8.5.1.1 Booming consumer market to drive demand
           8.5.2 ARGENTINA
                    8.5.2.1 Rising investments in healthcare infrastructure development and demand for high-end medical equipment to fuel market growth
           8.5.3 REST OF SOUTH AMERICA
    8.6 MIDDLE EAST & AFRICA 
           8.6.1 GCC COUNTRIES
                    8.6.1.1 Saudi Arabia
                               8.6.1.1.1 Increased investments in construction industry to propel demand
                    8.6.1.2 UAE
                               8.6.1.2.1 Expanding electronics industry to drive market
                    8.6.1.3 Rest of GCC countries
           8.6.2 SOUTH AFRICA
                    8.6.2.1 Increasing production of new vehicles to drive market
           8.6.3 REST OF MIDDLE EAST & AFRICA
 
9 COMPETITIVE LANDSCAPE (Page No. - 191)
    9.1 OVERVIEW 
    9.2 KEY PLAYER STRATEGIES/RIGHT TO WIN, 2019–2024 
    9.3 MARKET SHARE ANALYSIS, 2023 
           9.3.1 RANKING ANALYSIS, 2023
    9.4 REVENUE ANALYSIS, 2021–2023 
    9.5 COMPANY VALUATION AND FINANCIAL METRICS 
    9.6 BRAND/PRODUCT COMPARISON 
    9.7 COMPANY EVALUATION MATRIX: KEY PLAYERS, 2023 
           9.7.1 STARS
           9.7.2 EMERGING LEADERS
           9.7.3 PERVASIVE PLAYERS
           9.7.4 PARTICIPANTS
           9.7.5 COMPANY FOOTPRINT: KEY PLAYERS, 2023
                    9.7.5.1 Company footprint
                    9.7.5.2 End-use industry footprint
                    9.7.5.3 Region footprint
    9.8 COMPANY EVALUATION MATRIX: STARTUPS/SMES, 2023 
           9.8.1 PROGRESSIVE COMPANIES
           9.8.2 RESPONSIVE COMPANIES
           9.8.3 DYNAMIC COMPANIES
           9.8.4 STARTING BLOCKS
           9.8.5 COMPETITIVE BENCHMARKING: STARTUPS/SMES, 2023
                    9.8.5.1 Detailed list of key startups/SMEs
                    9.8.5.2 Competitive benchmarking of key startups/SMEs
    9.9 COMPETITIVE SCENARIOS 
           9.9.1 DEALS
           9.9.2 EXPANSIONS
 
10 COMPANY PROFILES (Page No. - 209)
     10.1 KEY PLAYERS 
             10.1.1 FLEXTECH
                        10.1.1.1 Business overview
                        10.1.1.2 Products/Solutions/Services offered
                        10.1.1.3 Recent developments
                                     10.1.1.3.1 Deals
                        10.1.1.4 MnM view
                                     10.1.1.4.1 Key strengths/Right to win
                                     10.1.1.4.2 Strategic choices
                                     10.1.1.4.3 Weaknesses/Competitive threats
             10.1.2 JANCO, INC.
                        10.1.2.1 Business overview
                        10.1.2.2 Products/Solutions/Services offered
                        10.1.2.3 Recent developments
                                     10.1.2.3.1 Expansions
                        10.1.2.4 MnM view
                                     10.1.2.4.1 Key strengths/Right to win
                                     10.1.2.4.2 Strategic choices
                                     10.1.2.4.3 Weaknesses/Competitive threats
             10.1.3 INTERTECH PRODUCTS, INC.
                        10.1.3.1 Business overview
                        10.1.3.2 Products/Solutions/Services offered
                        10.1.3.3 Recent developments
                                     10.1.3.3.1 Deals
                        10.1.3.4 MnM view
                                     10.1.3.4.1 Key strengths/Right to win
                                     10.1.3.4.2 Strategic choices
                                     10.1.3.4.3 Weaknesses/Competitive threats
             10.1.4 FORMED SOLUTIONS
                        10.1.4.1 Business overview
                        10.1.4.2 Products/Solutions/Services offered
                        10.1.4.3 MnM view
                                     10.1.4.3.1 Key strengths/Right to win
                                     10.1.4.3.2 Strategic choices
                                     10.1.4.3.3 Weaknesses/Competitive threats
             10.1.5 CORE MOLDING TECHNOLOGIES
                        10.1.5.1 Business overview
                        10.1.5.2 Products/Solutions/Services offered
                        10.1.5.3 MnM view
                                     10.1.5.3.1 Key strengths/Right to win
                                     10.1.5.3.2 Strategic choices
                                     10.1.5.3.3 Weaknesses/Competitive threats
             10.1.6 UFP TECHNOLOGIES, INC.
                        10.1.6.1 Business overview
                        10.1.6.2 Products/Solutions/Services offered
             10.1.7 RAY PRODUCTS COMPANY INC.
                        10.1.7.1 Business overview
                        10.1.7.2 Products/Solutions/Services offered
             10.1.8 ENGINEERED PLASTIC PRODUCTS INC.
                        10.1.8.1 Business overview
                        10.1.8.2 Products/Solutions/Services offered
             10.1.9 PRESENT ADVANCED COMPOSITES INC.
                        10.1.9.1 Business overview
                        10.1.9.2 Products/Solutions/Services offered
             10.1.10 TOOLING TECH GROUP
                        10.1.10.1 Business overview
                        10.1.10.2 Products/Solutions/Services offered
                        10.1.10.3 Recent developments
                                     10.1.10.3.1 Expansions
             10.1.11 TECH PLAASTIC INDUSTRIE
                        10.1.11.1 Business overview
                        10.1.11.2 Products/Solutions/Services offered
             10.1.12 TORAY ADVANCED COMPOSITES
                        10.1.12.1 Business overview
                        10.1.12.2 Products/Solutions/Services offered
                        10.1.12.3 Recent developments
                                     10.1.12.3.1 Expansions
             10.1.13 TRIDENT COMPONENTS, LLC
                        10.1.13.1 Business overview
                        10.1.13.2 Products/Solutions/Services offered
             10.1.14 RCO ENGINEERING
                        10.1.14.1 Business overview
                        10.1.14.2 Products/Solutions/Services offered
             10.1.15 THE PLATINUM TOOL GROUP
                        10.1.15.1 Business overview
                        10.1.15.2 Products/Solutions/Services offered
             10.1.16 SONFARREL AEROSPACE LLC
                        10.1.16.1 Business overview
                        10.1.16.2 Products/Solutions/Services offered
             10.1.17 TRI-MACK PLASTICS MANUFACTURING CORPORATION
                        10.1.17.1 Business overview
                        10.1.17.2 Products/Solutions/Services offered
             10.1.18 AMRAZ LTD.
                        10.1.18.1 Business overview
                        10.1.18.2 Products/Solutions/Services offered
             10.1.19 KT PLASTICS INCORPORATED
                        10.1.19.1 Business overview
                        10.1.19.2 Products/Solutions/Services offered
             10.1.20 ROTATIONAL MOLDING OF UTAH
                        10.1.20.1 Business overview
                        10.1.20.2 Products/Solutions/Services offered
             10.1.21 REDLINE PLASTICS
                        10.1.21.1 Business overview
                        10.1.21.2 Products/Solutions/Services offered
                        10.1.21.3 Recent developments
                                     10.1.21.3.1 Expansions
             10.1.22 CHICAGO GASKET CO.
                        10.1.22.1 Business overview
                        10.1.22.2 Products/Solutions/Services offered
             10.1.23 HAYSITE
                        10.1.23.1 Business overview
                        10.1.23.2 Products/Solutions/Services offered
             10.1.24 AMI PLASTICS
                        10.1.24.1 Business overview
                        10.1.24.2 Products/Solutions/Services offered
             10.1.25 LINECROSS
                        10.1.25.1 Business overview
                        10.1.25.2 Products/Solutions/Services offered
 
11 ADJACENT AND RELATED MARKETS (Page No. - 246)
     11.1 INTRODUCTION 
     11.2 MOLDED PLASTIC MARKET 
             11.2.1 MARKET DEFINITION
             11.2.2 MOLDED PLASTICS: MARKET OVERVIEW
             11.2.3 MOLDED PLASTICS MARKET ANALYSIS, BY TECHNOLOGY
             11.2.4 MOLDED PLASTICS MARKET, BY TYPE
             11.2.5 MOLDED PLASTICS MARKET, BY APPLICATION
             11.2.6 MOLDED PLASTICS MARKET, BY REGION
 
12 APPENDIX (Page No. - 254)
     12.1 DISCUSSION GUIDE 
     12.2 KNOWLEDGESTORE: MARKETSANDMARKETS’ SUBSCRIPTION PORTAL 
     12.3 CUSTOMIZATION OPTIONS 
     12.4 RELATED REPORTS 
     12.5 AUTHOR DETAILS 
 
 
LIST OF TABLES (240 TABLES)
 
TABLE 1 INCLUSIONS AND EXCLUSIONS
TABLE 2 DEFINITION AND INCLUSIONS, BY TYPE
TABLE 3 DEFINITION AND INCLUSIONS, BY END-USE INDUSTRY
TABLE 4 THERMO COMPRESSION FORMING MARKET SNAPSHOT, 2024 VS. 2029
TABLE 5 THERMO COMPRESSION FORMING MARKET: PORTER’S FIVE FORCES ANALYSIS
TABLE 6 INFLUENCE OF STAKEHOLDERS ON BUYING PROCESS, BY END-USE INDUSTRY (%)
TABLE 7 KEY BUYING CRITERIA, BY END-USE INDUSTRY
TABLE 8 GDP TRENDS AND FORECAST, 2021–2029
TABLE 9 TRENDS OF GLOBAL AUTOMOTIVE INDUSTRY
TABLE 10 INDICATIVE PRICING TREND OF THERMO COMPRESSION FORMING, BY REGION, 2021–2023 (USD/KG)
TABLE 11 INDICATIVE PRICING TREND OF THERMO COMPRESSION FORMING OFFERED  BY KEY PLAYERS, BY END-USE INDUSTRY, 2023 (USD/KG)
TABLE 12 EXPORT DATA RELATED TO HS CODE 390950-COMPLIANT PRODUCTS,  BY COUNTRY, 2021–2023 (USD THOUSAND)
TABLE 13 IMPORT DATA RELATED TO HS CODE 390950-COMPLIANT PRODUCTS,  BY COUNTRY, 2021–2023 (USD THOUSAND)
TABLE 14 NORTH AMERICA: REGULATORY BODIES, GOVERNMENT AGENCIES, AND OTHER ORGANIZATIONS
TABLE 15 EUROPE: REGULATORY BODIES, GOVERNMENT AGENCIES, AND OTHER ORGANIZATIONS
TABLE 16 ASIA PACIFIC: REGULATORY BODIES, GOVERNMENT AGENCIES, AND OTHER ORGANIZATIONS
TABLE 17 ROLES OF COMPANIES IN THERMO COMPRESSION FORMING ECOSYSTEM
TABLE 18 INVESTMENT AND FUNDING SCENARIO
TABLE 19 TOP PATENT OWNERS
TABLE 20 THERMO COMPRESSION FORMING MARKET: KEY CONFERENCES AND EVENTS, 2024–2025
TABLE 21 THERMO COMPRESSION FORMING MARKET, BY TYPE, 2021–2023 (USD MILLION)
TABLE 22 THERMO COMPRESSION FORMING MARKET, BY TYPE, 2024–2029 (USD MILLION)
TABLE 23 THERMO COMPRESSION FORMING MARKET, BY TYPE, 2021–2023 (KILOTON)
TABLE 24 THERMO COMPRESSION FORMING MARKET, BY TYPE, 2024–2029 (KILOTON)
TABLE 25 THERMOPLASTIC FOAMS: THERMO COMPRESSION FORMING MARKET,  BY REGION, 2021–2023 (USD MILLION)
TABLE 26 THERMOPLASTIC FOAMS: THERMO COMPRESSION FORMING MARKET,  BY REGION, 2024–2029 (USD MILLION)
TABLE 27 THERMOPLASTIC FOAMS: THERMO COMPRESSION FORMING MARKET,  BY REGION, 2021–2023 (KILOTON)
TABLE 28 THERMOPLASTIC FOAMS: THERMO COMPRESSION FORMING MARKET,  BY REGION, 2024–2029 (KILOTON)
TABLE 29 POLYURETHANE FOAM: THERMO COMPRESSION FORMING MARKET, BY REGION, 2021–2023 (USD MILLION)
TABLE 30 POLYURETHANE FOAM: THERMO COMPRESSION FORMING MARKET, BY REGION, 2024–2029 (USD MILLION)
TABLE 31 POLYURETHANE FOAM: THERMO COMPRESSION FORMING MARKET, BY REGION, 2021–2023 (KILOTON)
TABLE 32 POLYURETHANE FOAM: THERMO COMPRESSION FORMING MARKET, BY REGION, 2024–2029 (KILOTON)
TABLE 33 CROSS-LINKED POLYETHYLENE (XLPE) FOAM: THERMO COMPRESSION FORMING MARKET, BY REGION, 2021–2023 (USD MILLION)
TABLE 34 CROSS-LINKED POLYETHYLENE (XLPE) FOAM: THERMO COMPRESSION FORMING MARKET, BY REGION, 2024–2029 (USD MILLION)
TABLE 35 CROSS-LINKED POLYETHYLENE (XLPE) FOAM: THERMO COMPRESSION FORMING MARKET, BY REGION, 2021–2023 (KILOTON)
TABLE 36 CROSS-LINKED POLYETHYLENE (XLPE) FOAM: THERMO COMPRESSION FORMING MARKET, BY REGION, 2024–2029 (KILOTON)
TABLE 37 CROSS-LINKED POLYPROPYLENE (XLPP) FOAM: THERMO COMPRESSION FORMING MARKET, BY REGION, 2021–2023 (USD MILLION)
TABLE 38 CROSS-LINKED POLYPROPYLENE (XLPP) FOAM: THERMO COMPRESSION FORMING MARKET, BY REGION, 2024–2029 (USD MILLION)
TABLE 39 CROSS-LINKED POLYPROPYLENE (XLPP) FOAM: THERMO COMPRESSION FORMING MARKET, BY REGION, 2021–2023 (KILOTON)
TABLE 40 CROSS-LINKED POLYPROPYLENE (XLPP) FOAM: THERMO COMPRESSION FORMING MARKET, BY REGION, 2024–2029 (KILOTON)
TABLE 41 ETHYL VINYL ACETATE (EVA) FOAM: THERMO COMPRESSION FORMING MARKET, BY REGION, 2021–2023 (USD MILLION)
TABLE 42 ETHYL VINYL ACETATE (EVA) FOAM: THERMO COMPRESSION FORMING MARKET, BY REGION, 2024–2029 (USD MILLION)
TABLE 43 ETHYL VINYL ACETATE (EVA) FOAM: THERMO COMPRESSION FORMING MARKET, BY REGION, 2021–2023 (KILOTON)
TABLE 44 ETHYL VINYL ACETATE (EVA) FOAM: THERMO COMPRESSION FORMING MARKET, BY REGION, 2024–2029 (KILOTON)
TABLE 45 OTHER THERMOPLASTIC FOAMS: THERMO COMPRESSION FORMING MARKET,  BY REGION, 2021–2023 (USD MILLION)
TABLE 46 OTHER THERMOPLASTIC FOAMS: THERMO COMPRESSION FORMING MARKET,  BY REGION, 2024–2029 (USD MILLION)
TABLE 47 OTHER THERMOPLASTIC FOAMS: THERMO COMPRESSION FORMING MARKET,  BY REGION, 2021–2023 (KILOTON)
TABLE 48 OTHER THERMOPLASTIC FOAMS: THERMO COMPRESSION FORMING MARKET,  BY REGION, 2024–2029 (KILOTON)
TABLE 49 NEEDLE-PUNCH NONWOVENS: THERMO COMPRESSION FORMING MARKET,  BY REGION, 2021–2023 (USD MILLION)
TABLE 50 NEEDLE-PUNCH NONWOVENS: THERMO COMPRESSION FORMING MARKET,  BY REGION, 2024–2029 (USD MILLION)
TABLE 51 NEEDLE-PUNCH NONWOVENS: THERMO COMPRESSION FORMING MARKET,  BY REGION, 2021–2023 (KILOTON)
TABLE 52 NEEDLE-PUNCH NONWOVENS: THERMO COMPRESSION FORMING MARKET,  BY REGION, 2024–2029 (KILOTON)
TABLE 53 PET/BICOMPONENT PET BLEND: THERMO COMPRESSION FORMING MARKET,  BY REGION, 2021–2023 (USD MILLION)
TABLE 54 PET/BICOMPONENT PET BLEND: THERMO COMPRESSION FORMING MARKET,  BY REGION, 2024–2029 (USD MILLION)
TABLE 55 PET/BICOMPONENT PET BLEND: THERMO COMPRESSION FORMING MARKET,  BY REGION, 2021–2023 (KILOTON)
TABLE 56 PET/BICOMPONENT PET BLEND: THERMO COMPRESSION FORMING MARKET,  BY REGION, 2024–2029 (KILOTON)
TABLE 57 NATURAL FIBER/PP BLEND: THERMO COMPRESSION FORMING MARKET,  BY REGION, 2021–2023 (USD MILLION)
TABLE 58 NATURAL FIBER/PP BLEND: THERMO COMPRESSION FORMING MARKET,  BY REGION, 2024–2029 (USD MILLION)
TABLE 59 NATURAL FIBER/PP BLEND: THERMO COMPRESSION FORMING MARKET,  BY REGION, 2021–2023 (KILOTON)
TABLE 60 NATURAL FIBER/PP BLEND: THERMO COMPRESSION FORMING MARKET,  BY REGION, 2024–2029 (KILOTON)
TABLE 61 OTHER NEEDLE-PUNCH NONWOVENS: THERMO COMPRESSION FORMING MARKET, BY REGION, 2021–2023 (USD MILLION)
TABLE 62 OTHER NEEDLE-PUNCH NONWOVENS: THERMO COMPRESSION FORMING MARKET, BY REGION, 2024–2029 (USD MILLION)
TABLE 63 OTHER NEEDLE-PUNCH NONWOVENS: THERMO COMPRESSION FORMING MARKET, BY REGION, 2021–2023 (KILOTON)
TABLE 64 OTHER NEEDLE-PUNCH NONWOVENS: THERMO COMPRESSION FORMING MARKET, BY REGION, 2024–2029 (KILOTON)
TABLE 65 LIGHTWEIGHT GLASS MAT THERMOPLASTIC (LWGMT): THERMO COMPRESSION FORMING MARKET, BY REGION, 2021–2023 (USD MILLION)
TABLE 66 LIGHTWEIGHT GLASS MAT THERMOPLASTIC (LWGMT): THERMO COMPRESSION FORMING MARKET, BY REGION, 2024–2029 (USD MILLION)
TABLE 67 LIGHTWEIGHT GLASS MAT THERMOPLASTIC (LWGMT): THERMO COMPRESSION FORMING MARKET, BY REGION, 2021–2023 (KILOTON)
TABLE 68 LIGHTWEIGHT GLASS MAT THERMOPLASTIC (LWGMT): THERMO COMPRESSION FORMING MARKET, BY REGION, 2024–2029 (KILOTON)
TABLE 69 THERMO COMPRESSION FORMING MARKET, BY END-USE INDUSTRY,  2021–2023 (USD MILLION)
TABLE 70 THERMO COMPRESSION FORMING MARKET, BY END-USE INDUSTRY,  2024–2029 (USD MILLION)
TABLE 71 THERMO COMPRESSION FORMING MARKET, BY END-USE INDUSTRY,  2021–2023 (KILOTON)
TABLE 72 THERMO COMPRESSION FORMING MARKET, BY END-USE INDUSTRY,  2024–2029 (KILOTON)
TABLE 73 AUTOMOTIVE: THERMO COMPRESSION FORMING MARKET, BY REGION,  2021–2023 (USD MILLION)
TABLE 74 AUTOMOTIVE: THERMO COMPRESSION FORMING MARKET, BY REGION,  2024–2029 (USD MILLION)
TABLE 75 AUTOMOTIVE: THERMO COMPRESSION FORMING MARKET, BY REGION,  2021–2023 (KILOTON)
TABLE 76 AUTOMOTIVE: THERMO COMPRESSION FORMING MARKET, BY REGION,  2024–2029 (KILOTON)
TABLE 77 CONSTRUCTION: THERMO COMPRESSION FORMING MARKET, BY REGION,  2021–2023 (USD MILLION)
TABLE 78 CONSTRUCTION: THERMO COMPRESSION FORMING MARKET, BY REGION,  2024–2029 (USD MILLION)
TABLE 79 CONSTRUCTION: THERMO COMPRESSION FORMING MARKET, BY REGION,  2021–2023 (KILOTON)
TABLE 80 CONSTRUCTION: THERMO COMPRESSION FORMING MARKET, BY REGION,  2024–2029 (KILOTON)
TABLE 81 AEROSPACE: THERMO COMPRESSION FORMING MARKET, BY REGION,  2021–2023 (USD MILLION)
TABLE 82 AEROSPACE: THERMO COMPRESSION FORMING MARKET, BY REGION,  2024–2029 (USD MILLION)
TABLE 83 AEROSPACE: THERMO COMPRESSION FORMING MARKET, BY REGION,  2021–2023 (KILOTON)
TABLE 84 AEROSPACE: THERMO COMPRESSION FORMING MARKET, BY REGION,  2024–2029 (KILOTON)
TABLE 85 MEDICAL: THERMO COMPRESSION FORMING MARKET, BY REGION,  2021–2023 (USD MILLION)
TABLE 86 MEDICAL: THERMO COMPRESSION FORMING MARKET, BY REGION,  2024–2029 (USD MILLION)
TABLE 87 MEDICAL: THERMO COMPRESSION FORMING MARKET, BY REGION,  2021–2023 (KILOTON)
TABLE 88 MEDICAL: THERMO COMPRESSION FORMING MARKET, BY REGION,  2024–2029 (KILOTON)
TABLE 89 ELECTRICAL & ELECTRONICS: THERMO COMPRESSION FORMING MARKET,  BY REGION, 2021–2023 (USD MILLION)
TABLE 90 ELECTRICAL & ELECTRONICS: THERMO COMPRESSION FORMING MARKET,  BY REGION, 2024–2029 (USD MILLION)
TABLE 91 ELECTRICAL & ELECTRONICS: THERMO COMPRESSION FORMING MARKET,  BY REGION, 2021–2023 (KILOTON)
TABLE 92 ELECTRICAL & ELECTRONICS: THERMO COMPRESSION FORMING MARKET,  BY REGION, 2024–2029 (KILOTON)
TABLE 93 OTHER END-USE INDUSTRIES: THERMO COMPRESSION FORMING MARKET,  BY REGION, 2021–2023 (USD MILLION)
TABLE 94 OTHER END-USE INDUSTRIES: THERMO COMPRESSION FORMING MARKET,  BY REGION, 2024–2029 (USD MILLION)
TABLE 95 OTHER END-USE INDUSTRIES: THERMO COMPRESSION FORMING MARKET,  BY REGION, 2021–2023 (KILOTON)
TABLE 96 OTHER END-USE INDUSTRIES: THERMO COMPRESSION FORMING MARKET,  BY REGION, 2024–2029 (KILOTON)
TABLE 97 THERMO COMPRESSION FORMING MARKET, BY REGION,  2021–2023 (USD MILLION)
TABLE 98 THERMO COMPRESSION FORMING MARKET, BY REGION,  2024–2029 (USD MILLION)
TABLE 99 THERMO COMPRESSION FORMING MARKET, BY REGION, 2021–2023 (KILOTON)
TABLE 100 THERMO COMPRESSION FORMING MARKET, BY REGION, 2024–2029 (KILOTON)
TABLE 101 ASIA PACIFIC: THERMO COMPRESSION FORMING MARKET, BY COUNTRY,  2021–2023 (USD MILLION)
TABLE 102 ASIA PACIFIC: THERMO COMPRESSION FORMING MARKET, BY COUNTRY,  2024–2029 (USD MILLION)
TABLE 103 ASIA PACIFIC: THERMO COMPRESSION FORMING MARKET, BY COUNTRY,  2021–2023 (KILOTON)
TABLE 104 ASIA PACIFIC: THERMO COMPRESSION FORMING MARKET, BY COUNTRY,  2024–2029 (KILOTON)
TABLE 105 ASIA PACIFIC: THERMO COMPRESSION FORMING MARKET, BY TYPE,  2021–2023 (USD MILLION)
TABLE 106 ASIA PACIFIC: THERMO COMPRESSION FORMING MARKET, BY TYPE,  2024–2029 (USD MILLION)
TABLE 107 ASIA PACIFIC: THERMO COMPRESSION FORMING MARKET, BY TYPE,  2021–2023 (KILOTON)
TABLE 108 ASIA PACIFIC: THERMO COMPRESSION FORMING MARKET, BY TYPE,  2024–2029 (KILOTON)
TABLE 109 ASIA PACIFIC: THERMO COMPRESSION FORMING MARKET,  BY END-USE INDUSTRY, 2021–2023 (USD MILLION)
TABLE 110 ASIA PACIFIC: THERMO COMPRESSION FORMING MARKET,  BY END-USE INDUSTRY, 2024–2029 (USD MILLION)
TABLE 111 ASIA PACIFIC: THERMO COMPRESSION FORMING MARKET,  BY END-USE INDUSTRY, 2021–2023 (KILOTON)
TABLE 112 ASIA PACIFIC: THERMO COMPRESSION FORMING MARKET,  BY END-USE INDUSTRY, 2024–2029 (KILOTON)
TABLE 113 NORTH AMERICA: THERMO COMPRESSION FORMING MARKET, BY COUNTRY, 2021–2023 (USD MILLION)
TABLE 114 NORTH AMERICA: THERMO COMPRESSION FORMING MARKET, BY COUNTRY, 2024–2029 (USD MILLION)
TABLE 115 NORTH AMERICA: THERMO COMPRESSION FORMING MARKET, BY COUNTRY, 2021–2023 (KILOTON)
TABLE 116 NORTH AMERICA: THERMO COMPRESSION FORMING MARKET, BY COUNTRY, 2024–2029 (KILOTON)
TABLE 117 NORTH AMERICA: THERMO COMPRESSION FORMING MARKET, BY TYPE,  2021–2023 (USD MILLION)
TABLE 118 NORTH AMERICA: THERMO COMPRESSION FORMING MARKET, BY TYPE,  2024–2029 (USD MILLION)
TABLE 119 NORTH AMERICA: THERMO COMPRESSION FORMING MARKET, BY TYPE,  2021–2023 (USD KILOTON)
TABLE 120 NORTH AMERICA: THERMO COMPRESSION FORMING MARKET, BY TYPE,  2024–2029 (USD KILOTON)
TABLE 121 NORTH AMERICA: THERMO COMPRESSION FORMING MARKET,  BY END-USE INDUSTRY, 2021–2023 (USD MILLION)
TABLE 122 NORTH AMERICA: THERMO COMPRESSION FORMING MARKET,  BY END-USE INDUSTRY, 2024–2029 (USD MILLION)
TABLE 123 NORTH AMERICA: THERMO COMPRESSION FORMING MARKET,  BY END-USE INDUSTRY, 2021–2023 (KILOTON)
TABLE 124 NORTH AMERICA: THERMO COMPRESSION FORMING MARKET,  BY END-USE INDUSTRY, 2024–2029 (KILOTON)
TABLE 125 EUROPE: THERMO COMPRESSION FORMING MARKET, BY COUNTRY,  2021–2023 (USD MILLION)
TABLE 126 EUROPE: THERMO COMPRESSION FORMING MARKET, BY COUNTRY,  2024–2029 (USD MILLION)
TABLE 127 EUROPE: THERMO COMPRESSION FORMING MARKET, BY COUNTRY,  2021–2023 (KILOTON)
TABLE 128 EUROPE: THERMO COMPRESSION FORMING MARKET, BY COUNTRY,  2024–2029 (KILOTON)
TABLE 129 EUROPE: THERMO COMPRESSION FORMING MARKET, BY TYPE,  2021–2023 (USD MILLION)
TABLE 130 EUROPE: THERMO COMPRESSION FORMING MARKET, BY TYPE,  2024–2029 (USD MILLION)
TABLE 131 EUROPE: THERMO COMPRESSION FORMING MARKET, BY TYPE,  2021–2023 (KILOTON)
TABLE 132 EUROPE: THERMO COMPRESSION FORMING MARKET, BY TYPE,  2024–2029 (KILOTON)
TABLE 133 EUROPE: THERMO COMPRESSION FORMING MARKET, BY END-USE INDUSTRY, 2021–2023 (USD MILLION)
TABLE 134 EUROPE: THERMO COMPRESSION FORMING MARKET, BY END-USE INDUSTRY, 2024–2029 (USD MILLION)
TABLE 135 EUROPE: THERMO COMPRESSION FORMING MARKET, BY END-USE INDUSTRY, 2021–2023 (KILOTON)
TABLE 136 EUROPE: THERMO COMPRESSION FORMING MARKET, BY END-USE INDUSTRY, 2024–2029 (KILOTON)
TABLE 137 SOUTH AMERICA: THERMO COMPRESSION FORMING MARKET, BY COUNTRY, 2021–2023 (USD MILLION)
TABLE 138 SOUTH AMERICA: THERMO COMPRESSION FORMING MARKET, BY COUNTRY, 2024–2029 (USD MILLION)
TABLE 139 SOUTH AMERICA: THERMO COMPRESSION FORMING MARKET, BY COUNTRY, 2021–2023 (KILOTON)
TABLE 140 SOUTH AMERICA: THERMO COMPRESSION FORMING MARKET, BY COUNTRY, 2024–2029 (KILOTON)
TABLE 141 SOUTH AMERICA: THERMO COMPRESSION FORMING MARKET, BY TYPE,  2021–2023 (USD MILLION)
TABLE 142 SOUTH AMERICA: THERMO COMPRESSION FORMING MARKET, BY TYPE,  2024–2029 (USD MILLION)
TABLE 143 SOUTH AMERICA: THERMO COMPRESSION FORMING MARKET, BY TYPE,  2021–2023 (USD KILOTON)
TABLE 144 SOUTH AMERICA: THERMO COMPRESSION FORMING MARKET, BY TYPE,  2024–2029 (USD KILOTON)
TABLE 145 SOUTH AMERICA: THERMO COMPRESSION FORMING MARKET,  BY END-USE INDUSTRY, 2021–2023 (USD MILLION)
TABLE 146 SOUTH AMERICA: THERMO COMPRESSION FORMING MARKET,  BY END-USE INDUSTRY, 2024–2029 (USD MILLION)
TABLE 147 SOUTH AMERICA: THERMO COMPRESSION FORMING MARKET,  BY END-USE INDUSTRY, 2021–2023 (KILOTON)
TABLE 148 SOUTH AMERICA: THERMO COMPRESSION FORMING MARKET,  BY END-USE INDUSTRY, 2024–2029 (KILOTON)
TABLE 149 MIDDLE EAST & AFRICA: THERMO COMPRESSION FORMING MARKET,  BY COUNTRY, 2021–2023 (USD MILLION)
TABLE 150 MIDDLE EAST & AFRICA: THERMO COMPRESSION FORMING MARKET,  BY COUNTRY, 2024–2029 (USD MILLION)
TABLE 151 MIDDLE EAST & AFRICA: THERMO COMPRESSION FORMING MARKET,  BY COUNTRY, 2021–2023 (KILOTON)
TABLE 152 MIDDLE EAST & AFRICA: THERMO COMPRESSION FORMING MARKET,  BY COUNTRY, 2024–2029 (KILOTON)
TABLE 153 MIDDLE EAST & AFRICA: THERMO COMPRESSION FORMING MARKET, BY TYPE, 2021–2023 (USD MILLION)
TABLE 154 MIDDLE EAST & AFRICA: THERMO COMPRESSION FORMING MARKET, BY TYPE, 2024–2029 (USD MILLION)
TABLE 155 MIDDLE EAST & AFRICA: THERMO COMPRESSION FORMING MARKET, BY TYPE, 2021–2023 (USD KILOTON)
TABLE 156 MIDDLE EAST & AFRICA: THERMO COMPRESSION FORMING MARKET, BY TYPE, 2024–2029 (USD KILOTON)
TABLE 157 MIDDLE EAST & AFRICA: THERMO COMPRESSION FORMING MARKET,  BY END-USE INDUSTRY, 2021–2023 (USD MILLION)
TABLE 158 MIDDLE EAST & AFRICA: THERMO COMPRESSION FORMING MARKET,  BY END-USE INDUSTRY, 2024–2029 (USD MILLION)
TABLE 159 MIDDLE EAST & AFRICA: THERMO COMPRESSION FORMING MARKET,  BY END-USE INDUSTRY, 2021–2023 (KILOTON)
TABLE 160 MIDDLE EAST & AFRICA: THERMO COMPRESSION FORMING MARKET,  BY END-USE INDUSTRY, 2024–2029 (KILOTON)
TABLE 161 THERMO COMPRESSION FORMING MARKET: OVERVIEW OF KEY STRATEGIES ADOPTED BY MAJOR PLAYERS, 2019–2024
TABLE 162 THERMO COMPRESSION FORMING MARKET: DEGREE OF COMPETITION, 2023
TABLE 163 THERMO COMPRESSION FORMING MARKET: END-USE INDUSTRY FOOTPRINT
TABLE 164 THERMO COMPRESSION FORMING MARKET: REGION FOOTPRINT
TABLE 165 THERMO COMPRESSION FORMING MARKET: DETAILED LIST OF KEY STARTUPS/SMES
TABLE 166 THERMO COMPRESSION FORMING MARKET: COMPETITIVE BENCHMARKING OF KEY STARTUPS/SMES
TABLE 167 THERMO COMPRESSION FORMING MARKET: DEALS, MARCH 2019–MARCH 2024
TABLE 168 THERMO COMPRESSION FORMING MARKET: EXPANSIONS,  MARCH 2019–MARCH 2024
TABLE 169 FLEXTECH: COMPANY OVERVIEW
TABLE 170 FLEXTECH: PRODUCTS/SOLUTIONS/SERVICES OFFERED
TABLE 171 FLEXTECH: DEALS
TABLE 172 JANCO, INC.: COMPANY OVERVIEW
TABLE 173 JANCO, INC.: PRODUCTS/SOLUTIONS/SERVICES OFFERED
TABLE 174 JANCO, INC.: EXPANSIONS
TABLE 175 INTERTECH PRODUCTS, INC.: COMPANY OVERVIEW
TABLE 176 INTERTECH PRODUCTS, INC.: PRODUCTS/SOLUTIONS/SERVICES OFFERED
TABLE 177 INTERTECH PRODUCTS, INC.: DEALS
TABLE 178 FORMED SOLUTIONS: COMPANY OVERVIEW
TABLE 179 FORMED SOLUTIONS: PRODUCTS/SOLUTIONS/SERVICES OFFERED
TABLE 180 CORE MOLDING TECHNOLOGIES: COMPANY OVERVIEW
TABLE 181 CORE MOLDING TECHNOLOGIES: PRODUCTS/SOLUTIONS/SERVICES OFFERED
TABLE 182 UFP TECHNOLOGIES, INC.: COMPANY OVERVIEW
TABLE 183 UFP TECHNOLOGIES, INC.: PRODUCTS/SOLUTIONS/SERVICES OFFERED
TABLE 184 RAY PRODUCTS COMPANY INC.: COMPANY OVERVIEW
TABLE 185 RAY PRODUCTS COMPANY INC.: PRODUCTS/SOLUTIONS/SERVICES OFFERED
TABLE 186 ENGINEERED PLASTIC PRODUCTS INC.: COMPANY OVERVIEW
TABLE 187 ENGINEERED PLASTIC PRODUCTS INC.: PRODUCTS/SOLUTIONS/ SERVICES OFFERED
TABLE 188 PRESENT ADVANCED COMPOSITES INC.: COMPANY OVERVIEW
TABLE 189 PRESENT ADVANCED COMPOSITES INC.: PRODUCTS/SOLUTIONS/ SERVICES OFFERED
TABLE 190 TOOLING TECH GROUP: COMPANY OVERVIEW
TABLE 191 TOOLING TECH GROUP: PRODUCTS/SOLUTIONS/SERVICES OFFERED
TABLE 192 TOOLING TECH GROUP: EXPANSIONS
TABLE 193 TECH PLAASTIC INDUSTRIE: COMPANY OVERVIEW
TABLE 194 TECH PLAASTIC INDUSTRIE: PRODUCTS/SOLUTIONS/SERVICES OFFERED
TABLE 195 TORAY ADVANCED COMPOSITES: COMPANY OVERVIEW
TABLE 196 TORAY ADVANCED COMPOSITES: PRODUCTS/SOLUTIONS/SERVICES OFFERED
TABLE 197 TORAY ADVANCED COMPOSITES: EXPANSIONS
TABLE 198 TRIDENT COMPONENTS, LLC: COMPANY OVERVIEW
TABLE 199 TRIDENT COMPONENTS, LLC: PRODUCTS/SOLUTIONS/SERVICES OFFERED
TABLE 200 RCO ENGINEERING: COMPANY OVERVIEW
TABLE 201 RCO ENGINEERING: PRODUCTS/SOLUTIONS/SERVICES OFFERED
TABLE 202 THE PLATINUM TOOL GROUP: COMPANY OVERVIEW
TABLE 203 THE PLATINUM TOOL GROUP: PRODUCTS/SOLUTIONS/SERVICES OFFERED
TABLE 204 SONFARREL AEROSPACE LLC: COMPANY OVERVIEW
TABLE 205 SONFARREL AEROSPACE LLC: PRODUCTS/SOLUTIONS/SERVICES OFFERED
TABLE 206 TRI-MACK PLASTICS MANUFACTURING CORPORATION: COMPANY OVERVIEW
TABLE 207 TRI-MACK PLASTICS MANUFACTURING CORPORATION: PRODUCTS/SOLUTIONS/SERVICES OFFERED
TABLE 208 AMRAZ LTD.: COMPANY OVERVIEW
TABLE 209 AMRAZ LTD.: PRODUCTS/SOLUTIONS/SERVICES OFFERED
TABLE 210 KT PLASTICS INCORPORATED: COMPANY OVERVIEW
TABLE 211 KT PLASTICS INCORPORATED: PRODUCTS/SOLUTIONS/SERVICES OFFERED
TABLE 212 ROTATIONAL MOLDING OF UTAH: COMPANY OVERVIEW
TABLE 213 ROTATIONAL MOLDING OF UTAH: PRODUCTS/SOLUTIONS/SERVICES OFFERED
TABLE 214 REDLINE PLASTICS: COMPANY OVERVIEW
TABLE 215 REDLINE PLASTICS: PRODUCTS/SOLUTIONS/SERVICES OFFERED
TABLE 216 REDLINE PLASTICS: EXPANSIONS
TABLE 217 CHICAGO GASKET CO.: COMPANY OVERVIEW
TABLE 218 CHICAGO GASKET CO.: PRODUCTS/SOLUTIONS/SERVICES OFFERED
TABLE 219 HAYSITE: COMPANY OVERVIEW
TABLE 220 HAYSITE: PRODUCTS/SOLUTIONS/SERVICES OFFERED
TABLE 221 AMI PLASTICS: COMPANY OVERVIEW
TABLE 222 AMI PLASTICS: PRODUCTS/SOLUTIONS/SERVICES OFFERED
TABLE 223 LINECROSS: COMPANY OVERVIEW
TABLE 224 LINECROSS: PRODUCTS/SOLUTIONS/SERVICES OFFERED
TABLE 225 MOLDED PLASTICS MARKET, BY TECHNOLOGY, 2018–2021 (KILOTON)
TABLE 226 MOLDED PLASTICS MARKET, BY TECHNOLOGY, 2018–2021 (USD MILLION)
TABLE 227 MOLDED PLASTICS MARKET, BY TECHNOLOGY, 2022–2027 (KILOTON)
TABLE 228 MOLDED PLASTICS MARKET, BY TECHNOLOGY, 2022–2027 (USD MILLION)
TABLE 229 MOLDED PLASTICS MARKET, BY TYPE, 2018–2021 (KILOTON)
TABLE 230 MOLDED PLASTICS MARKET, BY TYPE, 2018–2021 (USD MILLION)
TABLE 231 MOLDED PLASTICS MARKET, BY TYPE, 2022–2027 (KILOTON)
TABLE 232 MOLDED PLASTICS MARKET, BY TYPE, 2022–2027 (USD MILLION)
TABLE 233 MOLDED PLASTICS MARKET, BY APPLICATION, 2018–2021 (KILOTON)
TABLE 234 MOLDED PLASTICS MARKET, BY APPLICATION, 2018–2021 (USD MILLION)
TABLE 235 MOLDED PLASTICS MARKET, BY APPLICATION, 2022–2027 (KILOTON)
TABLE 236 MOLDED PLASTICS MARKET, BY APPLICATION, 2022–2027 (USD MILLION)
TABLE 237 MOLDED PLASTICS MARKET, BY REGION, 2018–2021 (KILOTON)
TABLE 238 MOLDED PLASTICS MARKET, BY REGION, 2018–2021 (USD MILLION)
TABLE 239 MOLDED PLASTICS MARKET, BY REGION, 2022–2027 (KILOTON)
TABLE 240 MOLDED PLASTICS MARKET, BY REGION, 2022–2027 (USD MILLION)
 
 
LIST OF FIGURES (59 FIGURES)
 
FIGURE 1 THERMO COMPRESSION FORMING MARKET SEGMENTATION
FIGURE 2 THERMO COMPRESSION FORMING MARKET: RESEARCH DESIGN
FIGURE 3 MARKET SIZE ESTIMATION: BOTTOM-UP APPROACH
FIGURE 4 MARKET SIZE ESTIMATION: TOP-DOWN APPROACH
FIGURE 5 THERMO COMPRESSION FORMING MARKET SIZE ESTIMATION,  BY END-USE INDUSTRY
FIGURE 6 THERMO COMPRESSION FORMING MARKET SIZE ESTIMATION, BY REGION
FIGURE 7 THERMO COMPRESSION FORMING MARKET: SUPPLY-SIDE FORECAST
FIGURE 8 THERMO COMPRESSION FORMING MARKET: DEMAND-SIDE FORECAST
FIGURE 9 METHODOLOGY FOR SUPPLY-SIDE SIZING OF THERMO COMPRESSION  FORMING MARKET
FIGURE 10 MAJOR FACTORS RESPONSIBLE FOR GLOBAL RECESSION AND  THEIR IMPACT ON MARKET
FIGURE 11 THERMO COMPRESSION FORMING MARKET: DATA TRIANGULATION
FIGURE 12 THERMOPLASTIC FOAMS SEGMENT TO DOMINATE THERMO COMPRESSION FORMING MARKET DURING FORECAST PERIOD
FIGURE 13 AUTOMOTIVE SEGMENT TO HOLD LARGEST SHARE OF THERMO COMPRESSION FORMING MARKET IN 2029
FIGURE 14 NORTH AMERICA TO DOMINATE THERMO COMPRESSION FORMING MARKET DURING FORECAST PERIOD
FIGURE 15 RAPID INDUSTRIALIZATION AND URBANIZATION IN EMERGING ECONOMIES TO CREATE LUCRATIVE OPPORTUNITIES FOR MARKET PLAYERS
FIGURE 16 THERMOPLASTIC FOAMS SEGMENT TO REGISTER HIGHEST CAGR DURING FORECAST PERIOD
FIGURE 17 AUTOMOTIVE SEGMENT AND US TO ACCOUNT FOR LARGEST SHARES OF  NORTH AMERICAN THERMO COMPRESSION FORMING MARKET IN 2024
FIGURE 18 DEMAND FOR THERMO COMPRESSION FORMING TO GROW FASTER IN DEVELOPING COUNTRIES DURING FORECAST PERIOD
FIGURE 19 INDIA TO REGISTER HIGHEST CAGR IN THERMO COMPRESSION FORMING MARKET DURING FORECAST PERIOD
FIGURE 20 GLOBAL PLASTIC PRODUCTION, 2018–2022
FIGURE 21 AVERAGE CHEMICAL PRODUCTION GROWTH PER ANNUM, 2011–2021
FIGURE 22 DRIVERS, RESTRAINTS, OPPORTUNITIES, AND CHALLENGES IN THERMO COMPRESSION FORMING MARKET
FIGURE 23 PORTER’S FIVE FORCES ANALYSIS: THERMO COMPRESSION FORMING MARKET
FIGURE 24 INFLUENCE OF STAKEHOLDERS ON BUYING PROCESS, BY END-USE INDUSTRY
FIGURE 25 KEY BUYING CRITERIA, BY END-USE INDUSTRY
FIGURE 26 THERMO COMPRESSION FORMING MARKET: VALUE CHAIN ANALYSIS
FIGURE 27 AVERAGE SELLING PRICE TREND OF THERMO COMPRESSION FORMING,  BY REGION, 2021–2024 AND 2029 (USD/KG)
FIGURE 28 AVERAGE SELLING PRICE TREND OF THERMO COMPRESSION FORMING,  BY TYPE, 2021–2024 AND 2029 (USD/KG)
FIGURE 29 AVERAGE SELLING PRICE TREND OF THERMO COMPRESSION FORMING,  BY END-USE INDUSTRY, 2021–2024 AND 2029 (USD/KG)
FIGURE 30 AVERAGE SELLING PRICE TREND OF THERMO COMPRESSION FORMING OFFERED BY KEY PLAYERS, BY END-USE INDUSTRY, 2023 (USD/KG)
FIGURE 31 EXPORT DATA RELATED TO HS CODE 390950-COMPLIANT PRODUCTS,  BY KEY COUNTRY, 2019–2023 (USD THOUSAND)
FIGURE 32 IMPORT DATA RELATED TO HS CODE 390950-COMPLIANT PRODUCTS,  BY KEY COUNTRY, 2019–2023 (USD THOUSAND)
FIGURE 33 THERMO COMPRESSION FORMING MARKET: ECOSYSTEM ANALYSIS
FIGURE 34 THERMO COMPRESSION FORMING MARKET: KEY PLAYERS IN ECOSYSTEM
FIGURE 35 TRENDS/DISRUPTIONS INFLUENCING CUSTOMER BUSINESS
FIGURE 36 PUBLISHED PATENTS, 2019–2024
FIGURE 37 PATENTS PUBLISHED BY JURISDICTION, 2019–2024
FIGURE 38 PATENTS PUBLISHED BY MAJOR APPLICANTS, 2019–2024
FIGURE 39 TOP PATENT APPLICANTS FOR THERMO COMPRESSION FORMING IN LAST YEARS
FIGURE 40 THERMOPLASTIC FOAMS SEGMENT TO HOLD LARGEST SHARE OF  THERMO COMPRESSION FORMING MARKET IN 2029
FIGURE 41 AUTOMOTIVE SEGMENT TO ACCOUNT FOR LARGEST SHARE OF  THERMO COMPRESSION FORMING MARKET IN 2029
FIGURE 42 ANNUAL GLOBAL VEHICLE SALES, 2017–2025 (UNITS IN MILLIONS)
FIGURE 43 ASIA PACIFIC TO REGISTER HIGHEST CAGR IN THERMO COMPRESSION FORMING MARKET BETWEEN 2024 AND 2029
FIGURE 44 ASIA PACIFIC: THERMO COMPRESSION FORMING MARKET SNAPSHOT
FIGURE 45 NORTH AMERICA: THERMO COMPRESSION FORMING MARKET SNAPSHOT
FIGURE 46 EUROPE: THERMO COMPRESSION FORMING MARKET SNAPSHOT
FIGURE 47 BRAZIL TO REGISTER HIGHEST CAGR IN SOUTH AMERICAN THERMO COMPRESSION FORMING MARKET BETWEEN 2024 AND 2029
FIGURE 48 GCC COUNTRIES TO REGISTER HIGHEST CAGR BETWEEN 2024 AND 2029
FIGURE 49 THERMO COMPRESSION FORMING MARKET SHARE ANALYSIS, 2023
FIGURE 50 THERMO COMPRESSION FORMING MARKET: RANKING ANALYSIS OF LEADING PLAYERS, 2023
FIGURE 51 THERMO COMPRESSION FORMING MARKET: REVENUE ANALYSIS OF KEY PLAYERS, 2021–2023 (USD MILLION)
FIGURE 52 THERMO COMPRESSION FORMING MARKET: COMPANY VALUATION (USD BILLION)
FIGURE 53 THERMO COMPRESSION FORMING MARKET: FINANCIAL METRICS (EV/EBITDA)
FIGURE 54 THERMO COMPRESSION FORMING MARKET: BRAND/PRODUCT COMPARISON
FIGURE 55 THERMO COMPRESSION FORMING MARKET: COMPANY EVALUATION MATRIX  (KEY PLAYERS), 2023
FIGURE 56 THERMO COMPRESSION FORMING MARKET: COMPANY FOOTPRINT
FIGURE 57 THERMO COMPRESSION FORMING MARKET: COMPANY EVALUATION MATRIX (STARTUPS/SMES), 2023
FIGURE 58 CORE MOLDING TECHNOLOGIES: COMPANY SNAPSHOT
FIGURE 59 UFP TECHNOLOGIES, INC.: COMPANY SNAPSHOT

The study involved four major activities in order to estimate the current size of the thermo compression forming market. Exhaustive secondary research was conducted to gather information on the market. The next step was to conduct primary research to validate these findings, assumptions, and sizing with the industry experts across the supply chain. Both top-down and bottom-up approaches were used to estimate the total market size. The market size of segments and subsegments was then estimated using market breakdown and data triangulation.

Secondary Research

Secondary sources include annual reports of companies, press releases, investor presentations, white papers, articles by recognized authors, and databases, such as Hoovers, Bloomberg L.P., Factiva, ICIS, and OneSource; and publications and databases from associations, American Composites Manufacturers Association, Plastics Industry Association (PLASTICS), American Mold Builders Association, International Special Tooling & Machining Association, and British Plastics Federation.

Primary Research

Extensive primary research was carried out after gathering information about thermo compression forming market through secondary research. In the primary research process, experts from the supply and demand sides have been interviewed to obtain qualitative and quantitative information and validate the data for this report. Questionnaires, emails, and telephonic interviews were used to collect primary data. Primary sources from the supply side include industry experts, such as chief executive officers (CEOs), vice presidents (VPs), marketing directors, technology and innovation directors, and related key executives from various key companies and organizations operating in the thermo compression forming market. Primary interviews were conducted to elicit information such as market statistics, revenue data collected from the products and services, market breakdowns, market size estimations, market forecasting, and data triangulation. Primary research also assisted in comprehending the various trends associated to type, application, and region.

The Breakup of Primary Research:
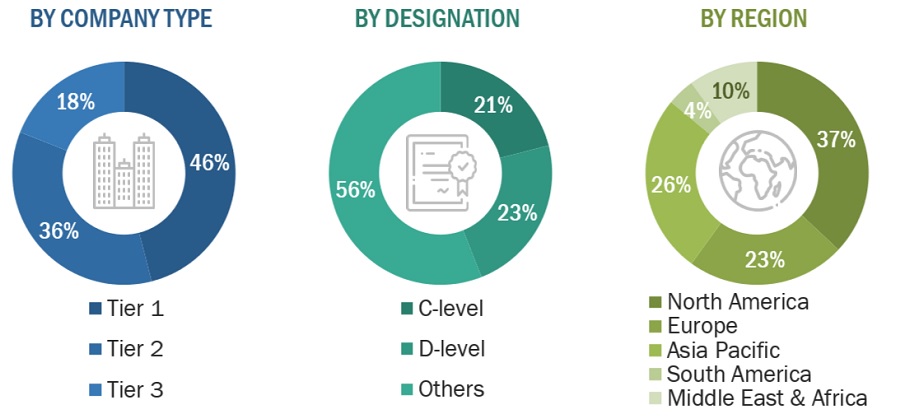
Thermo Compression Forming Market Size, and Share

To know about the assumptions considered for the study, download the pdf brochure

THERMO COMPRESSION FORMING MANUFACTURERS

FLEXTECH

The Platinum Tool Group

Janco, Inc.

Chicago Gasket Co.

Core Molding Technology

Haysite

UFP Technologies, Inc.

Linecross

Market Size Estimation

The following information is part of the research methodology used to estimate the size of the thermo compression forming market. The market sizing of the thermo compression forming market was undertaken from the demand side. The market size was estimated based on market size for thermo compression forming in various technology.

Global Thermo Compression Forming Market Size: Bottom Up Approach
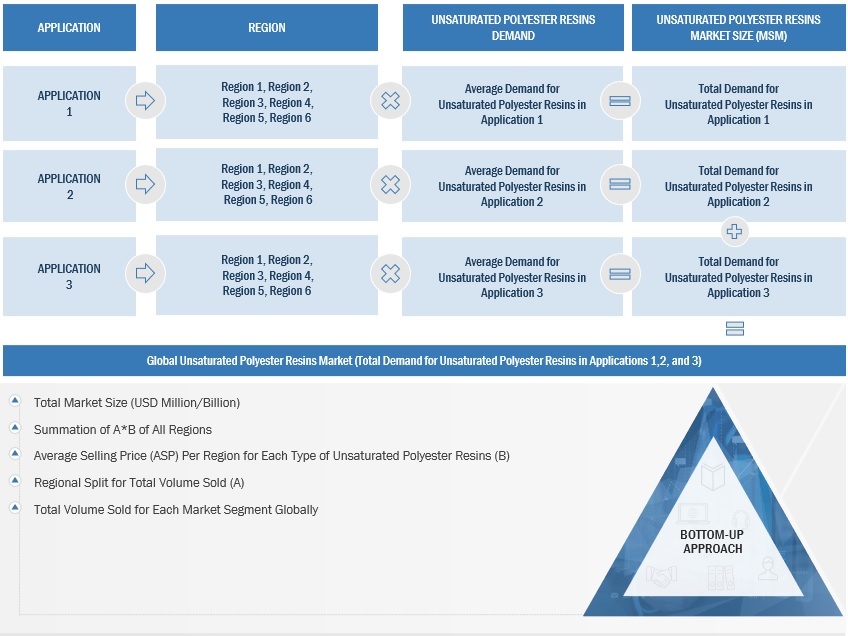
Thermo Compression Forming Market Size, and Share

To know about the assumptions considered for the study, Request for Free Sample Report

Global Thermo Compression Forming Market Size: Top-Down Approach
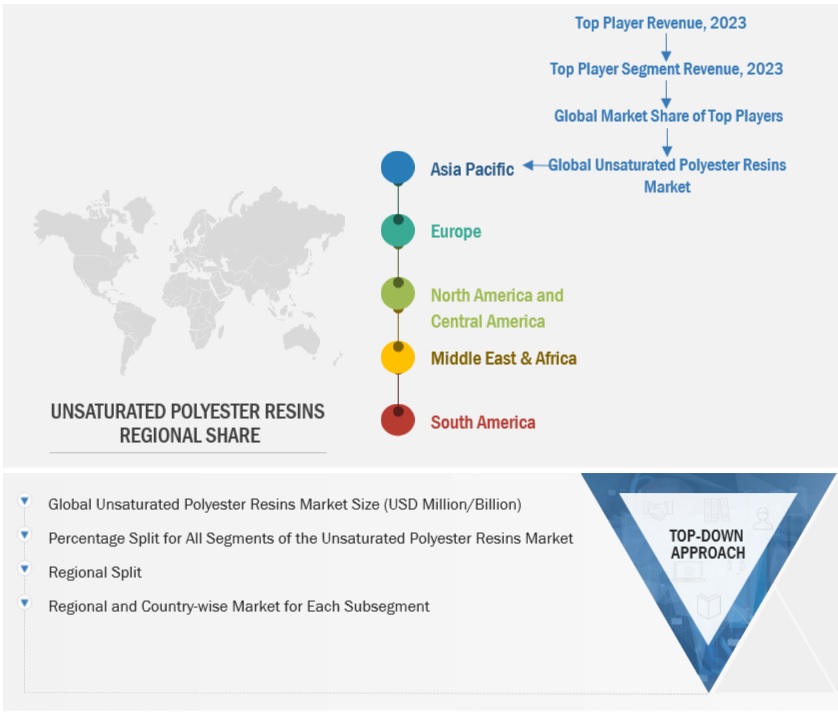
Thermo Compression Forming Market Size, and Share

Data Triangulation

After arriving at the overall market size, the market has been split into several segments. To complete the overall market engineering process and arrive at the exact statistics for all segments, the data triangulation and market breakdown procedures have been employed, wherever applicable. The data was triangulated by studying various factors and trends from the demand and supply sides. Along with this, the market size was validated using both the top-down and bottom-up approaches.

Market Definition

“Thermo compression forming market encompasses the production, distribution, and utilization of technology and equipment that use heat and pressure to shape and bond materials, primarily polymers and composites, into desired forms and structures," according to the American Composites Manufacturers Association. Thermo compression forming is widely used in the automotive, construction, aerospace, electronics, and medical sectors. It is highly implemented for its capabilities to manufacture components that are durable, lightweight, and high-strength. This market includes a variety of materials that can be molded utilizing thermo compression processes, including as composite materials and thermoplastics.

Key Stakeholders

  • Thermo compression forming providers
  • Raw material suppliers
  • Manufacturing technology providers
  • Industry associations
  • Stakeholders in the forming/molding industry
  • Traders, distributors, and suppliers of thermo compression forming
  • NGOs, government bodies, regional agencies, and research organizations

Report Objectives

  • To describe and forecast the thermo compression forming market in terms of value and volume
  • To provide detailed information about the drivers, restraints, opportunities, and challenges influencing the market growth
  • To analyze and forecast the market size based on foam type, end-use industry, and region
  • To forecast the thermo compression forming market size for North America, Europe, Asia Pacific, South Africa, and the Middle East & Africa
  • To strategically analyze micromarkets1 concerning individual growth trends, growth prospects, and their contributions to the overall market
  • To assess the opportunities in the market for stakeholders and provide a competitive landscape for the market leaders
  • To analyze competitive developments, such as acquisitions, product launches, investments, expansions, agreements, collaborations, and partnerships, in the market
  • To strategically profile the key players and comprehensively evaluate their market shares and core competencies

Based on foam type, the thermo compression forming market has been segmented as follows:

  • Thermoplastic Foams
  • Needle-Punch Nonwovens
  • Light Weight Glass Mat Thermoplastic

Based on End-use Industry, the thermo compression forming market has been segmented as follows:

  • Automotive
  • Aerospace
  • Medical
  • Construction
  • Electrical & Electronics
  • Other End-use Industries

Based on the region, the thermo compression forming market has been segmented as follows:

  • Asia Pacific
  • Europe
  • North America
  • Middle East & Africa
  • South America

Available Customizations

MarketsandMarkets offers the following customizations for this market report:

  • Further breakdown of a specific region of the thermo compression forming market
  • Detailed analysis and profiling of additional market players (up to five)

Product Analysis

  • Product matrix, which provides a detailed comparison of the product portfolio of each company in the thermo compression forming market
Custom Market Research Services

We will customize the research for you, in case the report listed above does not meet with your exact requirements. Our custom research will comprehensively cover the business information you require to help you arrive at strategic and profitable business decisions.

Request Customization
Report Code
CH 9143
Published ON
Sep, 2024
Choose License Type
BUY NOW
  • SHARE
X
Request Customization
Speak to Analyst
Speak to Analyst
OR FACE-TO-FACE MEETING
PERSONALIZE THIS RESEARCH
  • Triangulate with your Own Data
  • Get Data as per your Format and Definition
  • Gain a Deeper Dive on a Specific Application, Geography, Customer or Competitor
  • Any level of Personalization
REQUEST A FREE CUSTOMIZATION
LET US HELP YOU!
  • What are the Known and Unknown Adjacencies Impacting the Thermo Compression Forming Market
  • What will your New Revenue Sources be?
  • Who will be your Top Customer; what will make them switch?
  • Defend your Market Share or Win Competitors
  • Get a Scorecard for Target Partners
CUSTOMIZED WORKSHOP REQUEST
  • Call Us
  • +1-888-600-6441 (Corporate office hours)
  • +1-888-600-6441 (US/Can toll free)
  • +44-800-368-9399 (UK office hours)
CONNECT WITH US
ABOUT TRUST ONLINE
©2024 MarketsandMarkets Research Private Ltd. All rights reserved
DMCA.com Protection Status
Website Feedback