Threat Hunting Market Size, Share, Growth Analysis, By Offering (Tools, Service), Threat Type, Deployment Mode, Organization Size, Vertical (BFSI, Healthcare, IT&ITEs Government) and Region - Global Industry Forecast to 2029
[350 Pages Report] The global threat-hunting market is set to grow significantly. It's expected to be worth around USD 3.4 billion in 2024 and increase to about USD 6.9 billion by 2029 at a CAGR of 14.9% during the forecast period. As organizations are increasingly moving business to the cloud, adversaries are advancing their capabilities to exploit the vulnerability in the cloud. Also, The rise of generative AI has the potential to lower the barrier of entry for low-skilled adversaries, making it easier to launch more sophisticated attacks. The movement towards cloud computing and the advancement of generative AI technologies represent transformative forces in the threat-hunting market. By embracing these trends, organizations can enhance their cybersecurity posture, mitigate risks associated with cloud adoption, and proactively leverage AI-driven insights to defend against evolving cyber threats.
To know about the assumptions considered for the study, Request for Free Sample Report
To know about the assumptions considered for the study, download the pdf brochure
Threat Hunting Market Dynamics
Driver: The rise and the speed in the ferocity of cyberattacks
The rapid rise in the frequency and intensity of cyberattacks globally has become a compelling market driver for the threat-hunting industry. Adversaries are increasingly sophisticated, leveraging advanced techniques such as ransomware, supply chain attacks, and zero-day exploits to infiltrate networks and compromise data. The speed at which these attacks unfold, from initial breach to lateral movement and data exfiltration, has shortened significantly, outpacing traditional security measures and necessitating a proactive approach to threat detection and mitigation. Threat hunting plays a pivotal role in this landscape by enabling organizations to actively search for and identify signs of compromise that may evade automated security tools. By leveraging advanced analytics, AI-driven algorithms, and threat intelligence, threat hunters can detect anomalies, uncover hidden threats, and respond swiftly to mitigate potential damage. As cyber threats evolve in complexity and scale, the demand for robust threat-hunting solutions is poised to grow, driving innovation and investment in cybersecurity technologies tailored to anticipate, detect, and neutralize emerging threats effectively.
Restraint: Budget constraints and return on investments
Budget constraints and the need to demonstrate return on investment (ROI) present significant market restraints for the threat-hunting industry. Effective threat-hunting programs require substantial investments in specialized tools, technologies, skilled personnel, and ongoing training. Many organizations, especially small and medium-sized enterprises (SMEs), may need help to allocate sufficient resources to these initiatives amidst competing priorities. Additionally, quantifying the ROI of threat hunting can be challenging as it involves measuring the value of proactive threat detection and mitigation in terms of avoided breaches and operational disruptions rather than tangible cost savings or revenue generation. This ambiguity can deter organizations from making initial investments or expanding threat-hunting capabilities.
Moreover, the complexity of calculating ROI varies depending on organizational size, industry sector, and existing cybersecurity maturity. To address these challenges, threat-hunting providers must demonstrate clear value propositions, showcase successful case studies, and educate stakeholders about the long-term benefits of proactive threat management. Efforts to streamline costs, such as leveraging cloud-based threat-hunting solutions or managed security services, can also help mitigate budget constraints and enhance the attractiveness of threat-hunting investments despite initial financial outlay concerns.
Opportunity: The rise of generative AI leading to AI-based threat-hunting tools
AI-based threat-hunting tools represent a significant market opportunity within the threat-hunting industry. These tools leverage artificial intelligence, machine learning, and advanced analytics to enhance cybersecurity teams' detection and response capabilities. AI excels in analyzing vast amounts of data in real-time, identifying patterns, anomalies, and indicators of compromise (IOCs) that may indicate potential threats or ongoing attacks. By automating security data analysis and augmenting human decision-making processes, AI-based threat-hunting tools enable organizations to detect and respond to threats more swiftly and effectively than traditional methods. This proactive approach helps mitigate the risks posed by increasingly sophisticated cyber threats, such as malware, ransomware, and insider threats, before they can cause significant harm. The growing adoption of AI in threat hunting reflects a strategic shift towards proactive cybersecurity strategies that prioritize early threat detection and rapid incident response, thereby bolstering overall cyber resilience. As AI technology continues to evolve, offering greater accuracy and efficiency in threat detection, the market for AI-based threat-hunting tools is expected to expand, driven by the increasing demand for scalable and advanced cybersecurity solutions across diverse industries and sectors.
Challenges: False positives and the presence of unknown assets
False positives and unknown assets present significant challenges for the threat-hunting market. False positives occur when security tools mistakenly flag legitimate activities as potential threats, leading to wasted time and resources investigating non-existent issues. This strains cybersecurity teams and hampers their ability to focus on genuine threats that require immediate attention. Addressing false positives requires refining detection algorithms, enhancing data correlation capabilities, and integrating threat intelligence effectively to reduce noise and prioritize actionable alerts. Also, the challenge of unknown assets complicates threat-hunting efforts. These assets, which include shadow IT, unmanaged devices, and legacy systems, often operate outside traditional security frameworks, making them vulnerable to exploitation by adversaries. Their presence increases the attack surface and creates blind spots in security monitoring, making organizations susceptible to undetected threats.
Threat Hunting Market Ecosystem
By vertical, the BFSI segment is to account for a larger market size during the forecast period.
The BFSI (Banking, Financial Services, and Insurance) segment in the threat-hunting market is critical to data security and regulatory compliance. Regulatory frameworks such as GDPR, PCI-DSS, and industry-specific regulations impose stringent requirements on data protection and cybersecurity practices within BFSI organizations. As the BFSI sector continues to digitize and face increasingly sophisticated threats, the demand for robust threat-hunting solutions is expected to grow, driving innovation and investment in cybersecurity technologies tailored to meet the unique challenges of financial services and insurance industries.
By tools, the EDR segment accounts for a larger market size during the forecast period
The threat-hunting market, segmented by tools, Endpoint Detection and Response (EDR), holds the highest market share and represents a critical component of modern cybersecurity strategies. EDR tools are designed to monitor and respond to suspicious activities and threats on endpoints such as desktops, laptops, servers, and mobile devices. They provide granular visibility into endpoint activities, enabling security teams to detect and investigate potential threats in real-time. As organizations prioritize endpoint security amidst evolving cyber threats and regulatory pressures, the demand for EDR solutions is expected to grow, driving innovation and investment in endpoint-centric threat-hunting technologies.
By deployment mode, the cloud segment holds the highest market share during the forecast period.
Among the various deployment modes in the threat-hunting market, cloud-based deployment holds the highest market share and presents a compelling opportunity for growth. Cloud deployment offers numerous advantages, including scalability, flexibility, and cost-efficiency, which are particularly appealing to organizations seeking to enhance their cybersecurity capabilities without heavy upfront investments in infrastructure.
By region, North America will have the largest market size during the forecast period.
The North American region represents a robust and dynamic market for threat hunting, characterized by its advanced cybersecurity landscape, stringent regulatory environment, and high concentration of industries vulnerable to cyber threats. With the United States and Canada leading in digital transformation across sectors such as finance, healthcare, government, and technology, the need for proactive threat detection and response capabilities has never been more critical. The region faces persistent and evolving cyber threats, including ransomware attacks, data breaches, and sophisticated nation-state threats. These threats target sensitive data, intellectual property, and critical infrastructure, necessitating advanced cybersecurity measures to safeguard against potential disruptions and financial losses.
Key Market Players
IBM (US), Kaspersky (Russia), Capgemini (France), CrowdStrike (US), Trustwave (US), Verizon (US), SecureWorks (US), Sangfor (China), Eviden (France), Rapid 7(US), VMware (US), Solidworks (US), Trend Micro (Japan), Cynet (US), Palo Alto Networks (US) are some of the key players operating in the global threat hunting market.
Want to explore hidden markets that can drive new revenue in Threat Hunting Market?
Scope of the Report
Want to explore hidden markets that can drive new revenue in Threat Hunting Market?
Report Metrics |
Details |
Market size available for years |
2018–2029 |
Base year considered |
2023 |
Forecast period |
2024–2029 |
Forecast units |
Value (USD Million/USD Billion) |
Segments Covered |
|
Geographies covered |
North America, Europe, Asia Pacific, Middle East Africa, and Latin America |
Major companies covered |
Major vendors in the global Threat hunting market include IBM (US), Kaspersky (Russia), Capgemini (France), CrowdStrike (US), Trustwave (US), Verizon (US), SecureWorks (US), Sangfor (China), Eviden (France), Rapid 7(US), VMware (US), Solidworks (US), Trend Micro (Japan), Cynet (US), Palo Alto Networks (US) Cipher (India), Talatek (US), SOC Prime (US), RSI Security (US), Protected Harbour (US), Mindpoint Group (US), Exponential- E (UK), Redscan (UK), Iron Net Cybersecurity (US), LiveAction (US). |
The study categorizes the Threat hunting market by Type, Component, Organization size, deployment mode, vertical, and region.
By Offering
-
Tools
- EDR
- SEIM
- NDR
- Threat Intelligence platform
- Others
-
Services
- Professional Services
- Managed Services
By Threat Type
- Advanced Persistent Threats (APTs)
- Malware and Ransomware
- Insider Threats
- Phishing and Social Engineering
- Others (DDoS, Zero-Day Exploits)
By Deployment Mode
- Cloud
- On-Premises
By Organization Size
- Large Enterprises
- SMEs
- Vertical
- BFSI
- IT and ITeS
- Government
- Energy and Utilities
- Manufacturing
- Healthcare
- Retail
- Others Verticals
Region
- North America
- Europe
- Asia Pacific
- Middle East & Africa
- Latin America
Recent Development
- In May 2024, CrowdStrike launched an advanced SIEM to power the AI-native SOC at RSAC 2024. This approach to AI as part of next-gen SIEM is to automate data parsing and normalization, enrich data to identify better and prioritize threats, and support advanced threat detection and automated response mechanisms.
- In May 2024, Palo Alto Networks and IBM partnered to offer internal security solutions; Palo Alto Networks will be IBM's preferred cybersecurity partner across network, cloud, and SOC. In its expanded portfolio, IBM will bolster its leading security services to drive significant cybersecurity and AI security business book featuring Palo Alto Networks platforms.
- In April 2023, IBM launched the New QRadar Security Suite to Speed up Threat Detection and Response; delivered as a service, the IBM Security QRadar Suite is built on an open foundation and explicitly designed for the demands of the hybrid cloud. The QRadar Suite culminates years of IBM investment, acquisitions, and threat detection and response innovations.
- In January 2023, Trustwave, a leading cybersecurity and managed security services provider, relaunched its Advanced Continual Threat Hunting platform with a unique, patent-pending methodology that enables its elite SpiderLabs threat-hunting teams to conduct significantly more human-led threat hunts.
Frequently Asked Questions (FAQ):
What is the definition of the threat hunting?
As per IBM, Threat hunting, also known as cyber threat hunting, is a proactive approach to identifying previously unknown or ongoing non-remediated threats within an organization's network.
Threat hunting, also known as cyber threat hunting or proactive threat hunting, is the process of seeking out unknown cybersecurity threats to a network. It involves actively searching through endpoints, networks, systems, applications, sources, and datasets to identify malicious or suspicious activity.
What is the projected market value of the global threat-hunting market?
The global threat-hunting market is expected to grow from USD 3.4 billion in 2024 and increase to about USD 6.9 billion by 2029 at a CAGR of 14.9% during the forecast period.
Who are the key companies influencing the market growth of the threat-hunting market?
IBM(US), Kaspersky (Russia), Capgemini (France), CrowdStrike(US), Trustwave(US), Verizon (US), SecureWorks(US), Sangfor (China), Eviden (France), Rapid 7(US), VMware (US), Solidworks (US), Trend Micro (Japan), Cynet (US), Palo Alto Networks (US) are the major vendors in the threat hunting market.
What are some of the mandates for threat hunting?
Compliance frameworks include the Payment Card Industry Data Security Standard (PCI DSS), GDPR, and CCPA. These standards typically require secure development practices, stringent access controls, and proactive vulnerability management protocols.
Which region is expected to show the highest CAGR in the threat-hunting market?
Asia Pacific is expected to account for the highest CAGR during the forecast period 2024-2029. .
To speak to our analyst for a discussion on the above findings, click Speak to Analyst
Exclusive indicates content/data unique to MarketsandMarkets and not available with any competitors.
- 5.1 INTRODUCTION
-
5.2 MARKET DYNAMICSDRIVERS- Increase in frequency and ferocity of cyberattacks- Spike in prevalence of supply chain attacks- Use of sophisticated techniques for exploiting cloud vulnerabilitiesRESTRAINTS- Budget constraints and increasing complexity of calculating return on investments- Integration with existing security infrastructureOPPORTUNITIES- Growing adoption of AI-based threat-hunting tools- Integration of robust threat intelligence platforms into threat-hunting capabilitiesCHALLENGES- False positives and presence of unknown assets- Data overload and alert fatigue- Lack of skilled security professionals
-
5.3 THREAT HUNTING TECHNOLOGY EVOLUTIONEARLY DAYS - REACTIVE HUNTING WITH INDICATORS OF COMPROMISE (IOCS)RISE OF PROACTIVE HUNTING - UNDERSTANDING ATTACKER BEHAVIORMODERN ERA - AUTOMATION AND ORCHESTRATION
-
5.4 CASE STUDY ANALYSISCAPGEMINI HELPED FINANCIAL SERVICES FIRM ESTABLISH SECURITY OPERATIONS CENTER (SOC) CAPABILITY ON AGGRESSIVE DEPLOYMENT SCHEDULECROWDSTRIKE ASSISTED GLOBAL MANUFACTURING COMPANY IN IMPROVING WORKFLOW AND INCREASING EFFICIENCYTRUSTWAVE SPIDERLABS’ THREAT HUNTER HELPED PUBLIC UTILITY COMPANY ENHANCE IT SECURITY POSTURE
-
5.5 VALUE CHAIN ANALYSISOFFERINGSPLANNING AND DESIGNINGDEPLOYMENT (IF APPLICABLE)SYSTEM INTEGRATIONCONSULTATIONONSITE SUPPORT (IF REQUIRED)END-USER GROUPS
- 5.6 MARKET MAP
-
5.7 PORTER’S FIVE FORCES ANALYSISTHREAT OF NEW ENTRANTSBARGAINING POWER OF SUPPLIERSBARGAINING POWER OF BUYERSTHREAT OF SUBSTITUTESINTENSITY OF COMPETITIVE RIVALRY
-
5.8 KEY STAKEHOLDERS & BUYING CRITERIAKEY STAKEHOLDERS IN BUYING PROCESSBUYING CRITERIA
-
5.9 PRICING ANALYSISINDICATIVE PRICE TREND OF KEY PLAYERS, BY OFFERINGINDICATIVE PRICING ANALYSIS, BY OFFERINGINDICATIVE PRICING ANALYSIS, BY VENDOR
-
5.10 TECHNOLOGY ANALYSISKEY TECHNOLOGIES- Security information and event management- Endpoint detection and response- User and entity behavior analytics- Threat intelligence- Machine learning and artificial intelligenceCOMPLEMENTARY TECHNOLOGIES- Security orchestration, automation, and response- Network traffic analysisADJACENT TECHNOLOGIES- Extended detection and response- Cloud security posture management- Vulnerability management
-
5.11 PATENT ANALYSISKEY PATENTS
- 5.12 TRENDS/DISRUPTIONS IMPACTING CUSTOMERS’ BUSINESSES
-
5.13 REGULATORY LANDSCAPEREGULATORY BODIES, GOVERNMENT AGENCIES, AND OTHER ORGANIZATIONSREGULATIONS, BY REGION
- 5.14 KEY CONFERENCES & EVENTS
-
5.15 BUSINESS MODEL ANALYSISSUBSCRIPTION-BASED MODELPERPETUAL LICENSE MODELPAY-PER-USE MODELCONSULTING AND PROFESSIONAL SERVICES MODELINTEGRATED SOLUTIONS MODEL
- 5.16 INVESTMENT & FUNDING SCENARIO
-
6.1 INTRODUCTIONOFFERING: THREAT HUNTING MARKET DRIVERS
-
6.2 TOOLSTHREAT-HUNTING TOOLS TO REDUCE RISKS OF DATA BREACHES AND OPERATIONAL DISRUPTIONSENDPOINT DETECTION AND RESPONSE (EDR)SECURITY INFORMATION AND EVENT MANAGEMENT (SIEM)NETWORK DETECTION AND RESPONSE (NDR)THREAT INTELLIGENCE PLATFORMOTHER TOOLS
-
6.3 SERVICESTHREAT-HUNTING SERVICES TO OFFER CRITICAL SUPPORT IN IDENTIFYING AND MITIGATING POTENTIAL CYBER THREATSPROFESSIONAL SERVICESMANAGED SERVICES
-
7.1 INTRODUCTIONORGANIZATION SIZE: THREAT HUNTING MARKET DRIVERS
-
7.2 SMALL AND MEDIUM ENTERPRISES (SMES)THREAT-HUNTING SOLUTIONS TO FOCUS ON AFFORDABILITY, EASE OF DEPLOYMENT, AND AUTOMATION
-
7.3 LARGE ENTERPRISESLARGE ENTERPRISES TO PRIORITIZE SCALABILITY, INTEGRATION WITH EXISTING SECURITY FRAMEWORKS, AND COMPLIANCE WITH REGULATORY REQUIREMENTS
-
8.1 INTRODUCTIONDEPLOYMENT MODE: THREAT HUNTING MARKET DRIVERS
-
8.2 ON-PREMISESON-PREMISES DEPLOYMENT TO ENABLE DIRECT MANAGEMENT OF SECURITY POLICIES AND REAL-TIME DATA VISIBILITY
-
8.3 CLOUDCLOUD DEPLOYMENT TO PROVIDE AGILITY, COST-EFFICIENCY, AND GLOBAL ACCESSIBILITY IN CYBERSECURITY OPERATIONS
-
9.1 INTRODUCTIONVERTICAL: THREAT HUNTING MARKET DRIVERS
-
9.2 BFSIRISING DEMAND FOR DATA PROTECTION SERVICES IN FINANCIAL INSTITUTIONS TO DRIVE MARKET
-
9.3 IT & ITESGROWING CONCERNS OF FRAUD AND COMPLIANCE TO PROPEL MARKET
-
9.4 GOVERNMENTRISING CONCERNS ABOUT IDENTITY THEFT AND BUSINESS FRAUD TO FUEL MARKET GROWTH
-
9.5 ENERGY & UTILITIESNEED TO SECURE CRITICAL INFRASTRUCTURE TO FUEL SEGMENT GROWTH
-
9.6 MANUFACTURINGMOBILE SECURITY TO BOOST MANAGED SECURITY INFRASTRUCTURE
-
9.7 HEALTHCAREINCREASING NEED TO SECURE CRITICAL PATIENT DATA ACROSS CLOUD ENVIRONMENT TO BOOST MARKET
-
9.8 RETAIL & ECOMMERCEAUTOMATION ACROSS RETAIL CHANNELS FOR CURBING DATA THEFT TO PROPEL MARKET
- 9.9 OTHER VERTICALS
-
10.1 INTRODUCTIONTHREAT TYPE: ATTACK SURFACE MANAGEMENT MARKET DRIVERS
-
10.2 ADVANCED PERSISTENT THREATS (APTS)DEPLOYMENT OF ADVANCED THREAT INTELLIGENCE MEASURES TO MITIGATE IMPACT OF ADVANCED PERSISTENT THREATS
-
10.3 MALWARE AND RANSOMWARESURGING DEMAND FOR EFFECTIVE THREAT-HUNTING STRATEGIES TO PROPEL MARKET GROWTH
-
10.4 INSIDER THREATSGROWING CONCERNS OVER INSIDER MISUSE AND DATA BREACHES TO DRIVE MARKET
-
10.5 PHISHING AND SOCIAL ENGINEERINGTHREAT HUNTING FOR PHISHING AND SOCIAL ENGINEERING TO FOCUS ON IDENTIFYING PHISHING CAMPAIGNS AND MONITORING USER INTERACTIONS
- 10.6 OTHER THREATS
- 11.1 INTRODUCTION
-
11.2 NORTH AMERICANORTH AMERICA: THREAT HUNTING MARKET DRIVERSNORTH AMERICA: RECESSION IMPACTUS- Growing reliance on advanced analytics to drive marketCANADA- Urgent need for effective cybersecurity measures to accelerate market growth
-
11.3 EUROPEEUROPE: THREAT HUNTING MARKET DRIVERSEUROPE: RECESSION IMPACTUK- Enhanced cyber threat awareness to drive marketGERMANY- Increasing investments in proactive security solutions to drive marketFRANCE- Growing security concerns and increasing emphasis on national security to boost marketITALY- Heightened cyber threat awareness to propel market growthREST OF EUROPE
-
11.4 ASIA PACIFICASIA PACIFIC: THREAT HUNTING MARKET DRIVERSASIA PACIFIC: RECESSION IMPACTCHINA- Rapid digitalization and stringent cybersecurity regulations to foster market growthJAPAN- Growing adoption of advanced AI-driven threat-hunting technologies to drive marketAUSTRALIA AND NEW ZEALAND- Increased funding and allocation of resources for threat-hunting initiatives to drive marketINDIA- Growing significance of threat hunting in safeguarding country’s digital infrastructure to aid market growthREST OF ASIA PACIFIC
-
11.5 MIDDLE EAST & AFRICAMIDDLE EAST & AFRICA: THREAT HUNTING MARKET DRIVERSMIDDLE EAST- Escalating cyberattacks, economic development, and increasing digital adoption to drive marketGULF COOPERATION COUNCIL (GCC)- Surging need for advanced security measures for protection of sensitive data and digital assets to drive market- KSA- UAE- Rest of GCCSOUTH AFRICA- Regulatory compliance and cyber resilience to propel marketREST OF MIDDLE EAST & AFRICA
-
11.6 LATIN AMERICALATIN AMERICA: THREAT HUNTING MARKET DRIVERSLATIN AMERICA: RECESSION IMPACTBRAZIL- Rising cyber threats and regulatory compliance to boost marketMEXICO- Surging need for safeguarding evolving digital assets and infrastructure from escalating cyber threats to bolster marketREST OF LATIN AMERICA
- 12.1 KEY PLAYER STRATEGIES/RIGHT TO WIN
- 12.2 REVENUE ANALYSIS
- 12.3 MARKET SHARE ANALYSIS
- 12.4 BRAND COMPARISON
-
12.5 COMPANY VALUATION AND FINANCIAL METRICSCOMPANY VALUATIONFINANCIAL METRICS USING EV/EBIDTA
-
12.6 COMPANY EVALUATION MATRIX: KEY PLAYERS, 2023STARSEMERGING LEADERSPERVASIVE PLAYERSPARTICIPANTSCOMPANY FOOTPRINT: KEY PLAYERS, 2023- Company footprint- Regional footprint- Solution footprint- Vertical footprint
-
12.7 COMPANY EVALUATION MATRIX: STARTUPS/SMES, 2023PROGRESSIVE COMPANIESRESPONSIVE COMPANIESDYNAMIC COMPANIESSTARTING BLOCKSCOMPETITIVE BENCHMARKING: STARTUPS/SMES, 2023- Detailed list of key startups/SMEs- Competitive benchmarking of key startups/SMEs
-
12.8 COMPETITIVE SCENARIOPRODUCT LAUNCHESDEALS
-
13.1 KEY PLAYERSPALO ALTO NETWORKS- Business overview- Products/Solutions/Services offered- Recent developments- MnM viewCROWDSTRIKE- Business overview- Products/Solutions/Services offered- Recent developments- MnM viewRAPID7- Business overview- Products/Solutions/Services offered- Recent developments- MnM viewVMWARE- Business overview- Products/Solutions/Services Offered- Recent developments- MnM viewIBM- Business overview- Products/Solutions/Services Offered- Recent developments- MnM viewTREND MICRO- Business overview- Products/Solutions/Services offered- Recent developmentsCAPGEMINI- Business overview- Products/Solutions/Services offeredKASPERSKY- Business overview- Products/Solutions/Services offered- Recent developmentsVERIZON- Business overview- Products/Solutions/Services offeredSECUREWORKS- Business overview- Products/Solutions/Services Offered- Recent developmentsSANGFOR- Business overview- Products/Solutions/Services offered- Recent developmentsEVIDEN- Business overview- Products/Solutions/Services Offered- Recent developmentsSOLARWINDS- Business overview- Products/Solutions/Services offeredCYNET- Business overview- Products/Solutions/Services offered- Recent developmentsMANDIANTBINARY DEFENSESOPHOS
-
13.2 OTHER PLAYERSESENTIREDEEPWATCHNETSURIONGOSECURELMNTRIXUNDERDEFENSEACKCENTCYBEREASONCRITICAL STARTCYSIVCRITICAL INSIGHTCIPHER MANAGED SECURITY SERVICESTALATEKSOC PRIMERSI SECURITYPROTECTED HARBORMINDPOINT GROUPEXPONENTIAL-EREDSCANIRON NET CYBERSECURITYLIVEACTION
- 14.1 INTRODUCTION TO ADJACENT MARKETS
- 14.2 LIMITATIONS
-
14.3 SECURITY AND VULNERABILITY MANAGEMENT MARKETINCLUSIONS AND EXCLUSIONS
-
14.4 SECURITY INFORMATION AND EVENT MANAGEMENT (SIEM) MARKETINCLUSIONS AND EXCLUSIONS
- 15.1 DISCUSSION GUIDE
- 15.2 KNOWLEDGESTORE: MARKETSANDMARKETS’ SUBSCRIPTION PORTAL
- 15.3 CUSTOMIZATION OPTIONS
- 15.4 RELATED REPORTS
- 15.5 AUTHOR DETAILS
- TABLE 1 USD EXCHANGE RATES, 2019–2023
- TABLE 2 FACTOR ANALYSIS
- TABLE 3 THREAT HUNTING MARKET: ECOSYSTEM
- TABLE 4 PORTER’S FIVE FORCES: IMPACT ANALYSIS
- TABLE 5 INFLUENCE OF STAKEHOLDERS ON BUYING PROCESS FOR TOP THREE VERTICALS (%)
- TABLE 6 KEY BUYING CRITERIA FOR TOP THREE VERTICALS
- TABLE 7 INDICATIVE PRICING TREND OF KEY PLAYERS, BY OFFERING
- TABLE 8 INDICATIVE PRICING LEVELS OF THREAT-HUNTING TOOLS, BY VENDOR
- TABLE 9 LIST OF KEY PATENTS
- TABLE 10 NORTH AMERICA: LIST OF REGULATORY BODIES, GOVERNMENT AGENCIES, AND OTHER ORGANIZATIONS
- TABLE 11 EUROPE: LIST OF REGULATORY BODIES, GOVERNMENT AGENCIES, AND OTHER ORGANIZATIONS
- TABLE 12 ASIA PACIFIC: LIST OF REGULATORY BODIES, GOVERNMENT AGENCIES, AND OTHER ORGANIZATIONS
- TABLE 13 MIDDLE EAST & AFRICA: LIST OF REGULATORY BODIES, GOVERNMENT AGENCIES, AND OTHER ORGANIZATIONS
- TABLE 14 LATIN AMERICA: LIST OF REGULATORY BODIES, GOVERNMENT AGENCIES, AND OTHER ORGANIZATIONS
- TABLE 15 THREAT HUNTING MARKET: KEY CONFERENCES AND EVENTS, 2024
- TABLE 16 THREAT HUNTING MARKET, BY OFFERING, 2018–2023 (USD MILLION)
- TABLE 17 THREAT HUNTING MARKET, BY OFFERING, 2024–2029 (USD MILLION)
- TABLE 18 TOOLS: THREAT HUNTING MARKET, BY REGION, 2018–2023 (USD MILLION)
- TABLE 19 TOOLS: THREAT HUNTING MARKET, BY REGION, 2024–2029 (USD MILLION)
- TABLE 20 THREAT HUNTING MARKET, BY TOOL, 2018–2023 (USD MILLION)
- TABLE 21 THREAT HUNTING MARKET, BY TOOL, 2024–2029 (USD MILLION)
- TABLE 22 ENDPOINT DETECTION AND RESPONSE: THREAT HUNTING MARKET, BY REGION, 2018–2023 (USD MILLION)
- TABLE 23 ENDPOINT DETECTION AND RESPONSE: THREAT HUNTING MARKET, BY REGION, 2024–2029 (USD MILLION)
- TABLE 24 SECURITY INFORMATION AND EVENT MANAGEMENT: THREAT HUNTING MARKET, BY REGION, 2018–2023 (USD MILLION)
- TABLE 25 SECURITY INFORMATION AND EVENT MANAGEMENT: THREAT HUNTING MARKET, BY REGION, 2024–2029 (USD MILLION)
- TABLE 26 NETWORK DETECTION AND RESPONSE: THREAT HUNTING MARKET, BY REGION, 2018–2023 (USD MILLION)
- TABLE 27 NETWORK DETECTION AND RESPONSE: THREAT HUNTING MARKET, BY REGION, 2024–2029 (USD MILLION)
- TABLE 28 THREAT INTELLIGENCE PLATFORM: THREAT HUNTING MARKET, BY REGION, 2018–2023 (USD MILLION)
- TABLE 29 THREAT INTELLIGENCE PLATFORM: THREAT HUNTING MARKET, BY REGION, 2024–2029 (USD MILLION)
- TABLE 30 OTHER TOOLS: THREAT HUNTING MARKET, BY REGION, 2018–2023 (USD MILLION)
- TABLE 31 OTHER TOOLS: THREAT HUNTING MARKET, BY REGION, 2024–2029 (USD MILLION)
- TABLE 32 SERVICES: THREAT HUNTING MARKET, BY REGION, 2018–2023 (USD MILLION)
- TABLE 33 SERVICES: THREAT HUNTING MARKET, BY REGION, 2024–2029 (USD MILLION)
- TABLE 34 THREAT HUNTING MARKET, BY SERVICE, 2018–2023 (USD MILLION)
- TABLE 35 THREAT HUNTING MARKET, BY SERVICE, 2024–2029 (USD MILLION)
- TABLE 36 PROFESSIONAL SERVICES: THREAT HUNTING MARKET, BY REGION, 2018–2023 (USD MILLION)
- TABLE 37 PROFESSIONAL SERVICES: THREAT HUNTING MARKET, BY REGION, 2024–2029 (USD MILLION)
- TABLE 38 MANAGED SERVICES: THREAT HUNTING MARKET, BY REGION, 2018–2023 (USD MILLION)
- TABLE 39 MANAGED SERVICES: THREAT HUNTING MARKET, BY REGION, 2024–2029 (USD MILLION)
- TABLE 40 THREAT HUNTING MARKET, BY ORGANIZATION SIZE, 2018–2023 (USD MILLION)
- TABLE 41 THREAT HUNTING MARKET, BY ORGANIZATION SIZE, 2024–2029 (USD MILLION)
- TABLE 42 SMALL AND MEDIUM ENTERPRISES: THREAT HUNTING MARKET, BY REGION, 2018–2023 (USD MILLION)
- TABLE 43 SMALL AND MEDIUM ENTERPRISES: THREAT HUNTING MARKET, BY REGION, 2024–2029 (USD MILLION)
- TABLE 44 LARGE ENTERPRISES: THREAT HUNTING MARKET, BY REGION, 2018–2023 (USD MILLION)
- TABLE 45 LARGE ENTERPRISES: THREAT HUNTING MARKET, BY REGION, 2024–2029 (USD MILLION)
- TABLE 46 THREAT HUNTING MARKET, BY DEPLOYMENT MODE, 2018–2023 (USD MILLION)
- TABLE 47 THREAT HUNTING MARKET, BY DEPLOYMENT MODE, 2024–2029 (USD MILLION)
- TABLE 48 ON-PREMISES: THREAT HUNTING MARKET, BY REGION, 2018–2023 (USD MILLION)
- TABLE 49 ON-PREMISES: THREAT HUNTING MARKET BY REGION, 2024–2029 (USD MILLION)
- TABLE 50 CLOUD: THREAT HUNTING MARKET, BY REGION, 2018–2023 (USD MILLION)
- TABLE 51 CLOUD: THREAT HUNTING MARKET, BY REGION, 2024–2029 (USD MILLION)
- TABLE 52 THREAT HUNTING MARKET, BY VERTICAL, 2018–2023 (USD MILLION)
- TABLE 53 THREAT HUNTING MARKET, BY VERTICAL, 2024–2029 (USD MILLION)
- TABLE 54 BFSI: THREAT HUNTING MARKET, BY REGION, 2018–2023 (USD MILLION)
- TABLE 55 BFSI: THREAT HUNTING MARKET, BY REGION, 2024–2029 (USD MILLION)
- TABLE 56 IT & ITES: THREAT HUNTING MARKET, BY REGION, 2018–2023 (USD MILLION)
- TABLE 57 IT & ITES: THREAT HUNTING MARKET, BY REGION, 2024–2029 (USD MILLION)
- TABLE 58 GOVERNMENT: THREAT HUNTING MARKET, BY REGION, 2018–2023 (USD MILLION)
- TABLE 59 GOVERNMENT: THREAT HUNTING MARKET, BY REGION, 2024–2029 (USD MILLION)
- TABLE 60 ENERGY & UTILITIES: THREAT HUNTING MARKET, BY REGION, 2018–2023 (USD MILLION)
- TABLE 61 ENERGY & UTILITIES: THREAT HUNTING MARKET, BY REGION, 2024–2029 (USD MILLION)
- TABLE 62 MANUFACTURING: THREAT HUNTING MARKET, BY REGION, 2018–2023 (USD MILLION)
- TABLE 63 MANUFACTURING: THREAT HUNTING MARKET, BY REGION, 2024–2029 (USD MILLION)
- TABLE 64 HEALTHCARE: THREAT HUNTING MARKET, BY REGION, 2018–2023 (USD MILLION)
- TABLE 65 HEALTHCARE: THREAT HUNTING MARKET, BY REGION, 2024–2029 (USD MILLION)
- TABLE 66 RETAIL & ECOMMERCE: THREAT HUNTING MARKET, BY REGION, 2018–2023 (USD MILLION)
- TABLE 67 RETAIL & ECOMMERCE: THREAT HUNTING MARKET, BY REGION, 2024–2029 (USD MILLION)
- TABLE 68 OTHER VERTICALS: THREAT HUNTING MARKET, BY REGION, 2018–2023 (USD MILLION)
- TABLE 69 OTHER VERTICALS: THREAT HUNTING MARKET, BY REGION, 2024–2029 (USD MILLION)
- TABLE 70 THREAT HUNTING MARKET, BY REGION, 2018–2023 (USD MILLION)
- TABLE 71 THREAT HUNTING MARKET, BY REGION, 2024–2029 (USD MILLION)
- TABLE 72 NORTH AMERICA: THREAT HUNTING MARKET, BY OFFERING, 2018–2023 (USD MILLION)
- TABLE 73 NORTH AMERICA: THREAT HUNTING MARKET, BY OFFERING, 2024–2029 (USD MILLION)
- TABLE 74 NORTH AMERICA: THREAT HUNTING MARKET, BY TOOL, 2018–2023 (USD MILLION)
- TABLE 75 NORTH AMERICA: THREAT HUNTING MARKET, BY TOOL, 2024–2029 (USD MILLION)
- TABLE 76 NORTH AMERICA: THREAT HUNTING MARKET, BY SERVICE, 2018–2023 (USD MILLION)
- TABLE 77 NORTH AMERICA: THREAT HUNTING MARKET, BY SERVICE, 2024–2029 (USD MILLION)
- TABLE 78 NORTH AMERICA: THREAT HUNTING MARKET, BY DEPLOYMENT MODE, 2018–2023 (USD MILLION)
- TABLE 79 NORTH AMERICA: THREAT HUNTING MARKET, BY DEPLOYMENT MODE, 2024–2029 (USD MILLION)
- TABLE 80 NORTH AMERICA: THREAT HUNTING MARKET, BY ORGANIZATION SIZE, 2018–2023 (USD MILLION)
- TABLE 81 NORTH AMERICA: THREAT HUNTING MARKET, BY ORGANIZATION SIZE, 2024–2029 (USD MILLION)
- TABLE 82 NORTH AMERICA: THREAT HUNTING MARKET, BY VERTICAL, 2018–2023 (USD MILLION)
- TABLE 83 NORTH AMERICA: THREAT HUNTING MARKET, BY VERTICAL, 2024–2029 (USD MILLION)
- TABLE 84 NORTH AMERICA: THREAT HUNTING MARKET, BY COUNTRY, 2018–2023 (USD MILLION)
- TABLE 85 NORTH AMERICA: THREAT HUNTING MARKET, BY COUNTRY, 2024–2029 (USD MILLION)
- TABLE 86 US: THREAT HUNTING MARKET, BY OFFERING, 2018–2023 (USD MILLION)
- TABLE 87 US: THREAT HUNTING MARKET, BY OFFERING, 2024–2029 (USD MILLION)
- TABLE 88 US: THREAT HUNTING MARKET, BY TOOL, 2018–2023 (USD MILLION)
- TABLE 89 US: THREAT HUNTING MARKET, BY TOOL, 2024–2029 (USD MILLION)
- TABLE 90 US: THREAT HUNTING MARKET, BY SERVICE, 2018–2023 (USD MILLION)
- TABLE 91 US: THREAT HUNTING MARKET, BY SERVICE, 2024–2029 (USD MILLION)
- TABLE 92 US: THREAT HUNTING MARKET, BY DEPLOYMENT MODE, 2018–2023 (USD MILLION)
- TABLE 93 US: THREAT HUNTING MARKET, BY DEPLOYMENT MODE, 2024–2029 (USD MILLION)
- TABLE 94 US: THREAT HUNTING MARKET, BY ORGANIZATION SIZE, 2018–2023 (USD MILLION)
- TABLE 95 US: THREAT HUNTING MARKET, BY ORGANIZATION SIZE, 2024–2029 (USD MILLION)
- TABLE 96 US: THREAT HUNTING MARKET, BY VERTICAL, 2018–2023 (USD MILLION)
- TABLE 97 US: THREAT HUNTING MARKET, BY VERTICAL, 2024–2029 (USD MILLION)
- TABLE 98 CANADA: THREAT HUNTING MARKET, BY OFFERING, 2018–2023 (USD MILLION)
- TABLE 99 CANADA: THREAT HUNTING MARKET, BY OFFERING, 2024–2029 (USD MILLION)
- TABLE 100 CANADA: THREAT HUNTING MARKET, BY TOOL, 2018–2023 (USD MILLION)
- TABLE 101 CANADA: THREAT HUNTING MARKET, BY TOOL, 2024–2029 (USD MILLION)
- TABLE 102 CANADA: THREAT HUNTING MARKET, BY SERVICE, 2018–2023 (USD MILLION)
- TABLE 103 CANADA: THREAT HUNTING MARKET, BY SERVICE, 2024–2029 (USD MILLION)
- TABLE 104 CANADA: THREAT HUNTING MARKET, BY DEPLOYMENT MODE, 2018–2023 (USD MILLION)
- TABLE 105 CANADA: THREAT HUNTING MARKET, BY DEPLOYMENT MODE, 2024–2029 (USD MILLION)
- TABLE 106 CANADA: THREAT HUNTING MARKET, BY ORGANIZATION SIZE, 2018–2023 (USD MILLION)
- TABLE 107 CANADA: THREAT HUNTING MARKET, BY ORGANIZATION SIZE, 2024–2029 (USD MILLION)
- TABLE 108 CANADA: THREAT HUNTING MARKET, BY VERTICAL, 2018–2023 (USD MILLION)
- TABLE 109 CANADA: THREAT HUNTING MARKET, BY VERTICAL, 2024–2029 (USD MILLION)
- TABLE 110 EUROPE: THREAT HUNTING MARKET, BY OFFERING, 2018–2023 (USD MILLION)
- TABLE 111 EUROPE: THREAT HUNTING MARKET, BY OFFERING, 2024–2029 (USD MILLION)
- TABLE 112 EUROPE: THREAT HUNTING MARKET, BY TOOL, 2018–2023 (USD MILLION)
- TABLE 113 EUROPE: THREAT HUNTING MARKET, BY TOOL, 2024–2029 (USD MILLION)
- TABLE 114 EUROPE: THREAT HUNTING MARKET, BY SERVICE, 2018–2023 (USD MILLION)
- TABLE 115 EUROPE: THREAT HUNTING MARKET, BY SERVICE, 2024–2029 (USD MILLION)
- TABLE 116 EUROPE: THREAT HUNTING MARKET, BY DEPLOYMENT MODE, 2018–2023 (USD MILLION)
- TABLE 117 EUROPE: THREAT HUNTING MARKET, BY DEPLOYMENT MODE, 2024–2029 (USD MILLION)
- TABLE 118 EUROPE: THREAT HUNTING MARKET, BY ORGANIZATION SIZE, 2018–2023 (USD MILLION)
- TABLE 119 EUROPE: THREAT HUNTING MARKET, BY ORGANIZATION SIZE, 2024–2029 (USD MILLION)
- TABLE 120 EUROPE: THREAT HUNTING MARKET, BY VERTICAL, 2018–2023 (USD MILLION)
- TABLE 121 EUROPE: THREAT HUNTING MARKET, BY VERTICAL, 2024–2029 (USD MILLION)
- TABLE 122 EUROPE: THREAT HUNTING MARKET, BY COUNTRY, 2018–2023 (USD MILLION)
- TABLE 123 EUROPE: THREAT HUNTING MARKET, BY COUNTRY, 2024–2029 (USD MILLION)
- TABLE 124 UK: THREAT HUNTING MARKET, BY OFFERING, 2018–2023 (USD MILLION)
- TABLE 125 UK: THREAT HUNTING MARKET, BY OFFERING, 2024–2029 (USD MILLION)
- TABLE 126 UK: THREAT HUNTING MARKET, BY TOOL, 2018–2023 (USD MILLION)
- TABLE 127 UK: THREAT HUNTING MARKET, BY TOOL, 2024–2029 (USD MILLION)
- TABLE 128 UK: THREAT HUNTING MARKET, BY SERVICE, 2018–2023 (USD MILLION)
- TABLE 129 UK: THREAT HUNTING MARKET, BY SERVICE, 2024–2029 (USD MILLION)
- TABLE 130 UK: THREAT HUNTING MARKET, BY DEPLOYMENT MODE, 2018–2023 (USD MILLION)
- TABLE 131 UK: THREAT HUNTING MARKET, BY DEPLOYMENT MODE, 2024–2029 (USD MILLION)
- TABLE 132 UK: THREAT HUNTING MARKET, BY ORGANIZATION SIZE, 2018–2023 (USD MILLION)
- TABLE 133 UK: THREAT HUNTING MARKET, BY ORGANIZATION SIZE, 2024–2029 (USD MILLION)
- TABLE 134 UK: THREAT HUNTING MARKET, BY VERTICAL, 2018–2023 (USD MILLION)
- TABLE 135 UK: THREAT HUNTING MARKET, BY VERTICAL, 2024–2029 (USD MILLION)
- TABLE 136 GERMANY: THREAT HUNTING MARKET, BY OFFERING, 2018–2023 (USD MILLION)
- TABLE 137 GERMANY: THREAT HUNTING MARKET, BY OFFERING, 2024–2029 (USD MILLION)
- TABLE 138 GERMANY: THREAT HUNTING MARKET, BY TOOL, 2018–2023 (USD MILLION)
- TABLE 139 GERMANY: THREAT HUNTING MARKET, BY TOOL, 2024–2029 (USD MILLION)
- TABLE 140 GERMANY: THREAT HUNTING MARKET, BY SERVICE, 2018–2023 (USD MILLION)
- TABLE 141 GERMANY: THREAT HUNTING MARKET, BY SERVICE, 2024–2029 (USD MILLION)
- TABLE 142 GERMANY: THREAT HUNTING MARKET, BY DEPLOYMENT MODE, 2018–2023 (USD MILLION)
- TABLE 143 GERMANY: THREAT HUNTING MARKET, BY DEPLOYMENT MODE, 2024–2029 (USD MILLION)
- TABLE 144 GERMANY: THREAT HUNTING MARKET, BY ORGANIZATION SIZE, 2018–2023 (USD MILLION)
- TABLE 145 GERMANY: THREAT HUNTING MARKET, BY ORGANIZATION SIZE, 2024–2029 (USD MILLION)
- TABLE 146 GERMANY: THREAT HUNTING MARKET, BY VERTICAL, 2018–2023 (USD MILLION)
- TABLE 147 GERMANY: THREAT HUNTING MARKET, BY VERTICAL, 2024–2029 (USD MILLION)
- TABLE 148 FRANCE: THREAT HUNTING MARKET, BY OFFERING, 2018–2023 (USD MILLION)
- TABLE 149 FRANCE: THREAT HUNTING MARKET, BY OFFERING, 2024–2029 (USD MILLION)
- TABLE 150 FRANCE: THREAT HUNTING MARKET, BY TOOL, 2018–2023 (USD MILLION)
- TABLE 151 FRANCE: THREAT HUNTING MARKET, BY TOOL, 2024–2029 (USD MILLION)
- TABLE 152 FRANCE: THREAT HUNTING MARKET, BY SERVICE, 2018–2023 (USD MILLION)
- TABLE 153 FRANCE: THREAT HUNTING MARKET, BY SERVICE, 2024–2029 (USD MILLION)
- TABLE 154 FRANCE: THREAT HUNTING MARKET, BY DEPLOYMENT MODE, 2018–2023 (USD MILLION)
- TABLE 155 FRANCE: THREAT HUNTING MARKET, BY DEPLOYMENT MODE, 2024–2029 (USD MILLION)
- TABLE 156 FRANCE: THREAT HUNTING MARKET, BY ORGANIZATION SIZE, 2018–2023 (USD MILLION)
- TABLE 157 FRANCE: THREAT HUNTING MARKET, BY ORGANIZATION SIZE, 2024–2029 (USD MILLION)
- TABLE 158 FRANCE: THREAT HUNTING MARKET, BY VERTICAL, 2018–2023 (USD MILLION)
- TABLE 159 FRANCE: THREAT HUNTING MARKET, BY VERTICAL, 2024–2029 (USD MILLION)
- TABLE 160 ITALY: THREAT HUNTING MARKET, BY OFFERING, 2018–2023 (USD MILLION)
- TABLE 161 ITALY: THREAT HUNTING MARKET, BY OFFERING, 2024–2029 (USD MILLION)
- TABLE 162 ITALY: THREAT HUNTING MARKET, BY TOOL, 2018–2023 (USD MILLION)
- TABLE 163 ITALY: THREAT HUNTING MARKET, BY TOOL, 2024–2029 (USD MILLION)
- TABLE 164 ITALY: THREAT HUNTING MARKET, BY SERVICE, 2018–2023 (USD MILLION)
- TABLE 165 ITALY: THREAT HUNTING MARKET, BY SERVICE, 2024–2029 (USD MILLION)
- TABLE 166 ITALY: THREAT HUNTING MARKET, BY DEPLOYMENT MODE, 2018–2023 (USD MILLION)
- TABLE 167 ITALY: THREAT HUNTING MARKET, BY DEPLOYMENT MODE, 2024–2029 (USD MILLION)
- TABLE 168 ITALY: THREAT HUNTING MARKET, BY ORGANIZATION SIZE, 2018–2023 (USD MILLION)
- TABLE 169 ITALY: THREAT HUNTING MARKET, BY ORGANIZATION SIZE, 2024–2029 (USD MILLION)
- TABLE 170 ITALY: THREAT HUNTING MARKET, BY VERTICAL, 2018–2023 (USD MILLION)
- TABLE 171 ITALY: THREAT HUNTING MARKET, BY VERTICAL, 2024–2029 (USD MILLION)
- TABLE 172 REST OF EUROPE: THREAT HUNTING MARKET, BY OFFERING, 2018–2023 (USD MILLION)
- TABLE 173 REST OF EUROPE: THREAT HUNTING MARKET, BY OFFERING, 2024–2029 (USD MILLION)
- TABLE 174 REST OF EUROPE: THREAT HUNTING MARKET, BY TOOL, 2018–2023 (USD MILLION)
- TABLE 175 REST OF EUROPE: THREAT HUNTING MARKET, BY TOOL, 2024–2029 (USD MILLION)
- TABLE 176 REST OF EUROPE: THREAT HUNTING MARKET, BY SERVICE, 2018–2023 (USD MILLION)
- TABLE 177 REST OF EUROPE: THREAT HUNTING MARKET, BY SERVICE, 2024–2029 (USD MILLION)
- TABLE 178 REST OF EUROPE: THREAT HUNTING MARKET, BY DEPLOYMENT MODE, 2018–2023 (USD MILLION)
- TABLE 179 REST OF EUROPE: THREAT HUNTING MARKET, BY DEPLOYMENT MODE, 2024–2029 (USD MILLION)
- TABLE 180 REST OF EUROPE: THREAT HUNTING MARKET, BY ORGANIZATION SIZE, 2018–2023 (USD MILLION)
- TABLE 181 REST OF EUROPE: THREAT HUNTING MARKET, BY ORGANIZATION SIZE, 2024–2029 (USD MILLION)
- TABLE 182 REST OF EUROPE: THREAT HUNTING MARKET, BY VERTICAL, 2018–2023 (USD MILLION)
- TABLE 183 REST OF EUROPE: THREAT HUNTING MARKET, BY VERTICAL, 2024–2029 (USD MILLION)
- TABLE 184 ASIA PACIFIC: THREAT HUNTING MARKET, BY OFFERING, 2018–2023 (USD MILLION)
- TABLE 185 ASIA PACIFIC: THREAT HUNTING MARKET, BY OFFERING, 2024–2029 (USD MILLION)
- TABLE 186 ASIA PACIFIC: THREAT HUNTING MARKET, BY TOOL, 2018–2023 (USD MILLION)
- TABLE 187 ASIA PACIFIC: THREAT HUNTING MARKET, BY TOOL, 2024–2029 (USD MILLION)
- TABLE 188 ASIA PACIFIC: THREAT HUNTING MARKET, BY SERVICE, 2018–2023 (USD MILLION)
- TABLE 189 ASIA PACIFIC: THREAT HUNTING MARKET, BY SERVICE, 2024–2029 (USD MILLION)
- TABLE 190 ASIA PACIFIC: THREAT HUNTING MARKET, BY DEPLOYMENT MODE, 2018–2023 (USD MILLION)
- TABLE 191 ASIA PACIFIC: THREAT HUNTING MARKET, BY DEPLOYMENT MODE, 2024–2029 (USD MILLION)
- TABLE 192 ASIA PACIFIC: THREAT HUNTING MARKET, BY ORGANIZATION SIZE, 2018–2023 (USD MILLION)
- TABLE 193 ASIA PACIFIC: THREAT HUNTING MARKET, BY ORGANIZATION SIZE, 2024–2029 (USD MILLION)
- TABLE 194 ASIA PACIFIC: THREAT HUNTING MARKET, BY VERTICAL, 2018–2023 (USD MILLION)
- TABLE 195 ASIA PACIFIC: THREAT HUNTING MARKET, BY VERTICAL, 2024–2029 (USD MILLION)
- TABLE 196 ASIA PACIFIC: THREAT HUNTING MARKET, BY COUNTRY, 2018–2023 (USD MILLION)
- TABLE 197 ASIA PACIFIC: THREAT HUNTING MARKET, BY COUNTRY, 2024–2029 (USD MILLION)
- TABLE 198 CHINA: THREAT HUNTING MARKET, BY OFFERING, 2018–2023 (USD MILLION)
- TABLE 199 CHINA: THREAT HUNTING MARKET, BY OFFERING, 2024–2029 (USD MILLION)
- TABLE 200 CHINA: THREAT HUNTING MARKET, BY TOOL, 2018–2023 (USD MILLION)
- TABLE 201 CHINA: THREAT HUNTING MARKET, BY TOOL, 2024–2029 (USD MILLION)
- TABLE 202 CHINA: THREAT HUNTING MARKET, BY SERVICE, 2018–2023 (USD MILLION)
- TABLE 203 CHINA: THREAT HUNTING MARKET, BY SERVICE, 2024–2029 (USD MILLION)
- TABLE 204 CHINA: THREAT HUNTING MARKET, BY DEPLOYMENT MODE, 2018–2023 (USD MILLION)
- TABLE 205 CHINA: THREAT HUNTING MARKET, BY DEPLOYMENT MODE, 2024–2029 (USD MILLION)
- TABLE 206 CHINA: THREAT HUNTING MARKET, BY ORGANIZATION SIZE, 2018–2023 (USD MILLION)
- TABLE 207 CHINA: THREAT HUNTING MARKET, BY ORGANIZATION SIZE, 2024–2029 (USD MILLION)
- TABLE 208 CHINA: THREAT HUNTING MARKET, BY VERTICAL, 2018–2023 (USD MILLION)
- TABLE 209 CHINA: THREAT HUNTING MARKET, BY VERTICAL, 2024–2029 (USD MILLION)
- TABLE 210 JAPAN: THREAT HUNTING MARKET, BY OFFERING, 2018–2023 (USD MILLION)
- TABLE 211 JAPAN: THREAT HUNTING MARKET, BY OFFERING, 2024–2029 (USD MILLION)
- TABLE 212 JAPAN: THREAT HUNTING MARKET, BY TOOL, 2018–2023 (USD MILLION)
- TABLE 213 JAPAN: THREAT HUNTING MARKET, BY TOOL, 2024–2029 (USD MILLION)
- TABLE 214 JAPAN: THREAT HUNTING MARKET, BY SERVICE, 2018–2023 (USD MILLION)
- TABLE 215 JAPAN: THREAT HUNTING MARKET, BY SERVICE, 2024–2029 (USD MILLION)
- TABLE 216 JAPAN: THREAT HUNTING MARKET, BY DEPLOYMENT MODE, 2018–2023 (USD MILLION)
- TABLE 217 JAPAN: THREAT HUNTING MARKET, BY DEPLOYMENT MODE, 2024–2029 (USD MILLION)
- TABLE 218 JAPAN: THREAT HUNTING MARKET, BY ORGANIZATION SIZE, 2018–2023 (USD MILLION)
- TABLE 219 JAPAN: THREAT HUNTING MARKET, BY ORGANIZATION SIZE, 2024–2029 (USD MILLION)
- TABLE 220 JAPAN: THREAT HUNTING MARKET, BY VERTICAL, 2018–2023 (USD MILLION)
- TABLE 221 JAPAN: THREAT HUNTING MARKET, BY VERTICAL, 2024–2029 (USD MILLION)
- TABLE 222 AUSTRALIA AND NEW ZEALAND: THREAT HUNTING MARKET, BY OFFERING, 2018–2023 (USD MILLION)
- TABLE 223 AUSTRALIA AND NEW ZEALAND: THREAT HUNTING MARKET, BY OFFERING, 2024–2029 (USD MILLION)
- TABLE 224 AUSTRALIA AND NEW ZEALAND: THREAT HUNTING MARKET, BY TOOL, 2018–2023 (USD MILLION)
- TABLE 225 AUSTRALIA AND NEW ZEALAND: THREAT HUNTING MARKET, BY TOOL, 2024–2029 (USD MILLION)
- TABLE 226 AUSTRALIA AND NEW ZEALAND: THREAT HUNTING MARKET, BY SERVICE, 2018–2023 (USD MILLION)
- TABLE 227 AUSTRALIA AND NEW ZEALAND: THREAT HUNTING MARKET, BY SERVICE, 2024–2029 (USD MILLION)
- TABLE 228 AUSTRALIA AND NEW ZEALAND: THREAT HUNTING MARKET, BY DEPLOYMENT MODE, 2018–2023 (USD MILLION)
- TABLE 229 AUSTRALIA AND NEW ZEALAND: THREAT HUNTING MARKET, BY DEPLOYMENT MODE, 2024–2029 (USD MILLION)
- TABLE 230 AUSTRALIA AND NEW ZEALAND: THREAT HUNTING MARKET, BY ORGANIZATION SIZE, 2018–2023 (USD MILLION)
- TABLE 231 AUSTRALIA AND NEW ZEALAND: THREAT HUNTING MARKET, BY ORGANIZATION SIZE, 2024–2029 (USD MILLION)
- TABLE 232 AUSTRALIA AND NEW ZEALAND: THREAT HUNTING MARKET, BY VERTICAL, 2018–2023 (USD MILLION)
- TABLE 233 AUSTRALIA AND NEW ZEALAND: THREAT HUNTING MARKET, BY VERTICAL, 2024–2029 (USD MILLION)
- TABLE 234 INDIA: THREAT HUNTING MARKET, BY OFFERING, 2018–2023 (USD MILLION)
- TABLE 235 INDIA: THREAT HUNTING MARKET, BY OFFERING, 2024–2029 (USD MILLION)
- TABLE 236 INDIA: THREAT HUNTING MARKET, BY TOOL, 2018–2023 (USD MILLION)
- TABLE 237 INDIA: THREAT HUNTING MARKET, BY TOOL, 2024–2029 (USD MILLION)
- TABLE 238 INDIA: THREAT HUNTING MARKET, BY SERVICE, 2018–2023 (USD MILLION)
- TABLE 239 INDIA: THREAT HUNTING MARKET, BY SERVICE, 2024–2029 (USD MILLION)
- TABLE 240 INDIA: THREAT HUNTING MARKET, BY DEPLOYMENT MODE, 2018–2023 (USD MILLION)
- TABLE 241 INDIA: THREAT HUNTING MARKET, BY DEPLOYMENT MODE, 2024–2029 (USD MILLION)
- TABLE 242 INDIA: THREAT HUNTING MARKET, BY ORGANIZATION SIZE, 2018–2023 (USD MILLION)
- TABLE 243 INDIA: THREAT HUNTING MARKET, BY ORGANIZATION SIZE, 2024–2029 (USD MILLION)
- TABLE 244 INDIA: THREAT HUNTING MARKET, BY VERTICAL, 2018–2023 (USD MILLION)
- TABLE 245 INDIA: THREAT HUNTING MARKET, BY VERTICAL, 2024–2029 (USD MILLION)
- TABLE 246 REST OF ASIA PACIFIC: THREAT HUNTING MARKET, BY OFFERING, 2018–2023 (USD MILLION)
- TABLE 247 REST OF ASIA PACIFIC: THREAT HUNTING MARKET, BY OFFERING, 2024–2029 (USD MILLION)
- TABLE 248 REST OF ASIA PACIFIC: THREAT HUNTING MARKET, BY TOOL, 2018–2023 (USD MILLION)
- TABLE 249 REST OF ASIA PACIFIC: THREAT HUNTING MARKET, BY TOOL, 2024–2029 (USD MILLION)
- TABLE 250 REST OF ASIA PACIFIC: THREAT HUNTING MARKET, BY SERVICE, 2018–2023 (USD MILLION)
- TABLE 251 REST OF ASIA PACIFIC: THREAT HUNTING MARKET, BY SERVICE, 2024–2029 (USD MILLION)
- TABLE 252 REST OF ASIA PACIFIC: THREAT HUNTING MARKET, BY DEPLOYMENT MODE, 2018–2023 (USD MILLION)
- TABLE 253 REST OF ASIA PACIFIC: THREAT HUNTING MARKET, BY DEPLOYMENT MODE, 2024–2029 (USD MILLION)
- TABLE 254 REST OF ASIA PACIFIC: THREAT HUNTING MARKET, BY ORGANIZATION SIZE, 2018–2023 (USD MILLION)
- TABLE 255 REST OF ASIA PACIFIC: THREAT HUNTING MARKET, BY ORGANIZATION SIZE, 2024–2029 (USD MILLION)
- TABLE 256 REST OF ASIA PACIFIC: THREAT HUNTING MARKET, BY VERTICAL, 2018–2023 (USD MILLION)
- TABLE 257 REST OF ASIA PACIFIC: THREAT HUNTING MARKET, BY VERTICAL, 2024–2029 (USD MILLION)
- TABLE 258 MIDDLE EAST & AFRICA: THREAT HUNTING MARKET, BY OFFERING, 2018–2023 (USD MILLION)
- TABLE 259 MIDDLE EAST & AFRICA: THREAT HUNTING MARKET, BY OFFERING, 2024–2029 (USD MILLION)
- TABLE 260 MIDDLE EAST & AFRICA: THREAT HUNTING MARKET, BY TOOL, 2018–2023 (USD MILLION)
- TABLE 261 MIDDLE EAST & AFRICA: THREAT HUNTING MARKET, BY TOOL, 2024–2029 (USD MILLION)
- TABLE 262 MIDDLE EAST & AFRICA: THREAT HUNTING MARKET, BY SERVICE, 2018–2023 (USD MILLION)
- TABLE 263 MIDDLE EAST & AFRICA: THREAT HUNTING MARKET, BY SERVICE, 2024–2029 (USD MILLION)
- TABLE 264 MIDDLE EAST & AFRICA: THREAT HUNTING MARKET, BY DEPLOYMENT MODE, 2018–2023 (USD MILLION)
- TABLE 265 MIDDLE EAST & AFRICA: THREAT HUNTING MARKET, BY DEPLOYMENT MODE, 2024–2029 (USD MILLION)
- TABLE 266 MIDDLE EAST & AFRICA: THREAT HUNTING MARKET, BY ORGANIZATION SIZE, 2018–2023 (USD MILLION)
- TABLE 267 MIDDLE EAST & AFRICA: THREAT HUNTING MARKET, BY ORGANIZATION SIZE, 2024–2029 (USD MILLION)
- TABLE 268 MIDDLE EAST & AFRICA: THREAT HUNTING MARKET, BY VERTICAL, 2018–2023 (USD MILLION)
- TABLE 269 MIDDLE EAST & AFRICA: THREAT HUNTING MARKET, BY VERTICAL, 2024–2029 (USD MILLION)
- TABLE 270 MIDDLE EAST & AFRICA: THREAT HUNTING MARKET, BY COUNTRY, 2018–2023 (USD MILLION)
- TABLE 271 MIDDLE EAST & AFRICA: THREAT HUNTING MARKET, BY COUNTRY, 2024–2029 (USD MILLION)
- TABLE 272 GCC: THREAT HUNTING MARKET, BY OFFERING, 2018–2023 (USD MILLION)
- TABLE 273 GCC: THREAT HUNTING MARKET, BY OFFERING, 2024–2029 (USD MILLION)
- TABLE 274 GCC: THREAT HUNTING MARKET, BY TOOL, 2018–2023 (USD MILLION)
- TABLE 275 GCC: THREAT HUNTING MARKET, BY TOOL, 2024–2029 (USD MILLION)
- TABLE 276 GCC: THREAT HUNTING MARKET, BY SERVICE, 2018–2023 (USD MILLION)
- TABLE 277 GCC: THREAT HUNTING MARKET, BY SERVICE, 2024–2029 (USD MILLION)
- TABLE 278 GCC: THREAT HUNTING MARKET, BY DEPLOYMENT MODE, 2018–2023 (USD MILLION)
- TABLE 279 GCC: THREAT HUNTING MARKET, BY DEPLOYMENT MODE, 2024–2029 (USD MILLION)
- TABLE 280 GCC: THREAT HUNTING MARKET, BY ORGANIZATION SIZE, 2018–2023 (USD MILLION)
- TABLE 281 GCC: THREAT HUNTING MARKET, BY ORGANIZATION SIZE, 2024–2029 (USD MILLION)
- TABLE 282 GCC: THREAT HUNTING MARKET, BY VERTICAL, 2018–2023 (USD MILLION)
- TABLE 283 GCC: THREAT HUNTING MARKET, BY VERTICAL, 2024–2029 (USD MILLION)
- TABLE 284 GCC: THREAT HUNTING MARKET, BY COUNTRY, 2018–2023 (USD MILLION)
- TABLE 285 GCC: THREAT HUNTING MARKET, BY COUNTRY, 2024–2029 (USD MILLION)
- TABLE 286 KSA: THREAT HUNTING MARKET, BY OFFERING, 2018–2023 (USD MILLION)
- TABLE 287 KSA: THREAT HUNTING MARKET, BY OFFERING, 2024–2029 (USD MILLION)
- TABLE 288 KSA: THREAT HUNTING MARKET, BY TOOL, 2018–2023 (USD MILLION)
- TABLE 289 KSA: THREAT HUNTING MARKET, BY TOOL, 2024–2029 (USD MILLION)
- TABLE 290 KSA: THREAT HUNTING MARKET, BY SERVICE, 2018–2023 (USD MILLION)
- TABLE 291 KSA: THREAT HUNTING MARKET, BY SERVICE, 2024–2029 (USD MILLION)
- TABLE 292 KSA: THREAT HUNTING MARKET, BY DEPLOYMENT MODE, 2018–2023 (USD MILLION)
- TABLE 293 KSA: THREAT HUNTING MARKET, BY DEPLOYMENT MODE, 2024–2029 (USD MILLION)
- TABLE 294 KSA: THREAT HUNTING MARKET, BY ORGANIZATION SIZE, 2018–2023 (USD MILLION)
- TABLE 295 KSA: THREAT HUNTING MARKET, BY ORGANIZATION SIZE, 2024–2029 (USD MILLION)
- TABLE 296 KSA: THREAT HUNTING MARKET, BY VERTICAL, 2018–2023 (USD MILLION)
- TABLE 297 KSA: THREAT HUNTING MARKET, BY VERTICAL, 2024–2029 (USD MILLION)
- TABLE 298 UAE: THREAT HUNTING MARKET, BY OFFERING, 2018–2023 (USD MILLION)
- TABLE 299 UAE: THREAT HUNTING MARKET, BY OFFERING, 2024–2029 (USD MILLION)
- TABLE 300 UAE: THREAT HUNTING MARKET, BY TOOL, 2018–2023 (USD MILLION)
- TABLE 301 UAE: THREAT HUNTING MARKET, BY TOOL, 2024–2029 (USD MILLION)
- TABLE 302 UAE: THREAT HUNTING MARKET, BY SERVICE, 2018–2023 (USD MILLION)
- TABLE 303 UAE: THREAT HUNTING MARKET, BY SERVICE, 2024–2029 (USD MILLION)
- TABLE 304 UAE: THREAT HUNTING MARKET, BY DEPLOYMENT MODE, 2018–2023 (USD MILLION)
- TABLE 305 UAE: THREAT HUNTING MARKET, BY DEPLOYMENT MODE, 2024–2029 (USD MILLION)
- TABLE 306 UAE: THREAT HUNTING MARKET, BY ORGANIZATION SIZE, 2018–2023 (USD MILLION)
- TABLE 307 UAE: THREAT HUNTING MARKET, BY ORGANIZATION SIZE, 2024–2029 (USD MILLION)
- TABLE 308 UAE: THREAT HUNTING MARKET, BY VERTICAL, 2018–2023 (USD MILLION)
- TABLE 309 UAE: THREAT HUNTING MARKET, BY VERTICAL, 2024–2029 (USD MILLION)
- TABLE 310 SOUTH AFRICA: THREAT HUNTING MARKET, BY OFFERING, 2018–2023 (USD MILLION)
- TABLE 311 SOUTH AFRICA: THREAT HUNTING MARKET, BY OFFERING, 2024–2029 (USD MILLION)
- TABLE 312 SOUTH AFRICA: THREAT HUNTING MARKET, BY TOOL, 2018–2023 (USD MILLION)
- TABLE 313 SOUTH AFRICA: THREAT HUNTING MARKET, BY TOOL, 2024–2029 (USD MILLION)
- TABLE 314 SOUTH AFRICA: THREAT HUNTING MARKET, BY SERVICE, 2018–2023 (USD MILLION)
- TABLE 315 SOUTH AFRICA: THREAT HUNTING MARKET, BY SERVICE, 2024–2029 (USD MILLION)
- TABLE 316 SOUTH AFRICA: THREAT HUNTING MARKET, BY DEPLOYMENT MODE, 2018–2023 (USD MILLION)
- TABLE 317 SOUTH AFRICA: THREAT HUNTING MARKET, BY DEPLOYMENT MODE, 2024–2029 (USD MILLION)
- TABLE 318 SOUTH AFRICA: THREAT HUNTING MARKET, BY ORGANIZATION SIZE, 2018–2023 (USD MILLION)
- TABLE 319 SOUTH AFRICA: THREAT HUNTING MARKET, BY ORGANIZATION SIZE, 2024–2029 (USD MILLION)
- TABLE 320 SOUTH AFRICA: THREAT HUNTING MARKET, BY VERTICAL, 2018–2023 (USD MILLION)
- TABLE 321 SOUTH AFRICA: THREAT HUNTING MARKET, BY VERTICAL, 2024–2029 (USD MILLION)
- TABLE 322 REST OF MIDDLE EAST & AFRICA: THREAT HUNTING MARKET, BY OFFERING, 2018–2023 (USD MILLION)
- TABLE 323 REST OF MIDDLE EAST & AFRICA: THREAT HUNTING MARKET, BY OFFERING, 2024–2029 (USD MILLION)
- TABLE 324 REST OF MIDDLE EAST & AFRICA: THREAT HUNTING MARKET, BY TOOL, 2018–2023 (USD MILLION)
- TABLE 325 REST OF MIDDLE EAST & AFRICA: THREAT HUNTING MARKET, BY TOOL, 2024–2029 (USD MILLION)
- TABLE 326 REST OF MIDDLE EAST & AFRICA: THREAT HUNTING MARKET, BY SERVICE, 2018–2023 (USD MILLION)
- TABLE 327 REST OF MIDDLE EAST & AFRICA: THREAT HUNTING MARKET, BY SERVICE, 2024–2029 (USD MILLION)
- TABLE 328 REST OF MIDDLE EAST & AFRICA: THREAT HUNTING MARKET, BY DEPLOYMENT MODE, 2018–2023 (USD MILLION)
- TABLE 329 REST OF MIDDLE EAST & AFRICA: THREAT HUNTING MARKET, BY DEPLOYMENT MODE, 2024–2029 (USD MILLION)
- TABLE 330 REST OF MIDDLE EAST & AFRICA: THREAT HUNTING MARKET, BY ORGANIZATION SIZE, 2018–2023 (USD MILLION)
- TABLE 331 REST OF MIDDLE EAST & AFRICA: THREAT HUNTING MARKET, BY ORGANIZATION SIZE, 2024–2029 (USD MILLION)
- TABLE 332 REST OF MIDDLE EAST & AFRICA: THREAT HUNTING MARKET, BY VERTICAL, 2018–2023 (USD MILLION)
- TABLE 333 REST OF MIDDLE EAST & AFRICA: THREAT HUNTING MARKET, BY VERTICAL, 2024–2029 (USD MILLION)
- TABLE 334 LATIN AMERICA: THREAT HUNTING MARKET, BY OFFERING, 2018–2023 (USD MILLION)
- TABLE 335 LATIN AMERICA: THREAT HUNTING MARKET, BY OFFERING, 2024–2029 (USD MILLION)
- TABLE 336 LATIN AMERICA: THREAT HUNTING MARKET, BY TOOL, 2018–2023 (USD MILLION)
- TABLE 337 LATIN AMERICA: THREAT HUNTING MARKET, BY TOOL, 2024–2029 (USD MILLION)
- TABLE 338 LATIN AMERICA: THREAT HUNTING MARKET, BY SERVICE, 2018–2023 (USD MILLION)
- TABLE 339 LATIN AMERICA: THREAT HUNTING MARKET, BY SERVICE, 2024–2029 (USD MILLION)
- TABLE 340 LATIN AMERICA: THREAT HUNTING MARKET, BY DEPLOYMENT MODE, 2018–2023 (USD MILLION)
- TABLE 341 LATIN AMERICA: THREAT HUNTING MARKET, BY DEPLOYMENT MODE, 2024–2029 (USD MILLION)
- TABLE 342 LATIN AMERICA: THREAT HUNTING MARKET, BY ORGANIZATION SIZE, 2018–2023 (USD MILLION)
- TABLE 343 LATIN AMERICA: THREAT HUNTING MARKET, BY ORGANIZATION SIZE, 2024–2029 (USD MILLION)
- TABLE 344 LATIN AMERICA: THREAT HUNTING MARKET, BY VERTICAL, 2018–2023 (USD MILLION)
- TABLE 345 LATIN AMERICA: THREAT HUNTING MARKET, BY VERTICAL, 2024–2029 (USD MILLION)
- TABLE 346 LATIN AMERICA: THREAT HUNTING MARKET, BY COUNTRY, 2018–2023 (USD MILLION)
- TABLE 347 LATIN AMERICA: THREAT HUNTING MARKET, BY COUNTRY, 2024–2029 (USD MILLION)
- TABLE 348 BRAZIL: THREAT HUNTING MARKET, BY OFFERING, 2018–2023 (USD MILLION)
- TABLE 349 BRAZIL: THREAT HUNTING MARKET, BY OFFERING, 2024–2029 (USD MILLION)
- TABLE 350 BRAZIL: THREAT HUNTING MARKET, BY TOOL, 2018–2023 (USD MILLION)
- TABLE 351 BRAZIL: THREAT HUNTING MARKET, BY TOOL, 2024–2029 (USD MILLION)
- TABLE 352 BRAZIL: THREAT HUNTING MARKET, BY SERVICE, 2018–2023 (USD MILLION)
- TABLE 353 BRAZIL: THREAT HUNTING MARKET, BY SERVICE, 2024–2029 (USD MILLION)
- TABLE 354 BRAZIL: THREAT HUNTING MARKET, BY DEPLOYMENT MODE, 2018–2023 (USD MILLION)
- TABLE 355 BRAZIL: THREAT HUNTING MARKET, BY DEPLOYMENT MODE, 2024–2029 (USD MILLION)
- TABLE 356 BRAZIL: THREAT HUNTING MARKET, BY ORGANIZATION SIZE, 2018–2023 (USD MILLION)
- TABLE 357 BRAZIL: THREAT HUNTING MARKET, BY ORGANIZATION SIZE, 2024–2029 (USD MILLION)
- TABLE 358 BRAZIL: THREAT HUNTING MARKET, BY VERTICAL, 2018–2023 (USD MILLION)
- TABLE 359 BRAZIL: THREAT HUNTING MARKET, BY VERTICAL, 2024–2029 (USD MILLION)
- TABLE 360 MEXICO: THREAT HUNTING MARKET, BY OFFERING, 2018–2023 (USD MILLION)
- TABLE 361 MEXICO: THREAT HUNTING MARKET, BY OFFERING, 2024–2029 (USD MILLION)
- TABLE 362 MEXICO: THREAT HUNTING MARKET, BY TOOL, 2018–2023 (USD MILLION)
- TABLE 363 MEXICO: THREAT HUNTING MARKET, BY TOOL, 2024–2029 (USD MILLION)
- TABLE 364 MEXICO: THREAT HUNTING MARKET, BY SERVICE, 2018–2023 (USD MILLION)
- TABLE 365 MEXICO: THREAT HUNTING MARKET, BY SERVICE, 2024–2029 (USD MILLION)
- TABLE 366 MEXICO: THREAT HUNTING MARKET, BY DEPLOYMENT MODE, 2018–2023 (USD MILLION)
- TABLE 367 MEXICO: THREAT HUNTING MARKET, BY DEPLOYMENT MODE, 2024–2029 (USD MILLION)
- TABLE 368 MEXICO: THREAT HUNTING MARKET, BY ORGANIZATION SIZE, 2018–2023 (USD MILLION)
- TABLE 369 MEXICO: THREAT HUNTING MARKET, BY ORGANIZATION SIZE, 2024–2029 (USD MILLION)
- TABLE 370 MEXICO: THREAT HUNTING MARKET, BY VERTICAL, 2018–2023 (USD MILLION)
- TABLE 371 REST OF LATIN AMERICA: THREAT HUNTING MARKET, BY OFFERING, 2018–2023 (USD MILLION)
- TABLE 372 REST OF LATIN AMERICA: THREAT HUNTING MARKET, BY OFFERING, 2024–2029 (USD MILLION)
- TABLE 373 REST OF LATIN AMERICA: THREAT HUNTING MARKET, BY TOOL, 2018–2023 (USD MILLION)
- TABLE 374 REST OF LATIN AMERICA: THREAT HUNTING MARKET, BY TOOL, 2024–2029 (USD MILLION)
- TABLE 375 REST OF LATIN AMERICA: THREAT HUNTING MARKET, BY SERVICE, 2018–2023 (USD MILLION)
- TABLE 376 REST OF LATIN AMERICA: THREAT HUNTING MARKET, BY SERVICE, 2024–2029 (USD MILLION)
- TABLE 377 REST OF LATIN AMERICA: THREAT HUNTING MARKET, BY DEPLOYMENT MODE, 2018–2023 (USD MILLION)
- TABLE 378 REST OF LATIN AMERICA: THREAT HUNTING MARKET, BY DEPLOYMENT MODE, 2024–2029 (USD MILLION)
- TABLE 379 REST OF LATIN AMERICA: THREAT HUNTING MARKET, BY ORGANIZATION SIZE, 2018–2023 (USD MILLION)
- TABLE 380 REST OF LATIN AMERICA: THREAT HUNTING MARKET, BY ORGANIZATION SIZE, 2024–2029 (USD MILLION)
- TABLE 381 REST OF LATIN AMERICA: THREAT HUNTING MARKET, BY VERTICAL, 2018–2023 (USD MILLION)
- TABLE 382 REST OF LATIN AMERICA: THREAT HUNTING MARKET, BY VERTICAL, 2024–2029 (USD MILLION)
- TABLE 383 OVERVIEW OF STRATEGIES ADOPTED BY KEY THREAT-HUNTING VENDORS
- TABLE 384 THREAT HUNTING MARKET: DEGREE OF COMPETITION
- TABLE 385 THREAT HUNTING MARKET: REGIONAL FOOTPRINT
- TABLE 386 THREAT HUNTING MARKET: SOLUTION FOOTPRINT
- TABLE 387 THREAT HUNTING MARKET: VERTICAL FOOTPRINT
- TABLE 388 THREAT HUNTING MARKET: KEY STARTUPS/SMES
- TABLE 389 THREAT HUNTING MARKET: COMPETITIVE BENCHMARKING OF KEY STARTUPS/ SMES, BY SOLUTION
- TABLE 390 THREAT HUNTING MARKET: COMPETITIVE BENCHMARKING OF KEY STARTUPS/ SMES, BY VERTICAL
- TABLE 391 THREAT HUNTING MARKET: COMPETITIVE BENCHMARKING OF KEY STARTUPS/ SMES, BY REGION
- TABLE 392 THREAT HUNTING MARKET: PRODUCT LAUNCHES, 2022–2024
- TABLE 393 THREAT HUNTING MARKET: DEALS, 2022–2024
- TABLE 394 PALO ALTO NETWORKS: BUSINESS OVERVIEW
- TABLE 395 PALO ALTO NETWORKS: PRODUCTS/SOLUTIONS/SERVICES OFFERED
- TABLE 396 PALO ALTO NETWORKS: PRODUCT LAUNCHES
- TABLE 397 PALO ALTO NETWORKS: DEALS
- TABLE 398 CROWDSTRIKE: BUSINESS OVERVIEW
- TABLE 399 CROWDSTRIKE: PRODUCTS/SOLUTIONS/SERVICES OFFERED
- TABLE 400 CROWDSTRIKE: PRODUCT LAUNCHES
- TABLE 401 CROWDSTRIKE: DEALS
- TABLE 402 RAPID7: BUSINESS OVERVIEW
- TABLE 403 RAPID7: PRODUCTS/SOLUTIONS/SERVICES OFFERED
- TABLE 404 RAPID7: PRODUCT LAUNCHES & ENHANCEMENTS
- TABLE 405 RAPID7: DEALS
- TABLE 406 VMWARE: BUSINESS OVERVIEW
- TABLE 407 VMWARE: PRODUCTS/SOLUTIONS/SERVICES OFFERED
- TABLE 408 VMWARE: PRODUCT LAUNCHES
- TABLE 409 VMWARE: DEALS
- TABLE 410 IBM: BUSINESS OVERVIEW
- TABLE 411 IBM: PRODUCTS/SOLUTIONS/SERVICES OFFERED
- TABLE 412 IBM: PRODUCT LAUNCHES
- TABLE 413 IBM: DEALS
- TABLE 414 TREND MICRO: BUSINESS OVERVIEW
- TABLE 415 TREND MICRO: PRODUCTS/SOLUTIONS/SERVICES OFFERED
- TABLE 416 TREND MICRO: DEALS
- TABLE 417 CAPGEMINI: BUSINESS OVERVIEW
- TABLE 418 CAPGEMINI: PRODUCTS/SOLUTIONS/SERVICES OFFERED
- TABLE 419 CAPGEMINI: DEALS
- TABLE 420 KASPERSKY: BUSINESS OVERVIEW
- TABLE 421 KASPERSKY: PRODUCTS/SOLUTIONS/SERVICES OFFERED
- TABLE 422 KASPERSKY: PRODUCT LAUNCHES
- TABLE 423 VERIZON: BUSINESS OVERVIEW
- TABLE 424 VERIZON: PRODUCTS/SOLUTIONS/SERVICES OFFERED
- TABLE 425 SECUREWORKS: BUSINESS OVERVIEW
- TABLE 426 SECUREWORKS: PRODUCTS/SOLUTIONS/SERVICES OFFERED
- TABLE 427 SECUREWORKS: PRODUCT LAUNCHES
- TABLE 428 SECUREWORKS: DEALS
- TABLE 429 SANGFOR: BUSINESS OVERVIEW
- TABLE 430 SANGFOR: PRODUCTS/SOLUTIONS/SERVICES OFFERED
- TABLE 431 SANGFOR: PRODUCT LAUNCHES
- TABLE 432 SANGFOR: DEALS
- TABLE 433 EVIDEN: BUSINESS OVERVIEW
- TABLE 434 EVIDEN: PRODUCTS/SOLUTIONS/SERVICES OFFERED
- TABLE 435 EVIDEN: PRODUCT LAUNCHES
- TABLE 436 EVIDEN: DEALS
- TABLE 437 SOLARWINDS: BUSINESS OVERVIEW
- TABLE 438 SOLARWINDS: PRODUCTS/SOLUTIONS/SERVICES OFFERED
- TABLE 439 CYNET: BUSINESS OVERVIEW
- TABLE 440 CYNET: PRODUCTS/SOLUTIONS/SERVICES OFFERED
- TABLE 441 CYNET: PRODUCT LAUNCHES
- TABLE 442 CYNET: DEALS
- TABLE 443 ADJACENT MARKETS AND FORECASTS
- TABLE 444 SECURITY AND VULNERABILITY MANAGEMENT MARKET, BY COMPONENT, 2016–2020 (USD MILLION)
- TABLE 445 SECURITY AND VULNERABILITY MANAGEMENT MARKET, BY COMPONENT, 2021–2026 (USD MILLION)
- TABLE 446 SECURITY AND VULNERABILITY MANAGEMENT MARKET, BY TARGET, 2016–2020 (USD MILLION)
- TABLE 447 SECURITY AND VULNERABILITY MANAGEMENT MARKET, BY TARGET, 2021–2026 (USD MILLION)
- TABLE 448 SECURITY AND VULNERABILITY MANAGEMENT MARKET, BY DEPLOYMENT MODE, 2016–2020 (USD MILLION)
- TABLE 449 SECURITY AND VULNERABILITY MANAGEMENT MARKET, BY DEPLOYMENT MODE, 2021–2026 (USD MILLION)
- TABLE 450 SECURITY AND VULNERABILITY MANAGEMENT MARKET, BY ORGANIZATION SIZE, 2016–2020 (USD MILLION)
- TABLE 451 SECURITY AND VULNERABILITY MANAGEMENT MARKET, BY ORGANIZATION SIZE, 2021–2026 (USD MILLION)
- TABLE 452 SECURITY AND VULNERABILITY MANAGEMENT MARKET, BY VERTICAL, 2016–2020 (USD MILLION)
- TABLE 453 SECURITY AND VULNERABILITY MANAGEMENT MARKET, BY VERTICAL, 2021–2026 (USD MILLION)
- TABLE 454 SECURITY AND VULNERABILITY MANAGEMENT MARKET, BY REGION, 2016–2020 (USD MILLION)
- TABLE 455 SECURITY AND VULNERABILITY MANAGEMENT MARKET, BY REGION, 2021–2026 (USD MILLION)
- TABLE 456 SECURITY INFORMATION AND EVENT MANAGEMENT MARKET, BY COMPONENT, 2018–2025 (USD MILLION)
- TABLE 457 SECURITY INFORMATION AND EVENT MANAGEMENT MARKET, BY APPLICATION, 2018–2025 (USD MILLION)
- TABLE 458 SECURITY INFORMATION AND EVENT MANAGEMENT MARKET, BY DEPLOYMENT MODE, 2018–2025 (USD MILLION)
- TABLE 459 SECURITY INFORMATION AND EVENT MANAGEMENT MARKET, BY ORGANIZATION SIZE, 2018–2025 (USD MILLION)
- TABLE 460 SECURITY INFORMATION AND EVENT MANAGEMENT MARKET, BY VERTICAL, 2018–2025 (USD MILLION)
- TABLE 461 SECURITY INFORMATION AND EVENT MANAGEMENT MARKET, BY REGION, 2018–2025 (USD MILLION)
- FIGURE 1 THREAT HUNTING MARKET: RESEARCH DESIGN
- FIGURE 2 BREAKDOWN OF PRIMARY INTERVIEWS, BY COMPANY TYPE, DESIGNATION, AND REGION
- FIGURE 3 THREAT HUNTING MARKET: DATA TRIANGULATION
- FIGURE 4 THREAT HUNTING MARKET ESTIMATION: RESEARCH FLOW
- FIGURE 5 APPROACH 1 (SUPPLY SIDE): REVENUE FROM SOLUTIONS AND SERVICES OF THREAT-HUNTING VENDORS
- FIGURE 6 THREAT HUNTING MARKET: APPROACH 1 (SUPPLY-SIDE) ANALYSIS
- FIGURE 7 THREAT HUNTING MARKET: APPROACH 2 – BOTTOM-UP (DEMAND SIDE)
- FIGURE 8 THREAT HUNTING MARKET TO WITNESS GROWTH DURING FORECAST PERIOD
- FIGURE 9 THREAT HUNTING MARKET: MAJOR SUBSEGMENTS
- FIGURE 10 THREAT HUNTING MARKET: REGIONAL SNAPSHOT
- FIGURE 11 EVOLVING THREAT LANDSCAPE AND SOPHISTICATED CYBERATTACKS TO DRIVE THREAT HUNTING MARKET
- FIGURE 12 SERVICES SEGMENT TO GROW AT HIGHEST CAGR DURING FORECAST PERIOD
- FIGURE 13 EDR SEGMENT TO LEAD MARKET DURING FORECAST PERIOD
- FIGURE 14 MANAGED SERVICES TO ACCOUNT FOR LARGER MARKET DURING FORECAST PERIOD
- FIGURE 15 SMES SEGMENT TO GROW AT HIGHER CAGR DURING FORECAST PERIOD
- FIGURE 16 CLOUD SEGMENT TO ACCOUNT FOR LARGER MARKET DURING FORECAST PERIOD
- FIGURE 17 BFSI SEGMENT TO ACCOUNT FOR LARGEST MARKET DURING FORECAST PERIOD
- FIGURE 18 NORTH AMERICA TO ACCOUNT FOR LARGEST MARKET DURING FORECAST PERIOD
- FIGURE 19 ASIA PACIFIC TO EMERGE AS LUCRATIVE MARKET FOR INVESTMENTS IN NEXT FIVE YEARS
- FIGURE 20 THREAT HUNTING MARKET: DRIVERS, RESTRAINTS, OPPORTUNITIES, AND CHALLENGES
- FIGURE 21 THREAT HUNTING MARKET: VALUE CHAIN ANALYSIS
- FIGURE 22 KEY PLAYERS IN THREAT HUNTING MARKET ECOSYSTEM
- FIGURE 23 THREAT HUNTING MARKET: PORTER’S FIVE FORCES ANALYSIS
- FIGURE 24 INFLUENCE OF STAKEHOLDERS ON BUYING PROCESS
- FIGURE 25 KEY BUYING CRITERIA FOR TOP THREE VERTICALS
- FIGURE 26 INDICATIVE PRICING TREND OF KEY VENDORS, BY OFFERING
- FIGURE 27 THREAT HUNTING MARKET: PATENT ANALYSIS, 2013–2023
- FIGURE 28 REGIONAL ANALYSIS OF PATENTS GRANTED, 2013–2023
- FIGURE 29 THREAT HUNTING MARKET: TRENDS/DISRUPTIONS IMPACTING CUSTOMERS’ BUSINESSES
- FIGURE 30 LEADING GLOBAL THREAT-HUNTING STARTUPS/SMES, BY NUMBER OF INVESTORS AND FUNDING ROUNDS
- FIGURE 31 SERVICES SEGMENT TO LEAD MARKET DURING FORECAST PERIOD
- FIGURE 32 EDR SEGMENT TO LEAD MARKET DURING FORECAST PERIOD
- FIGURE 33 MANAGED SERVICES SEGMENT TO LEAD MARKET DURING FORECAST PERIOD
- FIGURE 34 SMES SEGMENT TO GROW AT HIGHEST CAGR DURING FORECAST PERIOD
- FIGURE 35 CLOUD SEGMENT TO LEAD MARKET DURING FORECAST PERIOD
- FIGURE 36 BFSI TO ACCOUNT FOR LARGEST MARKET DURING FORECAST PERIOD
- FIGURE 37 ASIA PACIFIC TO GROW AT HIGHEST RATE DURING FORECAST PERIOD
- FIGURE 38 NORTH AMERICA: MARKET SNAPSHOT
- FIGURE 39 ASIA PACIFIC: MARKET SNAPSHOT
- FIGURE 40 REVENUE ANALYSIS OF KEY MARKET PLAYERS, 2019–2023 (USD MILLION)
- FIGURE 41 SHARE OF LEADING COMPANIES IN THREAT HUNTING MARKET, 2023
- FIGURE 42 THREAT HUNTING MARKET: COMPARISON OF VENDORS’ BRANDS
- FIGURE 43 COMPANY VALUATION OF KEY VENDORS (USD BILLION)
- FIGURE 44 EV/EBIDTA, 2024
- FIGURE 45 THREAT HUNTING MARKET: COMPANY EVALUATION MATRIX (KEY PLAYERS), 2023
- FIGURE 46 THREAT HUNTING MARKET: COMPANY FOOTPRINT
- FIGURE 47 THREAT HUNTING MARKET: COMPANY EVALUATION MATRIX (STARTUPS/SMES), 2023
- FIGURE 48 PALO ALTO NETWORKS: COMPANY SNAPSHOT
- FIGURE 49 CROWDSTRIKE: COMPANY SNAPSHOT
- FIGURE 50 RAPID7: COMPANY SNAPSHOT
- FIGURE 51 VMWARE: COMPANY SNAPSHOT
- FIGURE 52 IBM: COMPANY SNAPSHOT
- FIGURE 53 TREND MICRO: COMPANY SNAPSHOT
- FIGURE 54 CAPGEMINI: COMPANY SNAPSHOT
- FIGURE 55 VERIZON: COMPANY SNAPSHOT
- FIGURE 56 SECUREWORKS: COMPANY SNAPSHOT
- FIGURE 57 SOLARWINDS: COMPANY SNAPSHOT
The research encompassed various vital activities to determine the current market size of the threat-hunting market. Extensive secondary research was conducted to gather information on the industry. Subsequently, primary research involving industry experts across the value chain validated these findings, assumptions, and estimations. The total market size was estimated using different methodologies, including top-down and bottom-up approaches. Following this, market segmentation and data triangulation techniques were applied to ascertain the market size of individual segments and subsegments within the Threat hunting market.
Secondary Research
During the secondary research phase, various sources were consulted to identify and gather pertinent information for the study. These secondary sources encompassed annual reports, press releases, investor presentations from Threat hunting software and service vendors, online forums, accredited publications, and white papers. This secondary research served as a foundation for acquiring crucial insights into the industry's supply chain, key players, market categorization, segmentation based on prevailing trends down to granular levels, regional markets, and noteworthy developments from both market and technological perspectives. These findings were subsequently corroborated and validated through primary sources. Factors considered in estimating regional market sizes included governmental and technological initiatives, Gross Domestic Product (GDP) growth rates, Information and Communication Technology (ICT) expenditure, recent market developments, and a comprehensive analysis of significant Operational Technology Security solution providers' market standings.
Primary Research
The comprehensive market engineering process employed a combination of top-down and bottom-up approaches, complemented by various data triangulation methods, to accurately estimate and forecast market trends for overall market segments and subsegments outlined in the report. The report systematically compiled and presented vital insights and information through meticulous qualitative and quantitative analyses conducted throughout the market engineering process.
After completing the market engineering process, which encompassed calculations for market statistics, segmentation breakdowns, market size estimations, forecasts, and data triangulation, thorough primary research was undertaken. This primary research gathered, verified, and validated critical numerical data and identified segmentation types, industry trends, and the competitive landscape within the Threat hunting market. Moreover, primary research was instrumental in elucidating fundamental market dynamics, including drivers, restraints, opportunities, challenges, industry trends, and strategic initiatives market players adopt.
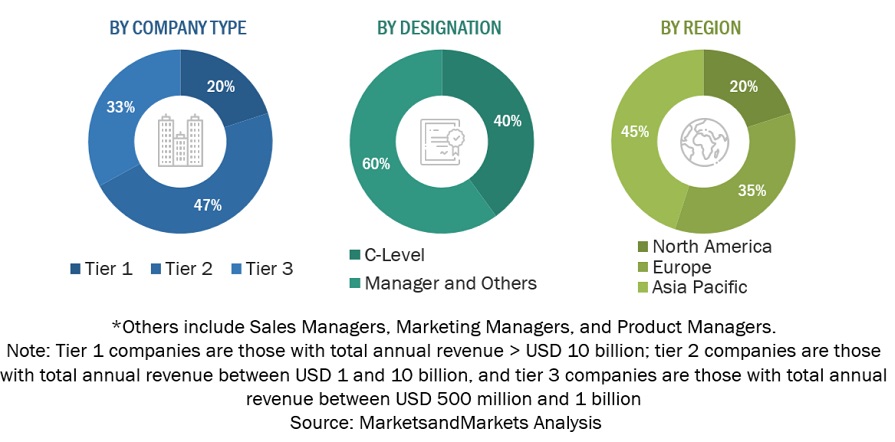
Following is the breakup of the primary study:
To know about the assumptions considered for the study, download the pdf brochure
Market Size Estimation
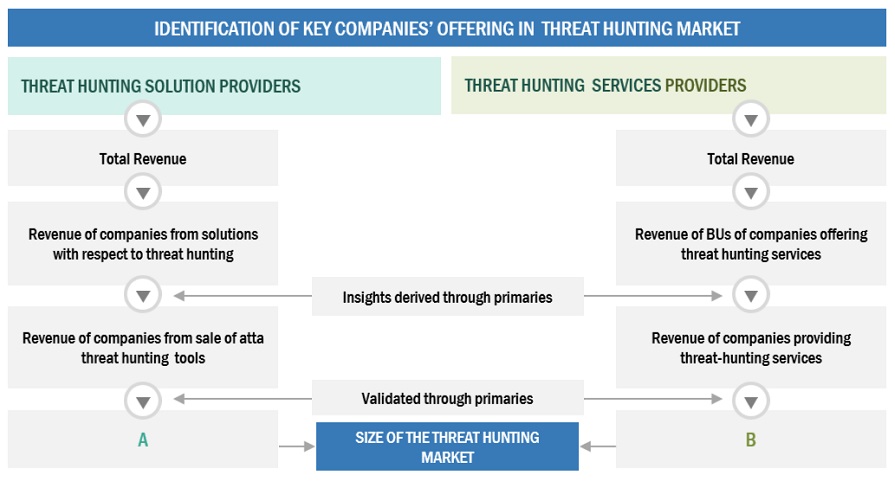
Both top-down and bottom-up approaches were employed to accurately estimate and validate the size of the global Threat hunting market and determine the sizes of various dependent subsegments within the overarching Threat hunting market. The research methodology utilized for estimating market size involved several key steps: Initially, the identification of key players in the market was conducted through comprehensive secondary research. Subsequently, their revenue contributions within respective regions were assessed through a combination of primary and secondary research methods. This process entailed thoroughly examining leading market players' annual and financial reports, supplemented by extensive interviews with industry leaders, including CEOs, VPs, directors, and marketing executives, to gain valuable insights. All percentage splits and segment breakdowns were derived from secondary sources and cross-validated through primary sources to ensure accuracy and reliability.
To know about the assumptions considered for the study, Request for Free Sample Report
Infographic Depicting Bottom-Up And Top-Down Approaches
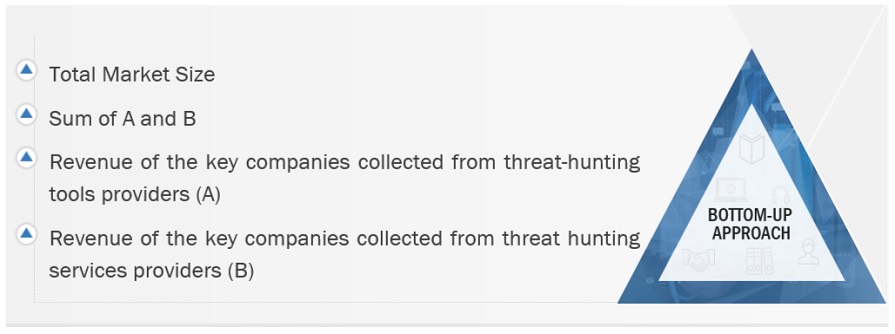
Market Size Estimation Methodology-top-down approach
Data Triangulation
Following the determination of the overall market size using the market above size estimation methodologies, the market was segmented into distinct segments and subsegments. Data triangulation and market segmentation procedures were utilized, as needed, to complete the comprehensive market engineering process and ascertain the precise statistics for each market segment and subsegment. Data triangulation was achieved by analyzing various factors and trends from both the demand and supply sides.
Market Definition
As per IBM, Threat hunting, also known as cyber threat hunting, is a proactive approach to identifying previously unknown or ongoing non-remediated threats within an organization's network.
Cyber or proactive threat hunting seeks out unknown cybersecurity threats to a network. Threat hunting involves searching through endpoints, networks, systems, applications, sources, and datasets to hunt or identify malicious or suspicious activity.
Key Stakeholders
- Chief technology and data officers
- Certified information system auditors
- Business analysts
- Information technology (IT) professionals
- Government agencies
- Small and medium-sized enterprises (SMEs) and large enterprises
- Consultants/consultancies/advisory firms
- Managed and professional service providers
Report Objectives
- To define, describe, and forecast the Threat hunting market based on offering, threat type, organization size, deployment mode, vertical, and region.
- To forecast the market size of five central regions: North America, Europe, Asia Pacific (APAC), Middle East & Africa (MEA), and Latin America.
- To analyze the subsegments of the market concerning individual growth trends, prospects, and contributions to the overall market.
- To provide detailed information related to the primary factors (drivers, restraints, opportunities, and challenges) influencing the growth of Threat hunting market.
- To analyze opportunities in the market for stakeholders by identifying high-growth segments of the Threat hunting market.
- To profile the key players of the Threat hunting market and comprehensively analyze their market size and core competencies.
- Track and analyze competitive developments, such as new product launches, mergers and acquisitions, partnerships, agreements, and collaborations in the global Threat hunting market.
Customization Options
With the given market data, MarketsandMarkets offers customizations based on company-specific needs. The following customization options are available for the report:
Geographic Analysis
- Further breakup of the Asia Pacific market into major countries.
- Further breakup of the North American market into major countries.
- Further breakup of the Latin American market into major countries.
- Further breakup of the Middle East African market into major countries
- Further breakup of the European market into major countries.
Company Information
- Detailed analysis and profiling of additional market players (up to 5)
Growth opportunities and latent adjacency in Threat Hunting Market