Visual Cloud Market Size, Share, Growth Opportunities & Latest Trends

Report Code TC 9054
Published in Jun, 2024, By MarketsandMarkets™
Download PDF

Choose License Type

Buy Report Now Inquire Before Buying

Visual Cloud Market by Solutions (Video Processing, AR/VR Solutions, Cloud Gaming, Enterprise Video), Service Model (IaaS, PaaS, SaaS), Service (Professional Services and Managed Services) - Global Industry Forecast to 2029

Visual Cloud Market Overview

The global Visual Cloud Market was reached $126.02 billion in 2024 and is projected to reach  $237.26 billion by 2029 at a robust CAGR of 13.5% during the forecast period.

The visual cloud market has grown rapidly as more people demand high-quality content and use immersive technologies like AR and VR. Organizations are leveraging visual cloud solutions to enhance user engagement, reduce latency, and improve overall performance. The leading Visual Cloud solution providers such as  Microsoft, AWS, Google Cloud, and IBM are rapidly scaling their visual cloud offerings, focusing on delivering advanced visual computing capabilities such as rendering, simulation, and artificial intelligence services. For instance, in June 2024, Google Ventures invested about USD 11.14 million in Distance Technologies for its glasses-free mixed reality tech, aimed at the automotive, aerospace, and defense industries. Using visual cloud solutions, these simulations become more realistic and interactive by reducing lag and improving real-time rendering.

Attractive Opportunities in the Visual Cloud Market

Asia Pacific

Asia Pacific is projected to grow at the highest CAGR during the forecast period.

The growth of the market can be attributed to the growing demand for video services across the media & entertainment, education, and healthcare & life sciences verticals.

Acquisitions and new product launches with the incorporation of regulations compliance management would offer lucrative opportunities for market players in the coming years.

The shift toward virtual events and conferences presents opportunities for enterprise video providers to offer comprehensive solutions for hosting virtual events, webinars, and online training sessions, that contributes towards visual cloud market growth.

The globalization of businesses and the need for efficient communication across geographically dispersed teams are driving the adoption of visual cloud solutions to enable seamless collaboration and knowledge sharing.

Impact of Generative AI on the Visual Cloud Market

Visual Cloud Market Impact

Global Visual Cloud Market Dynamics

Driver: Increase in demand for video content across industries

The increasing demand for video content across various industries is a primary driver for the growth of the visual cloud market. Several factors fuel this surge, including the proliferation of high-speed internet, the widespread adoption of smartphones, and the rising popularity of streaming services. Entertainment, education, healthcare, and marketing businesses leverage video to enhance engagement, deliver educational content, provide remote consultations, and promote products. High-quality video content requires substantial computational power and storage, which cloud-based solutions efficiently provide. The visual cloud offers scalable resources, ensuring that companies can deliver seamless video experiences without the need for significant on-premises infrastructure. Moreover, advancements in technologies such as AI and ML amplify video content's value. AI-driven analytics can process vast amounts of video data to extract actionable insights, enhance personalization, and improve content delivery.

Restraint: Lack of compatibility across devices

The proliferation of different types of devices, including smartphones, tablets, laptops, and smart TVs, each with distinct operating systems and hardware configurations, creates substantial challenges. Ensuring that video content is compatible and performs optimally across all these platforms requires extensive testing and adaptation. Inconsistent user experiences, such as varied video quality and playback issues, can occur when content is not uniformly compatible, leading to customer dissatisfaction and hindering the widespread adoption of visual cloud solutions.Furthermore, the rapid pace of technological advancement means new devices with unique specifications are continually entering the market. Keeping up with these changes necessitates ongoing updates and modifications to cloud-based video delivery systems, which can be resource-intensive and costly. Additionally, different devices may support varying video formats and codecs, further complicating the compatibility landscape. This fragmentation not only affects the end-user experience but also increases the complexity for businesses looking to implement uniform video solutions across multiple platforms. Consequently, the need for device compatibility remains a formidable barrier, impacting the efficiency and reach of the visual cloud market.


Opportunity: Growing adoption of edge computing infrastructure for real-time data processing

The growing adoption of edge computing infrastructure presents significant opportunities for the visual cloud market, particularly in real-time data processing. Edge computing allows data to be processed closer to the source, reducing latency and enhancing the speed and efficiency of video content delivery. This is crucial for applications requiring immediate data analysis and response, such as live streaming, interactive gaming, and AR experiences. By leveraging edge computing, businesses can ensure smoother and more responsive video interactions, improving user experience and enabling innovative services that rely on real-time data.Additionally, edge computing supports the handling of massive volumes of video data generated by IoT devices, such as surveillance cameras and smart sensors. Processing this data locally at the edge reduces the burden on central cloud servers and minimizes bandwidth usage, leading to cost savings and improved scalability. This capability is particularly beneficial for security, retail, and healthcare industries, where timely video data analysis is critical. The integration of edge computing with the visual cloud can also enhance data privacy and security by limiting the transfer of sensitive information over long distances. As edge computing infrastructure expands, it opens up new possibilities for the visual cloud market, driving innovation and efficiency in real-time video processing applications.

Challenge: Lack of relevant technical skillset and expertise

The visual cloud market faces significant challenges due to a need for more relevant technical skills and expertise. Developing, managing, and optimizing cloud-based video solutions requires specialized knowledge in cloud infrastructure, video compression, data analytics, and cybersecurity. However, there is a notable skills gap in the workforce, with many organizations needing help finding professionals with the necessary technical expertise. This shortage can lead to inefficiencies, security vulnerabilities, and suboptimal performance of visual cloud services.

Global Visual Cloud Market Ecosystem Analysis

The visual cloud market, encompassing video processing platforms, video conferencing and webcasting, video hosting and streaming, cloud infrastructure, CDN providers, and video analytics and security, is rapidly evolving with increasing demand for high-quality, scalable, and secure video services. Major players in video processing platforms include Adobe, AWS Elemental, and Google, offering tools for video editing, encoding, and transcoding. Platforms such as Zoom, Microsoft Teams, and Cisco Webex have driven significant growth in video conferencing and webcasting. They cater to both enterprise and consumer needs with robust, real-time communication capabilities.


Based on the solutions, the media processing & delivery segment is expected to have the highest CAGR growth rate during the forecast period.

Media processing and delivery is evolving the way viewers are consuming and experiencing the video content. As more people want videos in high quality such as 4K, HDR, and 360-degree experiences, businesses are using cloud technology for storing, analyzing, and sharing visual content.

Editing, mixing, and converting videos to various formats and resolutions while maintaining high quality are key aspects of media processing. Cloud technology makes this process faster and more affordable than traditional methods.

Content delivery supports fast and reliable media access for users. CDNs enable efficient global video distribution with minimal delay. AI and machine learning enhance media processing by enabling automated content recognition, targeted advertising, and personalized recommendations while optimizing network performance.

Cloud-based solutions enable faster processes, improved collaboration, and tailored content with minimum delays. Edge computing accelerates performance through bringing content closer to consumers, lowering lag and bandwidth use. The rise of 5G networks further increases this space by enabling ultra-fast data speeds and low latency, making media consumption smoother and more immersive. This shift is driving innovation and investment in the growing visual cloud market.

Based on the service model, SaaS will dominate the market during the forecast period.

SaaS in the visual cloud market encompasses applications that are hosted and managed by a third-party service provider and delivered to clients over the Internet. With regard to the concept of the visual cloud market, SaaS solutions concern a diverse array of applications that can be designed to meet the requirements for processing, storing, and transmitting visual data. Some of the applications that can be categorized under video and content management tools include video editing and production software, content management systems, media asset management, and video analytics. In the context of the visual cloud market, SaaS solutions provide the capabilities that help organizations improve the flow of work, facilitate communication, and optimize content delivery without owning and maintaining on-premises infrastructure or having deep technical knowledge. Organizations can leverage the latest visual cloud technologies through SaaS, eliminating the need for substantial capital investments in IT infrastructure and benefiting from continual updates from the service provider.

The US market is expected to hold the largest share of North America's visual cloud market.

The US accounted for the largest market share in North America in 2024. The market is constantly growing, with major players such as AWS, Microsoft, IBM, Cisco, and Google Cloud leading.

Visual Cloud is in higher demand because of the surge in Over-The-Top (OTT) platforms, driven by the internet revolution and demand increased further during the COVID-19 pandemic, which has substantially boosted the visual cloud market. For instance, in 2024, according to World Population Review, there were 66.7 million Netflix subscribers, with a subscription rate of 19,309.43%. In January 2025, Yaguara.co published an article, Amazon Prime Statistics 2025 (Subscribers & Revenue), which shows that there are 180.1 million Amazon Prime users in the US. OTT platforms heavily rely on visual cloud for processing, storing, and delivering content. Visual cloud helps OTT services stream high-quality videos with minimal delay by using cloud technology to process, convert, and deliver content smoothly.

The US has a strong market for visual cloud, driven by the rise of immersive media. For example, in February 2025, Meta spent over USD 100 billion on AR/VR, helping grow smart glasses sales in the US. It’s also expanding AI and computing to replace smartphones and rely less on Apple and Google. Last year, it spent nearly USD 20 billion on Reality Labs. Immersive media requires visual cloud for real-time rendering, seamless streaming, and AI-driven interactivity, enabling high-quality AR/VR experiences that enhance user engagement and scalability across devices.


Recent Developments of Visual Cloud industry

  • In May 2024, RingCentral, a leading provider of AI-driven cloud business communications, contact center, video, and hybrid event solutions, and Avaya, a global leader in customer experience and communications solutions, announced an expansion of offerings for Avaya customers, including a new hybrid solution of RingCentral’s AI-powered cloud business communications solution with Avaya Aura telephony, providing enhanced collaboration capabilities.
  • In April 2024, AWS announced AWS Elemental MediaTailor, which supports HLS Interstitials for video-on-demand (VOD) streams, offering an optional feature that automatically adjusts manifests to separate ad break pods from the main content stream. This separation enhances ad payload delivery efficiency, resulting in quicker video start-up times than traditional Server-Side Ad Insertion. Additionally, it reduces buffering and errors during ad breaks, providing a smoother experience than Client-Side Ad Insertion.

Key Market Players

Key Players in the Visual Cloud Market Include

Scope of the Report

Report Attribute Details
Market size available for years 2019–2029
Base year considered 2023
Forecast period 2024–2029
Forecast units Value (USD Million/Billion)
Segments Covered Offering, Organization Size, Service Model, Deployment Mode, and Vertical
Geographies Covered North America, Europe, Asia Pacific, Middle East Africa, and Latin America
Companies Covered Some of the significant visual cloud market vendors are Microsoft (US), Google (US), IBM (US), AWS (US), Oracle (US), Zoom (US), Alibaba Cloud (China), Avaya (US), Cisco (US), and Poly (US)


Key Questions Addressed by the Report

What is visual cloud?
Visual cloud refers to cloud-based services and solutions that process, analyze, and deliver visual data, such as images and videos. It leverages advanced technologies such as cloud computing, AI, and video analytics to provide scalable, real-time processing and streaming capabilities for applications in various industries.
Which country was the early adopter of the visual cloud?
The US was at the initial stage of adopting a visual cloud.
Which are the key vendors exploring visual cloud?
Some of the significant vendors offering visual cloud worldwide include Microsoft (US), Google (US), IBM (US), AWS (US), Oracle (US), Zoom (US), Alibaba Cloud (China), Avaya (US), Cisco (US), and Poly (US).
What is the total CAGR recorded for the visual cloud market from 2024 to 2029?
The visual cloud market will record a CAGR of 13.5% from 2024 to 2029.
Who are vital clients adopting the visual cloud market?
Key clients adopting the visual cloud market include: -
  • Training and consulting service providers
  • Information Technology (IT) infrastructure providersVisual cloud solutions providers
  • Visual cloud service providers
  • Government organizations and standardization bodies
  • Regional associations
  • Value-added resellers and distributors


Personalize This Research

  • Triangulate with your Own Data
  • Get Data as per your Format and Definition
  • Gain a Deeper Dive on a Specific Application, Geography, Customer or Competitor
  • Any level of Personalization
Request A Free Customisation

Let Us Help You

  • What are the Known and Unknown Adjacencies Impacting the Visual Cloud Market
  • What will your New Revenue Sources be?
  • Who will be your Top Customer; what will make them switch?
  • Defend your Market Share or Win Competitors
  • Get a Scorecard for Target Partners
Customized Workshop Request

Table of Contents

Exclusive indicates content/data unique to MarketsandMarkets and not available with any competitors.

TITLE
PAGE NO
INTRODUCTION
32
RESEARCH METHODOLOGY
37
EXECUTIVE SUMMARY
49
PREMIUM INSIGHTS
53
MARKET OVERVIEW AND INDUSTRY TRENDS(STRATEGIC DRIVERS WITH QUANTITATIVE IMPLICATIONS)
Unpacking the Forces Shaping Adoption & Future Growth Opportunities
58
  • 5.1 INTRODUCTION
  • 5.2 MARKET DYNAMICS
    DRIVERS
    - Increase in demand for video content across industries
    - Growing mobile video consumption through social media platforms
    - Advancements in video compression technologies to manage video traffic
    - Demand for cost-efficient video solutions
    RESTRAINTS
    - Lack of compatibility across devices
    - Network connectivity and infrastructure issues
    OPPORTUNITIES
    - Growing adoption of edge computing infrastructure for real-time data processing
    - Growth in demand for real-time video services
    - Expansion of modern, fast-paced business environments
    CHALLENGES
    - Lack of relevant technical skillset and expertise
    - Latency and performance issues
  • 5.3 CASE STUDY ANALYSIS
    SEVEN WEST MEDIA UTILIZED AKAMAI’S INFRASTRUCTURE TO DELIVER WRITTEN AND VIDEO EXPERIENCE TO USERS
    TEEVID REDEFINES VIRTUAL EVENTS WITH IBM CLOUD BARE METAL SERVERS AND IBM WATSON MEDIA STREAMING
    AWS OFFERED SEAMLESS VIDEO UPLOAD AND PLAYBACK CAPABILITIES FOR VIDYARD’S GLOBAL CUSTOMER BASE
    GENETIC PLUS CREATES INNOVATIVE VIRTUAL BUILDER PLATFORM TO MEET CLIENTS’ DIGITAL NEEDS USING ALIBABA CLOUD’S ADVANCED SOLUTIONS
    LAZADA AND ALIBABA GROUP INTEGRATED SEARCH ENGINES, BIG DATA ENGINES, AND E-COMMERCE TRADING ENGINES INTO ALIBABA CLOUD PLATFORM
    ADOBE'S JOURNEY TO GENERATIVE AI LEADERSHIP USING AWS
    EUROPA NETWORKING ENABLES INTERACTIVE TRAINING USING WEBEX HOLOGRAM
    PROPELLING ACADEMIC GROWTH WITH VIRTUAL LEARNING
  • 5.4 ECOSYSTEM ANALYSIS
  • 5.5 VALUE CHAIN ANALYSIS
  • 5.6 PRICING ANALYSIS
    AVERAGE SELLING PRICE OFFERED BY KEY PLAYERS, BY SOLUTION
    AVERAGE SELLING PRICE TREND, BY PRIVATE DEPLOYMENT
  • 5.7 PATENT ANALYSIS
  • 5.8 TECHNOLOGY ANALYSIS
    KEY TECHNOLOGIES
    - Cloud computing
    - AI and ML
    COMPLEMENTARY TECHNOLOGIES
    - 5G & edge computing
    - Blockchain
    - Data analytics
    ADJACENT TECHNOLOGIES
    - Internet of Things
    - Collaboration tools
  • 5.9 REGULATORY LANDSCAPE
    REGULATORY BODIES, GOVERNMENT AGENCIES, AND OTHER ORGANIZATIONS
    REGULATIONS, BY REGION
    - North America
    - Europe
    - Asia Pacific
    - Middle East & South Africa
    - Latin America
    REGULATORY IMPLICATIONS AND INDUSTRY STANDARDS
    - General Data Protection Regulation (GDPR)
    - SEC Rule 17a-4
    - ISO/IEC 27001
    - System and Organization Controls 2 type II compliance
    - Financial Industry Regulatory Authority (FINRA)
    - Freedom of Information Act (FOIA)
    - Health Insurance Portability and Accountability Act (HIPAA)
  • 5.10 PORTER’S FIVE FORCES ANALYSIS
    THREAT OF NEW ENTRANTS
    THREAT OF SUBSTITUTES
    BARGAINING POWER OF SUPPLIERS
    BARGAINING POWER OF BUYERS
    INTENSITY OF COMPETITIVE RIVALRY
  • 5.11 KEY STAKEHOLDERS AND BUYING CRITERIA
    KEY STAKEHOLDERS IN BUYING PROCESS
    BUYING CRITERIA
  • 5.12 KEY CONFERENCES AND EVENTS
  • 5.13 TRENDS/DISRUPTIONS IMPACTING CUSTOMER BUSINESS
  • 5.14 BUSINESS MODEL ANALYSIS
  • 5.15 INVESTMENT & FUNDING SCENARIO
  • 5.16 IMPACT OF AI/GEN AI ON VISUAL CLOUD MARKET
    USE CASE: AWS HELPS SYTE DELIVER INNOVATIVE VISUAL AI CAPABILITIES
    TOP VENDORS ADAPTING TO AI
    - Cisco
    - Alibaba
  • 5.17 TYPES OF INTEGRATION IN VISUAL CLOUD
    API
    SDK
    CUSTOM INTEGRATION
  • 5.18 CONTENT TYPES FOR VISUAL CLOUD
    VIDEO/IMAGE
    2D/3D CONTENT
    AR/VR
    INTERACTIVE CONTENT
    360-DEGREE CONTENT
VISUAL CLOUD MARKET, BY OFFERING(MARKET SIZE & FORECAST TO 2029 – IN VALUE (USD MILLION))
Detailed breakdown of market share and growth across
105
  • 6.1 INTRODUCTION
    OFFERING: VISUAL CLOUD MARKET DRIVERS
  • 6.2 SOLUTIONS
    MEDIA PROCESSING & DELIVERY
    - Enhanced user experience and streamlined workflows to drive market
    - Encoding & transcoding
    - Video management software
    - Video surveillance & security
    - Video on Demand (VOD)
    ENTERPRISE VIDEO
    - Analytics capabilities to track viewer engagement and assess effectiveness of video content to drive market
    - Video conferencing
    - Video content management
    - Webcasting
    CLOUD GAMING
    - Rendering and processing high-quality graphics in real-time to drive market
    - File streaming
    - Game streaming
    - User interface & experience
    MEDIA ANALYTICS
    - Growing video analytics solutions for various applications to drive market
    - Incident detection
    - Intrusion management
    - Traffic monitoring
    IMMERSIVE MEDIA
    - Access to immersive experiences without expensive local hardware to drive market
    - Software Development Kits (SDKs)
    - Game engine
    - Training simulation software
    OTHER SOLUTIONS
  • 6.3 SERVICES
    PROFESSIONAL SERVICES
    - Growing customer support and optimization of visual cloud solutions in organizations to drive market
    - Training & consulting
    - Support and maintenance
    - Deployment and Integration
    MANAGED SERVICES
    - Rising need for end-to-end management of technical infrastructure to drive market
    - Cloud storage & backup services
    - AI and ML services
    - Project management
VISUAL CLOUD MARKET, BY SERVICE MODEL(MARKET SIZE & FORECAST TO 2029 – IN VALUE (USD MILLION))
Detailed breakdown of market share and growth across
105
  • 7.1 INTRODUCTION
    SERVICE MODEL: VISUAL CLOUD MARKET DRIVERS
  • 7.2 IAAS
    NEED TO ENHANCE INFRASTRUCTURE SCALABILITY AND PERFORMANCE TO DRIVE MARKET
  • 7.3 PAAS
    GROWING PREFERENCE FOR EFFECTIVE TESTING STRATEGY FOR USER INTERFACES AND APIS FOR PAAS TO DRIVE MARKET
  • 7.4 SAAS
    GROWING NEED TO STRING TOGETHER DISPARATE DATA OBJECTS, EVENTS, AND AUTOMATION TO DRIVE MARKET
VISUAL CLOUD MARKET, BY DEPLOYMENT MODE(MARKET SIZE & FORECAST TO 2029 – IN VALUE ( MILLION USD))
Detailed breakdown of market share and growth across
105
  • 8.1 INTRODUCTION
    DEPLOYMENT MODE: VISUAL CLOUD MARKET DRIVERS
  • 8.2 PUBLIC CLOUD
    PUBLIC CLOUD TO HELP ORGANIZATIONS MEET THEIR SCALABILITY DEMAND AND DRIVE MARKET
  • 8.3 PRIVATE CLOUD
    DATA LOSS AND ISSUES RELATED TO REGULATORY COMPLIANCE TO DRIVE PREFERENCE FOR PRIVATE CLOUD
  • 8.4 HYBRID CLOUD
    BENEFITS OF BOTH PRIVATE AND PUBLIC CLOUDS TO BOOST DEMAND
VISUAL CLOUD MARKET, BY ORGANIZATION SIZE(MARKET SIZE & FORECAST TO 2029 – IN VALUE ( MILLION USD))
Detailed breakdown of market share and growth across
129
  • 9.1 INTRODUCTION
    ORGANIZATION SIZE: VISUAL CLOUD MARKET DRIVERS
  • 9.2 SMALL AND MEDIUM-SIZED ENTERPRISES
    GROWING DEMAND IN SMES FOR SOLUTIONS THAT CAN RESOLVE COMPLEXITIES AND OPTIMIZE COST OF BUSINESS PROCESSES TO DRIVE MARKET
  • 9.3 LARGE ENTERPRISES
    USE OF HIGH VOLUME OF APPLICATIONS IN LARGE ENTERPRISES TO DRIVE ADOPTION OF VISUAL CLOUD SOLUTIONS
VISUAL CLOUD MARKET, BY VERTICAL(MARKET SIZE & FORECAST TO 2029 – IN VALUE ( MILLION USD))
Industry-specific market sizing, growth, and key trends
134
  • 10.1 INTRODUCTION
    VERTICAL: VISUAL CLOUD MARKET DRIVERS
  • 10.2 MEDIA & ENTERTAINMENT
    VIDEO STREAMING AND WEBCASTING SOLUTIONS TO ENHANCE PERSONALIZED VIEWING EXPERIENCE
    MEDIA & ENTERTAINMENT: USE CASES
    - Content creation & production
    - Enhanced audience engagement
    - Cloud gaming & development
  • 10.3 EDUCATION
    VISUAL CLOUD SOLUTIONS TO HELP COLLEGES AND UNIVERSITIES ENHANCE CLASSROOM EXPERIENCE
    EDUCATION: USE CASES
    - Collaborative learning
    - Professional development & training
    - Remote learning & virtual classroom
  • 10.4 HEALTHCARE & LIFE SCIENCES
    EFFECTIVE COMMUNICATION OPTIONS TO HELP HEALTHCARE PROVIDERS OFFER ENHANCED PATIENT CARE
    HEALTHCARE & LIFE SCIENCES: USE CASES
    - Telemedicine & remote patient care
    - Medical imaging & diagnostics
    - Patient education & engagement
  • 10.5 IT & TELECOM
    ENTERPRISE VIDEO SOLUTIONS TO ENCOURAGE IT COMPANIES TO TRANSFER KNOWLEDGE AND INFORMATION THROUGH VIDEOS
    IT & TELECOM: USE CASES
    - Network monitoring & management
    - Customer experience management
    - Smart infrastructure
  • 10.6 RETAIL & CONSUMER GOODS
    INCREASING ONLINE VIDEO ADVERTISING AND CAMPAIGNS TO HELP CUSTOMER BRAND LOYALTY
    RETAIL & CONSUMER GOODS: USE CASES
    - Online shopping & eCommerce
    - Security & loss prevention
    - Customer behavioral analysis
  • 10.7 GOVERNMENT & PUBLIC SECTOR
    NEED FOR GOVERNMENT AGENCIES TO GAIN GREATER VISIBILITY AND FASTER DATA ANALYSIS TO DRIVE MARKET
    GOVERNMENT & PUBLIC SECTOR: USE CASES
    - Surveillance and crime prevention
    - Public engagement & communication
    - Public health & safety
  • 10.8 BFSI
    USE OF VIDEO SOLUTIONS TO IMPROVE ACCOUNTABILITY IN BFSI ORGANIZATIONS
    BFSI: USE CASES
    - Security & fraud detection
    - Marketing & customer engagement
    - Remote banking services
  • 10.9 MANUFACTURING
    VIDEO PROCESSING IN MANUFACTURING VERTICAL TO ENABLE AUTOMATED INSPECTION PROCESSES AND REDUCTION IN HUMAN ERRORS
    MANUFACTURING: USE CASES
    - Quality control & inspection
    - Remote monitoring & management
    - Production optimization
  • 10.10 OTHER VERTICALS
VISUAL CLOUD MARKET, BY REGION (MARKET SIZE & FORECAST TO 2029 – IN VALUE (USD MILLION))
Regional market sizing, forecasts, and regulatory landscapes
151
  • 11.1 INTRODUCTION
  • 11.2 NORTH AMERICA
    NORTH AMERICA: VISUAL CLOUD MARKET DRIVERS
    NORTH AMERICA: MACROECONOMIC OUTLOOK
    US
    - High adoption of enterprise video solutions and associated services to drive market growth
    CANADA
    - Growing adoption of video-centric product marketing techniques to drive market
  • 11.3 EUROPE
    EUROPE: VISUAL CLOUD MARKET DRIVERS
    EUROPE: MACROECONOMIC OUTLOOK
    UK
    - Increasing adoption of enterprise video solutions across verticals and companies to drive market
    GERMANY
    - Growing emphasis on video content for communication across industry verticals to drive market
    FRANCE
    - Government initiatives to support adoption of cloud technologies to drive market
    ITALY
    - Rise in demand for innovative, customizable, effective, and efficient solutions from vendors to drive market
    REST OF EUROPE
  • 11.4 ASIA PACIFIC
    ASIA PACIFIC: VISUAL CLOUD MARKET DRIVERS
    ASIA PACIFIC: MACROECONOMIC OUTLOOK
    CHINA
    - Rapid proliferation and surge in adoption of visual cloud solutions to drive market
    JAPAN
    - High penetration of mobile phones and technological innovations to drive market
    AUSTRALIA & NEW ZEALAND
    - Large-scale adoption of visual cloud solutions in healthcare industry to drive market
    REST OF ASIA PACIFIC
  • 11.5 MIDDLE EAST & AFRICA
    MIDDLE EAST & AFRICA: VISUAL CLOUD MARKET DRIVERS
    MIDDLE EAST & AFRICA: MACROECONOMIC OUTLOOK
    GULF COOPERATION COUNCIL COUNTRIES
    - Growing digital transformation to improve operational efficiency to drive market
    - KSA
    - UAE
    - Other GCC countries
    SOUTH AFRICA
    - Emergence of cloud-based video conferencing solutions to drive market growth
    REST OF MIDDLE EAST & AFRICA
  • 11.6 LATIN AMERICA
    LATIN AMERICA: VISUAL CLOUD MARKET DRIVERS
    LATIN AMERICA: MACROECONOMIC OUTLOOK
    BRAZIL
    - Rapid adoption of digital technologies and growing internet penetration rate to boost growth
    MEXICO
    - Recent structural reforms to create opportunities for entrepreneurs and investors
    REST OF LATIN AMERICA
COMPETITIVE LANDSCAPE
Strategic Profiles of Leading Players & Their Playbooks for Market Dominance
207
  • 12.1 OVERVIEW
  • 12.2 KEY PLAYERS’ STRATEGIES/RIGHT TO WIN
  • 12.3 MARKET SHARE ANALYSIS
  • 12.4 BRAND/PRODUCT COMPARISON
  • 12.5 REVENUE ANALYSIS
  • 12.6 COMPANY EVALUATION MATRIX: KEY PLAYERS, 2023
    STARS
    EMERGING LEADERS
    PERVASIVE PLAYERS
    PARTICIPANTS
    COMPANY FOOTPRINT: KEY PLAYERS, 2023
    - Company footprint
    - Region footprint
    - Offering footprint
    - Service model footprint
    - Organization size footprint
    - Deployment mode footprint
    - Vertical footprint
  • 12.7 COMPANY EVALUATION MATRIX: STARTUPS/SMES, 2023
    PROGRESSIVE COMPANIES
    RESPONSIVE COMPANIES
    DYNAMIC COMPANIES
    STARTING BLOCKS
    COMPETITIVE BENCHMARKING: STARTUPS/SMES, 2023
  • 12.8 COMPANY VALUATION AND FINANCIAL METRICS
  • 12.9 COMPETITIVE SCENARIO
    PRODUCT LAUNCHES AND ENHANCEMENTS
    DEALS
COMPANY PROFILES
In-depth look at their Strengths, Weaknesses, Product Portfolios, Recent Developments, and Strategic Moves
246
  • 13.1 INTRODUCTION
  • 13.2 MAJOR PLAYERS
    MICROSOFT
    - Business overview
    - Products/Solutions/Services offered
    - Recent developments
    - MnM view
    GOOGLE
    - Business overview
    - Products/Solutions/Services offered
    - Recent developments
    - MnM view
    IBM
    - Business overview
    - Products/Solutions/Services offered
    - Recent developments
    - MnM view
    AWS
    - Business overview
    - Products/Solutions/Services offered
    - Recent developments
    - MnM view
    ORACLE
    - Business overview
    - Products/Solutions/Services offered
    - Recent developments
    - MnM view
    ZOOM
    - Business overview
    - Products/Solutions/Services offered
    - Recent developments
    ALIBABA CLOUD
    - Business overview
    - Products/Solutions/Services offered
    - Recent developments
    AVAYA
    - Business overview
    - Products/Solutions/Services offered
    - Recent developments
    CISCO
    - Business overview
    - Products/Solutions/Services offered
    - Recent developments
    POLY
    - Business overview
    - Products/Solutions/Services offered
    - Recent developments
  • 13.3 OTHER PLAYERS
    TENCENT CLOUD
    ADOBE
    RINGCENTRAL
    AKAMAI TECHNOLOGIES
    GOTO
    AVIGILON
    AUTODESK
    MEDIAKIND
    KALTURA
    BRIGHTCOVE
    MUVI
    VBRICK
    JW PLAYER
    CONTUS TECH
    PIKSEL
    VIDYARD
    BLIPPAR
    ON24
    AGILE CONTENT
    WOWZA
    SHAPESXR
    COSM
    HOLOGATE
    USCREEN
ADJACENT AND RELATED MARKETS
328
  • 14.1 INTRODUCTION
    RELATED MARKETS
    LIMITATIONS
  • 14.2 VIDEO STREAMING SOFTWARE MARKET
  • 14.3 ENTERPRISE VIDEO MARKET
APPENDIX
331
  • 15.1 DISCUSSION GUIDE
  • 15.2 KNOWLEDGESTORE: MARKETSANDMARKETS’ SUBSCRIPTION PORTAL
  • 15.3 CUSTOMIZATION OPTIONS
  • 15.4 RELATED REPORTS
  • 15.5 AUTHOR DETAILS
LIST OF TABLES
 
  • TABLE 1 USD EXCHANGE RATES, 2018–2023
  • TABLE 2 FACTOR ANALYSIS
  • TABLE 3 INDICATIVE PRICING ANALYSIS OF VISUAL CLOUD MANAGEMENT MARKET, BY SOLUTION
  • TABLE 4 AVERAGE SELLING PRICE OF VISUAL CLOUD, BY PRIVATE DEPLOYMENT, 2021-2023
  • TABLE 5 TOP PATENT OWNERS
  • TABLE 6 NORTH AMERICA: REGULATORY BODIES, GOVERNMENT AGENCIES, AND OTHER ORGANIZATIONS
  • TABLE 7 EUROPE: REGULATORY BODIES, GOVERNMENT AGENCIES, AND OTHER ORGANIZATIONS
  • TABLE 8 ASIA PACIFIC: REGULATORY BODIES, GOVERNMENT AGENCIES, AND OTHER ORGANIZATIONS
  • TABLE 9 REST OF THE WORLD: REGULATORY BODIES, GOVERNMENT AGENCIES, AND OTHER ORGANIZATIONS
  • TABLE 10 PORTER’S FIVE FORCES IMPACT ON VISUAL CLOUD MARKET
  • TABLE 11 INFLUENCE OF STAKEHOLDERS ON BUYING PROCESS FOR TOP THREE VERTICALS
  • TABLE 12 KEY BUYING CRITERIA FOR TOP THREE VERTICALS
  • TABLE 13 VISUAL CLOUD MARKET: KEY CONFERENCES AND EVENTS, 2024–2025
  • TABLE 14 VISUAL CLOUD MARKET, BY OFFERING, 2019–2023 (USD MILLION)
  • TABLE 15 VISUAL CLOUD MARKET, BY OFFERING, 2024–2029 (USD MILLION)
  • TABLE 16 VISUAL CLOUD MARKET, BY SOLUTION, 2019–2023 (USD MILLION)
  • TABLE 17 VISUAL CLOUD MARKET, BY SOLUTION, 2024–2029 (USD MILLION)
  • TABLE 18 SOLUTIONS: VISUAL CLOUD MARKET, BY REGION, 2019–2023 (USD MILLION)
  • TABLE 19 SOLUTIONS: VISUAL CLOUD MARKET, BY REGION, 2024–2029 (USD MILLION)
  • TABLE 20 MEDIA PROCESSING & DELIVERY: VISUAL CLOUD MARKET, BY REGION, 2019–2023 (USD MILLION)
  • TABLE 21 MEDIA PROCESSING & DELIVERY: VISUAL CLOUD MARKET, BY REGION, 2024–2029 (USD MILLION)
  • TABLE 22 ENTERPRISE VIDEO: VISUAL CLOUD MARKET, BY REGION, 2019–2023 (USD MILLION)
  • TABLE 23 ENTERPRISE VIDEO: VISUAL CLOUD MARKET, BY REGION, 2024–2029 (USD MILLION)
  • TABLE 24 CLOUD GAMING: VISUAL CLOUD MARKET, BY REGION, 2019–2023 (USD MILLION)
  • TABLE 25 CLOUD GAMING: VISUAL CLOUD MARKET, BY REGION, 2024–2029 (USD MILLION)
  • TABLE 26 MEDIA ANALYTICS: VISUAL CLOUD MARKET, BY REGION, 2019–2023 (USD MILLION)
  • TABLE 27 MEDIA ANALYTICS: VISUAL CLOUD MARKET, BY REGION, 2024–2029 (USD MILLION)
  • TABLE 28 IMMERSIVE MEDIA: VISUAL CLOUD MARKET, BY REGION, 2019–2023 (USD MILLION)
  • TABLE 29 IMMERSIVE MEDIA: VISUAL CLOUD MARKET, BY REGION,2024–2029 (USD MILLION)
  • TABLE 30 OTHER SOLUTIONS: VISUAL CLOUD MARKET, BY REGION, 2019–2023 (USD MILLION)
  • TABLE 31 OTHER SOLUTIONS: VISUAL CLOUD MARKET, BY REGION, 2024–2029 (USD MILLION)
  • TABLE 32 VISUAL CLOUD MARKET, BY SERVICE, 2019–2023 (USD MILLION)
  • TABLE 33 VISUAL CLOUD MARKET, BY SERVICE, 2024–2029 (USD MILLION)
  • TABLE 34 SERVICES: VISUAL CLOUD MARKET, BY REGION, 2019–2023 (USD MILLION)
  • TABLE 35 SERVICES: VISUAL CLOUD MARKET, BY REGION, 2024–2029 (USD MILLION)
  • TABLE 36 VISUAL CLOUD MARKET, BY PROFESSIONAL SERVICE, 2019–2023 (USD MILLION)
  • TABLE 37 VISUAL CLOUD MARKET, BY PROFESSIONAL SERVICE, 2024–2029 (USD MILLION)
  • TABLE 38 PROFESSIONAL SERVICES: VISUAL CLOUD MARKET, BY REGION, 2019–2023 (USD MILLION)
  • TABLE 39 PROFESSIONAL SERVICES: VISUAL CLOUD MARKET, BY REGION, 2024–2029 (USD MILLION)
  • TABLE 40 TRAINING & CONSULTING: VISUAL CLOUD MARKET, BY REGION, 2019–2023 (USD MILLION)
  • TABLE 41 TRAINING & CONSULTING: VISUAL CLOUD MARKET, BY REGION, 2024–2029 (USD MILLION)
  • TABLE 42 SUPPORT & MAINTENANCE: VISUAL CLOUD MARKET, BY REGION, 2019–2023 (USD MILLION)
  • TABLE 43 SUPPORT & MAINTENANCE: VISUAL CLOUD MARKET, BY REGION, 2024–2029 (USD MILLION)
  • TABLE 44 DEPLOYMENT & INTEGRATION: VISUAL CLOUD MARKET, BY REGION, 2019–2023 (USD MILLION)
  • TABLE 45 DEPLOYMENT & INTEGRATION: VISUAL CLOUD MARKET, BY REGION, 2024–2029 (USD MILLION)
  • TABLE 46 MANAGED SERVICES: VISUAL CLOUD MARKET, BY REGION, 2019–2023 (USD MILLION)
  • TABLE 47 MANAGED SERVICES: VISUAL CLOUD MARKET, BY REGION, 2024–2029 (USD MILLION)
  • TABLE 48 VISUAL CLOUD MARKET, BY SERVICE MODEL, 2019–2023 (USD MILLION)
  • TABLE 49 VISUAL CLOUD MARKET, BY SERVICE MODEL, 2024–2029 (USD MILLION)
  • TABLE 50 IAAS: VISUAL CLOUD MARKET, BY REGION, 2019–2023 (USD MILLION)
  • TABLE 51 IAAS: VISUAL CLOUD MARKET, BY REGION, 2024–2029 (USD MILLION)
  • TABLE 52 PAAS: VISUAL CLOUD MARKET, BY REGION, 2019–2023 (USD MILLION)
  • TABLE 53 PAAS: VISUAL CLOUD MARKET, BY REGION, 2024–2029 (USD MILLION)
  • TABLE 54 SAAS: VISUAL CLOUD MARKET, BY REGION, 2019–2023 (USD MILLION)
  • TABLE 55 SAAS: VISUAL CLOUD MARKET, BY REGION, 2024–2029 (USD MILLION)
  • TABLE 56 VISUAL CLOUD MARKET, BY DEPLOYMENT MODE, 2019–2023 (USD MILLION)
  • TABLE 57 VISUAL CLOUD MARKET, BY DEPLOYMENT MODE, 2024–2029 (USD MILLION)
  • TABLE 58 PUBLIC CLOUD: VISUAL CLOUD MARKET, BY REGION, 2019–2023 (USD MILLION)
  • TABLE 59 PUBLIC CLOUD: VISUAL CLOUD MARKET, BY REGION, 2024–2029 (USD MILLION)
  • TABLE 60 PRIVATE CLOUD: VISUAL CLOUD MARKET, BY REGION, 2019–2023 (USD MILLION)
  • TABLE 61 PRIVATE CLOUD: VISUAL CLOUD MARKET, BY REGION, 2024–2029 (USD MILLION)
  • TABLE 62 HYBRID CLOUD: VISUAL CLOUD MARKET, BY REGION, 2019–2023 (USD MILLION)
  • TABLE 63 HYBRID CLOUD: VISUAL CLOUD MARKET, BY REGION, 2024–2029 (USD MILLION)
  • TABLE 64 VISUAL CLOUD MARKET, BY ORGANIZATION SIZE, 2019–2023 (USD MILLION)
  • TABLE 65 VISUAL CLOUD MARKET, BY ORGANIZATION SIZE, 2024–2029 (USD MILLION)
  • TABLE 66 SMALL AND MEDIUM-SIZED ENTERPRISES: VISUAL CLOUD MARKET, BY REGION, 2019–2023 (USD MILLION)
  • TABLE 67 SMALL AND MEDIUM-SIZED ENTERPRISES: VISUAL CLOUD MARKET, BY REGION, 2024–2029 (USD MILLION)
  • TABLE 68 LARGE ENTERPRISES: VISUAL CLOUD MARKET, BY REGION, 2019–2023 (USD MILLION)
  • TABLE 69 LARGE ENTERPRISES: VISUAL CLOUD MARKET, BY REGION, 2024–2029 (USD MILLION)
  • TABLE 70 VISUAL CLOUD MARKET, BY VERTICAL, 2019–2023 (USD MILLION)
  • TABLE 71 VISUAL CLOUD MARKET, BY VERTICAL, 2024–2029 (USD MILLION)
  • TABLE 72 MEDIA & ENTERTAINMENT: VISUAL CLOUD MARKET, BY REGION, 2019–2023 (USD MILLION)
  • TABLE 73 MEDIA & ENTERTAINMENT: VISUAL CLOUD MARKET, BY REGION, 2024–2029 (USD MILLION)
  • TABLE 74 EDUCATION: VISUAL CLOUD MARKET, BY REGION, 2019–2023 (USD MILLION)
  • TABLE 75 EDUCATION: VISUAL CLOUD MARKET, BY REGION, 2024–2029 (USD MILLION)
  • TABLE 76 HEALTHCARE & LIFE SCIENCES: VISUAL CLOUD MARKET, BY REGION, 2019–2023 (USD MILLION)
  • TABLE 77 HEALTHCARE & LIFE SCIENCES: VISUAL CLOUD MARKET, BY REGION, 2024–2029 (USD MILLION)
  • TABLE 78 IT & TELECOM: VISUAL CLOUD MARKET, BY REGION, 2019–2023 (USD MILLION)
  • TABLE 79 IT & TELECOM: VISUAL CLOUD MARKET, BY REGION, 2024–2029 (USD MILLION)
  • TABLE 80 RETAIL & CONSUMER GOODS: VISUAL CLOUD MARKET, BY REGION, 2019–2023 (USD MILLION)
  • TABLE 81 RETAIL & CONSUMER GOODS: VISUAL CLOUD MARKET, BY REGION, 2024–2029 (USD MILLION)
  • TABLE 82 GOVERNMENT & PUBLIC SECTOR: VISUAL CLOUD MARKET, BY REGION, 2019–2023 (USD MILLION)
  • TABLE 83 GOVERNMENT & PUBLIC SECTOR: VISUAL CLOUD MARKET, BY REGION, 2024–2029 (USD MILLION)
  • TABLE 84 BFSI: VISUAL CLOUD MARKET, BY REGION, 2019–2023 (USD MILLION)
  • TABLE 85 BFSI: VISUAL CLOUD MARKET, BY REGION, 2024–2029 (USD MILLION)
  • TABLE 86 MANUFACTURING: VISUAL CLOUD MARKET, BY REGION, 2019–2023 (USD MILLION)
  • TABLE 87 MANUFACTURING: VISUAL CLOUD MARKET, BY REGION, 2024–2029 (USD MILLION)
  • TABLE 88 OTHER VERTICALS: VISUAL CLOUD MARKET, BY REGION, 2019–2023 (USD MILLION)
  • TABLE 89 OTHER VERTICALS: VISUAL CLOUD MARKET, BY REGION, 2024–2029 (USD MILLION)
  • TABLE 90 VISUAL CLOUD MARKET, BY REGION, 2019–2023 (USD MILLION)
  • TABLE 91 VISUAL CLOUD MARKET, BY REGION, 2024–2029 (USD MILLION)
  • TABLE 92 NORTH AMERICA: VISUAL CLOUD MARKET, BY OFFERING, 2019–2023 (USD MILLION)
  • TABLE 93 NORTH AMERICA: VISUAL CLOUD MARKET, BY OFFERING, 2024–2029 (USD MILLION)
  • TABLE 94 NORTH AMERICA: VISUAL CLOUD MARKET, BY SOLUTION, 2019–2023 (USD MILLION)
  • TABLE 95 NORTH AMERICA: VISUAL CLOUD MARKET, BY SOLUTION, 2024–2029 (USD MILLION)
  • TABLE 96 NORTH AMERICA: VISUAL CLOUD MARKET, BY SERVICE, 2019–2023 (USD MILLION)
  • TABLE 97 NORTH AMERICA: VISUAL CLOUD MARKET, BY SERVICE, 2024–2029 (USD MILLION)
  • TABLE 98 NORTH AMERICA: VISUAL CLOUD MARKET, BY PROFESSIONAL SERVICE, 2019–2023 (USD MILLION)
  • TABLE 99 NORTH AMERICA: VISUAL CLOUD MARKET, BY PROFESSIONAL SERVICE, 2024–2029 (USD MILLION)
  • TABLE 100 NORTH AMERICA: VISUAL CLOUD MARKET, BY SERVICE MODEL, 2019–2023 (USD MILLION)
  • TABLE 101 NORTH AMERICA: VISUAL CLOUD MARKET, BY SERVICE MODEL, 2024–2029 (USD MILLION)
  • TABLE 102 NORTH AMERICA: VISUAL CLOUD MARKET, BY ORGANIZATION SIZE, 2019–2023 (USD MILLION)
  • TABLE 103 NORTH AMERICA: VISUAL CLOUD MARKET, BY ORGANIZATION SIZE, 2024–2029 (USD MILLION)
  • TABLE 104 NORTH AMERICA: VISUAL CLOUD MARKET, BY DEPLOYMENT MODE, 2019–2023 (USD MILLION)
  • TABLE 105 NORTH AMERICA: VISUAL CLOUD MARKET, BY DEPLOYMENT MODE, 2024–2029 (USD MILLION)
  • TABLE 106 NORTH AMERICA: VISUAL CLOUD MARKET, BY VERTICAL, 2019–2023 (USD MILLION)
  • TABLE 107 NORTH AMERICA: VISUAL CLOUD MARKET, BY VERTICAL, 2024–2029 (USD MILLION)
  • TABLE 108 NORTH AMERICA: VISUAL CLOUD MARKET, BY COUNTRY, 2019–2023 (USD MILLION)
  • TABLE 109 NORTH AMERICA: VISUAL CLOUD MARKET, BY COUNTRY, 2024–2029 (USD MILLION)
  • TABLE 110 US: VISUAL CLOUD MARKET, BY ORGANIZATION SIZE, 2019–2023 (USD MILLION)
  • TABLE 111 US: VISUAL CLOUD MARKET, BY ORGANIZATION SIZE, 2024–2029 (USD MILLION)
  • TABLE 112 US: VISUAL CLOUD MARKET, BY DEPLOYMENT MODE, 2019–2023 (USD MILLION)
  • TABLE 113 US: VISUAL CLOUD MARKET, BY DEPLOYMENT MODE, 2024–2029 (USD MILLION)
  • TABLE 114 CANADA: VISUAL CLOUD MARKET, BY ORGANIZATION SIZE, 2019–2023 (USD MILLION)
  • TABLE 115 CANADA: VISUAL CLOUD MARKET, BY ORGANIZATION SIZE, 2024–2029 (USD MILLION)
  • TABLE 116 CANADA: VISUAL CLOUD MARKET, BY DEPLOYMENT MODE, 2019–2023 (USD MILLION)
  • TABLE 117 CANADA: VISUAL CLOUD MARKET, BY DEPLOYMENT MODE, 2024–2029 (USD MILLION)
  • TABLE 118 EUROPE: VISUAL CLOUD MARKET, BY OFFERING, 2019–2023 (USD MILLION)
  • TABLE 119 EUROPE: VISUAL CLOUD MARKET, BY OFFERING, 2024–2029 (USD MILLION)
  • TABLE 120 EUROPE: VISUAL CLOUD MARKET, BY SOLUTION, 2019–2023 (USD MILLION)
  • TABLE 121 EUROPE: VISUAL CLOUD MARKET, BY SOLUTION, 2024–2029 (USD MILLION)
  • TABLE 122 EUROPE: VISUAL CLOUD MARKET, BY SERVICE, 2019–2023 (USD MILLION)
  • TABLE 123 EUROPE: VISUAL CLOUD MARKET, BY SERVICE, 2024–2029 (USD MILLION)
  • TABLE 124 EUROPE: VISUAL CLOUD MARKET, BY PROFESSIONAL SERVICE, 2019–2023 (USD MILLION)
  • TABLE 125 EUROPE: VISUAL CLOUD MARKET, BY PROFESSIONAL SERVICE, 2024–2029 (USD MILLION)
  • TABLE 126 EUROPE: VISUAL CLOUD MARKET, BY SERVICE MODEL, 2019–2023 (USD MILLION)
  • TABLE 127 EUROPE: VISUAL CLOUD MARKET, BY SERVICE MODEL, 2024–2029 (USD MILLION)
  • TABLE 128 EUROPE: VISUAL CLOUD MARKET, BY ORGANIZATION SIZE, 2019–2023 (USD MILLION)
  • TABLE 129 EUROPE: VISUAL CLOUD MARKET, BY ORGANIZATION SIZE, 2024–2029 (USD MILLION)
  • TABLE 130 EUROPE: VISUAL CLOUD MARKET, BY DEPLOYMENT MODE, 2019–2023 (USD MILLION)
  • TABLE 131 EUROPE: VISUAL CLOUD MARKET, BY DEPLOYMENT MODE, 2024–2029 (USD MILLION)
  • TABLE 132 EUROPE: VISUAL CLOUD MARKET, BY VERTICAL, 2019–2023 (USD MILLION)
  • TABLE 133 EUROPE: VISUAL CLOUD MARKET, BY VERTICAL, 2024–2029 (USD MILLION)
  • TABLE 134 EUROPE: VISUAL CLOUD MARKET, BY COUNTRY, 2019–2023 (USD MILLION)
  • TABLE 135 EUROPE: VISUAL CLOUD MARKET, BY COUNTRY, 2024–2029 (USD MILLION)
  • TABLE 136 UK: VISUAL CLOUD MARKET, BY ORGANIZATION SIZE, 2019–2023 (USD MILLION)
  • TABLE 137 UK: VISUAL CLOUD MARKET, BY ORGANIZATION SIZE, 2024–2029 (USD MILLION)
  • TABLE 138 UK: VISUAL CLOUD MARKET, BY DEPLOYMENT MODE, 2019–2023 (USD MILLION)
  • TABLE 139 UK: VISUAL CLOUD MARKET, BY DEPLOYMENT MODE, 2024–2029 (USD MILLION)
  • TABLE 140 GERMANY: VISUAL CLOUD MARKET, BY ORGANIZATION SIZE, 2019–2023 (USD MILLION)
  • TABLE 141 GERMANY: VISUAL CLOUD MARKET, BY ORGANIZATION SIZE, 2024–2029 (USD MILLION)
  • TABLE 142 GERMANY: VISUAL CLOUD MARKET, BY DEPLOYMENT MODE, 2019–2023 (USD MILLION)
  • TABLE 143 GERMANY: VISUAL CLOUD MARKET, BY DEPLOYMENT MODE, 2024–2029 (USD MILLION)
  • TABLE 144 FRANCE: VISUAL CLOUD MARKET, BY ORGANIZATION SIZE, 2019–2023 (USD MILLION)
  • TABLE 145 FRANCE: VISUAL CLOUD MARKET, BY ORGANIZATION SIZE, 2024–2029 (USD MILLION)
  • TABLE 146 FRANCE: VISUAL CLOUD MARKET, BY DEPLOYMENT MODE, 2019–2023 (USD MILLION)
  • TABLE 147 FRANCE: VISUAL CLOUD MARKET, BY DEPLOYMENT MODE, 2024–2029 (USD MILLION)
  • TABLE 148 ITALY: VISUAL CLOUD MARKET, BY ORGANIZATION SIZE, 2019–2023 (USD MILLION)
  • TABLE 149 ITALY: VISUAL CLOUD MARKET, BY ORGANIZATION SIZE, 2024–2029 (USD MILLION)
  • TABLE 150 ITALY: VISUAL CLOUD MARKET, BY DEPLOYMENT MODE, 2019–2023 (USD MILLION)
  • TABLE 151 ITALY: VISUAL CLOUD MARKET, BY DEPLOYMENT MODE, 2024–2029 (USD MILLION)
  • TABLE 152 REST OF EUROPE: VISUAL CLOUD MARKET, BY ORGANIZATION SIZE, 2019–2023 (USD MILLION)
  • TABLE 153 REST OF EUROPE: VISUAL CLOUD MARKET, BY ORGANIZATION SIZE, 2024–2029 (USD MILLION)
  • TABLE 154 REST OF EUROPE: VISUAL CLOUD MARKET, BY DEPLOYMENT MODE, 2019–2023 (USD MILLION)
  • TABLE 155 REST OF EUROPE: VISUAL CLOUD MARKET, BY DEPLOYMENT MODE, 2024–2029 (USD MILLION)
  • TABLE 156 ASIA PACIFIC: VISUAL CLOUD MARKET, BY OFFERING, 2019–2023 (USD MILLION)
  • TABLE 157 ASIA PACIFIC: VISUAL CLOUD MARKET, BY OFFERING, 2024–2029 (USD MILLION)
  • TABLE 158 ASIA PACIFIC: VISUAL CLOUD MARKET, BY SOLUTION, 2019–2023 (USD MILLION)
  • TABLE 159 ASIA PACIFIC: VISUAL CLOUD MARKET, BY SOLUTION, 2024–2029 (USD MILLION)
  • TABLE 160 ASIA PACIFIC: VISUAL CLOUD MARKET, BY SERVICE, 2019–2023 (USD MILLION)
  • TABLE 161 ASIA PACIFIC: VISUAL CLOUD MARKET, BY SERVICE, 2024–2029 (USD MILLION)
  • TABLE 162 ASIA PACIFIC: VISUAL CLOUD MARKET, BY PROFESSIONAL SERVICE, 2019–2023 (USD MILLION)
  • TABLE 163 ASIA PACIFIC: VISUAL CLOUD MARKET, BY PROFESSIONAL SERVICE,2024–2029 (USD MILLION)
  • TABLE 164 ASIA PACIFIC: VISUAL CLOUD MARKET, BY SERVICE MODEL, 2019–2023 (USD MILLION)
  • TABLE 165 ASIA PACIFIC: VISUAL CLOUD MARKET, BY SERVICE MODEL, 2024–2029 (USD MILLION)
  • TABLE 166 ASIA PACIFIC: VISUAL CLOUD MARKET, BY ORGANIZATION SIZE, 2019–2023 (USD MILLION)
  • TABLE 167 ASIA PACIFIC: VISUAL CLOUD MARKET, BY ORGANIZATION SIZE, 2024–2029 (USD MILLION)
  • TABLE 168 ASIA PACIFIC: VISUAL CLOUD MARKET, BY DEPLOYMENT MODE, 2019–2023 (USD MILLION)
  • TABLE 169 ASIA PACIFIC: VISUAL CLOUD MARKET, BY DEPLOYMENT MODE, 2024–2029 (USD MILLION)
  • TABLE 170 ASIA PACIFIC: VISUAL CLOUD MARKET, BY VERTICAL, 2019–2023 (USD MILLION)
  • TABLE 171 ASIA PACIFIC: VISUAL CLOUD MARKET, BY VERTICAL, 2024–2029 (USD MILLION)
  • TABLE 172 ASIA PACIFIC: VISUAL CLOUD MARKET, BY COUNTRY, 2019–2023 (USD MILLION)
  • TABLE 173 ASIA PACIFIC: VISUAL CLOUD MARKET, BY COUNTRY, 2024–2029 (USD MILLION)
  • TABLE 174 CHINA: VISUAL CLOUD MARKET, BY ORGANIZATION SIZE, 2019–2023 (USD MILLION)
  • TABLE 175 CHINA: VISUAL CLOUD MARKET, BY ORGANIZATION SIZE, 2024–2029 (USD MILLION)
  • TABLE 176 CHINA: VISUAL CLOUD MARKET, BY DEPLOYMENT MODE, 2019–2023 (USD MILLION)
  • TABLE 177 CHINA: VISUAL CLOUD MARKET, BY DEPLOYMENT MODE, 2024–2029 (USD MILLION)
  • TABLE 178 JAPAN: VISUAL CLOUD MARKET, BY ORGANIZATION SIZE, 2019–2023 (USD MILLION)
  • TABLE 179 JAPAN: VISUAL CLOUD MARKET, BY ORGANIZATION SIZE, 2024–2029 (USD MILLION)
  • TABLE 180 JAPAN: VISUAL CLOUD MARKET, BY DEPLOYMENT MODE,2019–2023 (USD MILLION)
  • TABLE 181 JAPAN: VISUAL CLOUD MARKET, BY DEPLOYMENT MODE, 2024–2029 (USD MILLION)
  • TABLE 182 AUSTRALIA & NEW ZEALAND: VISUAL CLOUD MARKET, BY ORGANIZATION SIZE, 2019–2023 (USD MILLION)
  • TABLE 183 AUSTRALIA & NEW ZEALAND: VISUAL CLOUD MARKET, BY ORGANIZATION SIZE, 2024–2029 (USD MILLION)
  • TABLE 184 AUSTRALIA & NEW ZEALAND: VISUAL CLOUD MARKET, BY DEPLOYMENT MODE, 2019–2023 (USD MILLION)
  • TABLE 185 AUSTRALIA & NEW ZEALAND: VISUAL CLOUD MARKET, BY DEPLOYMENT MODE, 2024–2029 (USD MILLION)
  • TABLE 186 REST OF ASIA PACIFIC: VISUAL CLOUD MARKET, BY ORGANIZATION SIZE, 2019–2023 (USD MILLION)
  • TABLE 187 REST OF ASIA PACIFIC: VISUAL CLOUD MARKET, BY ORGANIZATION SIZE, 2024–2029 (USD MILLION)
  • TABLE 188 REST OF ASIA PACIFIC: VISUAL CLOUD MARKET, BY DEPLOYMENT MODE,2019–2023 (USD MILLION)
  • TABLE 189 REST OF ASIA PACIFIC: VISUAL CLOUD MARKET, BY DEPLOYMENT MODE, 2024–2029 (USD MILLION)
  • TABLE 190 MIDDLE EAST & AFRICA: VISUAL CLOUD MARKET, BY OFFERING, 2019–2023 (USD MILLION)
  • TABLE 191 MIDDLE EAST & AFRICA: VISUAL CLOUD MARKET, BY OFFERING, 2024–2029 (USD MILLION)
  • TABLE 192 MIDDLE EAST & AFRICA: VISUAL CLOUD MARKET, BY SOLUTION, 2019–2023 (USD MILLION)
  • TABLE 193 MIDDLE EAST & AFRICA: VISUAL CLOUD MARKET, BY SOLUTION, 2024–2029 (USD MILLION)
  • TABLE 194 MIDDLE EAST & AFRICA: VISUAL CLOUD MARKET, BY SERVICE, 2019–2023 (USD MILLION)
  • TABLE 195 MIDDLE EAST & AFRICA: VISUAL CLOUD MARKET, BY SERVICE, 2024–2029 (USD MILLION)
  • TABLE 196 MIDDLE EAST & AFRICA: VISUAL CLOUD MARKET, BY PROFESSIONAL SERVICE, 2019–2023 (USD MILLION)
  • TABLE 197 MIDDLE EAST & AFRICA: VISUAL CLOUD MARKET, BY PROFESSIONAL SERVICE, 2024–2029 (USD MILLION)
  • TABLE 198 MIDDLE EAST & AFRICA: VISUAL CLOUD MARKET, BY SERVICE MODEL, 2019–2023 (USD MILLION)
  • TABLE 199 MIDDLE EAST & AFRICA: VISUAL CLOUD MARKET, BY SERVICE MODEL, 2024–2029 (USD MILLION)
  • TABLE 200 MIDDLE EAST & AFRICA: VISUAL CLOUD MARKET, BY ORGANIZATION SIZE, 2019–2023 (USD MILLION)
  • TABLE 201 MIDDLE EAST & AFRICA: VISUAL CLOUD MARKET, BY ORGANIZATION SIZE, 2024–2029 (USD MILLION)
  • TABLE 202 MIDDLE EAST & AFRICA: VISUAL CLOUD MARKET, BY DEPLOYMENT MODE, 2019–2023 (USD MILLION)
  • TABLE 203 MIDDLE EAST & AFRICA: VISUAL CLOUD MARKET, BY DEPLOYMENT MODE, 2024–2029 (USD MILLION)
  • TABLE 204 MIDDLE EAST & AFRICA: VISUAL CLOUD MARKET, BY VERTICAL, 2019–2023 (USD MILLION)
  • TABLE 205 MIDDLE EAST & AFRICA: VISUAL CLOUD MARKET, BY VERTICAL, 2024–2029 (USD MILLION)
  • TABLE 206 MIDDLE EAST & AFRICA: VISUAL CLOUD MARKET, BY COUNTRY, 2019–2023 (USD MILLION)
  • TABLE 207 MIDDLE EAST & AFRICA: VISUAL CLOUD MARKET, BY COUNTRY, 2024–2029 (USD MILLION)
  • TABLE 208 GULF COOPERATION COUNCIL COUNTRIES: VISUAL CLOUD MARKET, BY COUNTRY, 2019–2023 (USD MILLION)
  • TABLE 209 GULF COOPERATION COUNCIL COUNTRIES: VISUAL CLOUD MARKET, BY COUNTRY, 2024–2029 (USD MILLION)
  • TABLE 210 GULF COOPERATION COUNCIL COUNTRIES: VISUAL CLOUD MARKET, BY ORGANIZATION SIZE, 2019–2023 (USD MILLION)
  • TABLE 211 GULF COOPERATION COUNCIL COUNTRIES: VISUAL CLOUD MARKET, BY ORGANIZATION SIZE, 2024–2029 (USD MILLION)
  • TABLE 212 GULF COOPERATION COUNCIL COUNTRIES: VISUAL CLOUD MARKET, BY DEPLOYMENT MODE, 2019–2023 (USD MILLION)
  • TABLE 213 GULF COOPERATION COUNCIL COUNTRIES: VISUAL CLOUD MARKET, BY DEPLOYMENT MODE, 2024–2029 (USD MILLION)
  • TABLE 214 SOUTH AFRICA: VISUAL CLOUD MARKET, BY ORGANIZATION SIZE, 2019–2023 (USD MILLION)
  • TABLE 215 SOUTH AFRICA: VISUAL CLOUD MARKET, BY ORGANIZATION SIZE, 2024–2029 (USD MILLION)
  • TABLE 216 SOUTH AFRICA: VISUAL CLOUD MARKET, BY DEPLOYMENT MODE, 2019–2023 (USD MILLION)
  • TABLE 217 SOUTH AFRICA: VISUAL CLOUD MARKET, BY DEPLOYMENT MODE, 2024–2029 (USD MILLION)
  • TABLE 218 REST OF MIDDLE EAST & AFRICA: VISUAL CLOUD MARKET, BY ORGANIZATION SIZE, 2019–2023 (USD MILLION)
  • TABLE 219 REST OF MIDDLE EAST & AFRICA: VISUAL CLOUD MARKET, BY ORGANIZATION SIZE, 2024–2029 (USD MILLION)
  • TABLE 220 REST OF MIDDLE EAST & AFRICA: VISUAL CLOUD MARKET, BY DEPLOYMENT MODE, 2019–2023 (USD MILLION)
  • TABLE 221 REST OF MIDDLE EAST & AFRICA: VISUAL CLOUD MARKET, BY DEPLOYMENT MODE, 2024–2029 (USD MILLION)
  • TABLE 222 LATIN AMERICA: VISUAL CLOUD MARKET, BY OFFERING, 2019–2023 (USD MILLION)
  • TABLE 223 LATIN AMERICA: VISUAL CLOUD MARKET, BY OFFERING, 2024–2029 (USD MILLION)
  • TABLE 224 LATIN AMERICA: VISUAL CLOUD MARKET, BY SOLUTION, 2019–2023 (USD MILLION)
  • TABLE 225 LATIN AMERICA: VISUAL CLOUD MARKET, BY SOLUTION, 2024–2029 (USD MILLION)
  • TABLE 226 LATIN AMERICA: VISUAL CLOUD MARKET, BY SERVICE, 2019–2023 (USD MILLION)
  • TABLE 227 LATIN AMERICA: VISUAL CLOUD MARKET, BY SERVICE, 2024–2029 (USD MILLION)
  • TABLE 228 LATIN AMERICA: VISUAL CLOUD MARKET, BY PROFESSIONAL SERVICE, 2019–2023 (USD MILLION)
  • TABLE 229 LATIN AMERICA: VISUAL CLOUD MARKET, BY PROFESSIONAL SERVICE, 2024–2029 (USD MILLION)
  • TABLE 230 LATIN AMERICA: VISUAL CLOUD MARKET, BY SERVICE MODEL, 2019–2023 (USD MILLION)
  • TABLE 231 LATIN AMERICA: VISUAL CLOUD MARKET, BY SERVICE MODEL, 2024–2029 (USD MILLION)
  • TABLE 232 LATIN AMERICA: VISUAL CLOUD MARKET, BY ORGANIZATION SIZE, 2019–2023 (USD MILLION)
  • TABLE 233 LATIN AMERICA: VISUAL CLOUD MARKET, BY ORGANIZATION SIZE, 2024–2029 (USD MILLION)
  • TABLE 234 LATIN AMERICA: VISUAL CLOUD MARKET, BY DEPLOYMENT MODE, 2019–2023 (USD MILLION)
  • TABLE 235 LATIN AMERICA: VISUAL CLOUD MARKET, BY DEPLOYMENT MODE, 2024–2029 (USD MILLION)
  • TABLE 236 LATIN AMERICA: VISUAL CLOUD MARKET, BY VERTICAL, 2019–2023 (USD MILLION)
  • TABLE 237 LATIN AMERICA: VISUAL CLOUD MARKET, BY VERTICAL, 2024–2029 (USD MILLION)
  • TABLE 238 LATIN AMERICA: VISUAL CLOUD MARKET, BY COUNTRY, 2019–2023 (USD MILLION)
  • TABLE 239 LATIN AMERICA: VISUAL CLOUD MARKET, BY COUNTRY, 2024–2029 (USD MILLION)
  • TABLE 240 BRAZIL: VISUAL CLOUD MARKET, BY ORGANIZATION SIZE, 2019–2023 (USD MILLION)
  • TABLE 241 BRAZIL: VISUAL CLOUD MARKET, BY ORGANIZATION SIZE, 2024–2029 (USD MILLION)
  • TABLE 242 BRAZIL: VISUAL CLOUD MARKET, BY DEPLOYMENT MODE, 2019–2023 (USD MILLION)
  • TABLE 243 BRAZIL: VISUAL CLOUD MARKET, BY DEPLOYMENT MODE, 2024–2029 (USD MILLION)
  • TABLE 244 MEXICO: VISUAL CLOUD MARKET, BY ORGANIZATION SIZE, 2019–2023 (USD MILLION)
  • TABLE 245 MEXICO: VISUAL CLOUD MARKET, BY ORGANIZATION SIZE, 2024–2029 (USD MILLION)
  • TABLE 246 MEXICO: VISUAL CLOUD MARKET, BY DEPLOYMENT MODE, 2019–2023 (USD MILLION)
  • TABLE 247 MEXICO: VISUAL CLOUD MARKET, BY DEPLOYMENT MODE, 2024–2029 (USD MILLION)
  • TABLE 248 REST OF LATIN AMERICA: VISUAL CLOUD MARKET, BY ORGANIZATION SIZE, 2019–2023 (USD MILLION)
  • TABLE 249 REST OF LATIN AMERICA: VISUAL CLOUD MARKET, BY ORGANIZATION SIZE, 2024–2029 (USD MILLION)
  • TABLE 250 REST OF LATIN AMERICA: VISUAL CLOUD MARKET, BY DEPLOYMENT MODE, 2019–2023 (USD MILLION)
  • TABLE 251 REST OF LATIN AMERICA: VISUAL CLOUD MARKET, BY DEPLOYMENT MODE, 2024–2029 (USD MILLION)
  • TABLE 252 VISUAL CLOUD MARKET: DEGREE OF COMPETITION, 2023
  • TABLE 253 VISUAL CLOUD MARKET: REGIONAL FOOTPRINT
  • TABLE 254 VISUAL CLOUD MARKET: OFFERING FOOTPRINT
  • TABLE 255 VISUAL CLOUD MARKET: SERVICE MODEL FOOTPRINT
  • TABLE 256 VISUAL CLOUD MARKET: ORGANIZATION SIZE FOOTPRINT
  • TABLE 257 VISUAL CLOUD MARKET: DEPLOYMENT MODE FOOTPRINT
  • TABLE 258 VISUAL CLOUD MARKET: VERTICAL FOOTPRINT
  • TABLE 259 VISUAL CLOUD MARKET: KEY STARTUPS/SMES
  • TABLE 260 VISUAL CLOUD MARKET: COMPETITIVE BENCHMARKING OF KEY STARTUPS/SMES
  • TABLE 261 VISUAL CLOUD MARKET: PRODUCT LAUNCHES AND ENHANCEMENTS, FEBRUARY 2021– DECEMBER 2024
  • TABLE 262 VISUAL CLOUD MARKET: DEALS, FEBRUARY 2021–DECEMBER 2024
  • TABLE 263 MICROSOFT: COMPANY OVERVIEW
  • TABLE 264 MICROSOFT: PRODUCTS/SOLUTIONS/SERVICES OFFERED
  • TABLE 265 MICROSOFT: PRODUCT LAUNCHES AND ENHANCEMENTS
  • TABLE 266 MICROSOFT: DEALS
  • TABLE 267 GOOGLE: COMPANY OVERVIEW
  • TABLE 268 GOOGLE: PRODUCTS/SOLUTIONS/SERVICES OFFERED
  • TABLE 269 GOOGLE: PRODUCT LAUNCHES AND ENHANCEMENTS
  • TABLE 270 GOOGLE: DEALS
  • TABLE 271 IBM: COMPANY OVERVIEW
  • TABLE 272 IBM: PRODUCTS/SOLUTIONS/SERVICES OFFERED
  • TABLE 273 IBM: PRODUCT LAUNCHES AND ENHANCEMENTS
  • TABLE 274 IBM: DEALS
  • TABLE 275 AWS: COMPANY OVERVIEW
  • TABLE 276 AWS: PRODUCTS/SOLUTIONS/SERVICES OFFERED
  • TABLE 277 AWS: PRODUCT LAUNCHES AND ENHANCEMENTS
  • TABLE 278 AWS: DEALS
  • TABLE 279 ORACLE: COMPANY OVERVIEW
  • TABLE 280 ORACLE: PRODUCTS/SOLUTIONS/SERVICES OFFERED
  • TABLE 281 ORACLE: PRODUCT LAUNCHES AND ENHANCEMENTS
  • TABLE 282 ORACLE: DEALS
  • TABLE 283 ZOOM: COMPANY OVERVIEW
  • TABLE 284 ZOOM: PRODUCTS/SOLUTIONS/SERVICES OFFERED
  • TABLE 285 ZOOM: PRODUCT LAUNCHES AND ENHANCEMENTS
  • TABLE 286 ZOOM: DEALS
  • TABLE 287 ALIBABA CLOUD: COMPANY OVERVIEW
  • TABLE 288 ALIBABA CLOUD: PRODUCTS/SOLUTIONS/SERVICES OFFERED
  • TABLE 289 ALIBABA CLOUD: PRODUCT LAUNCHES AND ENHANCEMENTS
  • TABLE 290 ALIBABA CLOUD: DEALS
  • TABLE 291 AVAYA: COMPANY OVERVIEW
  • TABLE 292 AVAYA: PRODUCTS/SOLUTIONS/SERVICES OFFERED
  • TABLE 293 AVAYA: PRODUCT LAUNCHES AND ENHANCEMENTS
  • TABLE 294 AVAYA: DEALS
  • TABLE 295 CISCO: COMPANY OVERVIEW
  • TABLE 296 CISCO: PRODUCTS/SOLUTIONS/SERVICES OFFERED
  • TABLE 297 CISCO: PRODUCT LAUNCHES AND ENHANCEMENTS
  • TABLE 298 CISCO: DEALS
  • TABLE 299 POLY: COMPANY OVERVIEW
  • TABLE 300 POLY: PRODUCTS/SOLUTIONS/SERVICES OFFERED
  • TABLE 301 POLY: PRODUCT LAUNCHES AND ENHANCEMENTS
  • TABLE 302 POLY: DEALS
  • TABLE 303 TENCENT CLOUD: COMPANY OVERVIEW
  • TABLE 304 ADOBE: COMPANY OVERVIEW
  • TABLE 305 RINGCENTRAL: COMPANY OVERVIEW
  • TABLE 306 AKAMAI TECHNOLOGIES: COMPANY OVERVIEW
  • TABLE 307 GOTO: COMPANY OVERVIEW
  • TABLE 308 AVIGILON: COMPANY OVERVIEW
  • TABLE 309 AUTODESK: COMPANY OVERVIEW
  • TABLE 310 MEDIAKIND: COMPANY OVERVIEW
  • TABLE 311 KALTURA: COMPANY OVERVIEW
  • TABLE 312 BRIGHTCOVE: COMPANY OVERVIEW
  • TABLE 313 MUVI: COMPANY OVERVIEW
  • TABLE 314 VBRICK: COMPANY OVERVIEW
  • TABLE 315 JW PLAYER: COMPANY OVERVIEW
  • TABLE 316 CONTUS TECH: COMPANY OVERVIEW
  • TABLE 317 PIKSEL: COMPANY OVERVIEW
  • TABLE 318 VIDYARD: COMPANY OVERVIEW
  • TABLE 319 BLIPPAR: COMPANY OVERVIEW
  • TABLE 320 ON24: COMPANY OVERVIEW
  • TABLE 321 AGILE CONTENT: COMPANY OVERVIEW
  • TABLE 322 WOWZA: COMPANY OVERVIEW
  • TABLE 323 SHAPESXR: COMPANY OVERVIEW
  • TABLE 324 COSM: COMPANY OVERVIEW
  • TABLE 325 HOLOGATE: COMPANY OVERVIEW
  • TABLE 326 USCREEN: COMPANY OVERVIEW
  • TABLE 327 VIDEO STREAMING SOFTWARE MARKET, BY STREAMING TYPE, 2019–2023 (USD MILLION)
  • TABLE 328 VIDEO STREAMING SOFTWARE MARKET, BY STREAMING TYPE, 2024–2029 (USD MILLION)
  • TABLE 329 ENTERPRISE VIDEO MARKET, BY SOLUTION, 2018–2023 (USD MILLION)
  • TABLE 330 ENTERPRISE VIDEO MARKET, BY SOLUTION, 2024–2029 (USD MILLION)
LIST OF FIGURES
 
  • FIGURE 1 VISUAL CLOUD MARKET: RESEARCH DESIGN
  • FIGURE 2 VISUAL CLOUD MARKET: MARKET BREAKUP AND DATA TRIANGULATION
  • FIGURE 3 VISUAL CLOUD MARKET: TOP-DOWN AND BOTTOM-UP APPROACHES
  • FIGURE 4 MARKET SIZE ESTIMATION METHODOLOGY: TOP-DOWN APPROACH
  • FIGURE 5 MARKET SIZE ESTIMATION METHODOLOGY: BOTTOM-UP APPROACH
  • FIGURE 6 VISUAL CLOUD MARKET: RESEARCH FLOW
  • FIGURE 7 MARKET SIZE ESTIMATION METHODOLOGY: SUPPLY-SIDE ANALYSIS
  • FIGURE 8 BOTTOM-UP APPROACH FROM SUPPLY SIDE: COLLECTIVE REVENUE OF VENDORS
  • FIGURE 9 DEMAND-SIDE APPROACH: VISUAL CLOUD MARKET
  • FIGURE 10 VISUAL CLOUD MARKET SNAPSHOT, 2021–2029
  • FIGURE 11 TOP MARKET SEGMENTS IN TERMS OF GROWTH RATE
  • FIGURE 12 NORTH AMERICA TO ACCOUNT FOR LARGEST MARKET SHARE DURING FORECAST PERIOD
  • FIGURE 13 GLOBALIZATION AND COMMUNICATION NEEDS DRIVE ADOPTION OF VISUAL CLOUD SOLUTIONS FOR SEAMLESS COLLABORATION
  • FIGURE 14 SOLUTIONS SEGMENT TO ACCOUNT FOR LARGER MARKET SHARE DURING FORECAST PERIOD
  • FIGURE 15 IMMERSIVE MEDIA SEGMENT TO ACCOUNT FOR LARGEST MARKET SHARE IN 2029
  • FIGURE 16 PROFESSIONAL SERVICES SEGMENT TO ACCOUNT FOR LARGER MARKET SHARE DURING FORECAST PERIOD
  • FIGURE 17 DEPLOYMENT & INTEGRATION SEGMENT TO ACCOUNT FOR LARGEST MARKET SHARE DURING FORECAST PERIOD
  • FIGURE 18 SAAS SEGMENT TO ACCOUNT FOR LARGEST MARKET SHARE DURING FORECAST PERIOD
  • FIGURE 19 PUBLIC CLOUD SEGMENT TO ACCOUNT FOR LARGEST MARKET SHARE DURING FORECAST PERIOD
  • FIGURE 20 LARGE ENTERPRISES SEGMENT TO ACCOUNT FOR LARGER MARKET SHARE DURING FORECAST PERIOD
  • FIGURE 21 MEDIA & ENTERTAINMENT GOODS SEGMENT TO ACCOUNT FOR LARGEST MARKET SHARE IN 2029
  • FIGURE 22 ASIA PACIFIC TO EMERGE AS BEST MARKET FOR INVESTMENTS IN NEXT FIVE YEARS
  • FIGURE 23 DRIVERS, RESTRAINTS, OPPORTUNITIES, AND CHALLENGES: VISUAL CLOUD MARKET
  • FIGURE 24 NON-VIDEO MARKETERS WHO PLANNED TO START USING VIDEO IN 2023
  • FIGURE 25 PERCENTAGE OF USERS ENGAGED IN SOCIAL MEDIA ACROSS COUNTRIES IN 2022
  • FIGURE 26 GAMING DRIVES LIVE STREAMING
  • FIGURE 27 KEY PLAYERS IN VISUAL CLOUD MARKET
  • FIGURE 28 VISUAL CLOUD MARKET: VALUE CHAIN
  • FIGURE 29 NUMBER OF PATENTS PUBLISHED, 2013–2023
  • FIGURE 30 TOP 10 PATENT APPLICANTS (GLOBAL) IN 2023
  • FIGURE 31 PORTER’S FIVE FORCES ANALYSIS: VISUAL CLOUD MARKET
  • FIGURE 32 INFLUENCE OF STAKEHOLDERS ON BUYING PROCESS FOR TOP THREE VERTICALS
  • FIGURE 33 KEY BUYING CRITERIA FOR TOP THREE VERTICALS
  • FIGURE 34 VISUAL CLOUD MARKET: TRENDS/DISRUPTIONS IMPACTING CUSTOMER BUSINESS
  • FIGURE 35 VISUAL CLOUD MARKET: BUSINESS MODELS
  • FIGURE 36 LEADING GLOBAL VISUAL CLOUD MARKET VENDORS, BY NUMBER OF INVESTORS AND FUNDING ROUNDS, 2023
  • FIGURE 37 IMPACT OF GEN AI ON VISUAL CLOUD MARKET, 2023
  • FIGURE 38 SERVICES OFFERING SEGMENT TO REGISTER HIGHER CAGR DURING FORECAST PERIOD
  • FIGURE 39 MEDIA PROCESSING & DELIVERY SEGMENT TO REGISTER HIGHEST CAGR DURING FORECAST PERIOD
  • FIGURE 40 MANAGED SERVICES SEGMENT TO GROW AT HIGHER CAGR DURING FORECAST PERIOD
  • FIGURE 41 DEPLOYMENT & INTEGRATION SERVICES SEGMENT TO ACCOUNT FOR HIGHEST CAGR DURING FORECAST PERIOD
  • FIGURE 42 IAAS SEGMENT TO REGISTER HIGHEST CAGR DURING FORECAST PERIOD
  • FIGURE 43 HYBRID CLOUD DEPLOYMENT MODE TO REGISTER HIGHEST CAGR DURING FORECAST PERIOD
  • FIGURE 44 SMALL AND MEDIUM-SIZED ENTERPRISES SEGMENT TO REGISTER HIGHER CAGR DURING FORECAST PERIOD
  • FIGURE 45 MEDIA & ENTERTAINMENT SEGMENT TO ACCOUNT FOR LARGEST MARKET SHARE IN 2024
  • FIGURE 46 NORTH AMERICA TO ACCOUNT FOR LARGEST MARKET DURING FORECAST PERIOD
  • FIGURE 47 NORTH AMERICA: MARKET SNAPSHOT
  • FIGURE 48 ASIA PACIFIC: REGIONAL SNAPSHOT
  • FIGURE 49 OVERVIEW OF STRATEGIES ADOPTED BY KEY VENDORS
  • FIGURE 50 VISUAL CLOUD MARKET: MARKET SHARE ANALYSIS, 2023
  • FIGURE 51 BRANDS COMPARISON/VENDOR PRODUCT LANDSCAPE
  • FIGURE 52 HISTORICAL REVENUE ANALYSIS, 2019–2023 (USD MILLION)
  • FIGURE 53 COMPANY EVALUATION MATRIX FOR KEY PLAYERS: CRITERIA WEIGHTAGE
  • FIGURE 54 VISUAL CLOUD MARKET: COMPANY EVALUATION QUADRANT (KEY PLAYERS), 2023
  • FIGURE 55 VISUAL CLOUD MARKET: COMPANY FOOTPRINT
  • FIGURE 56 VISUAL CLOUD MARKET: COMPANY EVALUATION MATRIX (STARTUPS/SMES), 2023
  • FIGURE 57 COMPANY VALUATION AND FINANCIAL METRICS
  • FIGURE 58 YEAR-TO-DATE (YTD) PRICE TOTAL RETURN AND FIVE-YEAR STOCK BETA OF KEY VENDORS
  • FIGURE 59 MICROSOFT: COMPANY SNAPSHOT
  • FIGURE 60 GOOGLE: COMPANY SNAPSHOT
  • FIGURE 61 IBM: COMPANY SNAPSHOT
  • FIGURE 62 AWS: COMPANY SNAPSHOT
  • FIGURE 63 ORACLE: COMPANY SNAPSHOT
  • FIGURE 64 ZOOM: COMPANY SNAPSHOT
  • FIGURE 65 ALIBABA CLOUD: COMPANY SNAPSHOT
  • FIGURE 66 CISCO: COMPANY SNAPSHOT

The study comprised four main activities to estimate the visual cloud market size. We conducted significant secondary research to gather data on the market, the competing market, and the parent market. The following stage involved conducting primary research to confirm these conclusions and hypotheses and sizing with industry experts throughout the value chain. The overall market size was evaluated using a blend of top-down and bottom-up approach methodologies. After that, we estimated the market sizes of the various visual cloud market segments using the market breakup and data triangulation techniques.

Secondary Research

The size of companies offering visual cloud markets and services was determined based on secondary data from paid and unpaid sources. It was also arrived at by analyzing the product portfolios of major companies and rating the companies based on their performance and quality.

In the secondary research process, various sources were referred to identify and collect information for this study. Secondary sources included annual reports, press releases, and investor presentations of companies; white papers, journals, and certified publications; and articles from recognized authors, directories, and databases. The data was also collected from other secondary sources, such as journals, government websites, blogs, and vendors' websites. Additionally, the spending of various countries on the visual cloud market was extracted from the respective sources. Secondary research was mainly used to obtain the critical information related to the industry's value chain and supply chain to identify the key players based on solutions, services, market classification, and segmentation according to components of the major players, industry trends related to components, users, and regions, and the key developments from both market- and technology-oriented perspectives.

Primary Research

In the primary research process, various primary sources from the supply and demand sides of the visual cloud market were interviewed to obtain qualitative and quantitative information for this study. The primary sources from the supply side included industry experts, such as Chief Executive Officers (CEOs), Vice Presidents (VPs), marketing directors, technology and innovation directors, and related key executives from vendors providing visual cloud offerings, associated service providers; and is operating in the targeted countries. all possible parameters that affect the market covered in this research study have been accounted for, viewed in extensive detail, verified through primary research, and analyzed to arrive at the final quantitative and qualitative data.

After the complete market engineering process (including calculations for market statistics, market breakup, market size estimations, market forecasting, and data triangulation), extensive primary research was conducted to gather information and verify and validate the critical numbers arrived at. The primary research also helped identify and validate the segmentation, industry trends, key players, competitive landscape, and market dynamics, such as drivers, restraints, opportunities, challenges, and key strategies. In the complete market engineering process, the bottom-up approach and several data triangulation methods were extensively used to perform market estimation and market forecasting for the overall market segments and subsegments listed in this report. An extensive qualitative and quantitative analysis of the complete market engineering process was performed to list the key information/insights throughout the report.

Visual Cloud Industry Size, and Share

To know about the assumptions considered for the study, download the pdf brochure

Market Size Estimation

The visual cloud market and related submarkets were estimated and forecasted using top-down and bottom-up methodologies. The bottom-up method was used to determine the market's overall size, using the revenues and product offerings of the major market players. This research ascertained and validated the precise value of the total parent market size through data triangulation techniques and primary interview validation. Next, using percentage splits of the market segments, the overall market size was utilized in the top-down approach to estimate the size of other individual markets.

Top Down and Bottom Up Approach of Visual Cloud Market.

Visual Cloud Industry Top Down and Bottom Up Approach

To know about the assumptions considered for the study, Request for Free Sample Report

The research methodology used to estimate the market size included the following:

  • Primary and secondary research was utilized to determine the revenue contributions of the major market participants in each country after secondary research helped identify them.
  • Throughout the process, critical insights were obtained by conducting in-depth interviews with industry professionals, including directors, CEOs, VPs, and marketing executives, and by reading the annual and financial reports of the top firms in the market.
  • Primary sources were used to verify all percentage splits and breakups, which were calculated using secondary sources.

Data Triangulation

The market was divided into several segments and subsegments using the previously described market size estimation procedures once the overall market size was determined. When required, market breakdown and data triangulation procedures were employed to complete the market engineering process and specify the exact figures for every market segment and subsegment. The data was triangulated by examining several variables and patterns from government entities' supply and demand sides.

Market Definition

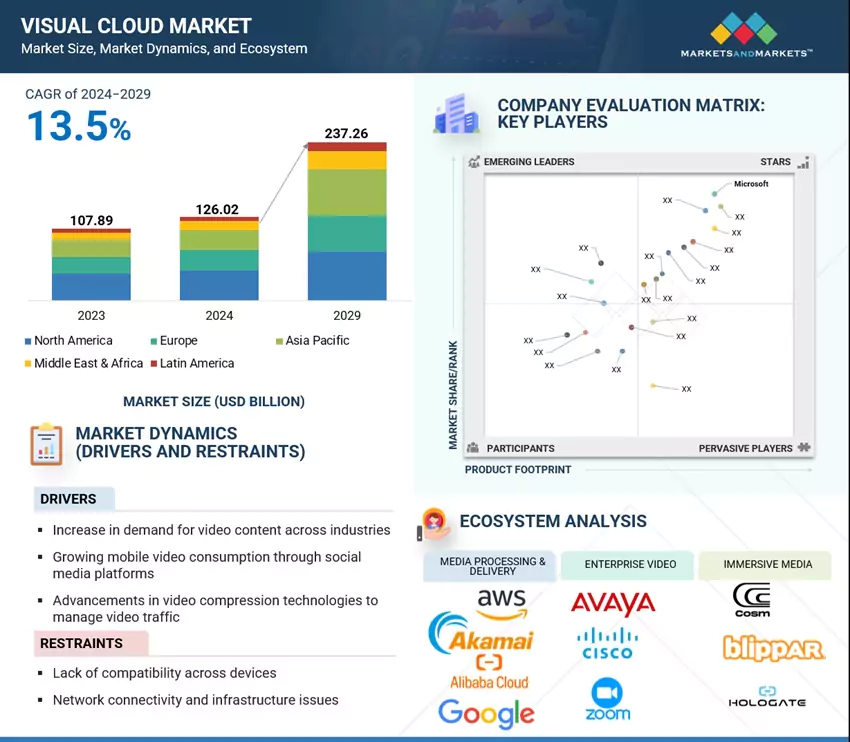
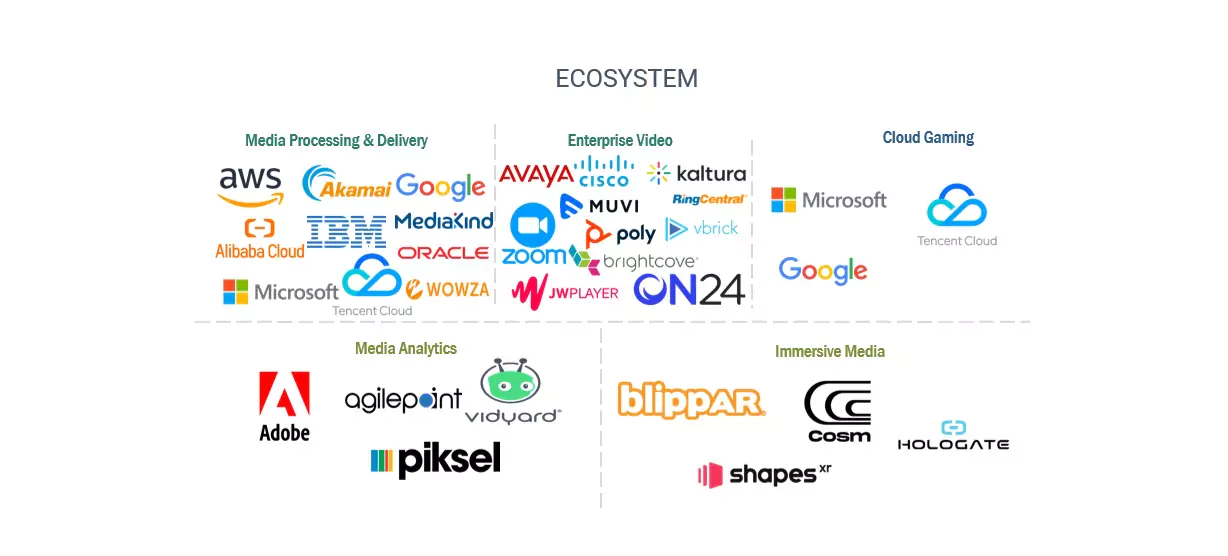
MarketsandMarkets defines visual cloud as a cloud computing sector focused on delivering and processing visual content such as images, videos, and graphics-intensive applications. These services leverage robust cloud infrastructure to handle tasks such as rendering, video encoding, and real-time streaming, enabling high-quality visual experiences over the Internet. Visual cloud solutions are essential for industries such as media and entertainment, gaming, virtual and augmented reality, and remote work, providing scalable and efficient resources without significant local hardware investments. They support applications ranging from video conferencing and virtual desktops to advanced data visualization and cloud gaming.

Key Stakeholders

  • Training and consulting service providers
  • Information Technology (IT) infrastructure providers
  • Visual cloud solutions providers
  • Visual cloud service providers
  • Government organizations and standardization bodies
  • Regional associations
  • Value-added resellers and distributors

Report Objectives

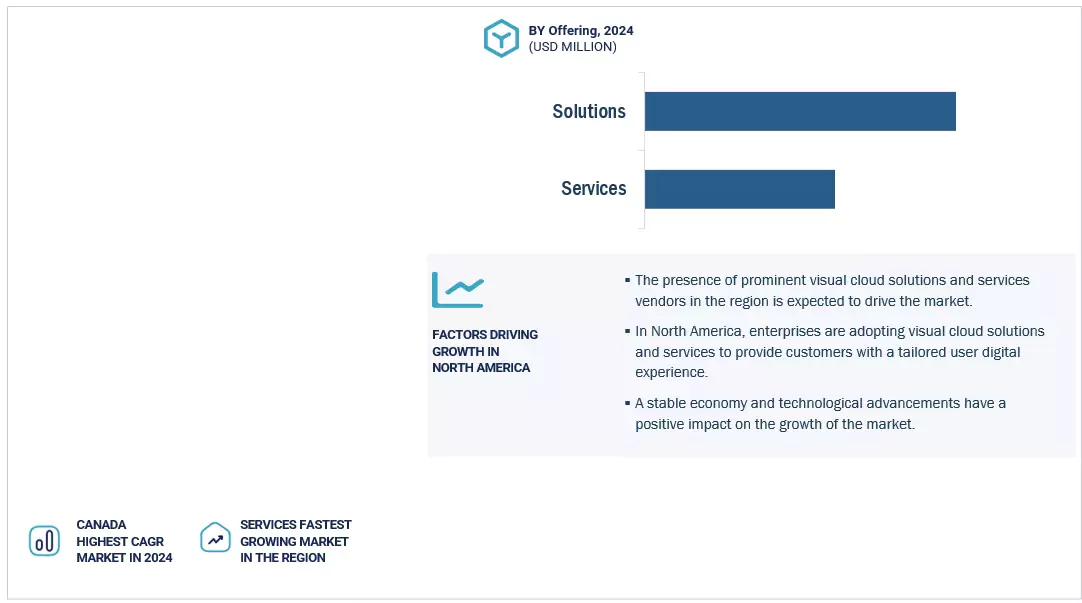
  • To define, describe, and forecast the visual cloud market based on offering, service model, organization size, deployment mode, vertical, and region.
  • To provide detailed information about the significant factors, such as drivers, opportunities, restraints, and challenges, influencing the growth of the market
  • To analyze the opportunities in the market for stakeholders by identifying the high-growth segments of the market
  • To forecast the market size concerning five main regions — North America, Europe, Asia Pacific, the Middle East & Africa, and Latin America
  • To analyze the subsegments of the market concerning individual growth trends, prospects, and contributions to the overall market
  • To profile the market's key players and analyze their size and core competencies comprehensively.
  • To track and analyze the competitive developments, such as product enhancements, product launches, acquisitions, partnerships, and collaborations, in the visual cloud market globally

Available customizations

MarketsandMarkets provides customizations based on the company's unique requirements using market data. The following customization options are available for the report:

Product analysis

  • The product matrix provides a detailed comparison of each company's product portfolio.

Geographic analysis

  • Further breakup of the visual cloud market

Company information

  • Detailed analysis and profiling of five additional market players

Previous Versions of this Report

"Our USP is "providing game-changing business opportunities reports with free customization" - so please feel free to provide us with your specific areas of interest / business challenges in much greater detail !!"

We appreciate your interest in this report. Once you fill out the form, you'll be immediately directed to an exclusive solution tailored to your needs. This high-value offering can help boost your revenue by 30% - a must-see opportunity for anyone looking to maximize growth.


By clicking the "Submit" button, you are agreeing to the Terms of Use and Privacy Policy.

Custom Market Research Services

We Will Customise The Research For You, In Case The Report Listed Above Does Not Meet With Your Requirements

Get 10% Free Customisation

Growth opportunities and latent adjacency in Visual Cloud Market

DMCA.com Protection Status