Wi-Fi 7 Market

Wi-Fi 7 Market by Offering (Hardware, Solutions, and Services), Location Type, Application (Immersive Technologies, IoT & Industry 4.0, Telemedicine), Vertical (Media & Entertainment, Education, Residential, Retail), and Region - Global Forecast to 2030

Report Code: TC 8699 Jun, 2023, by marketsandmarkets.com

[202 Pages Report] The Wi-Fi 7 market is estimated at USD 1.0 billion in 2023 and is projected to reach USD 24.2 billion by 2030, at a CAGR of 57.2% from 2023 to 2030. The primary factor driving the growth of the Wi-Fi 7 market is the increasing demand for data-intensive, low-latency applications and use cases due to pandemic-driven lifestyle changes.

Wi-Fi 7 Market

To know about the assumptions considered for the study, Request for Free Sample Report

Wi-Fi 7 Market

To know about the assumptions considered for the study, download the pdf brochure

Wi-Fi 7 Market Dynamics

Driver: The rising adoption of Internet of Things

The IoT is driving the need for higher data rates and lower latency. As more and more devices are connected to the internet, the amount of data being transferred is increasing exponentially. This strains existing Wi-Fi networks, which cannot always meet the demand. Wi-Fi 7 is designed to address this issue by offering significantly higher data rates and lower latency. The IoT is increasing the demand for more reliable and secure wireless connections. Many IoT devices are used in critical applications, such as healthcare and industrial automation. In these applications, the wireless connection must be reliable and secure. Wi-Fi 7 offers several features that improve reliability and security, such as OFDMA and Target Wake Time (TWT). IoT is creating new opportunities for Wi-Fi 7. For example, Wi-Fi 7 can connect smart home devices like thermostats, lights, and security cameras. It can also connect industrial IoT devices, such as robots and sensors. These new applications are driving demand for Wi-Fi 7 and helping grow the market.

Restraint: High costs of installation

Wi-Fi 7 devices are expected to be more expensive than previous generations due to the increased complexity and cost of the new features and capabilities. This could limit the adoption of Wi-Fi 7 devices, especially in developing countries. The high cost of Wi-Fi 7 devices is a major restraint in the market. Wi-Fi 7 devices are more complex than previous generations of Wi-Fi devices, which makes them more difficult to install. This could lead to higher labor costs for installers.

Opportunity: Deployment of OpenRoaming and Passpoint technology gathering pace

WBA OpenRoaming is a roaming federation service that provides a global automatic and secure Wi-Fi experience. It creates the framework to connect billions of users and things to millions of Wi-Fi networks in the wireless ecosystem without needing logins, registrations, or passwords, facilitating non-stop connectivity and empowering new opportunities in the 5G era. The WBA Annual Industry Report 2023 underlines that the global momentum for WBA OpenRoaming outreached a milestone of one million hotspots in early 2022. Passpoint technology removes the friction associated with onboarding and offboarding within the hotspots. The WBA report states that 62% of service providers, equipment manufacturers, and enterprises globally will have already deployed Passpoint/OpenRoaming technology or are planning to do so by the end of 2023. A further 25% are expected to deploy the technology by 2025. Among the people adopting OpenRoaming technology, 51% consider improving the overall customer experience as its key driver.

Challenge: High probability of spectrum congestion

Spectrum congestion presents a significant challenge for the Wi-Fi 7 market, particularly due to the shared usage of the 6 GHz band with other applications such as radar and weather forecasting. This congestion adversely affects Wi-Fi 7 network performance, reducing data rates, increased latency, and higher packet loss. Consequently, activities requiring significant bandwidth, like streaming videos and online gaming, become difficult, as does real-time communication, such as VoIP calls. Spectrum congestion also leads to dropped calls, interrupted streaming, and other related issues.

Wi-Fi 7 market Ecosystem

The Wi-Fi 7 market comprises several hardware manufacturers, network server providers, service providers, system integrators, platform providers, and end users working together to deliver Wi-Fi 7 solutions for large-scale IoT deployments.

By vertical, the media and entertainment segment holds the largest market size during the forecast period.

Wi-Fi 7, a significant technological advancement, holds immense potential for transforming the media and entertainment industries. By significantly enhancing speed, range, and reliability, Wi-Fi 7 empowers organizations in various ways. It enables seamless streaming of high-quality content, including 4K and 8K videos, without buffering or lag, enabling real-time delivery of premium content to consumers. Moreover, Wi-Fi 7 facilitates the provision of virtual reality and augmented reality experiences, allowing businesses to create immersive environments for their customers. It also revolutionizes gaming by enabling high-speed delivery of gaming content, including the ability to stream games from remote servers to local devices. This eliminates the need for powerful gaming hardware and expands the indoor and outdoor gaming range. Wi-Fi 7 is set to unlock new possibilities and elevate user experiences in these industries.

By location type, the outdoor segment is expected to register the fastest growth rate during the forecast period.

Wi-Fi 7 can provide high-speed wireless connectivity to large crowds at concerts, sporting events, and trade shows. This will allow attendees to stream videos, share photos, and use social media without experiencing any lag or buffering. Wi-Fi 7 can wirelessly connect public venues such as parks, libraries, and train stations to the internet. This will enable users to stay connected while on the move. Wi-Fi 7 can be used to connect a wide range of devices in industrial applications, including sensors, actuators, and control systems. This will enable firms to automate their operations and increase efficiency. Outdoor wireless networking provides a testbed for new Wi-Fi 7 features and capabilities. The harsh conditions of outdoor environments can be a challenge for wireless networks, but they also provide an opportunity to test new technologies and see how they perform in real-world conditions. Wi-Fi 7 vendors are working closely with outdoor wireless networking providers to test and refine new features, and this feedback is helping to shape the development of Wi-Fi 7.

North America is expected to hold the highest growth rate during the forecast period.

The Wi-Fi 7 market in North America is expected to grow significantly in the coming years. The market is driven by the increasing demand for high-speed internet connectivity and the growing popularity of smart devices. North America is a major market for Wi-Fi technology. The region has a large and growing population of smartphone users, and there is a high demand for high-speed internet connectivity in homes and businesses. The increasing popularity of smart devices is also driving the demand for Wi-Fi technology. Smart devices, such as smart TVs, smart speakers, and smart thermostats, require a reliable, high-speed internet connection. The major factors driving the market’s growth are the increasing demand for high-speed internet connectivity, the growing popularity of smart devices, and the introduction of new Wi-Fi 7 devices and services. The key players in the Wi-Fi 7 market in North America are Qualcomm, Broadcom, MediaTek, Intel, and STMicroelectronics. These companies invest heavily in research and development to develop new Wi-Fi 7 chipsets and solutions. They are also partnering with major smartphone manufacturers and service providers to bring Wi-Fi 7 to the market.

Wi-Fi 7 Market  Size, and Share

Market Players:

The major players in the Wi-Fi 7 market are Qualcomm (US), Broadcom (US), TP-Link (China), ZTE (China), Mediatek (Taiwan), Keysight Technologies (US), MaxLinear (US), Huawei (China), Commscope (US), Vantiva (France), LitePoint (US), Rohde & Schwarz (Germany), Intel (US), HFCL (India), Netgear (US), SDMC Technology (China), Senscomm Semiconductor (China), H3C (China), VVDN Technologies (India), Actiontec Electronics (US), ADB Global (Switzerland), Ruijie Networks (China), and Edgewater Wireless Systems (Canada). These players have adopted various growth strategies, such as partnerships, agreements and collaborations, new product launches and enhancements, and acquisitions to expand their footprint in the Wi-Fi 7 market.

Get online access to the report on the World's First Market Intelligence Cloud

  • Easy to Download Historical Data & Forecast Numbers
  • Company Analysis Dashboard for high growth potential opportunities
  • Research Analyst Access for customization & queries
  • Competitor Analysis with Interactive dashboard
  • Latest News, Updates & Trend analysis
Request Sample

Scope of the Report

Report Metrics

Details

Market size available for years

2023-2030

Base year considered

2023

Forecast period

2024–2030

Forecast units

Value (USD) Million/Billion

Segments covered

Offering (Hardware, Solutions, and Services), Location Type, Application, Vertical, and Region

Region covered

North America, Europe, Asia Pacific, and Rest of world

Companies covered

Qualcomm (US), Broadcom (US), TP-Link (China), ZTE (China), Mediatek (Taiwan), Keysight Technologies (US), MaxLinear (US), Huawei (China), Commscope (US), Vantiva (France), LitePoint (US), Rohde & Schwarz (Germany), Intel (US), HFCL (India), Netgear (US), SDMC Technology (China), Senscomm Semiconductor (China), H3C (China), VVDN Technologies (India), Actiontec Electronics (US), ADB Global (Switzerland), Ruijie Networks (China), and Edgewater Wireless Systems (Canada).

This research report categorizes the Wi-Fi 7 market to forecast revenues and analyze trends in each of the following submarkets:

Based on Offering:
  • Hardware
    • System on Chip
    • Access Points
    • Routers
    • Other Hardware
  • Solutions
  • Services
    • Professional Services
    • Managed Services
Based on Location Type:
  • Indoor
  • Outdoor
Based on Application:
  • Immersive Technologies
  • HD Video Streaming and Video Streaming
  • Smart Home Devices
  • IoT and Industry 4.0
  • Telemedicine
  • Public Wi-Fi and Dense Environments
  • Other Applications
Based on Vertical:
  • Retail
  • Manufacturing
  • Media and Entertainment
  • Healthcare and Life Sciences
  • Transportation and Logistics
  • Travel and Hospitality
  • Education
  • Residential
  • Other Verticals
By Region:
  • North America
    • United States (US)
    • Canada
  • Europe
    • United Kingdom (UK)
    • Germany
    • France
    • Rest of Europe
  • Asia Pacific
    • China
    • Japan
    • India
    • South Korea
    • Rest of Asia Pacific
  • Rest of the world

Recent Developments

  • In December 2022, Rohde & Schwarz and Broadcom collaborated to announce the availability of an automated test solution for Broadcom Wi-Fi 7 chipsets.
  • In January 2023, MediaTek introduced Consumer-Ready Wi-Fi 7 Products in product categories, including residential gateways, mesh routers, televisions, streaming devices, smartphones, tablets, laptops, and more at CES 2023.
  • In March 2023, Lounea partnered with TP-Link to become Finland’s first Wi-Fi 7 operator to offer Wi-Fi 7 standards for home wireless networks.

Frequently Asked Questions (FAQ):

To speak to our analyst for a discussion on the above findings, click Speak to Analyst

TABLE OF CONTENTS
 
1 INTRODUCTION (Page No. - 29)
    1.1 STUDY OBJECTIVES 
    1.2 MARKET DEFINITION 
    1.3 STUDY SCOPE 
           1.3.1 MARKET SEGMENTATION
                    FIGURE 1 WI-FI 7 MARKET SEGMENTATION
           1.3.2 REGIONS COVERED
           1.3.3 INCLUSIONS AND EXCLUSIONS
           1.3.4 YEARS CONSIDERED
    1.4 CURRENCY CONSIDERED 
           TABLE 1 USD EXCHANGE RATES, 2020–2022
    1.5 STAKEHOLDERS 
    1.6 RECESSION IMPACT 
 
2 RESEARCH METHODOLOGY (Page No. - 34)
    2.1 RESEARCH DATA 
           FIGURE 2 WI-FI 7 MARKET: RESEARCH DESIGN
           2.1.1 SECONDARY DATA
                    2.1.1.1 Secondary sources
           2.1.2 PRIMARY DATA
                    2.1.2.1 Primary interviews with experts
                    2.1.2.2 List of key primary interview participants
                    2.1.2.3 Breakdown of primary profiles
                    2.1.2.4 Primary sources
                    2.1.2.5 Key industry insights
    2.2 MARKET SIZE ESTIMATION 
           FIGURE 3 APPROACHES USED FOR MARKET SIZE ESTIMATION
           FIGURE 4 MARKET SIZE ESTIMATION METHODOLOGY, APPROACH 1: SUPPLY-SIDE ANALYSIS OF REVENUE FROM PLATFORMS AND SERVICES
           2.2.1 BOTTOM-UP APPROACH
                    2.2.1.1 Approach used for capturing market share using bottom-up analysis (demand side)
                               FIGURE 5 BOTTOM-UP APPROACH
                               FIGURE 6 MARKET SIZE ESTIMATION METHODOLOGY – APPROACH 1, BOTTOM-UP (SUPPLY SIDE): COLLECTIVE REVENUE OF WI-FI 7 VENDORS
           2.2.2 TOP-DOWN APPROACH
                    2.2.2.1 Approach for capturing market share using top-down analysis (supply side)
                               FIGURE 7 TOP-DOWN APPROACH
           2.2.3 WI-FI 7 MARKET ESTIMATION: DEMAND-SIDE ANALYSIS
                    FIGURE 8 MARKET SIZE ESTIMATION METHODOLOGY: DEMAND-SIDE ANALYSIS
    2.3 DATA TRIANGULATION 
           FIGURE 9 DATA TRIANGULATION
    2.4 FACTOR ANALYSIS 
           TABLE 2 FACTOR ANALYSIS
    2.5 RESEARCH ASSUMPTIONS 
    2.6 LIMITATIONS 
    2.7 IMPLICATION OF RECESSION 
 
3 EXECUTIVE SUMMARY (Page No. - 44)
    FIGURE 10 WI-FI 7 MARKET, 2023–2030 (USD MILLION) 
    FIGURE 11 MARKET: BY REGION (2023) 
 
4 PREMIUM INSIGHTS (Page No. - 46)
    4.1 OPPORTUNITIES FOR PLAYERS IN WI-FI 7 MARKET 
           FIGURE 12 EXTREME HIGH THROUGHPUT OFFERED BY WI-FI 7 FOR REAL-TIME APPS TO DRIVE MARKET DURING FORECAST PERIOD
    4.2 MARKET, BY OFFERING 
           FIGURE 13 HARDWARE SEGMENT TO DOMINATE MARKET DURING FORECAST PERIOD
    4.3 MARKET, BY SERVICE 
           FIGURE 14 MANAGED SERVICES SEGMENT TO ACCOUNT FOR HIGHER CAGR DURING FORECAST PERIOD
    4.4 MARKET, BY LOCATION TYPE 
           FIGURE 15 INDOOR LOCATION SEGMENT TO LEAD MARKET DURING FORECAST PERIOD
    4.5 MARKET, TOP THREE APPLICATIONS 
           FIGURE 16 IMMERSIVE TECHNOLOGIES SEGMENT TO ACCOUNT LARGEST MARKET SIZE DURING FORECAST PERIOD
    4.6 MARKET, BY VERTICAL 
           FIGURE 17 MEDIA AND ENTERTAINMENT VERTICAL TO LEAD MARKET DURING FORECAST PERIOD
 
5 MARKET OVERVIEW AND INDUSTRY TRENDS (Page No. - 49)
    5.1 INTRODUCTION 
    5.2 MARKET DYNAMICS 
           FIGURE 18 WI-FI 7 MARKET: DRIVERS, RESTRAINTS, OPPORTUNITIES, AND CHALLENGES
           5.2.1 DRIVERS
                    5.2.1.1 Rising adoption of IoT
                    5.2.1.2 Mitigation of network traffic and interference offered by Wi-Fi 7
                    5.2.1.3 Increasing focus on QoE for end users
                    5.2.1.4 Pandemic-driven lifestyle changes led to growing demand for data-intensive, low-latency applications and use cases
           5.2.2 RESTRAINTS
                    5.2.2.1 High cost of installation
                    5.2.2.2 Stringent government data regulations and guidelines
           5.2.3 OPPORTUNITIES
                    5.2.3.1 Deployment of OpenRoaming and Passpoint technology gathering pace
                    5.2.3.2 Wi-Fi 7 to offer key areas of investment for new connectivity technologies
                    5.2.3.3 Growing adoption of 5G technology
           5.2.4 CHALLENGES
                    5.2.4.1 High probability of spectrum congestion
    5.3 INDUSTRY TRENDS 
           5.3.1 BRIEF HISTORY OF WI-FI 7 TECHNOLOGY
                    FIGURE 19 BRIEF HISTORY OF WI-FI 7
                    5.3.1.1 2009
                    5.3.1.2 2014
                    5.3.1.3 2019
                    5.3.1.4 2024
           5.3.2 COMPARISON BETWEEN WI-FI 6E AND WI-FI 7
           5.3.3 VALUE CHAIN ANALYSIS
                    FIGURE 20 WI-FI 7 MARKET: VALUE CHAIN ANALYSIS
                    5.3.3.1 Government regulatory authorities
                    5.3.3.2 Wi-Fi solution providers
                    5.3.3.3 Service providers
                    5.3.3.4 System integrators
                    5.3.3.5 Original equipment manufacturers
                    5.3.3.6 Customer premises equipment/connectivity hardware providers
                    5.3.3.7 Mobile network operators
           5.3.4 ECOSYSTEM MAPPING
                    FIGURE 21 MARKET ECOSYSTEM/MARKET MAP
                    TABLE 3 WI-FI 7 MARKET: EDGEWATER WIRELESS SYSTEMS SOLUTION PROVIDER
           5.3.5 PATENT ANALYSIS
                    5.3.5.1 Innovation and patent applications
                               FIGURE 22 NUMBER OF TOTAL PATENTS, 2020–2023
                    5.3.5.2 Top applicants
                               FIGURE 23 PATENT APPLICANTS WITH HIGHEST NUMBER OF PATENT APPLICATIONS, 2019–2023
           5.3.6 PRICING ANALYSIS
                    5.3.6.1 Average selling price, by key player
                    5.3.6.2 Average selling price trend
           5.3.7 PORTER’S FIVE FORCE MODEL
                    TABLE 4 IMPACT OF EACH FORCE ON WI-FI 7 MARKET
                    FIGURE 24 PORTER’S FIVE FORCES MODEL: MARKET
                    5.3.7.1 Threat of new entrants
                    5.3.7.2 Threat of substitutes
                    5.3.7.3 Bargaining power of buyers
                    5.3.7.4 Bargaining power of suppliers
                    5.3.7.5 Intensity of competitive rivalry
           5.3.8 ETHICS AND IMPLICATIONS OF WI-FI 7
                    5.3.8.1 Bias and fairness
                    5.3.8.2 Privacy and security
                    5.3.8.3 Intellectual property
                    5.3.8.4 Accountability and responsibility
                    5.3.8.5 Societal and economic impact
           5.3.9 TECHNOLOGY ANALYSIS
                    5.3.9.1 Related technologies
                               5.3.9.1.1 Target Wake time (TWT)
                               5.3.9.1.2 Orthogonal frequency-division multiple access (OFDMA)
                               5.3.9.1.3 Multi-link operation (MLO)
                    5.3.9.2 Adjacent technologies
                               5.3.9.2.1 WiMAX
                               5.3.9.2.2 MulteFire
                               5.3.9.2.3 LTE
                               5.3.9.2.4 5G network
           5.3.10 CURRENT AND EMERGING BUSINESS MODELS
                    5.3.10.1 SaaS model
                    5.3.10.2 Consulting services model
                    5.3.10.3 Revenue sharing model
                    5.3.10.4 Managed services model
           5.3.11 REGULATORY LANDSCAPE
                    5.3.11.1 Regulatory bodies, government agencies, and other organizations
                               TABLE 5 NORTH AMERICA: REGULATORY BODIES, GOVERNMENT AGENCIES, AND OTHER ORGANIZATIONS
                               TABLE 6 EUROPE: REGULATORY BODIES, GOVERNMENT AGENCIES, AND OTHER ORGANIZATIONS
                               TABLE 7 ASIA PACIFIC: LIST OF REGULATORY BODIES, GOVERNMENT AGENCIES, AND OTHER ORGANIZATIONS
                               TABLE 8 ROW: REGULATORY BODIES, GOVERNMENT AGENCIES, AND OTHER ORGANIZATIONS
                    5.3.11.2 North America
                               5.3.11.2.1 US
                               5.3.11.2.2 Canada
                    5.3.11.3 Europe
                    5.3.11.4 Asia Pacific
                               5.3.11.4.1 South Korea
                               5.3.11.4.2 China
                               5.3.11.4.3 India
                    5.3.11.5 Middle East & Africa
                               5.3.11.5.1 UAE
                    5.3.11.6 Latin America
                               5.3.11.6.1 Brazil
                               5.3.11.6.2 Mexico
           5.3.12 KEY CONFERENCES AND EVENTS, 2023–2024
                    TABLE 9 DETAILED LIST OF CONFERENCES AND EVENTS, 2023–2024
           5.3.13 KEY STAKEHOLDERS AND BUYING CRITERIA
                    5.3.13.1 Key stakeholders in buying process
                               FIGURE 25 INFLUENCE OF STAKEHOLDERS ON BUYING PROCESS FOR TOP THREE VERTICALS
                               TABLE 10 INFLUENCE OF STAKEHOLDERS ON BUYING PROCESS FOR TOP THREE VERTICALS
                    5.3.13.2 Buying criteria
                               FIGURE 26 KEY BUYING CRITERIA FOR TOP THREE VERTICALS
                               TABLE 11 KEY BUYING CRITERIA FOR TOP THREE VERTICALS
           5.3.14 TRENDS/DISRUPTIONS IMPACTING BUYERS/CLIENTS IN WI-FI 7 MARKET
                    FIGURE 27 TRENDS/DISRUPTIONS IMPACTING BUYERS/CLIENTS
           5.3.15 USE CASES
                    5.3.15.1 Transportation and logistics
                               5.3.15.1.1 FedEx uses Wi-Fi 7 to automate its warehouses
                    5.3.15.2 Healthcare and life sciences
                               5.3.15.2.1 Cisco uses Wi-Fi 7 to develop new telehealth solutions
           5.3.16 FUTURE LANDSCAPE OF MARKET
                    5.3.16.1 Wi-Fi 7 technology roadmap till 2030
                               5.3.16.1.1 Short-term roadmap (2023–2025)
                               5.3.16.1.2 Mid-term roadmap (2026–2028)
                               5.3.16.1.3 Long-term roadmap (2029–2030)
 
6 WI-FI MARKET, BY OFFERING (Page No. - 73)
    6.1 INTRODUCTION 
           6.1.1 OFFERING: WI-FI 7 MARKET DRIVERS
                    FIGURE 28 SERVICES SEGMENT TO GROW AT HIGHEST CAGR DURING FORECAST PERIOD
                    TABLE 12 MARKET, BY OFFERING, 2023–2030 (USD MILLION)
    6.2 HARDWARE 
           FIGURE 29 ACCESS POINTS SEGMENT TO GROW AT HIGHEST CAGR DURING FORECAST PERIOD
           TABLE 13 MARKET, BY HARDWARE, 2023–2030 (USD MILLION)
           TABLE 14 HARDWARE: MARKET, BY REGION, 2023–2030 (USD MILLION)
           6.2.1 ACCESS POINT
                    6.2.1.1 Facilitates scalability and networking between multiple devices
                               TABLE 15 ACCESS POINTS: MARKET, BY REGION, 2023–2030 (USD MILLION)
           6.2.2 ROUTER
                    6.2.2.1 Enhances connectivity in gaming, streaming, and video conferencing
                               TABLE 16 ROUTERS: MARKET BY REGION, 2023–2030 (USD MILLION)
           6.2.3 SYSTEM ON CHIP
                    6.2.3.1 Improves efficiency of Wi-Fi 7 devices and supports connectivity
                               TABLE 17 SYSTEM ON CHIP: MARKET, BY REGION, 2023–2030 (USD MILLION)
           6.2.4 OTHER HARDWARE
                    6.2.4.1 Extends range of Wi-Fi and manages access points
                               TABLE 18 OTHER HARDWARE: MARKET, BY REGION, 2023–2030 (USD MILLION)
    6.3 SOLUTION 
           6.3.1 EASES DEPLOYMENT AND MANAGEMENT OF WI-FI 7
                    TABLE 19 SOLUTION: WI-FI 7 MARKET, BY REGION, 2023–2030 (USD MILLION)
    6.4 SERVICES 
           FIGURE 30 MANAGED SERVICES SEGMENT TO GROW AT HIGHER CAGR DURING FORECAST PERIOD
           TABLE 20 MARKET, BY SERVICE, 2023–2030 (USD MILLION)
           6.4.1 PROFESSIONAL SERVICES
                    6.4.1.1 Professional services to help businesses and organizations in deployment and configuration of Wi-Fi 7 networks
                               TABLE 21 PROFESSIONAL SERVICES: MARKET, BY REGION, 2023–2030 (USD MILLION)
           6.4.2 MANAGED SERVICES
                    6.4.2.1 Managed services to aid in network monitoring and optimization of Wi-Fi 7 network
                               TABLE 22 MANAGED SERVICES: MARKET, BY REGION, 2023–2030 (USD MILLION)
 
7 WI-FI 7 MARKET, BY LOCATION TYPE (Page No. - 82)
    7.1 INTRODUCTION 
           FIGURE 31 OUTDOOR SEGMENT TO GROW AT HIGHER CAGR DURING FORECAST PERIOD
           7.1.1 LOCATION TYPE: MARKET DRIVERS
                    TABLE 23 MARKET, BY LOCATION TYPE, 2023–2030 (USD MILLION)
    7.2 INDOOR 
           7.2.1 INDOOR WIRELESS NETWORK TO BE MORE SECURE FOR IOT DEVICES
                    TABLE 24 INDOOR: MARKET, BY REGION, 2023–2030 (USD MILLION)
    7.3 OUTDOOR 
           7.3.1 CREATES PUBLIC WI-FI HOTSPOT FOR OUTDOOR SPACE
                    TABLE 25 OUTDOOR: MARKET, BY REGION, 2023–2030 (USD MILLION)
 
8 WI-FI 7 MARKET, BY APPLICATION (Page No. - 86)
    8.1 INTRODUCTION 
           FIGURE 32 TELEMEDICINE SEGMENT TO REGISTER HIGHEST CAGR DURING FORECAST PERIOD
           8.1.1 APPLICATION: MARKET DRIVERS
                    TABLE 26 MARKET, BY APPLICATION, 2023–2030 (USD MILLION)
    8.2 IMMERSIVE TECHNOLOGIES 
           8.2.1 FOCUSED ON IMPROVED SECURITY FEATURES AND TRANSMISSION OF SENSITIVE DATA
                    TABLE 27 IMMERSIVE TECHNOLOGIES: MARKET, BY REGION, 2023–2030 (USD MILLION)
    8.3 HD VIDEO STREAMING AND VIDEO STREAMING 
           8.3.1 FASTER SPEED AND LOWER LATENCY TO ALLOW SMOOTHER STREAMING OF HIGH-QUALITY VIDEO CONTENT
                    TABLE 28 HD VIDEO STREAMING AND VIDEO CONFERENCING: MARKET, BY REGION, 2023–2030 (USD MILLION)
    8.4 SMART HOME DEVICES 
           8.4.1 WI-FI 7 TO ALLOW FASTER COMMUNICATION BETWEEN DEVICES
                    TABLE 29 SMART HOME DEVICES: WI-FI 7 MARKET, BY REGION, 2023–2030 (USD MILLION)
    8.5 IOT AND INDUSTRY 4.0 
           8.5.1 PROVIDES RELIABLE AND SECURE WAY FOR DEVICES TO CONNECT TO INTERNET AND EXCHANGE DATA
                    TABLE 30 IOT AND INDUSTRY 4.0: MARKET, BY REGION, 2023–2030 (USD MILLION)
    8.6 TELEMEDICINE 
           8.6.1 WI-FI 7 TO CONDUCT TELEHEALTH CONSULTATION
                    TABLE 31 TELEMEDICINE: MARKET, BY REGION, 2023–2030 (USD MILLION)
    8.7 PUBLIC WI-FI AND DENSE ENVIRONMENTS 
           8.7.1 INCREASES PRODUCTIVITY IN PUBLIC PLACES BY PROVIDING RELIABLE AND FAST CONNECTION
                    TABLE 32 PUBLIC WI-FI AND DENSE ENVIRONMENTS: MARKET, BY REGION, 2023–2030 (USD MILLION)
    8.8 OTHER APPLICATIONS 
           8.8.1 NEW SECURITY FEATURES AVAILABLE IN WI-FI 7 USING LATEST VERSION OF WPA
                    TABLE 33 OTHER APPLICATIONS: MARKET, BY REGION, 2023–2030 (USD MILLION)
 
9 WI-FI 7 MARKET, BY VERTICAL (Page No. - 94)
    9.1 INTRODUCTION 
           FIGURE 33 HEALTHCARE AND LIFE SCIENCES VERTICAL TO REGISTER HIGHEST CAGR DURING FORECAST PERIOD
           9.1.1 VERTICAL: MARKET DRIVERS
                    TABLE 34 MARKET, BY VERTICAL, 2023–2030 (USD MILLION)
    9.2 MANUFACTURING 
           9.2.1 USED TO TRANSMIT DATA FROM MACHINE VISION SYSTEMS TO COMPUTERS
           9.2.2 MANUFACTURING: WI-FI 7 USE CASES
                    9.2.2.1 Predictive maintenance
                    9.2.2.2 Improved reliability and range
                               TABLE 35 MANUFACTURING: WI-FI 7 MARKET, BY REGION, 2023–2030 (USD MILLION)
    9.3 MEDIA AND ENTERTAINMENT 
           9.3.1 WI-FI 7 TO PROVIDE SMOOTH VR AND AR EXPERIENCE TO USERS
           9.3.2 MEDIA AND ENTERTAINMENT: WI-FI 7 USE CASES
                    9.3.2.1 Cloud gaming
                    9.3.2.2 Faster video streaming and low latency
                               TABLE 36 MEDIA AND ENTERTAINMENT: MARKET, BY REGION, 2023–2030 (USD MILLION)
    9.4 HEALTHCARE AND LIFE SCIENCES 
           9.4.1 WI-FI 7 TO CONTROL SURGICAL ROBOTS ASSISTING SURGEONS IN PERFORMING PRECISE AND ACCURATE SURGERIES
           9.4.2 HEALTHCARE AND LIFE SCIENCES: WI-FI 7 USE CASES
                    9.4.2.1 Remote patient monitoring
                    9.4.2.2 Automated drug dispensing
                    9.4.2.3 Operating room equipment
                               TABLE 37 HEALTHCARE AND LIFE SCIENCES: MARKET, BY REGION, 2023–2030 (USD MILLION)
    9.5 TRAVEL AND HOSPITALITY 
           9.5.1 WI-FI 7 TO PROVIDE VR TOURS OF HOTELS, RESTAURANTS, AND OTHER TRAVEL DESTINATIONS
           9.5.2 TRAVEL AND HOSPITALITY: WI-FI 7 USE CASES
                    9.5.2.1 Reduced congestion and improved security
                    9.5.2.2 Increased bandwidth and better streaming quality
                               TABLE 38 TRAVEL AND HOSPITALITY: MARKET, BY REGION, 2023–2030 (USD MILLION)
    9.6 TRANSPORTATION AND LOGISTICS 
           9.6.1 USED TO AUTOMATE LOADING AND UNLOADING OF VEHICLES
           9.6.2 TRANSPORTATION AND LOGISTICS: WI-FI 7 USE CASES
                    9.6.2.1 Fleet management
                    9.6.2.2 Warehouse automation
                    9.6.2.3 Freight transportation
                               TABLE 39 TRANSPORTATION AND LOGISTICS: MARKET, BY REGION, 2023–2030 (USD MILLION)
    9.7 RETAIL 
           9.7.1 WI-FI 7 TO PROVIDE AR SHOPPING EXPERIENCES
           9.7.2 RETAIL: WI-FI 7 USE CASES
                    9.7.2.1 In-store customer experience
                    9.7.2.2 Ecommerce fulfillment
                               TABLE 40 RETAIL: MARKET, BY REGION, 2023–2030 (USD MILLION)
    9.8 EDUCATION 
           9.8.1 NEW CAPABILITIES OF WI-FI 7 TO MAKE IT TOP PERFORMER ON CAMPUSES AND CLASSROOMS OF COLLEGES AND UNIVERSITIES
           9.8.2 EDUCATION: WI-FI 7 USE CASES
                    9.8.2.1 Classroom instruction
                    9.8.2.2 Administrative tasks
                               TABLE 41 EDUCATION: WI-FI 7 MARKET, BY REGION, 2023–2030 (USD MILLION)
    9.9 RESIDENTIAL 
           9.9.1 WI-FI 7 TO HELP RESIDENTS BE MORE PRODUCTIVE BY PROVIDING RELIABLE AND CONSISTENT CONNECTION FOR WORK-FROM-HOME ACTIVITIES
           9.9.2 RESIDENTIAL: WI-FI 7 USE CASES
                    9.9.2.1 Smart home devices
                    9.9.2.2 Streaming high-definition (HD) or 4K video
                               TABLE 42 RESIDENTIAL: MARKET, BY REGION, 2023–2030 (USD MILLION)
    9.10 OTHER VERTICALS 
           9.10.1 WI-FI 7 SOLUTIONS AND SERVICES OFFER GOVERNMENT ORGANIZATIONS HIGH-PERFORMANCE, SECURE, AND CONSTANTLY MONITORED NETWORKING ENVIRONMENT
           9.10.2 OTHER VERTICALS: WI-FI 7 USE CASES
                    9.10.2.1 Real-time engagement
                    9.10.2.2 Business operations
                    9.10.2.3 Quick response to emergencies
                    9.10.2.4 Improved efficiency of government operations
                    9.10.2.5 Unmanned aerial vehicles (UAVs)
                    9.10.2.6 Command and control (C2) systems
                    TABLE 43 OTHER VERTICALS: MARKET, BY REGION, 2023–2030 (USD MILLION)
 
10 WI-FI 7 MARKET, BY REGION (Page No. - 106)
     10.1 INTRODUCTION 
               TABLE 44 MARKET, BY REGION, 2023–2030 (USD MILLION)
     10.2 NORTH AMERICA 
             10.2.1 NORTH AMERICA: RECESSION IMPACT
             10.2.2 NORTH AMERICA: MARKET DRIVERS
                       FIGURE 34 NORTH AMERICA: WI-FI 7 MARKET SNAPSHOT
                       TABLE 45 NORTH AMERICA: MARKET, BY OFFERING, 2023–2030 (USD MILLION)
                       TABLE 46 NORTH AMERICA: MARKET, BY HARDWARE, 2023–2030 (USD MILLION)
                       TABLE 47 NORTH AMERICA: MARKET, BY SERVICE, 2023–2030 (USD MILLION)
                       TABLE 48 NORTH AMERICA: MARKET, BY LOCATION TYPE, 2023–2030 (USD MILLION)
                       TABLE 49 MARKET, BY APPLICATION, 2023–2030 (USD MILLION)
                       TABLE 50 NORTH AMERICA: MARKET, BY VERTICAL, 2023–2030 (USD MILLION)
                       TABLE 51 NORTH AMERICA: MARKET, BY COUNTRY, 2023–2030 (USD MILLION)
             10.2.3 US
                       10.2.3.1 Growing demand for high-speed wireless connectivity
                                   TABLE 52 US: WI-FI 7 MARKET, BY OFFERING, 2023–2030 (USD MILLION)
                                   TABLE 53 US: MARKET, BY HARDWARE, 2023–2030 (USD MILLION)
                                   TABLE 54 US: MARKET, BY SERVICE, 2023–2030 (USD MILLION)
                                   TABLE 55 US: MARKET, BY LOCATION TYPE, 2023–2030 (USD MILLION)
                                   TABLE 56 US: MARKET, BY APPLICATION, 2023–2030 (USD MILLION)
                                   TABLE 57 US: MARKET, BY VERTICAL, 2023–2030 (USD MILLION)
             10.2.4 CANADA
                       10.2.4.1 Use of carriers to deploy Wi-Fi 7 networks
                                   TABLE 58 CANADA: WI-FI 7 MARKET, BY OFFERING, 2023–2030 (USD MILLION)
                                   TABLE 59 CANADA: MARKET, BY HARDWARE, 2023–2030 (USD MILLION)
                                   TABLE 60 CANADA: MARKET, BY SERVICE, 2023–2030 (USD MILLION)
                                   TABLE 61 CANADA: MARKET, BY LOCATION TYPE, 2023–2030 (USD MILLION)
                                   TABLE 62 CANADA: MARKET, BY APPLICATION, 2023–2030 (USD MILLION)
                                   TABLE 63 CANADA: MARKET, BY VERTICAL, 2023–2030 (USD MILLION)
     10.3 EUROPE 
             10.3.1 EUROPE: RECESSION IMPACT
             10.3.2 EUROPE: MARKET DRIVERS
                       TABLE 64 EUROPE: WI-FI 7 MARKET, BY OFFERING, 2023–2030 (USD MILLION)
                       TABLE 65 EUROPE: MARKET, BY HARDWARE, 2023–2030 (USD MILLION)
                       TABLE 66 EUROPE: MARKET, BY SERVICE, 2023–2030 (USD MILLION)
                       TABLE 67 EUROPE: MARKET, BY LOCATION TYPE, 2023–2030 (USD MILLION)
                       TABLE 68 EUROPE: MARKET, BY APPLICATION, 2023–2030 (USD MILLION)
                       TABLE 69 EUROPE: MARKET, BY VERTICAL, 2023–2030 (USD MILLION)
                       TABLE 70 EUROPE: MARKET, BY COUNTRY, 2023–2030 (USD MILLION)
             10.3.3 UK
                       10.3.3.1 Growing adoption of smart devices
                                   TABLE 71 UK: WI-FI 7 MARKET, BY OFFERING, 2023–2030 (USD MILLION)
                                   TABLE 72 UK: MARKET, BY HARDWARE, 2023–2030 (USD MILLION)
                                   TABLE 73 UK: MARKET, BY SERVICE, 2023–2030 (USD MILLION)
                                   TABLE 74 UK: MARKET, BY LOCATION TYPE, 2023–2030 (USD MILLION)
                                   TABLE 75 UK: MARKET, BY APPLICATION, 2023–2030 (USD MILLION)
                                   TABLE 76 UK: MARKET, BY VERTICAL, 2023–2030 (USD MILLION)
             10.3.4 GERMANY
                       10.3.4.1 Advancements in wireless technology to show high impact on economy
                                   TABLE 77 GERMANY: WI-FI 7 MARKET, BY OFFERING, 2023–2030 (USD MILLION)
                                   TABLE 78 GERMANY: MARKET, BY HARDWARE, 2023–2030 (USD MILLION)
                                   TABLE 79 GERMANY: MARKET, BY SERVICE, 2023–2030 (USD MILLION)
                                   TABLE 80 GERMANY: MARKET, BY LOCATION TYPE, 2023–2030 (USD MILLION)
                                   TABLE 81 GERMANY: MARKET, BY APPLICATION, 2023–2030 (USD MILLION)
                                   TABLE 82 GERMANY: MARKET, BY VERTICAL, 2023–2030 (USD MILLION)
             10.3.5 REST OF EUROPE
                       10.3.5.1 Highly developed wireless networking and connectivity infrastructure
     10.4 ASIA PACIFIC 
             10.4.1 ASIA PACIFIC: RECESSION IMPACT
             10.4.2 ASIA PACIFIC: MARKET DRIVERS
                       FIGURE 35 ASIA PACIFIC: WI-FI 7 MARKET SNAPSHOT
                       TABLE 83 ASIA PACIFIC: MARKET, BY OFFERING, 2023–2030 (USD MILLION)
                       TABLE 84 ASIA PACIFIC: MARKET, BY HARDWARE, 2023–2030 (USD MILLION)
                       TABLE 85 ASIA PACIFIC: MARKET, BY SERVICE, 2023–2030 (USD MILLION)
                       TABLE 86 ASIA PACIFIC: MARKET, BY LOCATION TYPE, 2023–2030 (USD MILLION)
                       TABLE 87 ASIA PACIFIC: MARKET, BY APPLICATION, 2023–2030 (USD MILLION)
                       TABLE 88 ASIA PACIFIC: MARKET, BY VERTICAL, 2023–2030 (USD MILLION)
                       TABLE 89 ASIA PACIFIC: MARKET, BY COUNTRY, 2023–2030 (USD MILLION)
             10.4.3 CHINA
                       10.4.3.1 Internet Plus program and other government initiatives to boost market
                                   TABLE 90 CHINA: WI-FI 7 MARKET, BY OFFERING, 2023–2030 (USD MILLION)
                                   TABLE 91 CHINA: MARKET, BY HARDWARE, 2023–2030 (USD MILLION)
                                   TABLE 92 CHINA: MARKET, BY SERVICE, 2023–2030 (USD MILLION)
                                   TABLE 93 CHINA: MARKET, BY LOCATION TYPE, 2023–2030 (USD MILLION)
                                   TABLE 94 CHINA: MARKET, BY APPLICATION, 2023–2030 (USD MILLION)
                                   TABLE 95 CHINA: MARKET, BY VERTICAL, 2023–2030 (USD MILLION)
             10.4.4 INDIA
                       10.4.4.1 Large and growing pool of skilled engineers and technicians well-positioned to develop and deploy Wi-Fi 7 networks
                                   TABLE 96 INDIA: WI-FI 7 MARKET, BY OFFERING, 2023–2030 (USD MILLION)
                                   TABLE 97 INDIA: MARKET, BY HARDWARE, 2023–2030 (USD MILLION)
                                   TABLE 98 INDIA: MARKET, BY SERVICE, 2023–2030 (USD MILLION)
                                   TABLE 99 INDIA: MARKET, BY LOCATION TYPE, 2023–2030 (USD MILLION)
                                   TABLE 100 INDIA: MARKET, BY APPLICATION, 2023–2030 (USD MILLION)
                                   TABLE 101 INDIA: MARKET, BY VERTICAL, 2023–2030 (USD MILLION)
             10.4.5 JAPAN
                       10.4.5.1 Growing popularity of mobile devices
             10.4.6 SOUTH KOREA
                       10.4.6.1 Wi-Fi 7 to usher in new era of Korean innovation
             10.4.7 REST OF ASIA PACIFIC
                       10.4.7.1 Increasing demand for high-speed internet access in homes and businesses
     10.5 REST OF WORLD 
             10.5.1 REST OF WORLD: RECESSION IMPACT
             10.5.2 REST OF WORLD: MARKET DRIVERS
                       TABLE 102 REST OF WORLD: WI-FI 7 MARKET, BY OFFERING, 2023–2030 (USD MILLION)
                       TABLE 103 REST OF WORLD: MARKET, BY HARDWARE, 2023–2030 (USD MILLION)
                       TABLE 104 REST OF WORLD: MARKET, BY SERVICE, 2023–2030 (USD MILLION)
                       TABLE 105 REST OF WORLD: MARKET, BY LOCATION TYPE, 2023–2030 (USD MILLION)
                       TABLE 106 REST OF WORLD: MARKET, BY APPLICATION, 2023–2030 (USD MILLION)
                       TABLE 107 REST OF WORLD: MARKET, BY VERTICAL, 2023–2030 (USD MILLION)
 
11 COMPETITIVE LANDSCAPE (Page No. - 139)
     11.1 INTRODUCTION 
     11.2 STRATEGIES ADOPTED BY KEY PLAYERS 
               TABLE 108 OVERVIEW OF STRATEGIES ADOPTED BY KEY PLAYERS
     11.3 HISTORICAL REVENUE ANALYSIS 
               FIGURE 36 HISTORICAL REVENUE ANALYSIS OF KEY PLAYERS, 2020–2022 (USD MILLION)
     11.4 MARKET SHARE ANALYSIS OF KEY PLAYERS 
               TABLE 109 WI-FI 7 MARKET: DEGREE OF COMPETITION
     11.5 COMPETITIVE BENCHMARKING 
               TABLE 110 COMPETITIVE BENCHMARKING OF KEY PLAYERS
     11.6 COMPANY EVALUATION MATRIX METHODOLOGY FOR KEY PLAYERS 
               FIGURE 37 COMPANY EVALUATION MATRIX FOR KEY PLAYERS: CRITERIA WEIGHTAGE
     11.7 COMPANY EVALUATION MATRIX FOR KEY PLAYERS 
             11.7.1 STARS
             11.7.2 EMERGING LEADERS
             11.7.3 PERVASIVE PLAYERS
             11.7.4 PARTICIPANTS
                       FIGURE 38 EVALUATION QUADRANT MATRIX FOR KEY PLAYERS, 2023
     11.8 COMPETITIVE SCENARIO 
             11.8.1 PRODUCT LAUNCHES
                       TABLE 111 PRODUCT LAUNCHES, 2021–2023
             11.8.2 DEALS
                       TABLE 112 DEALS, 2020–2023
             11.8.3 OTHERS
                       TABLE 113 OTHERS
     11.9 WI-FI 7 PRODUCT BENCHMARKING 
             11.9.1 PROMINENT WI-FI 7 HARDWARE DEVICES
                       TABLE 114 COMPARATIVE ANALYSIS OF PROMINENT WI-FI 7 HARDWARE DEVICES
                       11.9.1.1 Qualcomm FastConnect 7800
                       11.9.1.2 MediaTek Filogic 880 and Filogic 380
                       11.9.1.3 Broadcom BCM6726
                       11.9.1.4 Netgear Nighthawk Tri-Band Wi-Fi 7 Router
                       11.9.1.5 ZTE AX8600
             11.9.2 PROMINENT WI-FI 7 TESTING PLATFORMS
                       TABLE 115 COMPARATIVE ANALYSIS OF PROMINENT WI-FI 7 TESTING PLATFORMS
                       11.9.2.1 Rohde & Schwarz CMW500
                       11.9.2.2 Keysight Wi-Fi 7 Network Simulator
                       11.9.2.3 Qualcomm Wi-Fi 7 Test Suite
                       11.9.2.4 LitePoint IQxel-MX Test Platform
     11.1 VALUATION AND FINANCIAL METRICS OF KEY WI-FI 7 VENDORS 
               FIGURE 39 VALUATION AND FINANCIAL METRICS OF KEY WI-FI 7 VENDORS
 
12 COMPANY PROFILES (Page No. - 150)
(Business Overview, Products/Solutions/Services offered, Recent Developments, Deals, MnM view, Key strengths, Strategic choices, Weakness and competitive threats)*
     12.1 MAJOR PLAYERS 
             12.1.1 QUALCOMM
                       TABLE 116 QUALCOMM: BUSINESS OVERVIEW
                       FIGURE 40 QUALCOMM: COMPANY SNAPSHOT
                       TABLE 117 QUALCOMM: PRODUCTS/SOLUTIONS/SERVICES OFFERED
                       TABLE 118 QUALCOMM: PRODUCT LAUNCHES AND ENHANCEMENTS
                       TABLE 119 QUALCOMM: DEALS
             12.1.2 BROADCOM
                       TABLE 120 BROADCOM: BUSINESS OVERVIEW
                       FIGURE 41 BROADCOM: COMPANY SNAPSHOT
                       TABLE 121 BROADCOM: PRODUCTS/SOLUTIONS/SERVICES OFFERED
                       TABLE 122 BROADCOM: PRODUCT LAUNCHES AND ENHANCEMENTS
                       TABLE 123 BROADCOM: DEALS
             12.1.3 ZTE
                       TABLE 124 ZTE: BUSINESS OVERVIEW
                       FIGURE 42 ZTE: COMPANY SNAPSHOT
                       TABLE 125 ZTE: PRODUCTS/SOLUTIONS/SERVICES OFFERED
                       TABLE 126 ZTE: PRODUCT LAUNCHES AND ENHANCEMENTS
             12.1.4 MEDIATEK
                       TABLE 127 MEDIATEK: BUSINESS OVERVIEW
                       FIGURE 43 MEDIATEK: COMPANY SNAPSHOT
                       TABLE 128 MEDIATEK: PRODUCTS/SOLUTIONS/SERVICES OFFERED
                       TABLE 129 MEDIATEK: PRODUCT LAUNCHES AND ENHANCEMENTS
                       TABLE 130 MEDIATEK: DEALS
             12.1.5 TP-LINK
                       TABLE 131 TP-LINK: BUSINESS OVERVIEW
                       TABLE 132 TP-LINK: PRODUCTS/SOLUTIONS/SERVICES OFFERED
                       TABLE 133 TP-LINK: PRODUCT LAUNCHES AND ENHANCEMENTS
                       TABLE 134 TP-LINK: DEALS
             12.1.6 COMMSCOPE
                       TABLE 135 COMMSCOPE: BUSINESS OVERVIEW
                       FIGURE 44 COMMSCOPE: COMPANY SNAPSHOT
                       TABLE 136 COMMSCOPE: PRODUCTS/SOLUTIONS/SERVICES OFFERED
                       TABLE 137 COMMSCOPE: PRODUCT LAUNCHES AND ENHANCEMENTS
             12.1.7 INTEL
                       TABLE 138 INTEL: BUSINESS OVERVIEW
                       FIGURE 45 INTEL: COMPANY SNAPSHOT
                       TABLE 139 INTEL: PRODUCTS/SOLUTIONS/SERVICES OFFERED
                       TABLE 140 INTEL: DEALS
             12.1.8 HFCL
                       TABLE 141 HFCL: BUSINESS OVERVIEW
                       FIGURE 46 HFCL: COMPANY SNAPSHOT
                       TABLE 142 HFCL: PRODUCTS/SOLUTIONS/SERVICES OFFERED
                       TABLE 143 HFCL: PRODUCT LAUNCHES AND ENHANCEMENTS
                       TABLE 144 HFCL: DEALS
             12.1.9 NETGEAR
                       TABLE 145 NETGEAR: BUSINESS OVERVIEW
                       FIGURE 47 NETGEAR: COMPANY SNAPSHOT
                       TABLE 146 NETGEAR: PRODUCTS/SOLUTIONS/SERVICES OFFERED
                       TABLE 147 NETGEAR: PRODUCT LAUNCHES AND ENHANCEMENTS
             12.1.10 VANTIVA
                       TABLE 148 VANTIVA: BUSINESS OVERVIEW
                       FIGURE 48 VANTIVA: COMPANY SNAPSHOT
                       TABLE 149 VANTIVA: PRODUCTS/SOLUTIONS/SERVICES OFFERED
                       TABLE 150 VANTIVA: PRODUCT LAUNCHES AND ENHANCEMENTS
             12.1.11 VVDN TECHNOLOGIES
                       TABLE 151 VVDN TECHNOLOGIES: BUSINESS OVERVIEW
                       TABLE 152 VVDN TECHNOLOGIES: PRODUCTS/SOLUTIONS/SERVICES OFFERED
                       TABLE 153 VVDN TECHNOLOGIES: OTHERS
             12.1.12 MAXLINEAR
             12.1.13 ACTIONTEC ELECTRONICS
             12.1.14 H3C
             12.1.15 KEYSIGHT TECHNOLOGIES
             12.1.16 ROHDE & SCHWARZ
             12.1.17 HUAWEI
             12.1.18 LITEPOINT
             12.1.19 ADB GLOBAL
             12.1.20 SDMC TECHNOLOGY
             12.1.21 SENSCOMM SEMICONDUCTOR
             12.1.22 RUIJIE NETWORKS
             12.1.23 EDGEWATER WIRELESS SYSTEMS
*Details on Business Overview, Products/Solutions/Services offered, Recent Developments, Deals, MnM view, Key strengths, Strategic choices, Weakness and competitive threats might not be captured in case of unlisted companies.
 
13 ADJACENT/RELATED MARKETS (Page No. - 186)
     13.1 INTRODUCTION 
     13.2 SD-WAN MARKET 
             13.2.1 MARKET DEFINITION
             13.2.2 MARKET OVERVIEW
             13.2.3 SD-WAN MARKET, BY COMPONENT
                       TABLE 154 SD-WAN MARKET, BY COMPONENT, 2016–2021 (USD MILLION)
                       TABLE 155 SD-WAN MARKET, BY COMPONENT, 2022–2027 (USD MILLION)
                       TABLE 156 SOLUTIONS: SD-WAN MARKET, BY TYPE, 2016–2021 (USD MILLION)
                       TABLE 157 SOLUTIONS: SD-WAN MARKET, BY TYPE, 2022–2027 (USD MILLION)
                       TABLE 158 SERVICES: SD-WAN MARKET, BY TYPE, 2016–2021 (USD MILLION)
                       TABLE 159 SERVICES: SD-WAN MARKET, BY TYPE, 2022–2027 (USD MILLION)
             13.2.4 SD-WAN MARKET, BY DEPLOYMENT MODE
                       TABLE 160 SD-WAN MARKET, BY DEPLOYMENT MODE, 2016–2021 (USD MILLION)
                       TABLE 161 SD-WAN MARKET, BY DEPLOYMENT MODE, 2022–2027 (USD MILLION)
             13.2.5 SD-WAN MARKET, BY ORGANIZATION SIZE
                       TABLE 162 SD-WAN MARKET, BY ORGANIZATION SIZE, 2016–2021 (USD MILLION)
                       TABLE 163 SD-WAN MARKET, BY ORGANIZATION SIZE, 2022–2027 (USD MILLION)
             13.2.6 SD-WAN MARKET, BY END USER
                       TABLE 164 SD-WAN MARKET, BY END USER, 2016–2021 (USD MILLION)
                       TABLE 165 SD-WAN MARKET, BY END USER, 2022–2027 (USD MILLION)
                       TABLE 166 SD-WAN MARKET, BY VERTICAL, 2016–2021 (USD MILLION)
                       TABLE 167 SD-WAN MARKET, BY VERTICAL, 2022–2027 (USD MILLION)
             13.2.7 SD-WAN MARKET, BY REGION
                       TABLE 168 SD-WAN MARKET, BY REGION, 2016–2021 (USD MILLION)
                       TABLE 169 SD-WAN MARKET, BY REGION, 2022–2027 (USD MILLION)
     13.3 WI-FI AS A SERVICE MARKET 
             13.3.1 MARKET DEFINITION
             13.3.2 MARKET OVERVIEW
             13.3.3 WI-FI AS A SERVICE MARKET, BY SOLUTION
                       TABLE 170 WI-FI AS A SERVICE MARKET, BY SOLUTION, 2017–2020 (USD MILLION)
                       TABLE 171 WI-FI AS A SERVICE MARKET, BY SOLUTION, 2021–2026 (USD MILLION)
             13.3.4 WI-FI AS A SERVICE MARKET, BY LOCATION TYPE
                       TABLE 172 WI-FI AS A SERVICE MARKET, BY LOCATION TYPE, 2017–2020 (USD MILLION)
                       TABLE 173 WI-FI AS A SERVICE MARKET, BY LOCATION TYPE, 2021–2026 (USD MILLION)
             13.3.5 WI-FI AS A SERVICE MARKET, BY ORGANIZATION SIZE
                       TABLE 174 WI-FI AS A SERVICE MARKET, BY ORGANIZATION SIZE, 2017–2020 (USD MILLION)
                       TABLE 175 WI-FI AS A SERVICE MARKET, BY ORGANIZATION SIZE, 2021–2026 (USD MILLION)
             13.3.6 WI-FI AS A SERVICE MARKET, BY VERTICAL
                       TABLE 176 WI-FI AS A SERVICE MARKET, BY VERTICAL, 2017–2020 (USD MILLION)
                       TABLE 177 WI-FI AS A SERVICE MARKET, BY VERTICAL, 2021–2026 (USD MILLION)
             13.3.7 WI-FI AS A SERVICE MARKET, BY REGION
                       TABLE 178 WI-FI AS A SERVICE MARKET, BY REGION, 2017–2020 (USD MILLION)
                       TABLE 179 WI-FI AS A SERVICE MARKET, BY REGION, 2021–2026 (USD MILLION)
 
14 APPENDIX (Page No. - 196)
     14.1 DISCUSSION GUIDE 
     14.2 KNOWLEDGESTORE: MARKETSANDMARKETS’ SUBSCRIPTION PORTAL 
     14.3 CUSTOMIZATION OPTIONS  
     14.4 RELATED REPORTS 
     14.5 AUTHOR DETAILS 

The Wi-Fi 7 market study extensively used secondary sources, directories, and databases, such as D&B Hoovers, Bloomberg Businessweek, and Factiva. Other market-related sources, such as journals and white papers from industry associations, were also considered while conducting the secondary research. Primary sources were mainly industry experts from core and related industries, preferred system developers, service providers, System Integrators (SIs), resellers, partners, and organizations related to the various segments of the industry’s value chain. In-depth interviews were conducted with various primary respondents to obtain and verify critical qualitative and quantitative information and assess the market’s prospects. These respondents included key industry participants, subject matter experts, C-level executives of key market players, and industry consultants.

Secondary Research

In the secondary research process, various secondary sources were referred to for identifying and collecting information for the study. The secondary sources included annual reports, press releases, investor presentations of companies, white papers, certified publications, and articles from recognized associations and government publishing sources. Several journals, such as the Institute of Electrical and Electronics Engineers (IEEE), ScienceDirect, ResearchGate, Academic Journals, Scientific.Net, and various telecom and Wi-Fi 7 associations/forums, Wi-Fi Alliance, and 3GPP were also referred. Secondary research was used to obtain key information about industry insights, the market’s monetary chain, the overall pool of key players, market classification, and in-depth segmentation according to industry trends, regional markets, and key developments.

Primary Research

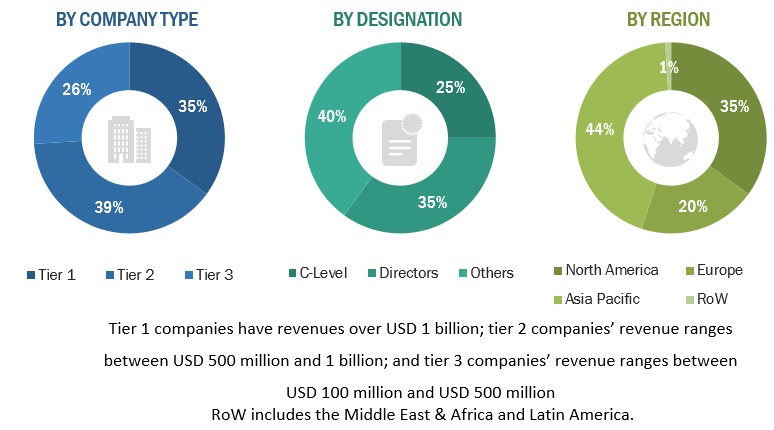
In the primary research process, various primary sources from both supply and demand sides were interviewed to obtain qualitative and quantitative information for the report. The primary sources from the supply side included industry experts, such as Chief Executive Officers (CEOs), Chief Technology Officers (CTOs), Chief Operating Officers (COOs), Vice Presidents (VPs), marketing directors, technology and innovation directors, and related key executives from various key companies and organizations operating in the Wi-Fi 7 market. The primary sources from the demand side included Wi-Fi 7 end users, network administrators/consultants/specialists, Chief Information Officers (CIOs), and subject-matter experts from enterprises and government associations.

The breakup of Primary Research:
Wi-Fi 7 Market  Size, and Share

To know about the assumptions considered for the study, download the pdf brochure

Market Size Estimation

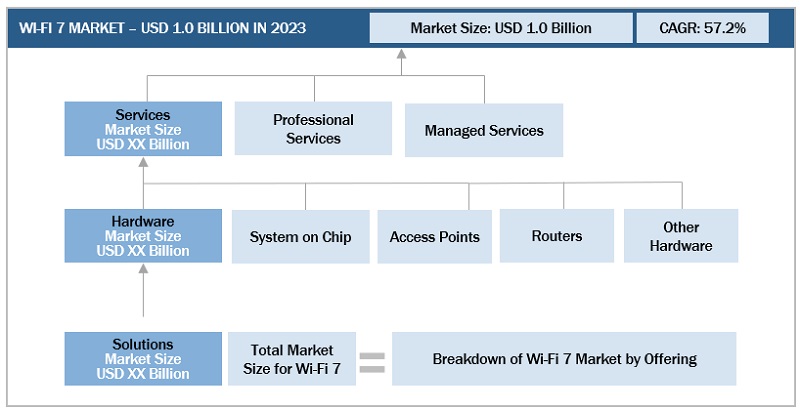
Multiple approaches were adopted to estimate and forecast the size of the Wi-Fi 7 market. The first approach involves estimating market size by summing up the revenue generated by companies through the sale of Wi-Fi 7 offerings, such as hardware, solutions, and services.

Both top-down and bottom-up approaches were used to estimate and validate the total size of the Wi-Fi 7 market. These methods were extensively used to estimate the size of various segments in the market. The research methodology used to estimate the market size includes the following:

  • Key players in the market have been identified through extensive secondary research.
  • In terms of value, the industry’s supply chain and market size have been determined through primary and secondary research processes.
  • All percentage shares, splits, and breakups have been determined using secondary sources and verified through primary sources.

Wi-Fi 7 Market Size: Bottom-Up Approach
Wi-Fi 7 Market  Size, and Share

To know about the assumptions considered for the study, Request for Free Sample Report

Wi-Fi 7 Market Size: Top-Down Approach

Wi-Fi 7 Market  Size, and Share

Data Triangulation

After arriving at the overall market size, the Wi-Fi 7 market was divided into several segments and subsegments. A data triangulation procedure was used to complete the overall market engineering process and arrive at the exact statistics for all segments and subsegments, wherever applicable. The data was triangulated by studying various factors and trends from the demand and supply sides. Along with data triangulation and market breakdown, the market size was validated by the top-down and bottom-up approaches.

Market Definition

As per Pareteum, Wi-Fi 7 is the next-generation Wi-Fi standard that succeeds Wi-Fi 6E and Wi-Fi 6. Its technical name is IEEE 802.11be EFT (Extremely High Throughput), indicating that it is an amendment to the original 802.11 Wi-Fi standard. It will use various new technologies and protocols to reduce latency, increase network capacity, and boost efficiency. It is especially committed to lightning-fast connections and improving user experiences for use cases such as live streaming and gaming.

Key Stakeholders

  • Network Server Providers
  • Technology Vendors
  • Mobile Network Operators (MNOs)
  • Independent Software Vendors (ISVs)
  • System Integrators (SIs)
  • Resellers
  • Value-added Resellers (VARs)
  • Managed Service Providers (MSPs)
  • Compliance Regulatory Authorities
  • Government Authorities
  • Wi-Fi 7 Alliances/Groups
  • Original Equipment Manufacturers (OEMs)

Report Objectives

  • To determine and forecast the global Wi-Fi 7 market by offering (hardware, solutions, and services), location type, application, vertical, and region from 2023 to 2030, and analyze the various macroeconomic and microeconomic factors that affect the market growth.
  • To forecast the size of the market segments with respect to five main regions: North America, Europe, Asia Pacific (APAC), Latin America, and Rest of world.
  • To provide detailed information about the major factors (drivers, restraints, opportunities, and challenges) influencing the growth of the Wi-Fi 7 market.
  • To analyze each submarket with respect to individual growth trends, prospects, and contributions to the overall Wi-Fi 7 market.
  • To analyze the opportunities in the market for stakeholders by identifying the high-growth segments of the Wi-Fi 7 market.
  • To profile the key market players; provide a comparative analysis based on business overviews, regional presence, product offerings, business strategies, and key financials; and illustrate the market's competitive landscape.
  • Track and analyze competitive developments in the market, such as mergers and acquisitions, product developments, partnerships and collaborations, and Research and Development (R&D) activities.

Available Customizations

With the given market data, MarketsandMarkets offers customizations as per the company’s specific needs. The following customization options are available for the report:

Geographic Analysis

  • Further breakup of the Asia Pacific market into countries contributing 75% to the regional market size
  • Further breakup of the North American market into countries contributing 75% to the regional market size
  • Further breakup of the Latin American market into countries contributing 75% to the regional market size
  • Further breakup of the MEA market into countries contributing 75% to the regional market size
  • Further breakup of the European market into countries contributing 75% to the regional market size

Company Information

  • Detailed analysis and profiling of additional market players (up to 5)
Custom Market Research Services

We will customize the research for you, in case the report listed above does not meet with your exact requirements. Our custom research will comprehensively cover the business information you require to help you arrive at strategic and profitable business decisions.

Request Customization
Report Code
TC 8699
Published ON
Jun, 2023
Choose License Type
BUY NOW
  • SHARE
X
Request Customization
Speak to Analyst
Speak to Analyst
OR FACE-TO-FACE MEETING
PERSONALIZE THIS RESEARCH
  • Triangulate with your Own Data
  • Get Data as per your Format and Definition
  • Gain a Deeper Dive on a Specific Application, Geography, Customer or Competitor
  • Any level of Personalization
REQUEST A FREE CUSTOMIZATION
LET US HELP YOU!
  • What are the Known and Unknown Adjacencies Impacting the Wi-Fi 7 Market
  • What will your New Revenue Sources be?
  • Who will be your Top Customer; what will make them switch?
  • Defend your Market Share or Win Competitors
  • Get a Scorecard for Target Partners
CUSTOMIZED WORKSHOP REQUEST
+1-888-600-6441
  • Call Us
  • +1-888-600-6441 (Corporate office hours)
  • +1-888-600-6441 (US/Can toll free)
  • +44-800-368-9399 (UK office hours)
CONNECT WITH US
ABOUT TRUST ONLINE
©2024 MarketsandMarkets Research Private Ltd. All rights reserved
DMCA.com Protection Status Website Feedback