Zinc Battery Market

Zinc Battery Market Size, Share, Industry Growth Analysis Report by Product Battery Type (Zinc-air, Nickel-zinc, Zinc-ion, Zinc-bromine), Rechargeability (Primary & Secondary), Application (Medical, Utilities, Automotive & Transportation, Industrial, Consumer Devices) and Region - Global Forecast to 2029

Report Code: SE 9023 May, 2024, by marketsandmarkets.com

[236 Pages Report] The Global Zinc Battery Market size is estimated to be USD 1.0 billion in 2024 and is projected to reach USD  2.0 billion by 2029, at a CAGR of 13.6% during the forecast period. Some of the major factors contributing to the growth of the zinc battery market include as the abundance of zinc material, its benefits over other battery technologies, and increasing global investments in grid infrastructure. Increasing reliance on data centers and the development of rechargeable zinc-air batteries are expected to provide growth opportunities for market players.

Zinc Battery Market

Zinc Battery Market

Zinc Battery Market Forecast to 2029

To know about the assumptions considered for the study, Request for Free Sample Report

Zinc Battery Market Dynamics:

Driver: Benefits over other battery chemistries

Zinc batteries offer a unique combination of characteristics that make them a competitive option in the battery market. Their high energy and power performance closely follows that of lithium-ion batteries, providing efficient energy storage and delivery. Economically, they are second only to lead-acid batteries, offering a low-cost solution. Moreover, zinc batteries ensure fully safe behavior, being non-toxic and non-flammable, which enhances their appeal for various applications. Additionally, they are environmentally friendly due to their recyclability and the abundant availability of zinc, making them a sustainable choice for the future.

Furthermore, the affordability of zinc batteries is deeply rooted in the abundance of its raw materials. This inherent cost advantage positions zinc batteries competitively against lithium-ion alternatives. Additionally, the safety-centric chemistry of zinc batteries translates to minimal additional costs associated with mitigating battery-related risks, further enhancing its economic appeal. Sustainability is another driving force, with zinc batteries boasting 100% recyclable electrodes and devoid of environmentally harmful elements like lead, cadmium, or mercury. This eco-friendly profile aligns with the growing demand for greener energy solutions, expanding the market. Zinc batteries have emerged as a formidable force shaping the future of energy storage across various sectors, combined with their high-performance characteristics, including superior energy density and rapid recharging capabilities. For instance, zinc bromine batteries outperform other battery chemistries with superior energy density, enduring cycle life, and scalable capacity, making them ideal for diverse energy storage needs. Their environmentally friendly composition, low-cost raw materials, and simple recyclability further solidify their position as a promising solution, particularly for stationary applications.

Restraint: Technical drawbacks of zinc battery

major issue is dendrite growth on zinc anodes, which reduces coulombic efficiency and cycling stability, potentially leading to short circuits, reduced battery life, and safety concerns. Another critical factor is the corrosion of zinc anodes, which leads to capacity loss, reduced efficiency, and overall degradation of battery performance. Additionally, hydrogen evolution during the operation of zinc batteries impacts their efficiency and safety, necessitating strategies to suppress this side reaction to improve overall performance.

Mechanical flexibility is another concern, as some materials used for zinc anodes cannot adapt to volume changes during charge and discharge cycles, hindering battery performance enhancement. Electrolyte challenges, including issues with pH levels and ion migration, can also influence dendrite growth and the overall stability of zinc batteries, making electrolyte modification crucial.

Opportunity: Increasing reliance on data centers

As the reliance on data centers intensifies worldwide, the demand for highly efficient power backup systems becomes increasingly critical. The rapid advancements in artificial intelligence and machine learning catalyze a profound transformation in data center paradigms, influencing everything from design to investment decisions. According to the report, published in January 2024, Data Centers 2024 Global Outlook, by 2027, the average rack density is anticipated to soar to 50kW per rack, outpacing the present average of 36kW, as data center operators strive to accommodate the surging computational requirements driven by AI and machine learning applications.  With data centers serving as the nerve centers of our digital infrastructure, any disruption in the power supply can have far-reaching consequences, impacting businesses, communications, and essential services. Consequently, as the number of data centers continues to surge globally, it creates a compelling opportunity for the zinc battery industry to thrive.

Challenges: Presence of alternative battery technologies

The presence of alternative battery technologies for applications such as consumer electronics, utilities, and medical poses a significant challenge for zinc batteries, which can impact its adoption in various applications. These alternative technologies include lithium-ion batteries, sodium-sulfur batteries, and lead-acid batteries, each offering advantages. Presently, the manufacturers of zinc batteries face fierce competition from the providers of these widely adopted conventional batteries, including lithium-ion, lead-acid, and sodium-based.  For instance, lithium-ion batteries are widely preferred due to their higher energy density and faster charge/discharge capabilities. Sodium-sulfur batteries are comparatively less expensive and boast a longer lifespan, while lead-acid batteries are also known for their affordability and easy maintenance. Consequently, potential customers may opt for these alternatives instead of zinc batteries.

Zinc Battery Market Ecosystem

The prominent players in the zinc battery market are Eastman Kodak Company (US), Panasonic Energy Co., Ltd. (Japan), Duracell Inc. (US), and Energizer Holdings, Inc. (US), GP Industries (China), Phinergy (Israel), ABOUND (Canada), ZAF Energy Systems, INC (US), Renata SA (Switzerland), Enerpoly AB (Sweden), Salient Energy (Canada) , and Imprint Energy (US) etc. These companies not only boast a comprehensive product portfolio but also have a strong geographic footprint.

Zinc Battery Market by Ecosystem

Zinc-air batteries lead the zinc battery market

These batteries are the primary ones that are being widely used in medical applications. Companies such as Eastman Kodak Company (US), ABOUND (Canada), ZAF Energy Systems, INC (US), Energizer Holdings, Inc. (US), and Renata SA (Switzerland) offer zinc-air batteries. However, due to the increasing demand for rechargeable batteries, companies are now focusing on developing rechargeable zn-air batteries. ZAF Energy Systems, INC,(US) offers zinc air rechargeable batteries.

Secondary battery type segment to account for the largest market share during the forecasting period.

A secondary battery is a type of electrochemical battery that can be discharged and recharged multiple times by reversing the chemical reactions that occur during discharge. It is also called a rechargeable battery. Unlike primary batteries, which are designed for one-time use and cannot be recharged, secondary batteries are capable of being reused, making them a more sustainable and cost-effective option in the long term.

Zinc-ion batteries, zinc-bromine batteries, and nickel zinc batteries are basically secondary batteries. Companies such as Enerpoly AB (Sweden), Salient Energy (Canada), Redflow Limited (Australia), Zn2H2 Inc. (US), Æsir Technologies, Inc. (US), ZincFive (US) offer these secondary batteries.

Medical applications segment to hold largest market share during the forecast period.

Zinc-air batteries are the most common type used in hearing aids due to their small size and lightweight nature, making them ideal for powering compact and discreet hearing devices. These batteries are available in various sizes to accommodate different styles and models of hearing aids, ensuring compatibility across a wide range of devices. Zinc-air batteries offer good energy density, allowing them to deliver consistent and reliable power to hearing aids for extended periods. This is particularly important for individuals who rely on their hearing aids throughout the day, as they can trust that their devices will remain operational without frequent battery changes. The stable voltage output of zinc-air batteries also ensures consistent sound quality and amplification, enhancing the overall listening experience for users.

Asia Pacific segment is likely to dominate the zinc battery market during forecast period.

The region is a major battery manufacturing hub with several zinc battery manufacturers. Hence, the high expertise in the battery industry is expected to help the new and emerging battery technologies flourish in the region. Large zinc production in China and the use of zinc batteries in the automotive and transportation industry will drive market growth in the Chinese region. Favorable government policies and rapid technological developments in the Japanese region will drive market growth in the country.

Asia Pacific to hold largest market share during the forecast period.

Zinc Battery Market by Region

Zinc Battery Market by Region

To know about the assumptions considered for the study, download the pdf brochure

The region is a major battery manufacturing hub with several zinc battery manufacturers. Hence, the high expertise in the battery industry is expected to help the new and emerging battery technologies to flourish in the region. Cutting edge research across on zinc batteries to offer lucrative growth opportunities for South Korean zinc battery market while rapid technological advancements and favorable government policies to drive market in the Japanese zinc battery market.

Top Zine Battery Companies - Key Market Players

Eastman Kodak Company (US), Panasonic Energy Co., Ltd. (Japan), Duracell Inc. (US), and Energizer Holdings, Inc. (US) are among the major players in the zinc battery market. Other companies in the market are ZincFive (US), Phinergy (Israel), GPIndustrial (China), ABOUND (Canada), ZAF Energy Systems, INC (US), Renata SA (Switzerland), Enerpoly AB (Sweden) and others.

Zinc Battery Market Report Scope :

Report Metric

Details

Estimated Market Size

USD 1.0 billion in 2024

Projected Market Size

USD  2.0 billion by 2029

Growth Rate

CAGR of 13.6%

Market Size Availability for Years

2020–2029

Base Year

2023

Forecast Period

2024–2029

Forecast Units

Value (USD Million)

Segments Covered

  • By Battery Type
  • Rechargeability
  • Application
  • Region

Geographies Covered

  • North America
  • Europe
  • Asia Pacific
  • RoW

Companies Covered

The major players include Eastman Kodak Company (US), Duracell Inc. (US), Panasonic Energy Co., Ltd. (Japan), Energizer Holdings, Inc. (US).
A total of 25 players are covered.

Zinc Battery Market Highlights

This research report categorizes the zinc battery market by battery type, rechargeability , application,  and region available at the regional and global level

Segment

Subsegment

Based on Rechargeability:

  • Primary
  • Secondary

Based on Battery Type:

  • Zinc-air
  • Nickel-zinc
  • Zinc-bromine
  • Zinc-ion

Based on Application:

  • Medical
  • Automotive & Transportation
  • Utilities
  • Industrial
  • Consumer Devices

Based on the Region:

  • North America
  • Europe
  • Asia Pacific
  • RoW (Middle East, Africa, and South America)

Recent Developments in Zinc Battery Industry :

  • In April 2024, Panasonic Energy Co., Ltd., a Panasonic Group company, announced the completion of a state-of-the-art production development facility at its Suminoe factory in Osaka, Japan. This advanced facility, focused on next-generation manufacturing, is designed to enhance the company's manufacturing capabilities, increase its global production capacity, and serve as a central hub for the development of production process technology.
  • In March 2024, ABOUND announced the establishment of a Memorandum of Understanding (MOU) with a technology firm, introducing an innovative, eco-friendly, green energy solution to the market. This technology, similar to Zaeras, offers diverse, secure, and sustainable energy solutions that contribute to positive societal advancement.
  • In November 2023, ZincFive announced the launch of two additions to its BC Series UPS Battery Cabinet range: the BC 2 – 500 and the BC 2 – 300X. Additionally, ZincFive also announced the Z5 13-90, a cutting-edge ultra-high-rate battery designed to fuel the newly launched battery cabinet models.
  • In April 2021, Phinergy (Israel)  and Doral Renewables LLC officially announced the co-operation and that they started working in the field of energy storage project.
  • In June 2020, ABOUND announced the establishment of a wholly owned US subsidiary, named Zinc8 Energy Solutions (USA) Inc., headquartered in New York state.

Key Questions Addressed by the Report:

To speak to our analyst for a discussion on the above findings, click Speak to Analyst

TABLE OF CONTENTS
 
1 INTRODUCTION (Page No. - 29)
    1.1 STUDY OBJECTIVES 
    1.2 MARKET DEFINITION 
    1.3 STUDY SCOPE 
           1.3.1 MARKETS COVERED
                    FIGURE 1 ZINC BATTERY MARKET SEGMENTATION
           1.3.2 REGIONAL SCOPE
           1.3.3 YEARS CONSIDERED
           1.3.4 INCLUSIONS AND EXCLUSIONS
    1.4 CURRENCY CONSIDERED 
    1.5 LIMITATIONS 
    1.6 UNITS CONSIDERED 
    1.7 STAKEHOLDERS 
    1.8 RECESSION IMPACT 
 
2 RESEARCH METHODOLOGY (Page No. - 33)
    2.1 RESEARCH APPROACH 
           FIGURE 2 ZINC BATTERY MARKET: RESEARCH DESIGN
           2.1.1 SECONDARY AND PRIMARY RESEARCH
                    FIGURE 3 ZINC BATTERY MARKET: RESEARCH APPROACH
           2.1.2 SECONDARY DATA
                    2.1.2.1 List of major secondary sources
                    2.1.2.2 Key data from secondary sources
           2.1.3 PRIMARY DATA
                    2.1.3.1 Intended participants and key opinion leaders in primary interviews
                    2.1.3.2 List of key primary interview participants
                    2.1.3.3 Key data from primary sources
                    2.1.3.4 Key industry insights
                    2.1.3.5 Breakdown of primaries
    2.2 MARKET SIZE ESTIMATION METHODOLOGY 
           2.2.1 BOTTOM-UP APPROACH
                    2.2.1.1 Approach to estimate market size using bottom-up analysis (demand side)
                               FIGURE 4 ZINC BATTERY MARKET: BOTTOM-UP APPROACH
           2.2.2 TOP-DOWN APPROACH
                    2.2.2.1 Approach to estimate market size using top-down analysis (supply side)
                               FIGURE 5 ZINC BATTERY MARKET: TOP-DOWN APPROACH
                               FIGURE 6 MARKET SIZE ESTIMATION METHODOLOGY: SUPPLY-SIDE ANALYSIS
    2.3 DATA TRIANGULATION 
           FIGURE 7 DATA TRIANGULATION
    2.4 RESEARCH ASSUMPTIONS 
    2.5 RESEARCH LIMITATIONS 
    2.6 PARAMETERS CONSIDERED TO ANALYZE RECESSION IMPACT ON ZINC BATTERY MARKET 
    2.7 RISK ASSESSMENT 
 
3 EXECUTIVE SUMMARY (Page No. - 44)
    FIGURE 8 ZINC BATTERY MARKET, 2020–2029 (USD MILLION)
    FIGURE 9 ZINC–BROMINE BATTERIES TO EXHIBIT HIGHEST CAGR FROM 2024 TO 2029
    FIGURE 10 SECONDARY BATTERIES TO CAPTURE LARGER MARKET SHARE IN 2029
    FIGURE 11 MEDICAL APPLICATIONS TO GAIN LARGEST MARKET SHARE BETWEEN 2024 AND 2029
    FIGURE 12 ASIA PACIFIC TO REGISTER HIGHEST CAGR IN ZINC BATTERY MARKET DURING FORECAST PERIOD
 
4 PREMIUM INSIGHTS (Page No. - 48)
    4.1 ATTRACTIVE OPPORTUNITIES FOR PLAYERS IN ZINC BATTERY MARKET 
           FIGURE 13 BENEFITS OFFERED BY ZINC BATTERIES AND ABUNDANCE OF ZINC TO FOSTER MARKET GROWTH
    4.2 ZINC BATTERY MARKET, BY CHEMISTRY 
           FIGURE 14 ZINC–AIR BATTERIES TO HOLD LARGEST MARKET SHARE IN 2024
    4.3 ZINC BATTERY MARKET, BY APPLICATION 
           FIGURE 15 MEDICAL APPLICATIONS TO ACCOUNT FOR LARGEST SHARE OF ZINC BATTERY MARKET IN 2029
    4.4 ZINC BATTERY MARKET IN NORTH AMERICA, BY APPLICATION AND COUNTRY 
           FIGURE 16 MEDICAL APPLICATIONS AND US TO HOLD LARGEST SHARES OF NORTH AMERICAN ZINC BATTERY MARKET IN 2029
    4.5 ZINC BATTERY MARKET, BY COUNTRY 
           FIGURE 17 CHINA TO EXHIBIT HIGHEST CAGR IN GLOBAL ZINC BATTERY MARKET FROM 2024 TO 2029
 
5 MARKET OVERVIEW (Page No. - 51)
    5.1 INTRODUCTION 
    5.2 MARKET DYNAMICS 
           FIGURE 18 ZINC BATTERY MARKET DYNAMICS
           5.2.1 DRIVERS
                    5.2.1.1 Benefits of zinc batteries over batteries utilizing other chemistries
                               TABLE 1 NICKEL-ZINC BATTERY VS. LITHIUM-ION AND LEAD-ACID BATTERIES
                    5.2.1.2 Abundance of zinc in Earth’s crust
                    5.2.1.3 Increasing global investments in modernization of grid infrastructure
                               FIGURE 19 GLOBAL INVESTMENTS IN ELECTRICAL GRIDS, 2018–2022
                               FIGURE 20 IMPACT OF DRIVERS ON ZINC BATTERY MARKET
           5.2.2 RESTRAINTS
                    5.2.2.1 Drawbacks and technical issues associated with zinc batteries
                               FIGURE 21 IMPACT OF RESTRAINTS ON ZINC BATTERY MARKET
           5.2.3 OPPORTUNITIES
                    5.2.3.1 Increasing global demand for data centers
                    5.2.3.2 Development of rechargeable zinc–air batteries
                               FIGURE 22 IMPACT OF OPPORTUNITIES ON ZINC BATTERY MARKET
           5.2.4 CHALLENGES
                    5.2.4.1 Easy availability of substitute battery products
                               FIGURE 23 IMPACT OF CHALLENGES ON ZINC BATTERY MARKET
    5.3 TRENDS/DISRUPTIONS IMPACTING CUSTOMER BUSINESS 
           FIGURE 24 TRENDS/DISRUPTIONS INFLUENCING CUSTOMER BUSINESS
    5.4 VALUE CHAIN ANALYSIS 
           FIGURE 25 ZINC BATTERY MARKET: VALUE CHAIN ANALYSIS
    5.5 ECOSYSTEM ANALYSIS 
           FIGURE 26 ZINC BATTERY MARKET: ECOSYSTEM ANALYSIS
           TABLE 2 ROLE OF COMPANIES IN ZINC BATTERY ECOSYSTEM
    5.6 INVESTMENT AND FUNDING SCENARIO 
           FIGURE 27 INVESTMENT AND FUNDING SCENARIO
    5.7 TECHNOLOGY ANALYSIS 
           5.7.1 KEY TECHNOLOGIES
                    5.7.1.1 Secondary zinc–air batteries
                    5.7.1.2 Nickel–zinc batteries
                    5.7.1.3 Zinc-ion batteries
                    5.7.1.4 Zinc–bromine batteries
           5.7.2 COMPLIMENTARY TECHNOLOGIES
                    5.7.2.1 Lithium metal batteries
                    5.7.2.2 Lithium–silicon batteries
           5.7.3 ADJACENT TECHNOLOGIES
                    5.7.3.1 Solid-state batteries
                    5.7.3.2 Sodium–sulfur batteries
    5.8 PATENT ANALYSIS 
           FIGURE 28 TOP 10 COMPANIES WITH HIGHEST NUMBER OF PATENT APPLICATIONS, 2014–2024
           TABLE 3 ZINC BATTERY MARKET: LIST OF PATENTS, 2020–2023
    5.9 TRADE ANALYSIS 
           5.9.1 IMPORT DATA (HS CODE 260800)
                    FIGURE 29 IMPORT DATA FOR HS CODE 260800-COMPLIANT PRODUCTS, BY COUNTRY, 2019–2023 (USD MILLION)
           5.9.2 EXPORT DATA (HS CODE 260800)
                    FIGURE 30 EXPORT DATA FOR HS CODE 260800-COMPLIANT PRODUCTS, BY COUNTRY, 2019–2023 (USD MILLION)
    5.10 KEY CONFERENCES AND EVENTS, 2024–2025 
           TABLE 4 ZINC BATTERY MARKET: LIST OF CONFERENCES AND EVENTS, 2024–2025
    5.11 CASE STUDY ANALYSIS 
           5.11.1 ZINCFIVE’S NICKEL–ZINC BATTERY UPS SYSTEM HELPED ATLANTA REDUCE ACCIDENTS BY DELIVERING CONSISTENT POWER SUPPLY TO TRAFFIC SIGNALS DURING POWER OUTAGES
           5.11.2 KNOX CHILDREN CENTERS ACHIEVED 75% REDUCTION IN WINTER ENERGY COSTS USING SOLAR PV AND REDFLOW BATTERIES TO ENSURE CONTINUOUS AVAILABILITY OF RENEWABLE ENERGY
           5.11.3 ZINCFIVE'S UPSTEALTH SOLUTION HELPED UTAH DEPARTMENT OF TRANSPORTATION MANAGE TRAFFIC CHALLENGES THROUGH UNINTERRUPTED TRAFFIC SIGNAL OPERATION
           5.11.4 REDFLOW AND VERTIV COLLECTIVELY PROVIDED VODAFONE WITH CONTINUOUS OFF-GRID GREEN ENERGY TO ENSURE REMOTE BROADBAND ACCESS
    5.12 REGULATORY LANDSCAPE 
           5.12.1 REGULATORY BODIES, GOVERNMENT AGENCIES, AND OTHER ORGANIZATIONS
                    TABLE 5 NORTH AMERICA: LIST OF REGULATORY BODIES, GOVERNMENT AGENCIES, AND OTHER ORGANIZATIONS
                    TABLE 6 EUROPE: LIST OF REGULATORY BODIES, GOVERNMENT AGENCIES, AND OTHER ORGANIZATIONS
                    TABLE 7 ASIA PACIFIC: LIST OF REGULATORY BODIES, GOVERNMENT AGENCIES, AND OTHER ORGANIZATIONS
                    TABLE 8 ROW: LIST OF REGULATORY BODIES, GOVERNMENT AGENCIES, AND OTHER ORGANIZATIONS
           5.12.2 REGULATORY STANDARDS
                    TABLE 9 STANDARDS RELATED TO ZINC BATTERIES
    5.13 PORTER’S FIVE FORCE ANALYSIS 
           TABLE 10 ZINC BATTERY MARKET: PORTER’S FIVE FORCES ANALYSIS
           FIGURE 31 ZINC BATTERY MARKET: PORTER’S FIVE FORCES ANALYSIS
           5.13.1 BARGAINING POWER OF SUPPLIERS
           5.13.2 BARGAINING POWER OF BUYERS
           5.13.3 THREAT OF NEW ENTRANTS
           5.13.4 THREAT OF SUBSTITUTES
           5.13.5 INTENSITY OF COMPETITIVE RIVALRY
    5.14 KEY STAKEHOLDERS AND BUYING CRITERIA 
           5.14.1 KEY STAKEHOLDERS IN BUYING PROCESS
                    FIGURE 32 INFLUENCE OF STAKEHOLDERS ON BUYING PROCESS FOR TOP THREE APPLICATIONS
                    TABLE 11 INFLUENCE OF STAKEHOLDERS ON BUYING PROCESS FOR TOP THREE APPLICATIONS (%)
           5.14.2 BUYING CRITERIA
                    FIGURE 33 KEY BUYING CRITERIA FOR TOP THREE APPLICATIONS
                    TABLE 12 KEY BUYING CRITERIA FOR TOP THREE APPLICATIONS
    5.15 PRICING ANALYSIS 
           5.15.1 AVERAGE SELLING PRICE TREND OF LITHIUM-ION BATTERY PACKS AND CELLS
                    FIGURE 34 AVERAGE SELLING PRICE TREND OF LITHIUM-ION BATTERY PACKS AND CELLS, 2013–2022 (USD/KWH)
           5.15.2 AVERAGE SELLING PRICE TREND OF ZINC–AIR BATTERIES
                    FIGURE 35 AVERAGE SELLING PRICE TREND OF ZINC–AIR BATTERIES, 2020–2023
           5.15.3 INDICATIVE PRICING TREND OF ZINC–AIR CELLS
                    TABLE 13 INDICATIVE PRICING TREND OF ZINC–AIR CELLS
           5.15.4 AVERAGE SELLING PRICE TREND OF ZINC–AIR BATTERIES OFFERED BY KEY PLAYERS
                    FIGURE 36 AVERAGE SELLING PRICE TREND OF ZINC–AIR BATTERIES PROVIDED BY KEY PLAYERS
                    TABLE 14 INDICATIVE PRICING TREND OF ZINC–AIR BATTERY CELLS, BY KEY PLAYER
           5.15.5 INDICATIVE PRICING TREND, BY REGION
                    TABLE 15 INDICATIVE PRICING TREND OF ZINC–AIR BATTERY CELLS, BY REGION
                    FIGURE 37 INDICATIVE PRICING TREND OF ZINC–AIR BATTERIES, BY REGION, 2020–2023
    5.16 ZINC MATERIAL AND ZINC SHEETS 
           5.16.1 GLOBAL ZINC PRODUCTION, BY COUNTRY
                    TABLE 16 ZINC PRODUCTION, BY COUNTRY, 2022
           5.16.2 BENEFITS OF ZINC BATTERIES OVER OTHER BATTERIES
           5.16.3 APPLICATIONS OF ZINC BATTERIES IN ENERGY STORAGE SOLUTIONS
           5.16.4 APPLICATIONS OF ZINC SHEET PRODUCTS
 
6 ZINC BATTERY MARKET, BY TYPE (Page No. - 85)
    6.1 INTRODUCTION 
           FIGURE 38 ZINC BATTERY MARKET, BY TYPE
           FIGURE 39 SECONDARY SEGMENT TO LEAD ZINC BATTERY MARKET DURING FORECAST PERIOD
           TABLE 17 ZINC BATTERY MARKET, BY TYPE, 2020–2023 (USD MILLION)
           TABLE 18 ZINC BATTERY MARKET, BY TYPE, 2024–2029 (USD MILLION)
    6.2 PRIMARY 
           6.2.1 LONG SHELF LIFE AND ABILITY TO PROVIDE RELIABLE POWER FOR LOW-DRAIN DEVICES TO BOOST SEGMENTAL GROWTH
                    TABLE 19 PRIMARY: ZINC BATTERY MARKET, BY APPLICATION, 2020–2023 (USD MILLION)
                    TABLE 20 PRIMARY: ZINC BATTERY MARKET, BY APPLICATION, 2024–2029 (USD MILLION)
    6.3 SECONDARY 
           6.3.1 RISING DEMAND FOR GRID-SCALE ENERGY STORAGE SYSTEMS WITH HIGH ENERGY DENSITY AND RELIABILITY TO FUEL SEGMENTAL GROWTH
                    TABLE 21 SECONDARY: ZINC BATTERY MARKET, BY APPLICATION, 2020–2023 (USD MILLION)
                    TABLE 22 SECONDARY: ZINC BATTERY MARKET, BY APPLICATION, 2024–2029 (USD MILLION)
 
7 ZINC BATTERY MARKET, BY CHEMISTRY (Page No. - 90)
    7.1 INTRODUCTION 
           FIGURE 40 ZINC BATTERY MARKET, BY CHEMISTRY
           FIGURE 41 ZINC–BROMINE BATTERIES TO REGISTER HIGHEST CAGR DURING FORECAST PERIOD
           TABLE 23 ZINC BATTERY MARKET, BY CHEMISTRY, 2020–2023 (USD MILLION)
           TABLE 24 ZINC BATTERY MARKET, BY CHEMISTRY, 2024–2029 (USD MILLION)
           TABLE 25 ZINC–AIR BATTERY MARKET, 2020–2023 (MILLION UNITS)
           TABLE 26 ZINC–AIR BATTERY MARKET, 2024–2029 (MILLION UNITS)
    7.2 ZINC–AIR 
           7.2.1 ABILITY TO OFFER HIGHER ENERGY DENSITY TO FOSTER SEGMENTAL GROWTH
                    TABLE 27 ZINC–AIR: ZINC BATTERY MARKET, BY APPLICATION, 2020–2023 (USD MILLION)
                    TABLE 28 ZINC–AIR: ZINC BATTERY MARKET, BY APPLICATION, 2024–2029 (USD MILLION)
                    TABLE 29 ZINC–AIR: ZINC BATTERY MARKET, BY REGION, 2020–2023 (USD MILLION)
                    TABLE 30 ZINC–AIR: ZINC BATTERY MARKET, BY REGION, 2024–2029 (USD MILLION)
    7.3 NICKEL–ZINC 
           7.3.1 HIGH RELIABILITY AND SAFETY, ALONG WITH SUPERIOR POWER DELIVERY, TO DRIVE SEGMENTAL GROWTH
                    TABLE 31 NICKEL–ZINC: ZINC BATTERY MARKET, BY APPLICATION, 2020–2023 (USD MILLION)
                    TABLE 32 NICKEL–ZINC: ZINC BATTERY MARKET, BY APPLICATION, 2024–2029 (USD MILLION)
                    TABLE 33 NICKEL–ZINC: ZINC BATTERY MARKET, BY REGION, 2020–2023 (USD MILLION)
                    TABLE 34 NICKEL–ZINC: ZINC BATTERY MARKET, BY REGION, 2024–2029 (USD MILLION)
    7.4 ZINC-ION 
           7.4.1 HIGH ENERGY DENSITY AND ECO-FRIENDLY OPERATION TO ACCELERATE DEMAND
                    TABLE 35 ZINC-ION: ZINC BATTERY MARKET, BY APPLICATION, 2020–2023 (USD MILLION)
                    TABLE 36 ZINC-ION: ZINC BATTERY MARKET, BY APPLICATION, 2024–2029 (USD MILLION)
                    TABLE 37 ZINC-ION: ZINC BATTERY MARKET, BY REGION, 2020–2023 (USD MILLION)
                    TABLE 38 ZINC-ION: ZINC BATTERY MARKET, BY REGION, 2024–2029 (USD MILLION)
    7.5 ZINC–BROMINE 
           7.5.1 GROWING DEMAND FOR GRID-SCALE ENERGY STORAGE SOLUTIONS TO SUPPORT SEGMENTAL GROWTH
                    TABLE 39 ZINC–BROMINE: ZINC BATTERY MARKET, BY APPLICATION, 2020–2023 (USD MILLION)
                    TABLE 40 ZINC–BROMINE: ZINC BATTERY MARKET, BY APPLICATION, 2024–2029 (USD MILLION)
                    TABLE 41 ZINC–BROMINE: ZINC BATTERY MARKET, BY REGION, 2020–2023 (USD MILLION)
                    TABLE 42 ZINC–BROMINE: ZINC BATTERY MARKET, BY REGION, 2024–2029 (USD MILLION)
 
8 ZINC BATTERY MARKET, BY APPLICATION (Page No. - 100)
    8.1 INTRODUCTION 
           FIGURE 42 ZINC BATTERY MARKET, BY APPLICATION
           FIGURE 43 MEDICAL APPLICATIONS TO HOLD LARGEST MARKET SHARE IN 2029
           TABLE 43 ZINC BATTERY MARKET, BY APPLICATION, 2020–2023 (USD MILLION)
           TABLE 44 ZINC BATTERY MARKET, BY APPLICATION, 2024–2029 (USD MILLION)
    8.2 MEDICAL 
           8.2.1 SURGING DEMAND FOR COMPACT AND DISCREET MEDICAL DEVICES TO DRIVE SEGMENTAL GROWTH
                    TABLE 45 MEDICAL: ZINC BATTERY MARKET, BY CHEMISTRY, 2020–2023 (USD MILLION)
                    TABLE 46 MEDICAL: ZINC BATTERY MARKET, BY CHEMISTRY, 2024–2029 (USD MILLION)
                    TABLE 47 MEDICAL: ZINC BATTERY MARKET, BY REGION, 2020–2023 (USD MILLION)
                    TABLE 48 MEDICAL: ZINC BATTERY MARKET, BY REGION, 2024–2029 (USD MILLION)
    8.3 AUTOMOTIVE & TRANSPORTATION 
           8.3.1 INCREASING ADOPTION OF INTELLIGENT TRANSPORTATION SYSTEMS TO BOOST ZINC BATTERY DEMAND
                    TABLE 49 AUTOMOTIVE & TRANSPORTATION: ZINC BATTERY MARKET, BY CHEMISTRY, 2020–2023 (USD MILLION)
                    TABLE 50 AUTOMOTIVE & TRANSPORTATION: ZINC BATTERY MARKET, BY CHEMISTRY, 2024–2029 (USD MILLION)
                    TABLE 51 AUTOMOTIVE & TRANSPORTATION: ZINC BATTERY MARKET, BY REGION, 2020–2023 (USD MILLION)
                    TABLE 52 AUTOMOTIVE & TRANSPORTATION: ZINC BATTERY MARKET, BY REGION, 2024–2029 (USD MILLION)
    8.4 UTILITIES 
           8.4.1 SURGING DEPLOYMENT OF MICROGRID SOLUTIONS TO CONTRIBUTE TO SEGMENTAL GROWTH
                    TABLE 53 UTILITIES: ZINC BATTERY MARKET, BY CHEMISTRY, 2020–2023 (USD MILLION)
                    TABLE 54 UTILITIES: ZINC BATTERY MARKET, BY CHEMISTRY, 2024–2029 (USD MILLION)
                    TABLE 55 UTILITIES: ZINC BATTERY MARKET, BY REGION, 2020–2023 (USD MILLION)
                    TABLE 56 UTILITIES: ZINC BATTERY MARKET, BY REGION, 2024–2029 (USD MILLION)
    8.5 INDUSTRIAL 
           8.5.1 RISING FOCUS OF INDUSTRIAL FACILITIES ON OPTIMIZING ENERGY USAGE TO FOSTER MARKET GROWTH
                    TABLE 57 INDUSTRIAL: ZINC BATTERY MARKET, BY CHEMISTRY, 2020–2023 (USD MILLION)
                    TABLE 58 INDUSTRIAL: ZINC BATTERY MARKET, BY CHEMISTRY, 2024–2029 (USD MILLION)
                    TABLE 59 INDUSTRIAL: ZINC BATTERY MARKET, BY REGION, 2020–2023 (USD MILLION)
                    TABLE 60 INDUSTRIAL: ZINC BATTERY MARKET, BY REGION, 2024–2029 (USD MILLION)
    8.6 CONSUMER DEVICES 
           8.6.1 POTENTIAL TO OFFER SAFER AND MORE AFFORDABLE ALTERNATIVES TO DRIVE SEGMENTAL GROWTH
                    TABLE 61 CONSUMER DEVICES: ZINC BATTERY MARKET, BY CHEMISTRY, 2020–2023 (USD MILLION)
                    TABLE 62 CONSUMER DEVICES: ZINC BATTERY MARKET, BY CHEMISTRY, 2024–2029 (USD MILLION)
                    TABLE 63 CONSUMER DEVICES: ZINC BATTERY MARKET, BY REGION, 2020–2023 (USD MILLION)
                    TABLE 64 CONSUMER DEVICES: ZINC BATTERY MARKET, BY REGION, 2024–2029 (USD MILLION)
    8.7 OTHERS 
           TABLE 65 OTHERS: ZINC BATTERY MARKET, BY CHEMISTRY, 2020–2023 (USD MILLION)
           TABLE 66 OTHERS: ZINC BATTERY MARKET, BY CHEMISTRY, 2024–2029 (USD MILLION)
           TABLE 67 OTHERS: ZINC BATTERY MARKET, BY REGION, 2020–2023 (USD MILLION)
           TABLE 68 OTHERS: ZINC BATTERY MARKET, BY REGION, 2024–2029 (USD MILLION)
 
9 ZINC BATTERY MARKET, BY REGION (Page No. - 114)
    9.1 INTRODUCTION 
           FIGURE 44 ZINC BATTERY MARKET, BY REGION
           9.1.1 IMPACT OF RECESSION ON GLOBAL MARKET
                    FIGURE 45 CHINA TO BE FASTEST-GROWING MARKET FOR ZINC BATTERIES GLOBALLY FROM 2024 TO 2029
                    TABLE 69 ZINC BATTERY MARKET, BY REGION, 2020–2023 (USD MILLION)
                    TABLE 70 ZINC BATTERY MARKET, BY REGION, 2024–2029 (USD MILLION)
    9.2 NORTH AMERICA 
           9.2.1 IMPACT OF RECESSION ON MARKET IN NORTH AMERICA
                    FIGURE 46 NORTH AMERICA: ZINC BATTERY MARKET SNAPSHOT
                    FIGURE 47 US TO DOMINATE ZINC BATTERY MARKET IN NORTH AMERICA FROM 2024 TO 2029
                    TABLE 71 NORTH AMERICA: ZINC BATTERY MARKET, BY COUNTRY, 2020–2023 (USD MILLION)
                    TABLE 72 NORTH AMERICA: ZINC BATTERY MARKET, BY COUNTRY, 2024–2029 (USD MILLION)
                    TABLE 73 NORTH AMERICA: ZINC BATTERY MARKET, BY APPLICATION, 2020–2023 (USD MILLION)
                    TABLE 74 NORTH AMERICA: ZINC BATTERY MARKET, BY APPLICATION, 2024–2029 (USD MILLION)
                    TABLE 75 NORTH AMERICA: ZINC BATTERY MARKET, BY CHEMISTRY, 2020–2023 (USD MILLION)
                    TABLE 76 NORTH AMERICA: ZINC BATTERY MARKET, BY CHEMISTRY, 2024–2029 (USD MILLION)
           9.2.2 US
                    9.2.2.1 Significant focus of local companies on developing battery products with improved performance and efficiency to accelerate market growth
           9.2.3 CANADA
                    9.2.3.1 Increasing government initiatives to reduce greenhouse gas emissions to boost demand
           9.2.4 MEXICO
                    9.2.4.1 Presence of several zinc-exploring mines to support market growth
    9.3 EUROPE 
           9.3.1 IMPACT OF RECESSION ON MARKET IN EUROPE
                    FIGURE 48 EUROPE: ZINC BATTERY MARKET SNAPSHOT
                    FIGURE 49 GERMANY TO WITNESS HIGHEST CAGR IN EUROPEAN ZINC BATTERY MARKET
                    TABLE 77 EUROPE: ZINC BATTERY MARKET, BY COUNTRY, 2020–2023 (USD MILLION)
                    TABLE 78 EUROPE: ZINC BATTERY MARKET, BY COUNTRY, 2024–2029 (USD MILLION)
                    TABLE 79 EUROPE: ZINC BATTERY MARKET, BY CHEMISTRY, 2020–2023 (USD MILLION)
                    TABLE 80 EUROPE: ZINC BATTERY MARKET, BY CHEMISTRY, 2024–2029 (USD MILLION)
                    TABLE 81 EUROPE: ZINC BATTERY MARKET, BY APPLICATION, 2020–2023 (USD MILLION)
                    TABLE 82 EUROPE: ZINC BATTERY MARKET, BY APPLICATION, 2024–2029 (USD MILLION)
           9.3.2 GERMANY
                    9.3.2.1 Ambitious renewable energy goals and grid modernization efforts to contribute to market growth
           9.3.3 UK
                    9.3.3.1 Significand demand for clean energy storage solutions to foster market growth
           9.3.4 FRANCE
                    9.3.4.1 Considerable involvement of research institutes in developing next-generation zinc-ion batteries to fuel market growth
           9.3.5 REST OF EUROPE
    9.4 ASIA PACIFIC 
           9.4.1 IMPACT OF RECESSION ON MARKET IN ASIA PACIFIC
                    FIGURE 50 ASIA PACIFIC: ZINC BATTERY MARKET SNAPSHOT
                    FIGURE 51 CHINA TO LEAD ZINC BATTERY MARKET IN ASIA PACIFIC DURING FORECAST PERIOD
                    TABLE 83 ASIA PACIFIC: ZINC BATTERY MARKET, BY COUNTRY, 2020–2023 (USD MILLION)
                    TABLE 84 ASIA PACIFIC: ZINC BATTERY MARKET, BY COUNTRY, 2024–2029 (USD MILLION)
                    TABLE 85 ASIA PACIFIC: ZINC BATTERY MARKET, BY CHEMISTRY, 2020–2023 (USD MILLION)
                    TABLE 86 ASIA PACIFIC: ZINC BATTERY MARKET, BY CHEMISTRY, 2024–2029 (USD MILLION)
                    TABLE 87 ASIA PACIFIC: ZINC BATTERY MARKET, BY APPLICATION, 2020–2023 (USD MILLION)
                    TABLE 88 ASIA PACIFIC: ZINC BATTERY MARKET, BY APPLICATION, 2024–2029 (USD MILLION)
           9.4.2 CHINA
                    9.4.2.1 Surging adoption of electric vehicles to drive market
           9.4.3 JAPAN
                    9.4.3.1 Rapid advances in material science and battery chemistry to augment market growth
           9.4.4 SOUTH KOREA
                    9.4.4.1 Constant focus on developing innovative zinc battery products to offer lucrative growth opportunities
           9.4.5 REST OF ASIA PACIFIC
    9.5 ROW 
           9.5.1 IMPACT OF RECESSION ON MARKET IN ROW
                    FIGURE 52 MIDDLE EAST TO HOLD MAJOR SHARE OF ZINC BATTERY MARKET IN ROW DURING FORECAST PERIOD
                    TABLE 89 ROW: ZINC BATTERY MARKET, BY REGION, 2020–2023 (USD MILLION)
                    TABLE 90 ROW: ZINC BATTERY MARKET, BY REGION, 2024–2029 (USD MILLION)
                    TABLE 91 ROW: ZINC BATTERY MARKET, BY CHEMISTRY, 2020–2023 (USD MILLION)
                    TABLE 92 ROW: ZINC BATTERY MARKET, BY CHEMISTRY, 2024–2029 (USD MILLION)
                    TABLE 93 ROW: ZINC BATTERY MARKET, BY APPLICATION, 2020–2023 (USD MILLION)
                    TABLE 94 ROW: ZINC BATTERY MARKET, BY APPLICATION, 2024–2029 (USD MILLION)
           9.5.2 MIDDLE EAST
                    9.5.2.1 Increasing demand for energy due to rapid urbanization to fuel market growth
                               TABLE 95 MIDDLE EAST: ZINC BATTERY MARKET, BY COUNTRY, 2020–2023 (USD MILLION)
                               TABLE 96 MIDDLE EAST: ZINC BATTERY MARKET, BY COUNTRY, 2024–2029 (USD MILLION)
                    9.5.2.2 GCC countries
                    9.5.2.3 Rest of Middle East
           9.5.3 AFRICA
                    9.5.3.1 Increasing adoption of reliable energy storage systems to boost demand
           9.5.4 SOUTH AMERICA
                    9.5.4.1 Investments in renewable energy projects and rising need for reliable energy storage solutions to foster market growth
 
10 COMPETITIVE LANDSCAPE (Page No. - 140)
     10.1 INTRODUCTION 
     10.2 KEY PLAYER STRATEGIES/RIGHT TO WIN, 2020–2023 
             TABLE 97 ZINC BATTERY MARKET: OVERVIEW OF STRATEGIES ADOPTED BY KEY PLAYERS, 2020–2023
     10.3 REVENUE ANALYSIS, 2019–2023 
             FIGURE 53 ZINC BATTERY MARKET: REVENUE ANALYSIS OF KEY PLAYERS, 2019–2023
     10.4 MARKET SHARE ANALYSIS, 2023 
             FIGURE 54 ZINC BATTERY MARKET SHARE ANALYSIS, 2023
             TABLE 98 ZINC BATTERY MARKET SHARE ANALYSIS OF TOP PLAYERS VS. OTHER PLAYERS, 2023
     10.5 COMPANY VALUATION AND FINANCIAL METRICS 
             FIGURE 55 COMPANY VALUATION (USD MILLION), 2023
             FIGURE 56 FINANCIAL METRICS (EV/EBITDA), 2023
     10.6 BRAND/PRODUCT COMPARISON 
             FIGURE 57 ZINC BATTERY MARKET: BRAND/PRODUCT COMPARISON
     10.7 COMPANY EVALUATION MATRIX: KEY PLAYERS, 2023 
             10.7.1 STARS
             10.7.2 EMERGING LEADERS
             10.7.3 PERVASIVE PLAYERS
             10.7.4 PARTICIPANTS
                        FIGURE 58 ZINC BATTERY MARKET: COMPANY EVALUATION MATRIX (KEY PLAYERS), 2023
             10.7.5 COMPANY FOOTPRINT: KEY PLAYERS, 2023
                        10.7.5.1 Company footprint
                                     FIGURE 59 ZINC BATTERY MARKET: COMPANY FOOTPRINT
                        10.7.5.2 Application footprint
                                     TABLE 99 ZINC BATTERY MARKET: APPLICATION FOOTPRINT
                        10.7.5.3 Type footprint
                                     TABLE 100 ZINC BATTERY MARKET: TYPE FOOTPRINT
                        10.7.5.4 Chemistry footprint
                                     TABLE 101 ZINC BATTERY MARKET: CHEMISTRY FOOTPRINT
                        10.7.5.5 Region footprint
                                     TABLE 102 ZINC BATTERY MARKET: REGION FOOTPRINT
     10.8 COMPANY EVALUATION MATRIX: STARTUPS/SMES, 2023 
             10.8.1 PROGRESSIVE COMPANIES
             10.8.2 RESPONSIVE COMPANIES
             10.8.3 DYNAMIC COMPANIES
             10.8.4 STARTING BLOCKS
                        FIGURE 60 ZINC BATTERY MARKET: EVALUATION MATRIX (STARTUPS/SMES), 2023
             10.8.5 COMPETITIVE BENCHMARKING, STARTUPS/SMES, 2023
                        10.8.5.1 Detailed list of key startups/SMEs
                                     TABLE 103 ZINC BATTERY MARKET: LIST OF KEY STARTUPS/SMES
                        10.8.5.2 Competitive benchmarking of key startups/SMEs
                                     TABLE 104 ZINC BATTERY MARKET: COMPETITIVE BENCHMARKING OF KEY STARTUPS/SMES
     10.9 COMPETITIVE SCENARIO AND TRENDS 
             10.9.1 PRODUCT LAUNCHES
                        TABLE 105 ZINC BATTERY MARKET: PRODUCT LAUNCHES, JANUARY 2020–APRIL 2024
             10.9.2 DEALS
                        TABLE 106 ZINC BATTERY MARKET: DEALS, JANUARY 2020–APRIL 2024
             10.9.3 EXPANSIONS
                        TABLE 107 ZINC BATTERY MARKET: EXPANSIONS, JANUARY 2020–APRIL 2024
             10.9.4 OTHER DEVELOPMENTS
                        TABLE 108 ZINC BATTERY MARKET: OTHER DEVELOPMENTS, JANUARY 2020–APRIL 2024
 
11 COMPANY PROFILES (Page No. - 161)
     11.1 KEY PLAYERS 
(Business Overview, Products/Solutions/Services Offered, Recent Developments, MnM view (Key strengths/Right to win, Strategic choices made, Weakness/competitive threats)*  
             11.1.1 DURACELL INC.
                        TABLE 109 DURACELL INC.: COMPANY OVERVIEW
                        TABLE 110 DURACELL INC.: PRODUCTS/SOLUTIONS/SERVICES OFFERED
             11.1.2 EASTMAN KODAK COMPANY
                        TABLE 111 EASTMAN KODAK COMPANY: COMPANY OVERVIEW
                        FIGURE 61 EASTMAN KODAK COMPANY: COMPANY SNAPSHOT
                        TABLE 112 EASTMAN KODAK COMPANY: PRODUCTS/SOLUTIONS/SERVICES OFFERED
             11.1.3 ENERGIZER HOLDINGS, INC.
                        TABLE 113 ENERGIZER HOLDINGS, INC.: COMPANY OVERVIEW
                        FIGURE 62 ENERGIZER HOLDINGS, INC.: COMPANY SNAPSHOT
                        TABLE 114 ENERGIZER HOLDINGS, INC.: PRODUCTS/SOLUTIONS/SERVICES OFFERED
                        TABLE 115 ENERGIZER HOLDINGS, INC.: DEALS
                        TABLE 116 ENERGIZER HOLDINGS, INC.: EXPANSIONS
                        TABLE 117 ENERGIZER HOLDINGS, INC.: OTHER DEVELOPMENTS
             11.1.4 PANASONIC ENERGY CO., LTD.
                        TABLE 118 PANASONIC ENERGY CO., LTD.: COMPANY OVERVIEW
                        TABLE 119 PANASONIC ENERGY CO., LTD.: PRODUCTS/SOLUTIONS/SERVICES OFFERED
                        TABLE 120 PANASONIC ENERGY CO., LTD.: EXPANSIONS
             11.1.5 GP INDUSTRIES
                        TABLE 121 GP INDUSTRIES: COMPANY OVERVIEW
                        FIGURE 63 GP INDUSTRIES: COMPANY SNAPSHOT
                        TABLE 122 GP INDUSTRIES: PRODUCTS/SOLUTIONS/SERVICES OFFERED
             11.1.6 ABOUND
                        TABLE 123 ABOUND: COMPANY OVERVIEW
                        TABLE 124 ABOUND: PRODUCTS/SOLUTIONS/SERVICES OFFERED
                        TABLE 125 ABOUND: DEALS
                        TABLE 126 ABOUND: EXPANSIONS
                        TABLE 127 ABOUND: OTHER DEVELOPMENTS
             11.1.7 ENERPOLY AB
                        TABLE 128 ENERPOLY AB: COMPANY OVERVIEW
                        TABLE 129 ENERPOLY AB: PRODUCTS/SOLUTIONS/SERVICES OFFERED
                        TABLE 130 ENERPOLY AB: OTHER DEVELOPMENTS
             11.1.8 IMPRINT ENERGY
                        TABLE 131 IMPRINT ENERGY: COMPANY OVERVIEW
                        TABLE 132 IMPRINT ENERGY: PRODUCTS/SOLUTIONS/SERVICES OFFERED
                        TABLE 133 IMPRINT ENERGY: PRODUCT LAUNCHES
             11.1.9 PHINERGY
                        TABLE 134 PHINERGY: COMPANY OVERVIEW
                        TABLE 135 PHINERGY: PRODUCTS/SOLUTIONS/SERVICES OFFERED
                        TABLE 136 PHINERGY: DEALS
                        TABLE 137 PHINERGY: OTHER DEVELOPMENTS
             11.1.10 REDFLOW LIMITED
                        TABLE 138 REDFLOW LIMITED: COMPANY OVERVIEW
                        FIGURE 64 REDFLOW LIMITED: COMPANY SNAPSHOT
                        TABLE 139 REDFLOW LIMITED: PRODUCTS/SOLUTIONS/SERVICES OFFERED
                        TABLE 140 REDFLOW LIMITED: DEALS
                        TABLE 141 REDFLOW LIMITED: OTHER DEVELOPMENTS
             11.1.11 RENATA SA
                        TABLE 142 RENATA SA: COMPANY OVERVIEW
                        TABLE 143 RENATA SA: PRODUCTS/SOLUTIONS/SERVICES OFFERED
             11.1.12 SALIENT ENERGY
                        TABLE 144 SALIENT ENERGY: COMPANY OVERVIEW
                        TABLE 145 SALIENT ENERGY: PRODUCTS/SOLUTIONS/SERVICES OFFERED
             11.1.13 ZAF ENERGY SYSTEMS, INC
                        TABLE 146 ZAF ENERGY SYSTEMS, INC: COMPANY OVERVIEW
                        TABLE 147 ZAF ENERGY SYSTEMS, INC: PRODUCTS/SOLUTIONS/SERVICES OFFERED
                        TABLE 148 ZAF ENERGY SYSTEMS, INC: PRODUCT LAUNCHES
                        TABLE 149 ZAF ENERGY SYSTEMS, INC: OTHER DEVELOPMENTS
             11.1.14 ZINCFIVE
                        TABLE 150 ZINCFIVE: COMPANY OVERVIEW
                        TABLE 151 ZINCFIVE: PRODUCTS/SOLUTIONS/SERVICES OFFERED
                        TABLE 152 ZINCFIVE: PRODUCT LAUNCHES
                        TABLE 153 ZINCFIVE: DEALS
                        TABLE 154 ZINCFIVE: EXPANSIONS
                        TABLE 155 ZINCFIVE: OTHER DEVELOPMENTS
     11.2 OTHER PLAYERS 
             11.2.1 ÆSIR TECHNOLOGIES, INC.
             11.2.2 AETC
             11.2.3 AZA BATTERY
             11.2.4 CEGASA
             11.2.5 ENZINC
             11.2.6 E-ZINC
             11.2.7 ISKRA
             11.2.8 PRIMUS POWER SOLUTIONS
             11.2.9 SHANDONG HUATAI NEW ENERGY BATTERY CO., LTD.
             11.2.10 SUNERGY
             11.2.11 ZN2H2 INC.
*Details on Business Overview, Products/Solutions/Services Offered, Recent Developments, MnM view (Key strengths/Right to win, Strategic choices made, Weakness/competitive threats)* might not be captured in case of unlisted companies.  
 
12 ADJACENT AND RELATED MARKETS (Page No. - 224)
     12.1 INTRODUCTION 
     12.2 NORTH AMERICA 
             TABLE 156 NORTH AMERICA: LITHIUM-ION BATTERY MARKET, BY COUNTRY, 2019–2022 (USD BILLION)
             TABLE 157 NORTH AMERICA: LITHIUM-ION BATTERY MARKET, BY COUNTRY, 2023–2032 (USD BILLION)
             TABLE 158 NORTH AMERICA: LITHIUM-ION BATTERY MARKET, BY TYPE, 2019–2022 (USD MILLION)
             TABLE 159 NORTH AMERICA: LITHIUM-ION BATTERY MARKET, BY TYPE, 2023–2032 (USD MILLION)
             TABLE 160 NORTH AMERICA: LITHIUM-ION BATTERY MARKET, BY APPLICATION, 2019–2022 (USD MILLION)
             TABLE 161 NORTH AMERICA: LITHIUM-ION BATTERY MARKET, BY APPLICATION, 2023–2032 (USD MILLION)
             12.2.1 US
                        12.2.1.1 Public–private alliance to strengthen domestic manufacturing base for clean energy future to drive market
             12.2.2 CANADA
                        12.2.2.1 Abundance of cobalt, lithium, and nickel materials to create lucrative opportunities for battery providers
             12.2.3 MEXICO
                        12.2.3.1 Increasing investments in lithium-ion battery production to support market growth
 
13 APPENDIX (Page No. - 229)
     13.1 INSIGHTS FROM INDUSTRY EXPERTS 
     13.2 DISCUSSION GUIDE 
     13.3 KNOWLEDGESTORE: MARKETSANDMARKETS’ SUBSCRIPTION PORTAL 
     13.4 CUSTOMIZATION OPTIONS 
     13.5 RELATED REPORTS 
     13.6 AUTHOR DETAILS 


The study involved four major activities for estimating the zinc battery market size. Exhaustive secondary research has been conducted to collect information relevant to the market, its peer markets, and its child market. Primary research has been undertaken to validate key findings, assumptions, and sizing with industry experts across the value chain of the zinc battery market. Both top-down and bottom-up approaches have been employed to estimate the complete market size. It has been followed by the market breakdown and data triangulation methods to estimate the size of different segments and subsegments of the market.

Secondary Research

The research methodology used to estimate and forecast the size of the zinc battery market began with the acquisition of data related to the revenues of key vendors in the market through secondary research. Various secondary sources have been referred to in the secondary research process for identifying and collecting information for this study. Secondary sources include annual reports, press releases, and investor presentations of companies; white papers, journals, certified publications, and articles by recognized authors; websites; directories; and databases. Secondary research has mainly been used to obtain key information about the supply chain of the zinc battery market, the value chain of the market, key players, market classification, and segmentation according to the industry trends to the bottom-most level, geographic markets, and key developments from both market and technology-oriented perspectives. Secondary data has been collected and analyzed to determine the overall market size, further validated through primary research. The secondary research referred to for this research study involves the International ZInc Association (IZA), NAATBatt, Clean Energy Council. Moreover, the study involved extensive use of secondary sources, directories, and databases, such as Hoovers, Bloomberg Businessweek, Factiva, and OneSource, to identify and collect valuable information for a technical, market-oriented, and commercial study of the zinc battery market. Vendor offerings have been taken into consideration to determine market segmentation.

Primary Research

In the primary research, various primary sources from both the supply and demand sides have been interviewed to obtain the qualitative and quantitative information relevant to this report. Primary sources from the supply side include the key industry participants, subject-matter experts (SMEs), and C-level executives and consultants from various key companies and organizations in the zinc battery ecosystem. After the complete market engineering (including calculations for the market statistics, the market breakdown, the market size estimations, the market forecasting, and the data triangulation), extensive primary research has been conducted to verify and validate the critical market numbers obtained. Extensive qualitative and quantitative analyses have been performed during the market engineering process to list key information/insights throughout the report. Extensive primary research has been conducted after understanding the zinc battery market scenario through secondary research. Several primary interviews have been conducted with market experts from the demand and supply-side players across key regions, namely, the Americas, Europe, Asia Pacific, and the Rest of the World (Middle East,  Africa, and South America). Various primary sources from both the supply and demand sides of the market have been interviewed to obtain qualitative and quantitative information. Following is the breakdown of the primary respondents.

Primary data has been collected through questionnaires, emails, and telephonic interviews. In the canvassing of primaries, various departments within organizations, such as sales, operations, and administration, were covered to provide a holistic viewpoint in our report. After interacting with industry experts, brief sessions were conducted with highly experienced independent consultants to reinforce the findings from our primaries. This and the in-house subject matter experts’ opinions have led us to the findings described in the remainder of this report.

Zinc Battery Market
 Size, and Share

To know about the assumptions considered for the study, download the pdf brochure

Market Size Estimation

The total size of the zinc battery market has been estimated and validated using both top-down and bottom-up approaches. Furthermore, these methods have also been used extensively to estimate the size of various subsegments in the market. The research methodology used to estimate the market size is as follows:

  • Identifying different entities influencing the value chain of the zinc battery market
  • Identifying major companies, system integrators, and service providers operating in the market
  • Estimating the size of the zinc battery market for each region based on demand for zinc batteries
  • Tracking the ongoing and upcoming zinc battery projects to forecast the market size based on these developments and other critical parameters
  • All percentage shares, splits, and breakdowns have been determined using secondary sources and verified through primary sources.
  • Qualitative aspects such as market drivers, restraints, opportunities, and challenges have been taken into consideration while calculating and forecasting the market size.

Global Zinc Battery Market Size: Bottom-Up Approach

Zinc Battery Market
 Size, and Bottom-Up Approach

Global Zinc Battery Market Size: Top-Down Approach

Zinc Battery Market
 Size, and Top-Down Approach

Data Triangulation

After arriving at the overall size of the zinc battery market from the market size estimation process explained above, the total market has been split into several segments and subsegments. Data triangulation and market breakdown procedures have been employed, wherever applicable, to complete the overall market engineering process and arrive at the exact statistics for all segments and subsegments of the market. The data has been triangulated by studying various factors and trends from both the demand and supply sides. Along with this, the market size has been validated using both top-down and bottom-up approaches.

Market Definition

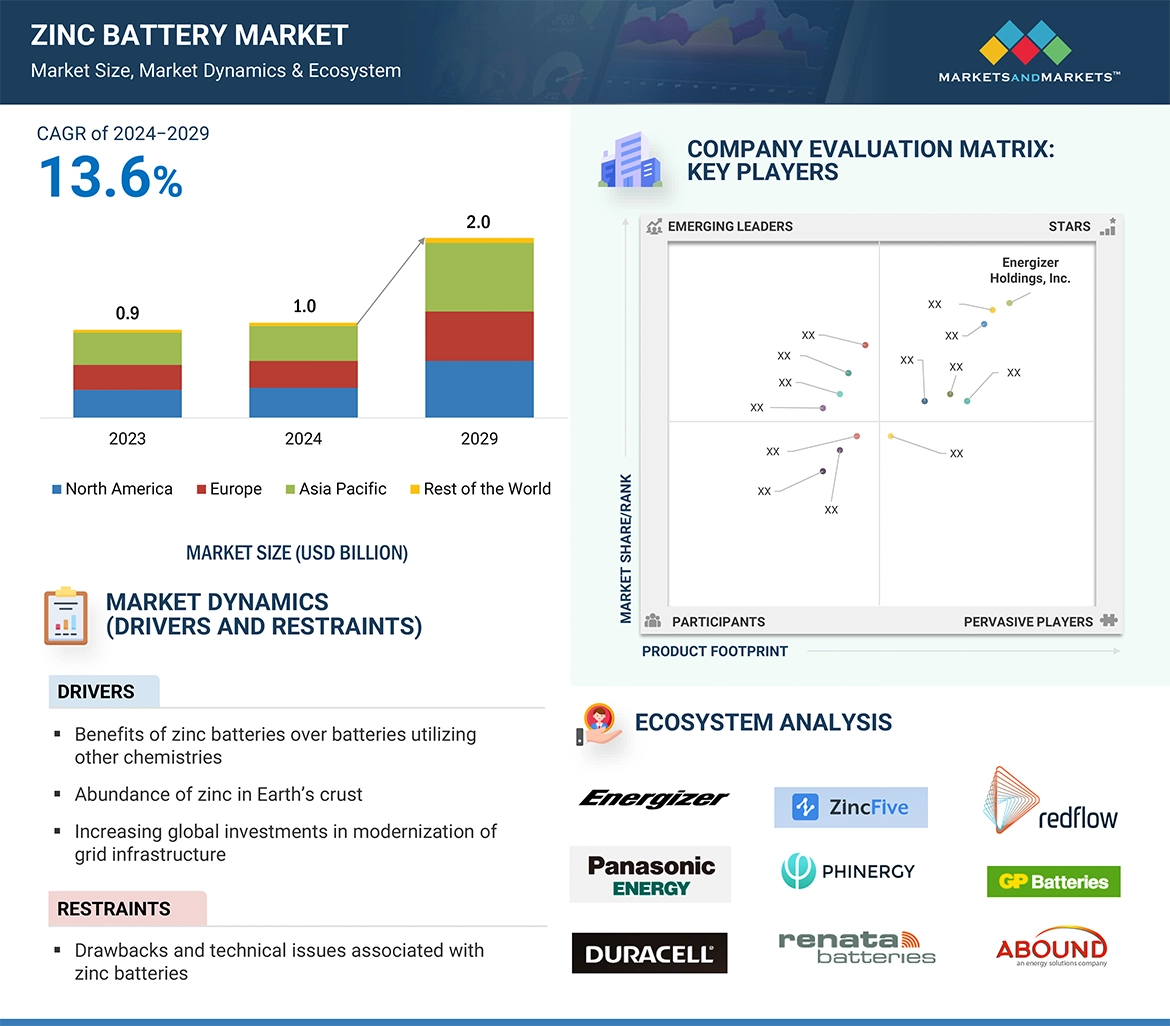
Zinc batteries are a type of battery that use zinc as the main electrode. These batteries can be primary as well as secondary type. Zinc batteries offer various advantages over other battery technologies such as high safety, cost-effectiveness, longer life-cycle, high specific energy and power. Further, these batteries include various chemistries such as zinc-air, nickel-zinc, zinc-ion, and zinc-bromine.

Stakeholders:

  • Zinc battery manufacturers
  • Technology providers
  • Material providers
  • Government bodies and industry associations
  • Research Institutes and Organizations
  • Battery Cell and Battery Pack Manufacturers
  • Equipment suppliers
  • System integrators
  • Electronic device and electric vehicle manufacturers

Report Objectives

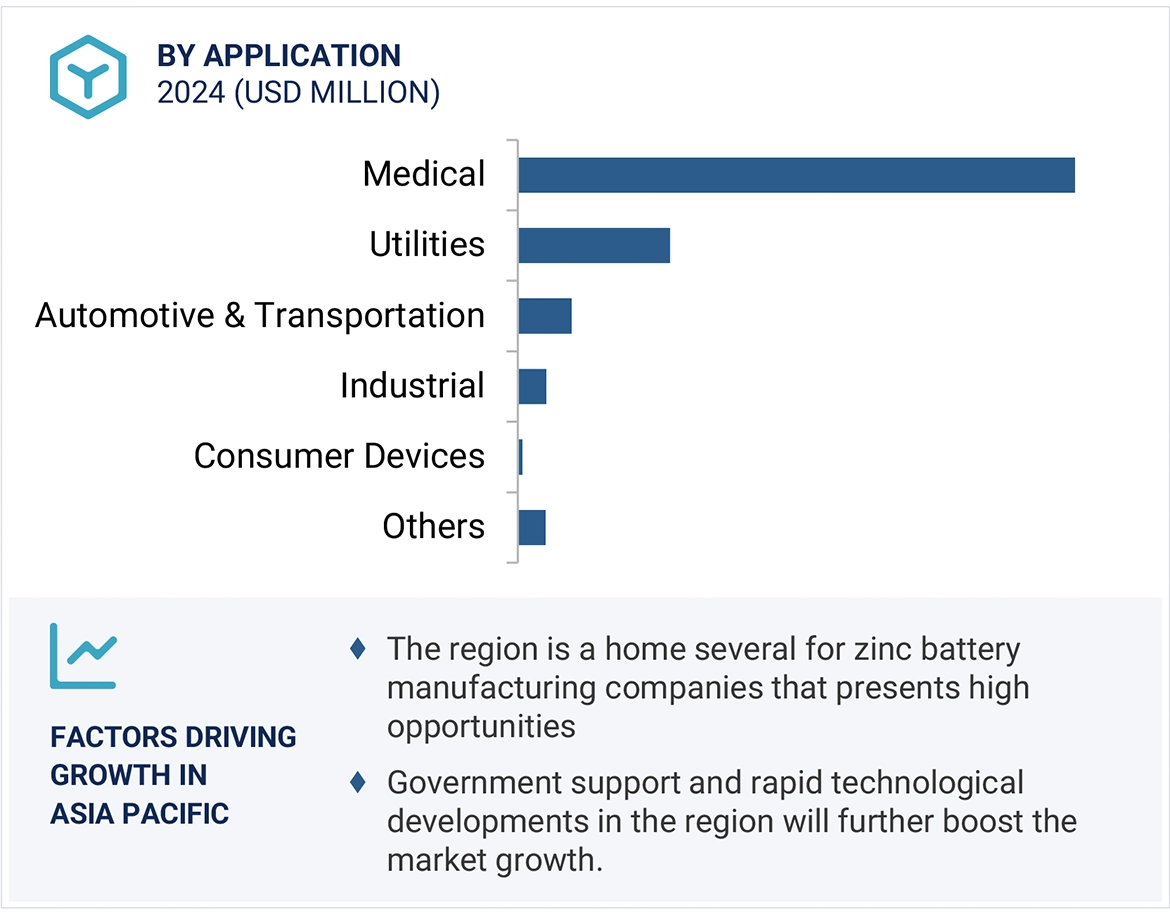
  • To define, describe, segment, and forecast the size of the zinc battery market by battery type, rechargeability, and application in terms of value
  • To describe and forecast the market for four main regions, namely, the North America, Asia Pacific, Europe, and RoW, in terms of value
  • To provide detailed information regarding the drivers, restraints, opportunities, and challenges influencing the growth of the market
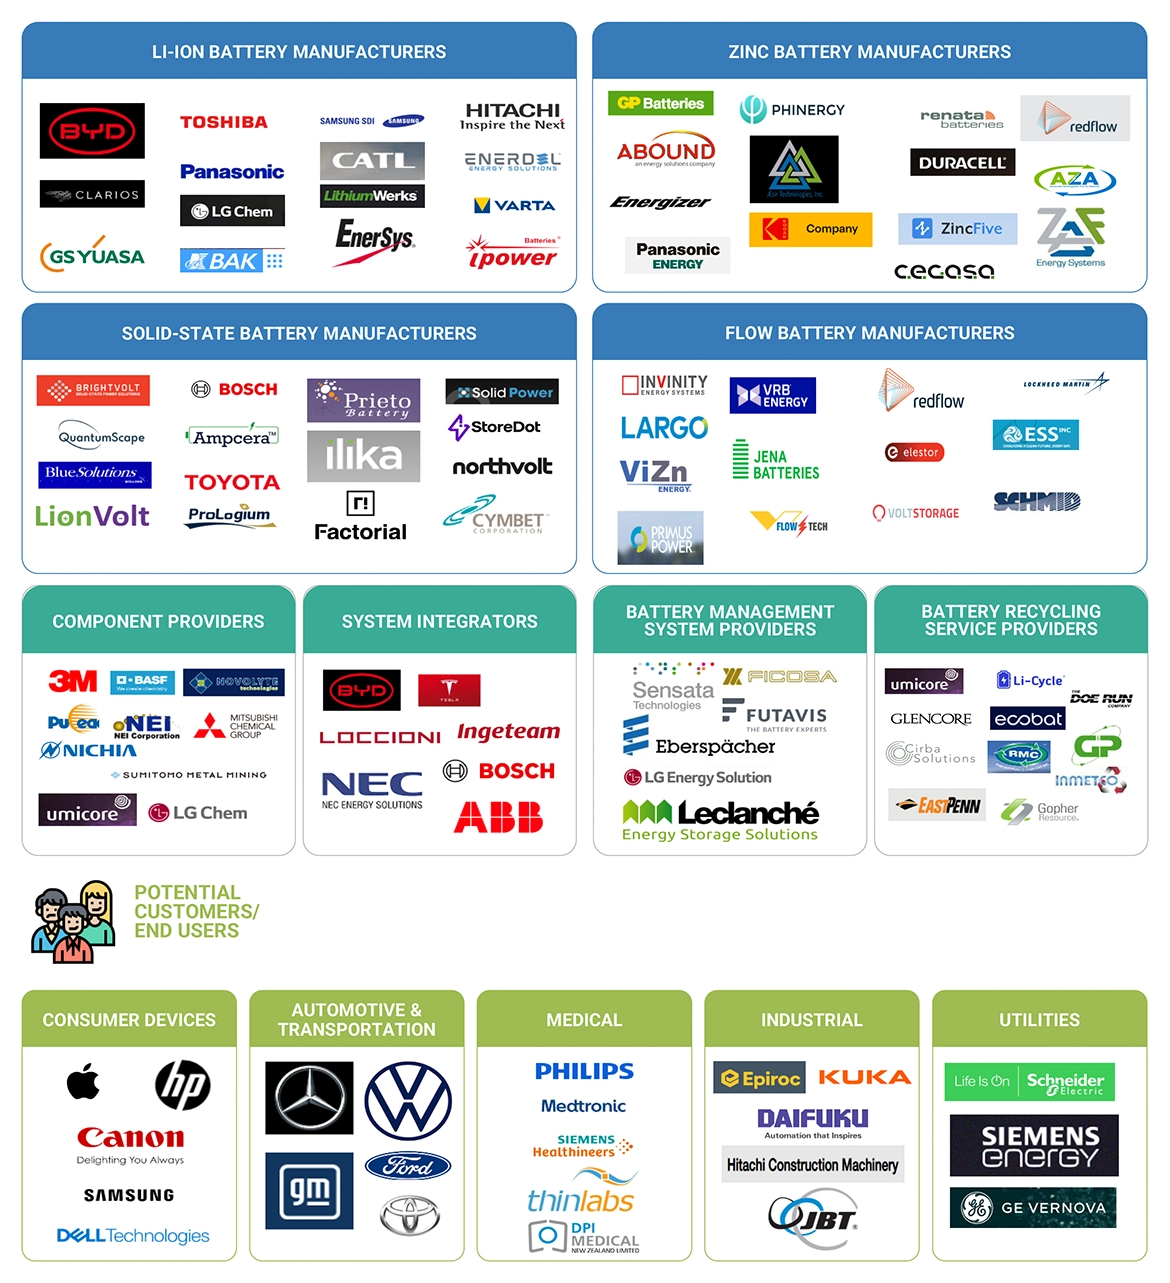
  • To provide a detailed overview of the value chain of the zinc battery ecosystem
  • To strategically analyze micro-markets with respect to individual growth trends, prospects, and their contributions to the overall market
  • To strategically analyze the ecosystem, Porter’s five forces, regulations, region-wise regulations, upcoming technologies in the market, revenue shift model in the market, patent landscape, trade landscape, and case studies pertaining to the market under study
  • To analyze opportunities in the market for the stakeholders by identifying high-growth segments in the market
  • To strategically profile key players and provide details of the current competitive landscape
  • To analyze strategic approaches adopted by players in the zinc battery market, such as product launches and developments, acquisitions, collaborations, agreements, contracts, expansions, and partnerships

Available Customizations:

With the given market data, MarketsandMarkets offers customizations according to the company’s specific needs. The following customization options are available for the report:

Company Information:

  • Detailed analysis and profiling of additional market players based on various blocks of the value chain.
Custom Market Research Services

We will customize the research for you, in case the report listed above does not meet with your exact requirements. Our custom research will comprehensively cover the business information you require to help you arrive at strategic and profitable business decisions.

Request Customization
Report Code
SE 9023
Published ON
May, 2024
Choose License Type
BUY NOW
  • SHARE
X
Request Customization
Speak to Analyst
Speak to Analyst
OR FACE-TO-FACE MEETING
PERSONALIZE THIS RESEARCH
  • Triangulate with your Own Data
  • Get Data as per your Format and Definition
  • Gain a Deeper Dive on a Specific Application, Geography, Customer or Competitor
  • Any level of Personalization
REQUEST A FREE CUSTOMIZATION
LET US HELP YOU!
  • What are the Known and Unknown Adjacencies Impacting the Zinc Battery Market
  • What will your New Revenue Sources be?
  • Who will be your Top Customer; what will make them switch?
  • Defend your Market Share or Win Competitors
  • Get a Scorecard for Target Partners
CUSTOMIZED WORKSHOP REQUEST
  • Call Us
  • +1-888-600-6441 (Corporate office hours)
  • +1-888-600-6441 (US/Can toll free)
  • +44-800-368-9399 (UK office hours)
CONNECT WITH US
ABOUT TRUST ONLINE
©2024 MarketsandMarkets Research Private Ltd. All rights reserved
DMCA.com Protection Status Website Feedback