Benign Prostatic Hyperplasia Treatment Market

Benign Prostatic Hyperplasia Treatment Market by Type [Drug (Alpha Blockers (Tamsulosin, Doxazosin), 5-Alpha Reductase Inhibitors (Finasteride, Dutasteride), Surgical Treatment (TURP, TUMT, TUNA)], End User (Hospitals) & Region - Global Forecast to 2026

Report Code: MD 7836 Feb, 2021, by marketsandmarkets.com

The global benign prostatic hyperplasia treatment market in terms of revenue was estimated to be worth $10.8 billion in 2021 and is poised to reach $14.1 billion by 2026, growing at a CAGR of 5.3% from 2021 to 2026.The new research study consists of an industry trend analysis of the market. The new research study consists of industry trends, pricing analysis, patent analysis, conference and webinar materials, key stakeholders, and buying behaviour in the market.

The presence of a large geriatric and target patient population and the improving healthcare infrastructure in several APAC countries are expected to offer growth opportunities in the market during the forecast period.

Benign Prostatic Hyperplasia Treatment Market

To know about the assumptions considered for the study, Request for Free Sample Report

Benign Prostatic Hyperplasia Treatment Market Dynamics

Driver: increasing prevalence of benign prostatic hyperplasia

Benign prostatic hyperplasia refers to the nonmalignant growth of prostate tissue and is a frequent cause of lower urinary tract symptoms among men. BPH is considered a normal part of male aging and is hormonally dependent on testosterone and dihydrotestosterone (DHT) production. Approximately 50% of men demonstrate histopathologic benign prostatic hyperplasia by age 60 and 90% by age 85. Approximately 30 million men worldwide and 14 million men in the US are said to have benign prostatic hyperplasia symptoms. (Source: WebMD LLC.)

Data from the Health Insurance Review and Assessment (HIRA) agency in 2018 revealed that nearly 7,600,000 patients were diagnosed with benign prostatic hyperplasia in 2010, which increased by 1.2 million in 2017. This represents an annual increase of about 7% and a total increase of 58% from 2010.

The growth of the aging population, especially the geriatric male segment, can be held as a prominent driver of benign prostatic hyperplasia incidence, as benign prostatic hyperplasia is a representative disease that appears in males during the aging process. As a result, the growth of this population segment will ensure demand for appropriate therapeutics in major markets. For example, China is believed to have the largest geriatric population; the population aged 65 years and older is estimated to account for 26.8% of its total population by 2050, up from 10.1% in 2015 (source: US Census Bureau). By 2050, the WHO estimates that there could be 100 million people in China aged 80 years and older. In the UK, NHS data estimates that there were five million men in the country in 2019; this is expected to rise to seven million in 2030 and nearly nine million by the end of 2050.

Restraint: Side-effects associated with benign prostatic hyperplasia medications

While drugs and surgery can treat BPH, both methods are associated with significant side effects. Medicines commonly used to treat benign prostatic hyperplasia include alpha-blockers, 5-ARIs (5-alpha reductase inhibitors), and other drug classes. Common side effects of alpha-blockers include dizziness, orthostatic hypotension, retrograde ejaculation, and rhinitis. Dizziness and orthostatic hypotension are of increased concern among the elderly, as they can cause significant morbidities such as falls and subsequent injuries.

Finasteride and Dutasteride, among other 5-ARIs, convert testosterone to dihydrotestosterone. These drugs also reduce the synthesis of several neuroactive steroids, but the modulation of the neuroendocrine stress response may lead to depression. Other side effects of 5-ARIs are gynecomastia, impotence, decreased libido, and decreased ejaculate volume.

Opportunity: Promising Product Pipeline

The benign prostatic hyperplasia treatment market offers considerable growth opportunities to manufacturers of generics. The patents on most medications for benign prostatic hyperplasia treatment, such as Avodart, Cialis, and Jalyn, have expired, which has paved the way for generics. Besides, demand has also risen for more effective treatment options, resulting in a strong pipeline of products in the benign prostatic hyperplasia treatment market.

Studies reveal that the price of a generic version of an alpha blocker is as low as USD 8 or less for a month's supply, compared to nearly USD 100 per month for a branded product. While the lower price may affect overall revenue generation in the short term, it also translates into a far higher level of access that may lead to increased sales volumes overall.

Drug treatment is expected to hold the largest share of the benign prostatic hyperplasia treatment industry.

Based on type, the market is segmented into drug treatment and surgical treatment. Drug treatment is the largest and fastest-growing segment in this market. Medications are generally preferred as the first line of treatment for benign prostatic hyperplasia, owing to which this segment accounted for the largest share.

The home healthcare segment is expected to hold the largest share of the benign prostatic hyperplasia treatment industry.

Based on the end user, the market is segmented into home healthcare and hospitals and clinics. In 2019, home healthcare accounted for the largest share of this market, as most patients are advised to choose medications over surgery. Patients are also suggested to continue medications for a few weeks post-surgery. As a result, his market is skewed toward home healthcare over hospital care.

Benign Prostatic Hyperplasia Treatment Market by Region

North America commanded the largest share of the benign prostatic hyperplasia treatment industry.

On the basis of region, the market is segmented into North America, Europe, Asia Pacific, and the Rest of the World. In 2019, North America commanded the largest share of the benign prostatic hyperplasia treatment market. The large share of this market segment can be attributed to the initiatives undertaken by the key players. The rise in the proportion of geriatric and obese populations and the availability of research funding are the major factors driving the market's growth.

The major players operating in the benign prostatic hyperplasia treatment market are Boston Scientific Corporation (US), Coloplast Group (Denmark), Teleflex Incorporated (US), Olympus Corporation (Japan), GlaxoSmithKline PLC (UK), Eli Lilly (US), Pfizer, Inc. (US), Abbott (US), Asahi Kasei Corporation (Japan), Merck & Co., Inc. (US), Astellas Pharma Inc. (Japan), Allergan plc (Ireland), Alembic (India), IPG Photonics Corporation (US), Richard Wolf GmbH (Germany), Unilab, Inc. (Philippines), Pharex Health Corporation (Philippines), Biolitec AG (Austria), Urologix, LLC (US), Advin Health Care (India), Medifocus, Inc. (Canada), Asclepion Laser Technologies GmbH (Germany), Pnn Medical A/S (Denmark), Surgical Lasers Inc. (Canada). Quanta Systems (Italy), Allium Ltd. (Israel), Lumenis Ltd. (Israel), KARL STORZ SE & Co. KG (Germany), and SRS Medical (US).

Scope of the Benign Prostatic Hyperplasia Treatment Industry:

Report Metric

Details

Market Revenue in 2021

$10.8 billion

Estimated Value by 2026

$14.1 billion

Growth Rate

Poised to grow at a CAGR of 5.3%

Market Segmentation

Type, End User And Region

Market Driver

increasing prevalence of benign prostatic hyperplasia

Market Opportunity

Promising Product Pipeline

Geographies Covered

North America, Europe, APAC, MEA, and Latin America

This research report categorizes the benign prostatic hyperplasia treatment market to forecast revenue and analyze trends in each of the following submarkets:

By Type

  • Drug Treatment
    • Alpha Blockers
      • Alfuzosin
      • Doxazosin
      • Tamsulosin
      • Silodosin
      • Other Alpha Blockers
    • 5-Aplha Reductase Inhibitors
      • Finasteride
      • Dutasteride
    • Other Drug Classes
  • Surgical Treatment
    • Transurethral Resection of the Prostate (TURP)
    • Transurethral Microwave Thermotherapy (TUMT)
    • Transurethral Needle Ablation of the Prostate (TUNA)
    • Laser Therapy
    • Prostatic Stenting
    • UroLift Therapy
    • Rezûm Therapy
    • Other Surgeries

By Region

  • North America
    • US
    • Canada
  • Europe
    • Germany
    • UK
    • France
    • Rest of Europe
  • Asia Pacific
    • China
    • Japan
    • India
    • Rest of Asia Pacific

Recent Developments of Benign Prostatic Hyperplasia Treatment Industry

  • GlaxoSmithKline (GSK) and Pfizer Inc. announced a merger in July 2020 which is expected to be completed in 2022. The merger of the two companies is intended to create a global leader in the development and commercialisation of innovative treatments for patients with benign prostatic hyperplasia (BPH). The companies plan to use their combined expertise, capabilities, and resources to develop novel products and treatments for BPH, such as combination therapies, novel drug delivery systems, and innovative patient support services.
  • Astellas Pharma Inc. and Takeda Pharmaceutical Company Limited announced a merger in October 2020 which is expected to be completed in 2023. This merger is intended to create a global leader in the development and commercialisation of innovative treatments for patients with benign prostatic hyperplasia (BPH). The companies plan to use their combined expertise, capabilities, and resources to develop novel products and treatments for BPH, such as combination therapies, novel drug delivery systems, and innovative patient support services.
  • Bayer AG and Johnson & Johnson announced a merger in January 2021 which is expected to be completed in 2023. This merger is aimed at creating a global leader in the development and commercialisation of innovative treatments for patients with benign prostatic hyperplasia (BPH). The companies plan to use their combined expertise, capabilities, and resources to develop novel products and treatments for BPH, such as combination therapies, novel drug delivery systems, and innovative patient support services.
  • Novartis AG and Merck & Co. announced a merger in April 2021 which is expected to be completed in 2023. This merger is intended to create a global leader in the development and commercialisation of innovative treatments for patients with benign prostatic hyperplasia (BPH). The companies plan to use their combined expertise, capabilities, and resources to develop novel products and treatments for BPH, such as combination therapies, novel drug delivery systems, and innovative patient support services.

Frequently Asked Questions (FAQ):

To speak to our analyst for a discussion on the above findings, click Speak to Analyst

TABLE OF CONTENTS

1 INTRODUCTION (Page No. - 23)
    1.1 OBJECTIVES OF THE STUDY
    1.2 MARKET DEFINITION
           1.2.1 INCLUSIONS AND EXCLUSIONS
    1.3 MARKET SCOPE
           1.3.1 MARKETS COVERED
           1.3.2 YEARS CONSIDERED FOR THE STUDY
    1.4 CURRENCY
    1.5 STAKEHOLDERS
    1.6 LIMITATIONS OF THE CURRENT EDITION

2 RESEARCH METHODOLOGY (Page No. - 27)
    2.1 RESEARCH DATA
           FIGURE 1 RESEARCH DESIGN
           2.1.1 SECONDARY DATA
                    2.1.1.1 Key data from secondary sources
           2.1.2 PRIMARY DATA
           FIGURE 2 BREAKDOWN OF PRIMARY INTERVIEWS: BY COMPANY TYPE, DESIGNATION,  AND REGION
                    2.1.2.1 Key data from primary sources
    2.2 MARKET SIZE ESTIMATION
           FIGURE 3 RESEARCH METHODOLOGY: HYPOTHESIS BUILDING
           2.2.1 BOTTOM-UP APPROACH
           FIGURE 4 BPH TREATMENT MARKET: BOTTOM-UP APPROACH
           2.2.2 GROWTH FORECAST
           2.2.3 TOP-DOWN APPROACH
           FIGURE 5 BPH TREATMENT MARKET: TOP-DOWN APPROACH
    2.3 MARKET BREAKDOWN AND DATA TRIANGULATION
           FIGURE 6 DATA TRIANGULATION METHODOLOGY
    2.4 ASSUMPTIONS FOR THE STUDY

3 EXECUTIVE SUMMARY (Page No. - 35)
           FIGURE 7 BPH TREATMENT MARKET, BY TYPE, 2021 VS. 2026 (USD BILLION)
           FIGURE 8 BPH TREATMENT MARKET, BY END USER, 2021 VS. 2026 (USD BILLION)
           FIGURE 9 BPH TREATMENT MARKET, BY REGION, 2021 VS. 2026 (USD BILLION)

4 PREMIUM INSIGHTS (Page No. - 37)
    4.1 BENIGN PROSTATIC HYPERPLASIA TREATMENT MARKET OVERVIEW
           FIGURE 10 INCREASING PREVALENCE OF BPH IS THE MAJOR FACTOR DRIVING THE GROWTH OF THIS MARKET
    4.2 NORTH AMERICA: BENIGN PROSTATIC HYPERPLASIA TREATMENT MARKET SHARE, BY TYPE (2020)
           FIGURE 11 DRUG TREATMENT TO DOMINATE THE NORTH AMERICAN MARKET IN 2020
    4.3 GEOGRAPHICAL SNAPSHOT OF THE BENIGN PROSTATIC HYPERPLASIA TREATMENT MARKET
           FIGURE 12 JAPAN TO REGISTER THE HIGHEST CAGR DURING THE FORECAST PERIOD

5 MARKET OVERVIEW (Page No. - 39)
    5.1 INTRODUCTION
    5.2 MARKET DYNAMICS
           FIGURE 13 BPH TREATMENT MARKET: DRIVERS, RESTRAINTS, OPPORTUNITIES, AND CHALLENGES
           5.2.1 DRIVERS
                    5.2.1.1 Increasing prevalence of benign prostatic hyperplasia
           FIGURE 14 SHARE OF MALE POPULATION AGED 65 AND ABOVE, GLOBAL (2015-2019)
                    5.2.1.2 Increasing obesity
                    5.2.1.3 Rising preference for minimally invasive surgeries
                    5.2.1.4 Investments, funds, and grants for research in BPH treatment
                    5.2.1.5 Availability of reimbursement for surgeries
           TABLE 1 CPT CODES FOR BPH SURGERIES
           5.2.2 RESTRAINTS
                    5.2.2.1 Side-effects associated with BPH medications
           TABLE 2 SIDE-EFFECTS OF BPH DRUGS
           5.2.3 OPPORTUNITIES
                    5.2.3.1 Emerging markets
                    5.2.3.2 Promising product pipeline
           TABLE 3 PIPELINE DRUGS
           5.2.4 CHALLENGES
                    5.2.4.1 Low awareness regarding prostate health among men
                    5.2.4.2 Product recalls in the BPH treatment market
           TABLE 4 PRODUCT RECALLS IN THE BPH TREATMENT MARKET
    5.3 VALUE CHAIN ANALYSIS
           FIGURE 15 VALUE CHAIN ANALYSIS: MAJOR VALUE IS ADDED DURING THE MANUFACTURING AND ASSEMBLY PHASE
    5.4 SUPPLY CHAIN ANALYSIS
           FIGURE 16 DIRECT DISTRIBUTION—THE PREFERRED STRATEGY OF PROMINENT COMPANIES
    5.5 ECOSYSTEM ANALYSIS
           FIGURE 17 ECOSYSTEM ANALYSIS OF THE PHARMACEUTICAL INDUSTRY
           FIGURE 18 ECOSYSTEM ANALYSIS OF THE UROLOGY DEVICES MARKET
    5.6 REGULATORY SCENARIO
           5.6.1 PHARMACEUTICAL INDUSTRY
                    5.6.1.1 Regulatory requirements
                               5.6.1.1.1 EU regulations
                               5.6.1.1.2 US regulations
           5.6.2 MEDICAL DEVICES INDUSTRY
           TABLE 5 LIST OF REGULATORY AUTHORITIES
                    5.6.2.1 Regulatory requirements
                               5.6.2.1.1 EU regulations
                               5.6.2.1.2 US regulations
    5.7 AVERAGE SELLING PRICE TREND
           TABLE 6 AVERAGE SELLING PRICE OF BPH DRUGS
           TABLE 7 AVERAGE SELLING PRICE OF BPH TREATMENT PROCEDURES
           TABLE 8 AVERAGE SELLING PRICE OF DEVICES USED IN BPH TREATMENT PROCEDURES
    5.8 TECHNOLOGY ANALYSIS
    5.9 PESTLE ANALYSIS
    5.1 COVID-19 IMPACT ANALYSIS ON THE BPH TREATMENT MARKET
    5.11 EPIDEMIOLOGY OF BENIGN PROSTATIC HYPERPLASIA (2019)
           TABLE 9 BPH: COUNTRY-WISE PREVALENCE, 2019

6 BENIGN PROSTATIC HYPERPLASIA TREATMENT MARKET, BY TYPE (Page No. - 56)
    6.1 INTRODUCTION
           TABLE 10 BENIGN PROSTATIC HYPERPLASIA TREATMENT MARKET, BY TYPE,  2018–2026 (USD MILLION)
    6.2 DRUG TREATMENT
           TABLE 11 BPH DRUG TREATMENT MARKET, BY CLASS, 2018–2026 (USD MILLION)
           TABLE 12 BPH DRUG TREATMENT MARKET, BY REGION, 2018–2026 (USD MILLION)
           6.2.1 ALPHA BLOCKERS
           TABLE 13 BPH DRUG TREATMENT MARKET FOR ALPHA BLOCKERS, BY TYPE,  2018–2026 (USD MILLION)
           TABLE 14 BPH DRUG TREATMENT MARKET FOR ALPHA BLOCKERS, BY REGION,  2018–2026 (USD MILLION)
                    6.2.1.1 Tamsulosin
                               6.2.1.1.1 Tamsulosin has been prescribed for BPH since 2000
           TABLE 15 TAMSULOSIN MARKET, BY REGION, 2018–2026 (USD MILLION)
                    6.2.1.2 Silodosin
                               6.2.1.2.1 Benefits of silodosin and launch of generics support market growth
           TABLE 16 SILODOSIN MARKET, BY REGION, 2018–2026 (USD MILLION)
                    6.2.1.3 Alfuzosin
                               6.2.1.3.1 Side-effects and fewer generic launches have hindered market growth to some extent
           TABLE 17 ALFUZOSIN MARKET, BY REGION, 2018–2026 (USD MILLION)
                    6.2.1.4 Doxazosin
                               6.2.1.4.1 Doxazosin was introduced in 2005 and has seen many generic launches since
           TABLE 18 DOXAZOSIN MARKET, BY REGION, 2018–2026 (USD MILLION)
                    6.2.1.5 Other alpha blockers
           TABLE 19 OTHER ALPHA BLOCKERS MARKET, BY REGION, 2018–2026 (USD MILLION)
           6.2.2 5-ALPHA REDUCTASE INHIBITORS
           TABLE 20 BPH DRUG TREATMENT MARKET FOR 5-ARIS, BY TYPE, 2018–2026 (USD MILLION)
           TABLE 21 BPH DRUG TREATMENT MARKET FOR 5-ARIS, BY REGION, 2018–2026 (USD MILLION)
                    6.2.2.1 Dutasteride
                               6.2.2.1.1 Availability of generics post-patent expiry support market growth
           TABLE 22 DUTASTERIDE MARKET, BY REGION, 2018–2026 (USD MILLION)
                    6.2.2.2 Finasteride
                               6.2.2.2.1 Finasteride provides a range of benefits but is less effective than alpha blockers in improving LUTS
           TABLE 23 FINASTERIDE MARKET, BY REGION, 2018–2026 (USD MILLION)
           6.2.3 OTHER DRUG CLASSES
           TABLE 24 OTHER BPH DRUG CLASSES MARKET, BY REGION, 2018–2026 (USD MILLION)
    6.3 SURGICAL TREATMENT
           TABLE 25 BPH SURGICAL TREATMENT MARKET, BY TYPE, 2018–2026 (USD MILLION)
           TABLE 26 BPH SURGICAL TREATMENT MARKET, BY REGION, 2018–2026 (USD MILLION)
           6.3.1 TRANSURETHRAL RESECTION OF THE PROSTATE
                    6.3.1.1 TURP is the gold standard for BPH treatment
           TABLE 27 BPH SURGICAL TREATMENT MARKET FOR TURP, BY REGION, 2018–2026 (USD MILLION)
           6.3.2 LASER SURGERY
                    6.3.2.1 Evolution in lasers and high efficacy have supported the demand for laser surgery
           TABLE 28 BPH SURGICAL TREATMENT MARKET FOR LASER SURGERY, BY REGION,  2018–2026 (USD MILLION)
           6.3.3 TRANSURETHRAL MICROWAVE THERMOTHERAPY
                    6.3.3.1 TUMT has a lower risk of bleeding and requires no hospital stay, which has driven preference
           TABLE 29 BPH SURGICAL TREATMENT MARKET FOR TUMT, BY REGION, 2018–2026 (USD MILLION)
           6.3.4 UROLIFT THERAPY
                    6.3.4.1 Low rate of post-implantation surgical intervention indicates high effectiveness of UroLift and the potential for adoption
           TABLE 30 BPH SURGICAL TREATMENT MARKET FOR UROLIFT THERAPY, BY REGION,  2018–2026 (USD MILLION)
           6.3.5 TRANSURETHRAL NEEDLE ABLATION OF THE PROSTATE
                    6.3.5.1 Reimbursement coverage and growing preference for TUNA drive market growth
           TABLE 31 BPH SURGICAL TREATMENT MARKET FOR TUNA, BY REGION, 2018–2026 (USD MILLION)
           6.3.6 REZUM THERAPY
                    6.3.6.1 The cost-effectiveness and efficacy of Rezum water vapor therapy are driving demand for the procedure
           TABLE 32 BPH SURGICAL TREATMENT MARKET FOR REZUM THERAPY, BY REGION,  2018–2026 (USD MILLION)
           6.3.7 PROSTATIC STENTING
                    6.3.7.1 Prostatic stenting is a temporary measure conducted under local anesthesia
           TABLE 33 BPH SURGICAL TREATMENT MARKET FOR PROSTATIC STENTING, BY REGION,  2018–2026 (USD MILLION)
           6.3.8 OTHER SURGERIES
           TABLE 34 OTHER BPH SURGICAL TREATMENTS MARKET, BY REGION, 2018–2026 (USD MILLION)

7 BENIGN PROSTATIC HYPERPLASIA TREATMENT MARKET,  BY END USER (Page No. - 73)
    7.1 INTRODUCTION
           TABLE 35 BENIGN PROSTATIC HYPERPLASIA TREATMENT MARKET, BY END USER,  2018–2026 (USD MILLION)
    7.2 HOME HEALTHCARE
           7.2.1 LARGE PATIENT POPULATION USING MEDICATIONS TO DRIVE THE GROWTH OF THE SEGMENT
           TABLE 36 BPH TREATMENT MARKET FOR HOME HEALTHCARE, BY REGION,  2018–2026 (USD MILLION)
    7.3 HOSPITALS & CLINICS
           7.3.1 RISING PREFERENCE FOR MINIMALLY INVASIVE SURGERIES TO DRIVE THE GROWTH OF THE SEGMENT
           TABLE 37 BPH TREATMENT MARKET FOR HOSPITALS & CLINICS, BY REGION,  2018–2026 (USD MILLION)

8 BENIGN PROSTATIC HYPERPLASIA TREATMENT MARKET,  BY REGION (Page No. - 77)
    8.1 INTRODUCTION
           TABLE 38 BENIGN PROSTATIC HYPERPLASIA TREATMENT MARKET, BY REGION,  2018–2026 (USD MILLION)
    8.2 NORTH AMERICA
           FIGURE 19 NORTH AMERICA: BPH TREATMENT MARKET SNAPSHOT
           TABLE 39 NORTH AMERICA: BPH TREATMENT MARKET, BY COUNTRY, 2018–2026 (USD MILLION)
           TABLE 40 NORTH AMERICA: BPH TREATMENT MARKET, BY TYPE, 2018–2026 (USD MILLION)
           TABLE 41 NORTH AMERICA: BPH DRUG TREATMENT MARKET, BY CLASS,  2018–2026 (USD MILLION)
           TABLE 42 NORTH AMERICA: BPH DRUG TREATMENT MARKET FOR ALPHA BLOCKERS, BY TYPE, 2018, 2018–2026 (USD MILLION)
           TABLE 43 NORTH AMERICA: BPH TREATMENT MARKET FOR 5-ARIS, BY TYPE,  2018–2026 (USD MILLION)
           TABLE 44 NORTH AMERICA: BPH SURGICAL TREATMENT MARKET, BY TYPE,  2018–2026 (USD MILLION)
           TABLE 45 NORTH AMERICA: BPH TREATMENT MARKET, BY END USER, 2018–2026 (USD MILLION)
           8.2.1 US
                    8.2.1.1 The US holds the largest share of the North American market
           TABLE 46 US: BPH TREATMENT MARKET, BY TYPE, 2018–2026 (USD MILLION)
           TABLE 47 US: BPH DRUG TREATMENT MARKET, BY CLASS, 2018–2026 (USD MILLION)
           TABLE 48 US: BPH DRUG TREATMENT MARKET FOR ALPHA BLOCKERS, BY TYPE,  2018–2026 (USD MILLION)
           TABLE 49 US: BPH TREATMENT MARKET FOR 5-ARIS, BY TYPE, 2018–2026 (USD MILLION)
           TABLE 50 US: BPH SURGICAL TREATMENT MARKET, BY TYPE, 2018–2026 (USD MILLION)
           TABLE 51 US: BPH TREATMENT MARKET, BY END USER, 2018–2026 (USD MILLION)
           8.2.2 CANADA
                    8.2.2.1 Rising geriatric population and product approvals to support market growth
           TABLE 52 CANADA: BPH TREATMENT MARKET, BY TYPE, 2018–2026 (USD MILLION)
           TABLE 53 CANADA: BPH DRUG TREATMENT MARKET, BY CLASS, 2018–2026 (USD MILLION)
           TABLE 54 CANADA: BPH DRUG TREATMENT MARKET FOR ALPHA BLOCKERS, BY TYPE,  2018–2026 (USD MILLION)
           TABLE 55 CANADA: BPH TREATMENT MARKET FOR 5-ARIS, BY TYPE, 2018–2026 (USD MILLION)
           TABLE 56 CANADA: BPH SURGICAL TREATMENT MARKET, BY TYPE, 2018–2026 (USD MILLION)
           TABLE 57 CANADA: BPH TREATMENT MARKET, BY END USER, 2018–2026 (USD MILLION)
    8.3 EUROPE
           TABLE 58 EUROPE: BPH TREATMENT MARKET, BY COUNTRY, 2018–2025 (USD MILLION)
           TABLE 59 EUROPE: BPH TREATMENT MARKET, BY TYPE, 2018–2026 (USD MILLION)
           TABLE 60 EUROPE: BPH DRUG TREATMENT MARKET, BY CLASS, 2018–2026 (USD MILLION)
           TABLE 61 EUROPE: BPH DRUG TREATMENT MARKET FOR ALPHA BLOCKERS, BY TYPE,  2018–2026 (USD MILLION)
           TABLE 62 EUROPE: BPH TREATMENT MARKET FOR 5-ARIS, BY TYPE, 2018–2026 (USD MILLION)
           TABLE 63 EUROPE: BPH SURGICAL TREATMENT MARKET, BY TYPE, 2018–2026 (USD MILLION)
           TABLE 64 EUROPE: BPH TREATMENT MARKET, BY END USER, 2018–2026 (USD MILLION)
           8.3.1 GERMANY
                    8.3.1.1 Increasing healthcare expenditure to support German market growth
           TABLE 65 GERMANY: BPH TREATMENT MARKET, BY TYPE, 2018–2026 (USD MILLION)
           TABLE 66 GERMANY: BPH DRUG TREATMENT MARKET, BY CLASS, 2018–2026 (USD MILLION)
           TABLE 67 GERMANY: BPH DRUG TREATMENT MARKET FOR ALPHA BLOCKERS,  BY TYPE, 2018, 2018–2026 (USD MILLION)
           TABLE 68 GERMANY: BPH TREATMENT MARKET FOR 5-ARIS, BY TYPE, 2018–2026 (USD MILLION)
           TABLE 69 GERMANY: BPH SURGICAL TREATMENT MARKET, BY TYPE, 2018–2026 (USD MILLION)
           TABLE 70 GERMANY: BPH TREATMENT MARKET, BY END USER, 2018–2026 (USD MILLION)
           8.3.2 UK
                    8.3.2.1 Availability of innovative treatment options to drive the market in the UK
           TABLE 71 UK: BPH TREATMENT MARKET, BY TYPE, 2018–2026 (USD MILLION)
           TABLE 72 UK: BPH DRUG TREATMENT MARKET, BY CLASS, 2018–2026 (USD MILLION)
           TABLE 73 UK: BPH DRUG TREATMENT MARKET FOR ALPHA BLOCKERS, BY TYPE,  2018–2026 (USD MILLION)
           TABLE 74 UK: BPH TREATMENT MARKET FOR 5-ARIS, BY TYPE, 2018–2026 (USD MILLION)
           TABLE 75 UK: BPH SURGICAL TREATMENT MARKET, BY TYPE, 2018–2026 (USD MILLION)
           TABLE 76 UK: BPH TREATMENT MARKET, BY END USER, 2018–2026 (USD MILLION)
           8.3.3 FRANCE
                    8.3.3.1 Rising geriatric population to accelerate the growth of the market
           TABLE 77 FRANCE: BPH TREATMENT MARKET, BY TYPE, 2018–2026 (USD MILLION)
           TABLE 78 FRANCE: BPH DRUG TREATMENT MARKET, BY CLASS, 2018–2026 (USD MILLION)
           TABLE 79 FRANCE: BPH DRUG TREATMENT MARKET FOR ALPHA BLOCKERS, BY TYPE,  2018–2026 (USD MILLION)
           TABLE 80 FRANCE: BPH TREATMENT MARKET FOR 5-ARIS, BY TYPE, 2018–2026 (USD MILLION)
           TABLE 81 FRANCE: BPH SURGICAL TREATMENT MARKET, BY TYPE, 2018–2026 (USD MILLION)
           TABLE 82 FRANCE: BPH TREATMENT MARKET, BY END USER, 2018–2026 (USD MILLION)
           8.3.4 REST OF EUROPE
           TABLE 83 ROE: BPH TREATMENT MARKET, BY TYPE, 2018–2026 (USD MILLION)
           TABLE 84 ROE: BPH DRUG TREATMENT MARKET, BY CLASS, 2018–2026 (USD MILLION)
           TABLE 85 ROE: BPH DRUG TREATMENT MARKET FOR ALPHA BLOCKERS, BY TYPE, 2018,  2018–2026 (USD MILLION)
           TABLE 86 ROE: BPH TREATMENT MARKET FOR 5-ARIS, BY TYPE, 2018–2026 (USD MILLION)
           TABLE 87 ROE: BPH SURGICAL TREATMENT MARKET, BY TYPE, 2018–2026 (USD MILLION)
           TABLE 88 ROE: BPH TREATMENT MARKET, BY END USER, 2018–2026 (USD MILLION)
    8.4 ASIA PACIFIC
           FIGURE 20 ASIA PACIFIC: BPH TREATMENT MARKET SNAPSHOT
           TABLE 89 ASIA PACIFIC: BPH TREATMENT MARKET, BY COUNTRY, 2018–2026 (USD MILLION)
           TABLE 90 ASIA PACIFIC: BPH TREATMENT MARKET, BY TYPE, 2018–2026 (USD MILLION)
           TABLE 91 ASIA PACIFIC: BPH DRUG TREATMENT MARKET, BY CLASS, 2018–2026 (USD MILLION)
           TABLE 92 ASIA PACIFIC: BPH DRUG TREATMENT MARKET FOR ALPHA BLOCKERS, BY TYPE, 2018, 2018–2026 (USD MILLION)
           TABLE 93 ASIA PACIFIC: BPH TREATMENT MARKET FOR 5-ARIS, BY TYPE,  2018–2026 (USD MILLION)
           TABLE 94 ASIA PACIFIC: BPH SURGICAL TREATMENT MARKET, BY TYPE, 2018–2026 (USD MILLION)
           TABLE 95 ASIA PACIFIC: BPH TREATMENT MARKET, BY END USER, 2018–2026 (USD MILLION)
           8.4.1 JAPAN
                    8.4.1.1 Japan holds the largest share of the APAC market
           TABLE 96 JAPAN: BPH TREATMENT MARKET, BY TYPE, 2018–2026 (USD MILLION)
           TABLE 97 JAPAN: BPH DRUG TREATMENT MARKET, BY CLASS, 2018–2026 (USD MILLION)
           TABLE 98 JAPAN: BPH DRUG TREATMENT MARKET FOR ALPHA BLOCKERS, BY TYPE, 2018,  2018–2026 (USD MILLION)
           TABLE 99 JAPAN: BPH TREATMENT MARKET FOR 5-ARIS, BY TYPE, 2018–2026 (USD MILLION)
           TABLE 100 JAPAN: BPH SURGICAL TREATMENT MARKET, BY TYPE, 2018–2026 (USD MILLION)
           TABLE 101 JAPAN: BPH TREATMENT MARKET, BY END USER, 2018–2026 (USD MILLION)
           8.4.2 CHINA
                    8.4.2.1 Increasing obese population to support market growth
           TABLE 102 CHINA: BPH TREATMENT MARKET, BY TYPE, 2018–2026 (USD MILLION)
           TABLE 103 CHINA: BPH DRUG TREATMENT MARKET, BY CLASS, 2018–2026 (USD MILLION)
           TABLE 104 CHINA: BPH DRUG TREATMENT MARKET FOR ALPHA BLOCKERS, BY TYPE, 2018,  2018–2026 (USD MILLION)
           TABLE 105 CHINA: BPH TREATMENT MARKET FOR 5-ARIS, BY TYPE, 2018–2026 (USD MILLION)
           TABLE 106 CHINA: BPH SURGICAL TREATMENT MARKET, BY TYPE, 2018–2026 (USD MILLION)
           TABLE 107 CHINA: BPH TREATMENT MARKET, BY END USER, 2018–2026 (USD MILLION)
           8.4.3 INDIA
                    8.4.3.1 Rising prevalence of obesity to accelerate market growth in India
           TABLE 108 INDIA: BPH TREATMENT MARKET, BY TYPE, 2018–2026 (USD MILLION)
           TABLE 109 INDIA: BPH DRUG TREATMENT MARKET, BY CLASS, 2018–2026 (USD MILLION)
           TABLE 110 INDIA: BPH DRUG TREATMENT MARKET FOR ALPHA BLOCKERS, BY TYPE, 2018,  2018–2026 (USD MILLION)
           TABLE 111 INDIA: BPH TREATMENT MARKET FOR 5-ARIS, BY TYPE, 2018–2026 (USD MILLION)
           TABLE 112 INDIA: BPH SURGICAL TREATMENT MARKET, BY TYPE, 2018–2026 (USD MILLION)
           TABLE 113 INDIA: BPH TREATMENT MARKET, BY END USER, 2018–2026 (USD MILLION)
           8.4.4 REST OF ASIA PACIFIC
           TABLE 114 ROAPAC: BPH TREATMENT MARKET, BY TYPE, 2018–2026 (USD MILLION)
           TABLE 115 ROAPAC: BPH DRUG TREATMENT MARKET, BY CLASS, 2018–2026 (USD MILLION)
           TABLE 116 ROAPAC: BPH DRUG TREATMENT MARKET FOR ALPHA BLOCKERS, BY TYPE,  2018–2026 (USD MILLION)
           TABLE 117 ROAPAC: BPH TREATMENT MARKET FOR 5-ARIS, BY TYPE, 2018–2026 (USD MILLION)
           TABLE 118 ROAPAC: BPH SURGICAL TREATMENT MARKET, BY TYPE, 2018–2026 (USD MILLION)
           TABLE 119 ROAPAC: BPH TREATMENT MARKET, BY END USER, 2018–2026 (USD MILLION)
    8.5 REST OF THE WORLD
           TABLE 120 ROW: BPH TREATMENT MARKET, BY TYPE, 2018–2026 (USD MILLION)
           TABLE 121 ROW: BPH DRUG TREATMENT MARKET, BY CLASS, 2018–2026 (USD MILLION)
           TABLE 122 ROW: BPH DRUG TREATMENT MARKET FOR ALPHA BLOCKERS, BY TYPE, 2018,  2018–2026 (USD MILLION)
           TABLE 123 ROW: BPH TREATMENT MARKET FOR 5-ARIS, BY TYPE, 2018–2026 (USD MILLION)
           TABLE 124 ROW: BPH SURGICAL TREATMENT MARKET, BY TYPE, 2018–2026 (USD MILLION)
           TABLE 125 ROW: BPH TREATMENT MARKET, BY END USER, 2018–2026 (USD MILLION)

9 COMPETITIVE LANDSCAPE & COMPANY PROFILES (Page No. - 112)
    9.1 COMPETITIVE LANDSCAPE
           9.1.1 OVERVIEW
           FIGURE 21 KEY DEVELOPMENTS IN THE BPH TREATMENT MARKET, JANUARY 2017–JANUARY 2021
           FIGURE 22 MARKET EVOLUTION FRAMEWORK: JANUARY 2017 TO JANUARY 2021
           9.1.2 MARKET SHARE ANALYSIS, 2019
                    9.1.2.1 BPH Drug Treatment Market Share Analysis, 2019
           FIGURE 23 BPH DRUG TREATMENT MARKET SHARE ANALYSIS, 2019
                    9.1.2.2 BPH Surgical Treatment Market Share Analysis, 2019
           FIGURE 24 BPH SURGICAL TREATMENT MARKET SHARE ANALYSIS, 2019
           9.1.3 COMPETITIVE SCENARIO
                    9.1.3.1 Product launches and approvals
           TABLE 126 KEY PRODUCT LAUNCHES & APPROVALS, JANUARY 2017−JANUARY 2021
                    9.1.3.2 Acquisitions
           TABLE 127 KEY ACQUISITIONS, JANUARY 2017−JANUARY 2021
                    9.1.3.3 Agreements and collaborations
           TABLE 128 KEY AGREEMENTS AND COLLABORATIONS, JANUARY 2017−JANUARY 2021
                    9.1.3.4 Expansions
           TABLE 129 KEY EXPANSIONS, JANUARY 2017−JANUARY 2021
                    9.1.3.5 Other developments
           TABLE 130 OTHER DEVELOPMENTS, JANUARY 2017−JANUARY 2021
           9.1.4 COMPANY EVALUATION MATRIX
                    9.1.4.1 Stars
                    9.1.4.2 Emerging Leaders
                    9.1.4.3 Pervasive Companies
                    9.1.4.4 Participants
           FIGURE 25 BPH TREATMENT MARKET: COMPANY EVALUATION MATRIX, 2019
           9.1.5 COMPETITIVE LEADERSHIP MAPPING (START-UPS AND SMES)
                    9.1.5.1 Progressive Companies
                    9.1.5.2 Starting Blocks
                    9.1.5.3 Responsive Companies
                    9.1.5.4 Dynamic Companies
           FIGURE 26 BPH TREATMENT MARKET: VENDOR DIVE MATRIX FOR SMES AND START-UPS, 2019
    9.2 COMPANY PROFILES
(Business overview, Products offered, Recent Developments, MNM view)* 
           9.2.1 GLAXOSMITHKLINE
           FIGURE 27 GLAXOSMITHKLINE PLC: COMPANY SNAPSHOT (2019)
           9.2.2 ASTELLAS PHARMA
           FIGURE 28 ASTELLAS PHARMA INC.: COMPANY SNAPSHOT (2019)
           9.2.3 MERCK
           FIGURE 29 MERCK: COMPANY SNAPSHOT (2019)
           9.2.4 ELI LILLY AND COMPANY
           FIGURE 30 ELI LILLY AND COMPANY: COMPANY SNAPSHOT (2019)
           9.2.5 TELEFLEX INCORPORATED
           FIGURE 31 TELEFLEX INCORPORATED: COMPANY SNAPSHOT (2019)
           9.2.6 ABBOTT LABORATORIES
           FIGURE 32 ABBOTT LABORATORIES: COMPANY SNAPSHOT (2019)
           9.2.7 BOSTON SCIENTIFIC CORPORATION
           FIGURE 33 BOSTON SCIENTIFIC CORPORATION: COMPANY SNAPSHOT (2019)
           9.2.8 PFIZER
           FIGURE 34 PFIZER: COMPANY SNAPSHOT (2019)
           9.2.9 OLYMPUS CORPORATION
           FIGURE 35 OLYMPUS CORPORATION: COMPANY SNAPSHOT (2019)
           9.2.10 ALEMBIC
           FIGURE 36 ALEMBIC: COMPANY SNAPSHOT (2019)
           9.2.11 ASAHI KASEI CORPORATION
           FIGURE 37 ASAHI KASEI CORPORATION: COMPANY SNAPSHOT (2019)
           9.2.12 ALLERGAN
           FIGURE 38 ALLERGAN: COMPANY SNAPSHOT (2019)
           9.2.13 COLOPLAST GROUP
           FIGURE 39 COLOPLAST GROUP: COMPANY SNAPSHOT (2020)
           9.2.14 IPG PHOTONICS CORPORATION
           FIGURE 40 IPG PHOTONICS CORPORATION: COMPANY SNAPSHOT (2019)
           9.2.15 KARL STORZ SE & CO. KG
           9.2.16 RICHARD WOLF GMBH
           9.2.17 LUMENIS LTD.
           9.2.18 UNILAB, INC.
           9.2.19 PHAREX HEALTH CORP
           9.2.20 BIOLITEC AG
           9.2.21 UROLOGIX, LLC.
           9.2.22 ADVIN HEALTH CARE
           9.2.23 MEDIFOCUS INC.
           9.2.24 ASCLEPION LASER TECHNOLOGIES GMBH
           9.2.25 PNN MEDICAL A/S
           9.2.26 SURGICAL LASERS INC.
           9.2.27 QUANTA SYSTEM
           9.2.28 ALLIUM LTD
           9.2.29 SRS MEDICAL
*Details on Business overview, Products offered, Recent Developments, MNM view might not be captured in case of unlisted companies. 

10 APPENDIX (Page No. - 150)
     10.1 INDUSTRY INSIGHTS
     10.2 DISCUSSION GUIDE
     10.3 KNOWLEDGE STORE: MARKETSANDMARKETS’ SUBSCRIPTION PORTAL
     10.4 AVAILABLE CUSTOMIZATIONS
     10.5 RELATED REPORTS
     10.6 AUTHOR DETAILS


The study involved four major activities to estimate the current size of the benign prostatic hyperplasia treatment market. Exhaustive secondary research was done to collect information on the market and its different subsegments. The next step was to validate these findings, assumptions, and sizing with industry experts across the value chain through primary research. Both top-down and bottom-up approaches were employed to estimate the complete market size. Thereafter, market breakdown and data triangulation procedures were used to estimate the market size of the segments and subsegments.

Secondary Research

In the secondary research process, various secondary sources such as annual reports, press releases & investor presentations of companies, white papers, certified publications, articles by recognized authors, gold-standard & silver-standard websites, regulatory bodies, and databases (such as D&B Hoovers, Bloomberg Business, and Factiva) were referred to in order to identify and collect information for this study.

Primary Research

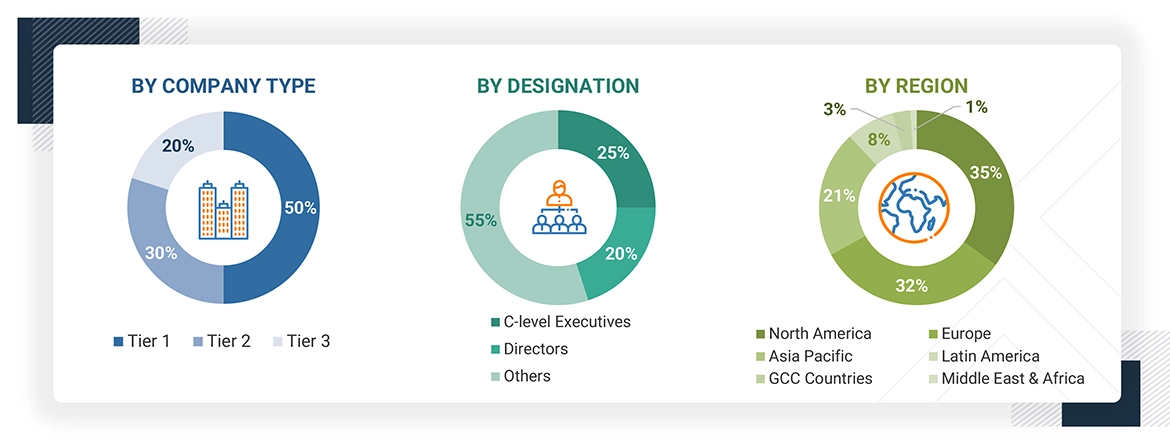
Several stakeholders such as benign prostatic hyperplasia treatment manufacturers, vendors, distributors, researchers, and doctors from hospitals and clinics were consulted for this report. The demand side of this market is characterized by significant use of benign prostatic hyperplasia treatment due to , the increasing prevalence of benign prostatic hyperplasia, the rising preference for minimally invasive surgeries, increasing obesity rate, and investments, funds, and grants for research in the field of BPH. Various primary sources from both the supply and demand sides of the market were interviewed to obtain qualitative and quantitative information. The following is a breakdown of the primary respondents:

Benign Prostatic Hyperplasia Treatment Market Size

To know about the assumptions considered for the study, download the pdf brochure

Market Size Estimation

Both top-down and bottom-up approaches were used to estimate and validate the total size of the benign prostatic hyperplasia treatment market. These methods were also used extensively to estimate the size of various subsegments in the market. The research methodology used to estimate the market size includes the following:

  • The key players in the industry and markets have been identified through extensive secondary research
  • The industry’s supply chain and market size, in terms of value, have been determined through primary and secondary research processes
  • All percentage shares, splits, and breakdowns have been determined using secondary sources and verified through primary sources

Data Triangulation

After arriving at the overall market size-using the market size estimation processes-the market was split into several segments and subsegments. To complete the overall market engineering process and arrive at the exact statistics of each market segment and sub-segment, the data triangulation and market breakdown procedures were employed, wherever applicable. The data was triangulated by studying various factors and trends from both the demand and supply sides in the benign prostatic hyperplasia treatment industry.

Report Objectives

  • To define, describe, and forecast the benign prostatic hyperplasia treatment market on the basis of type, end user, and region.
  • To provide detailed information regarding the major factors influencing market growth (such as drivers, restraints, and opportunities, Covid-19 Impact Analysis)
  • To strategically analyse micromarkets with respect to individual growth trends, prospects, and contributions to the overall benign prostatic hyperplasia treatment market
  • To analyse market opportunities for stakeholders and provide details of the competitive landscape for key players
  • To forecast the size of the market segments in four geographical regions, namely, North America, Europe, the Asia Pacific, and Rest of the World.
  • To profile the key players and comprehensively analyse their product portfolios, market positions, and core competencies.
  • To track and analyse competitive developments such as product launches and approvals, partnerships, expansions, and acquisitions in the benign prostatic hyperplasia treatment market

Available Customizations

With the given market data, MarketsandMarkets offers customizations as per the company’s specific needs. The following customization options are available for the report:

Geographic Analysis

  • Further breakdown of the benign prostatic hyperplasia treatment market into specific countries/regions in the Rest of Europe and the Rest of Asia Pacific.

Company Information

  • Detailed analysis and profiling of additional market players (up to 3) inclusive of:
  • Business Overview
  • Financial Information
  • Product Portfolio
  • Developments (last three years)
Custom Market Research Services

We will customize the research for you, in case the report listed above does not meet with your exact requirements. Our custom research will comprehensively cover the business information you require to help you arrive at strategic and profitable business decisions.

Request Customization

Instant Answers with GPT - Ask Now!

Ask real questions. Get complete answers !
Report Code
MD 7836
Published ON
Feb, 2021
Choose License Type
BUY NOW
  • SHARE
X
Request Customization
Speak to Analyst
Speak to Analyst
OR FACE-TO-FACE MEETING
PERSONALIZE THIS RESEARCH
  • Triangulate with your Own Data
  • Get Data as per your Format and Definition
  • Gain a Deeper Dive on a Specific Application, Geography, Customer or Competitor
  • Any level of Personalization
REQUEST A FREE CUSTOMIZATION
LET US HELP YOU!
  • What are the Known and Unknown Adjacencies Impacting the Benign Prostatic Hyperplasia Treatment Market
  • What will your New Revenue Sources be?
  • Who will be your Top Customer; what will make them switch?
  • Defend your Market Share or Win Competitors
  • Get a Scorecard for Target Partners
CUSTOMIZED WORKSHOP REQUEST
+1-888-600-6441
  • Call Us
  • +1-888-600-6441 (Corporate office hours)
  • +1-888-600-6441 (US/Can toll free)
  • +44-800-368-9399 (UK office hours)
CONNECT WITH US
ABOUT TRUST ONLINE
©2024 MarketsandMarkets Research Private Ltd. All rights reserved
DMCA.com Protection Status Website Feedback