Biopharmaceutical Process Analytical Technology Market

Biopharmaceutical Process Analytical Technology Market by Modality (Spectroscopy: Raman, IR, NMR; Chromatography: HPLC, GC; MS, qPCR, NGS), Product (Analyzer, Sensor, Software), Mode (Online, At-line), Application (Biologics, CGT)- Global Forecast to 2031



BIOPHARMACEUTICAL PROCESS ANALYTICAL TECHNOLOGY MARKET SIZE, SHARE & GROWTH SNAPSHOT
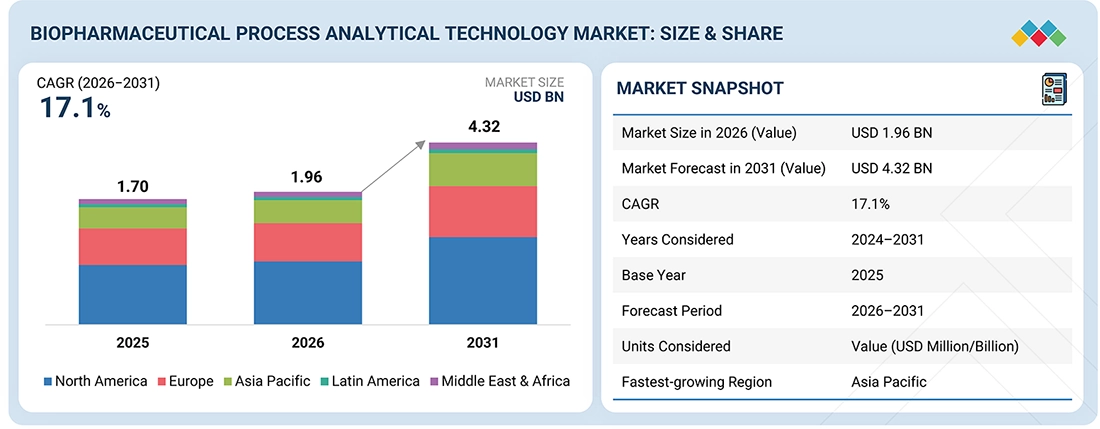
Source: Secondary Research, Interviews with Experts, MarketsandMarkets Analysis
The global biopharmaceutical process analytical technology market is projected to grow from USD 1.96 billion in 2026 to USD 4.32 billion by 2031, at a CAGR of 17.1% during the forecast period. The market was valued at USD 1.70 billion in 2025. The biopharmaceutical process analytical technology (PAT) market is experiencing strong growth, driven by the increasing adoption of biologics, biosimilars, cell and gene therapies, and continuous biomanufacturing. Manufacturers are increasingly implementing real-time process monitoring, AI- and machine learning-enabled analytics, digital twins, Raman spectroscopy, and advanced sensors to optimize production, enable real-time release testing (RTRT), reduce batch failures, and comply with Quality-by-Design (QbD) and stringent regulatory requirements. In addition, rising investments in smart biomanufacturing facilities, automation, and integrated data management platforms by biopharmaceutical companies and CDMOs are further accelerating the adoption of PAT solutions worldwide.
KEY TAKEAWAYS
-
MARKET SNAPSHOT:
Base Year Market Size (2025): USD 1.70 Billion
Current Market Size (2026): USD 1.96 Billion
Forecast Market Size (2031): USD 4.32 Billion
CAGR (2026–2031): 17.1% -
SEGMENT LEADERSHIP:
Regional Leader: North America accounted for the largest market share of 37% in 2025.
Type Leader: Liquid chromatography/HPLC segment is projected to register the highest CAGR of 17.7% during the forecast period of 2026–2031.
Technology Leader: Analyzers segment accounted for the largest market share of 38% in 2025.
System Type Leader: Online mode is expected to register the highest share of 45.0% in 2025.
Application Leader: Biosimilars & biologics are expected to register the highest share of 39.9% in 2025. -
MARKET OUTLOOK & COMPETITIVE LANDSCAPE:
Waters Corporation (US), Thermo Fisher Scientific (US), and Danaher Corporation (US), among others, are driving market growth through continuous investments in advanced analytical instruments, real-time monitoring solutions, automation, and AI-enabled data analytics to enhance bioprocess efficiency and ensure regulatory compliance. These companies are also expanding their portfolios through strategic acquisitions, partnerships, and integrated PAT platforms to support the growing demand for biologics, biosimilars, cell and gene therapies, and continuous biomanufacturing.
Hamilton Company (US), Endress+Hauser Group Services AG (Switzerland), and Metrohm (Switzerland), among others, are gaining traction by developing specialized solutions such as single-use sensors, Raman spectroscopy systems, advanced chemometrics software, and AI-enabled process monitoring platforms tailored for biologics, cell and gene therapies, and continuous bioprocessing.
A key growth trend in the biopharmaceutical process analytical technology (PAT) market is the growing integration of single-use bioprocessing systems with advanced PAT solutions to support flexible and efficient biomanufacturing. Biopharmaceutical manufacturers are increasingly adopting single-use technologies combined with inline sensors, automated monitoring, and real-time data analytics to enhance process control, reduce contamination risks, accelerate scale-up, and lower production costs. This trend is particularly driven by the expanding production of biologics, biosimilars, vaccines, and cell and gene therapies, where rapid manufacturing and consistent product quality are critical.
TRENDS & DISRUPTIONS IMPACTING CUSTOMERS' CUSTOMERS
The trends and disruptions impacting customers in the biopharmaceutical industry are centered on increasing demands for higher product quality, faster therapy development, stronger regulatory compliance, and greater manufacturing efficiency. End users expect consistent product quality, improved patient safety, and accelerated access to innovative therapies, compelling biopharmaceutical companies, CMOs/CDMOs, and research institutions to adopt real-time process monitoring, predictive analytics, and advanced process optimization technologies. At the same time, evolving global regulatory standards and Quality by Design (QbD) approaches are driving investments in compliance-focused manufacturing and technology transfer capabilities. These shifts are enabling more reliable and affordable biopharmaceutical supply, reducing batch failures and production delays, strengthening confidence in product safety and regulatory quality, and promoting the adoption of robust analytical methods that enhance operational resilience and improve patient outcomes.
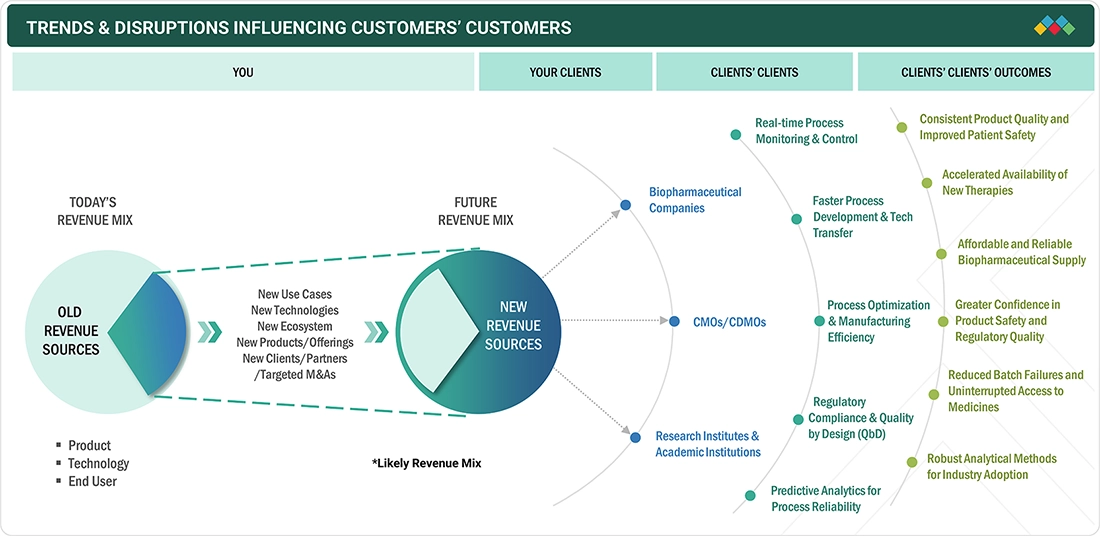
Source: Secondary Research, Interviews with Experts, MarketsandMarkets Analysis
MARKET DYNAMICS

Level
-
Rising adoption of continuous bioprocessing and real-time quality assurance

-
Increasing integration of Artificial Intelligence (AI), Machine Learning (ML), and advanced analytics in bioprocess monitoring


Level
-
High implementation costs and complex regulatory validation

-
Integration challenges with legacy biomanufacturing systems


Level
-
Expansion of PAT adoption in cell and gene therapy manufacturing

-
Growing demand for PAT in personalized medicine and mRNA-based therapeutics


Level
-
Managing and integrating large volumes of real-time process data

-
Shortage of skilled professionals with expertise in PAT, data analytics, and bioprocess engineering

Source: Secondary Research, Interviews with Experts, MarketsandMarkets Analysis
Driver: Increasing Integration of Artificial Intelligence (AI), Machine Learning (ML), and Advanced Analytics in Bioprocess Monitoring
Artificial intelligence (AI) and machine learning (ML) are reshaping biopharmaceutical manufacturing by enhancing Process Analytical Technology (PAT) through predictive process control, automated anomaly detection, and digital twin capabilities. AI-enabled PAT platforms analyze large volumes of data generated from spectroscopy, chromatography, and sensor-based technologies to predict process performance, identify potential deviations before they occur, and optimize critical process parameters in real time. This minimizes manual intervention, improves manufacturing efficiency, supports autonomous bioprocess operations, and ensures consistent product quality. For instance, Merck KGaA (MilliporeSigma) has integrated AI-driven data analytics into its Bio4C Software Suite, enabling predictive monitoring of bioprocess parameters and enhancing operational efficiency in biologics manufacturing.
Restraint: Integration Challenges with Legacy Biomanufacturing Systems
Many biopharmaceutical manufacturing facilities continue to rely on legacy batch-production infrastructure and outdated automation systems that are not fully compatible with modern process analytical technology (PAT) platforms. Integrating advanced sensors, spectroscopy systems, analytical software, and digital control technologies often requires significant infrastructure upgrades, process redesign, and seamless interoperability across equipment from multiple vendors. These challenges increase implementation complexity, extend deployment timelines, and raise overall adoption costs. A biologics manufacturing facility operating with an older Distributed Control System (DCS) may require extensive modifications before implementing real-time spectroscopy and advanced process monitoring solutions, leading to delayed PAT deployment and higher integration expenses.
Opportunity: Expansion of PAT Adoption in Cell and Gene Therapy Manufacturing
The rapid expansion of cell therapy, gene therapy, and regenerative medicine is driving demand for advanced Process Analytical Technology (PAT) solutions capable of monitoring complex biomanufacturing processes in real time. These advanced therapies involve highly sensitive biological materials that require precise control of critical quality attributes (CQAs) and process parameters to ensure product safety, efficacy, and consistency. PAT enables continuous monitoring of cell viability, metabolite concentrations, and other key process conditions, improving manufacturing efficiency, product quality, and regulatory compliance. As more cell and gene therapies progress toward commercial production, the adoption of specialized PAT solutions is expected to accelerate. For instance, manufacturers of CAR-T cell therapies are increasingly implementing inline sensors and real-time metabolite monitoring technologies to optimize cell expansion and maintain consistent product quality throughout the manufacturing process.
Challenge: Shortage of skilled professionals with expertise in PAT, data analytics, and bioprocess engineering
The successful implementation of process analytical technology (PAT) requires multidisciplinary expertise in bioprocess engineering, analytical chemistry, automation, data science, artificial intelligence (AI), and regulatory compliance. However, the limited availability of professionals with this diverse skill set presents a significant challenge for many biopharmaceutical manufacturers. Organizations often face difficulties in recruiting and training personnel capable of developing multivariate models, interpreting complex analytical data, and managing advanced PAT platforms, which can slow digital transformation and reduce the effectiveness of PAT deployment. For instance, many companies investing in digital biomanufacturing are expanding workforce training programs and collaborating with academic institutions to build specialized teams capable of operating AI-enabled PAT systems and advanced chemometric modeling tools.
BIOPHARMACEUTICAL PROCESS ANALYTICAL TECHNOLOGY MARKET: COMMERCIAL USE CASES ACROSS INDUSTRIES
| COMPANY | USE CASE DESCRIPTION | BENEFITS |
|---|---|---|
 |
Provides chromatography, mass spectrometry, and spectroscopy solutions for real-time monitoring of upstream, downstream, and quality control processes in biopharmaceutical manufacturing | Improves process understanding, enables real-time quality monitoring, reduces batch failures, supports FDA PAT and QbD initiatives, accelerates process development, and ensures regulatory compliance |
 |
Offers UPLC, LC-MS, and PAT systems for continuous process monitoring, protein purification, impurity analysis, and real-time release testing | Enhances process control, increases product yield, minimizes waste, supports continuous manufacturing, and enables faster product release |
 |
Delivers chromatography, spectroscopy, TOC analyzers, and automation solutions for bioprocess monitoring, purification, and cleaning validation | Enables continuous monitoring, improves workflow efficiency, enhances data integrity, reduces manual intervention, and ensures consistent product quality |
 |
Provides integrated PAT solutions through Cytiva, Pall, Beckman Coulter, and SCIEX for upstream, downstream, and continuous bioprocessing | Improves process scalability, enables real-time monitoring, reduces process variability, supports digital manufacturing, and accelerates biologics production |
Logos and trademarks shown above are the property of their respective owners. Their use here is for informational and illustrative purposes only.
MARKET ECOSYSTEM
The biopharmaceutical process analytical ecosystem is built around a collaborative network of analytical instrumentation manufacturers and pharmaceutical end users that together drive innovation, quality, and regulatory compliance across drug development and manufacturing. Molecular spectroscopy, mass spectrometry, and atomic spectroscopy technology providers, including Thermo Fisher Scientific, Agilent Technologies, Bruker, Waters, SCIEX, Shimadzu, PerkinElmer, ABB, and Analytik Jena, deliver advanced analytical solutions for process monitoring, characterization, and quality control. These technologies are widely adopted by leading biopharmaceutical companies such as Pfizer, Merck, Biogen, Novartis, and Catalent to improve manufacturing efficiency, ensure product consistency, meet stringent regulatory requirements, and accelerate the development and commercialization of safe and effective therapies, creating an interconnected ecosystem that supports continuous innovation and operational excellence.
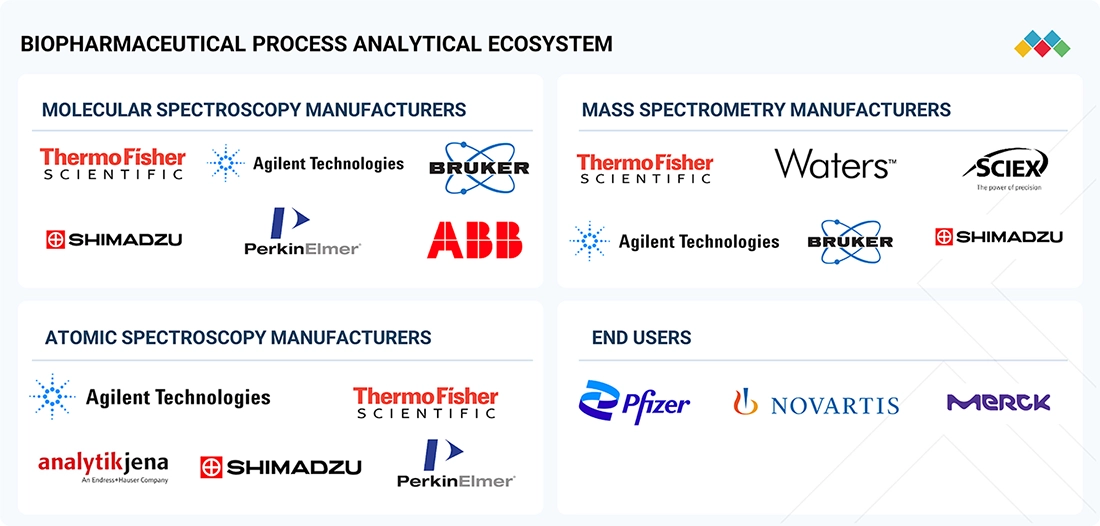
Logos and trademarks shown above are the property of their respective owners. Their use here is for informational and illustrative purposes only.
MARKET SEGMENTS
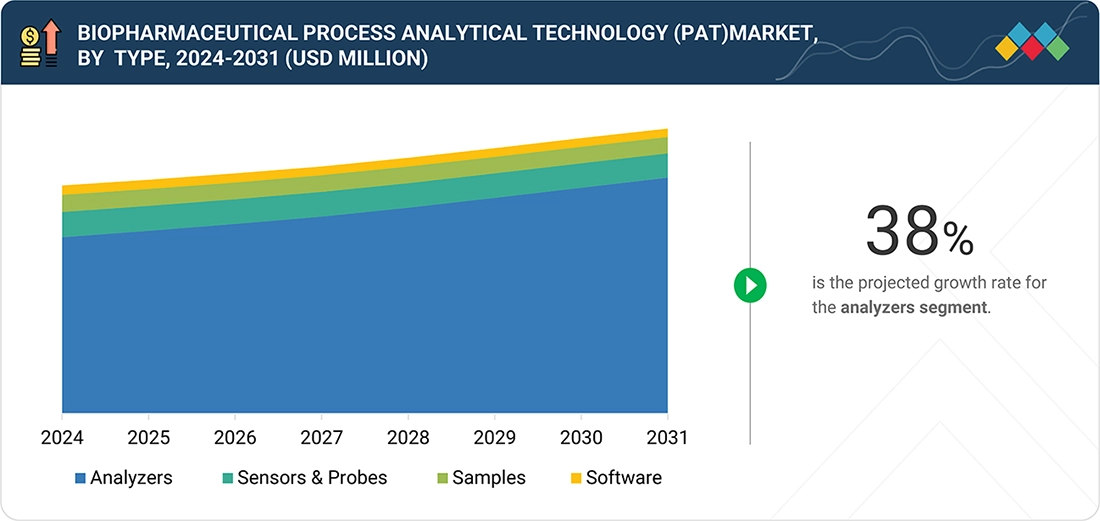
Source: Secondary Research, Interviews with Experts, MarketsandMarkets Analysis
Biopharmaceutical Process Analytical Technology (PAT) Market, By Type
The adoption of liquid chromatography/high-performance liquid chromatography (LC/HPLC) in the biopharmaceutical process analytical technology (PAT) market is growing steadily as biopharmaceutical manufacturers increasingly rely on high-resolution analytical techniques for real-time monitoring of critical quality attributes (CQAs), impurity profiling, protein characterization, and process validation. Advances in automated and high-throughput LC/HPLC systems, hyphenated techniques such as LC-MS, and software-driven data analytics are improving process efficiency, supporting continuous biomanufacturing, and enabling regulatory compliance under Quality-by-Design (QbD) and real-time release testing (RTRT) frameworks. The expanding production of monoclonal antibodies, vaccines, biosimilars, and cell and gene therapies is further driving demand for advanced LC/HPLC platforms capable of delivering accurate, reproducible, and rapid analytical results throughout the bioprocess lifecycle
Biopharmaceutical Process Analytical Technology (PAT) Market, By Product Type
The demand for analyzer products in the biopharmaceutical process analytical technology (PAT) market is increasing as biopharmaceutical manufacturers adopt advanced analytical instruments for continuous monitoring and control of critical process parameters (CPPs) and critical quality attributes (CQAs) during upstream and downstream processing. Technologies such as Raman, near-infrared (NIR), ultraviolet-visible (UV-Vis), mass spectrometry, and biochemical analyzers are being increasingly integrated with automation platforms, AI-driven analytics, and digital manufacturing systems to enable real-time process monitoring, predictive control, and enhanced product quality. The growing shift toward continuous bioprocessing, single-use technologies, biologics and biosimilar production, and regulatory initiatives promoting Quality-by-Design (QbD) and real-time release testing (RTRT) is further accelerating the adoption of advanced analyzer products across biopharmaceutical manufacturing facilities.
Biopharmaceutical Process Analytical Technology (PAT) Market, By Mode
The online measurement mode is witnessing significant growth in the biopharmaceutical process analytical technology (PAT) market as manufacturers increasingly adopt real-time, non-invasive monitoring solutions to continuously measure critical process parameters without interrupting production. The integration of online sensors, spectroscopic analyzers (such as Raman, NIR, and UV-Vis), and AI-driven process analytics enables faster process control, improved product consistency, reduced manual sampling, and compliance with Quality-by-Design (QbD) and real-time release testing (RTRT) requirements. The growing adoption of continuous bioprocessing, automation, and digital manufacturing technologies is further accelerating demand for online measurement systems across biologics, biosimilars, and advanced therapy manufacturing.
Biopharmaceutical Process Analytical Technology (PAT) Market, By Application
The vaccine segment is driving significant growth in the biopharmaceutical process analytical technology (PAT) market as vaccine manufacturers increasingly adopt real-time analytical tools to optimize upstream and downstream bioprocesses, ensure batch consistency, and accelerate production timelines. The rising demand for mRNA, recombinant, viral vector, and protein-based vaccines has increased the need for advanced PAT solutions, including spectroscopic analyzers, chromatography systems, and automated sensors, to monitor critical process parameters and critical quality attributes throughout manufacturing. Additionally, growing investments in pandemic preparedness, expansion of global vaccine manufacturing capacity, and regulatory emphasis on Quality-by-Design (QbD), continuous manufacturing, and real-time release testing (RTRT) are further driving the adoption of PAT technologies in vaccine production.
REGION
Asia-Pacific to be the fastest-growing region in the biopharmaceutical process analytical technology (PAT) market during the forecast period
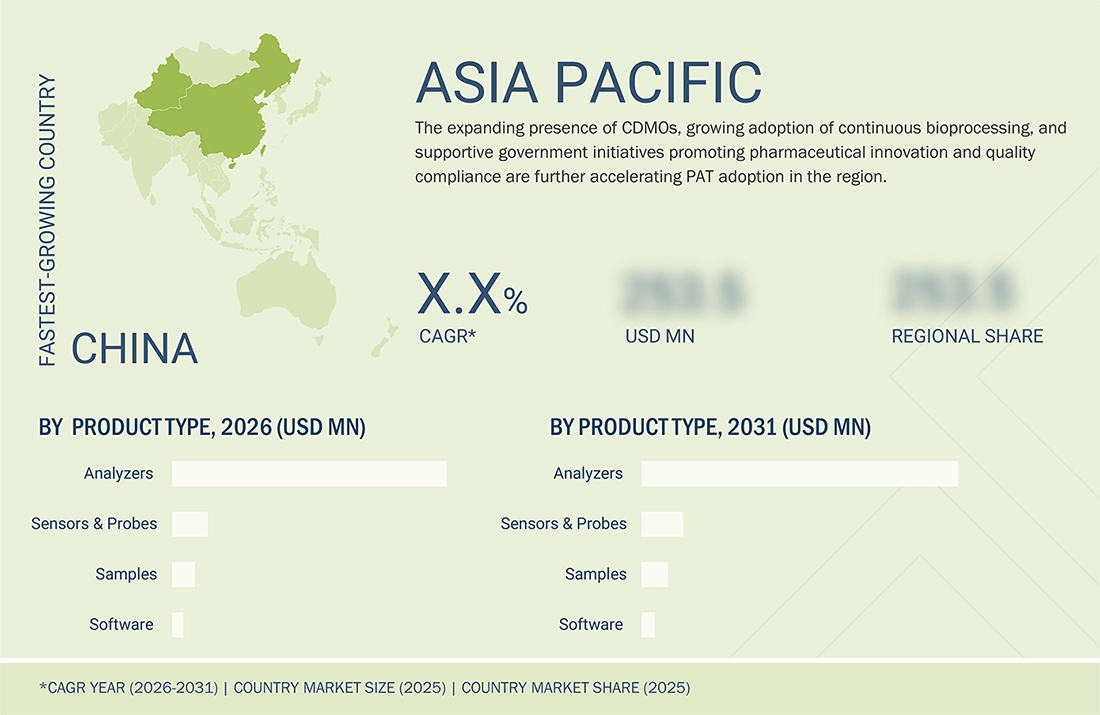
The Asia Pacific region is emerging as the fastest-growing market for biopharmaceutical process analytical technology (PAT), driven by rapid expansion of biopharmaceutical manufacturing, increasing investments in biologics, biosimilars, vaccines, and cell and gene therapy production, and growing adoption of advanced bioprocessing technologies across China, India, Japan, South Korea, and Singapore. Government initiatives supporting pharmaceutical innovation, expansion of contract development and manufacturing organizations (CDMOs), and increasing compliance with international regulatory standards are accelerating the implementation of PAT solutions for real-time process monitoring and quality control. Furthermore, rising healthcare expenditure, expanding research infrastructure, and the shift toward continuous biomanufacturing and digitalized production facilities are expected to further fuel demand for PAT technologies across the region.
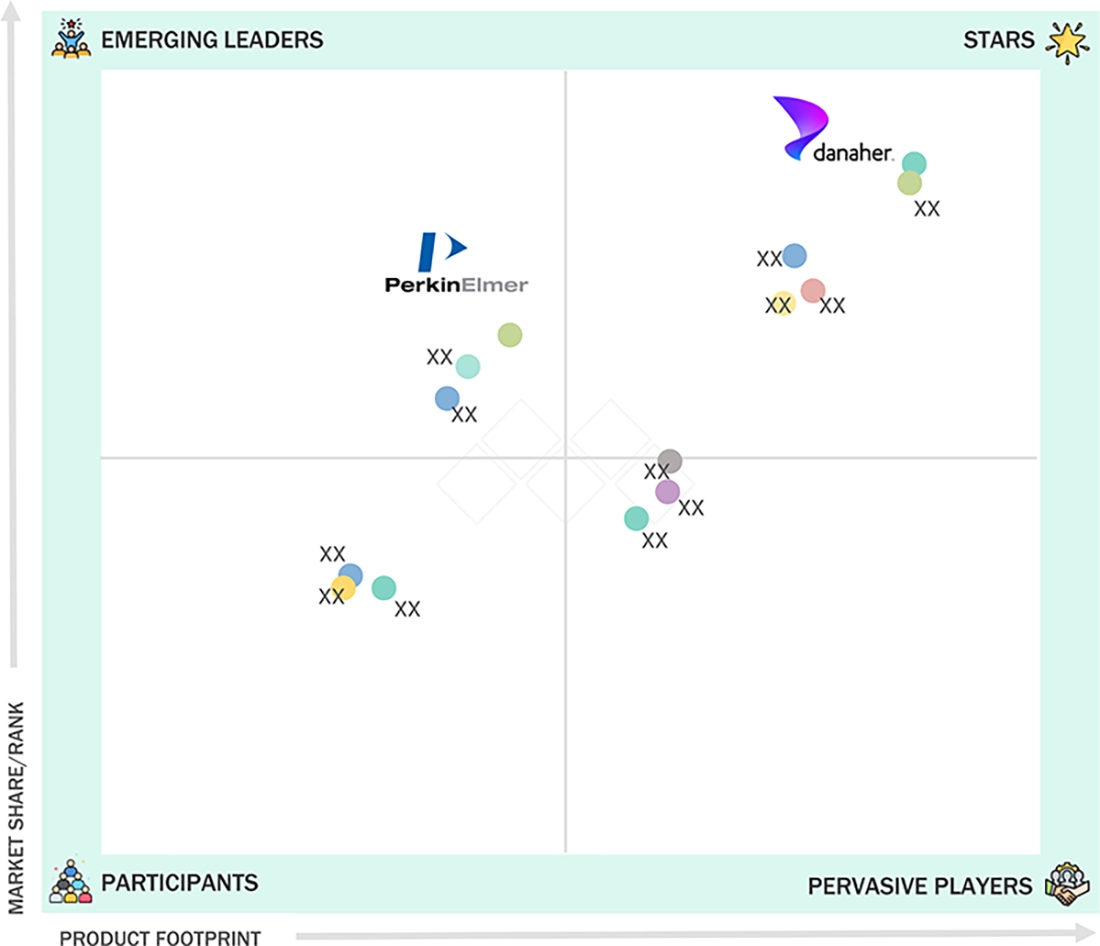
BIOPHARMACEUTICAL PROCESS ANALYTICAL TECHNOLOGY MARKET: COMPANY EVALUATION MATRIX
The competitive landscape of the biopharmaceutical process analytical technology (PAT) market indicates a moderately fragmented market with vendors positioned according to their market share/rank and product footprint. Danaher occupies the Stars quadrant, demonstrating a strong market presence supported by a broad product portfolio, advanced technological capabilities, and a well-established global customer base, making it the leading competitor in the market. PerkinElmer is positioned among the Emerging Leaders, reflecting its growing market influence and strong analytical expertise, although its overall product footprint remains smaller than that of the market leader. Several companies are distributed across the Pervasive Players quadrant, indicating broader product offerings but comparatively lower market share, suggesting opportunities to strengthen their competitive position through market expansion and innovation. Meanwhile, numerous vendors fall within the Participants quadrant, representing niche or regional players with limited product portfolios and lower market penetration that primarily compete through specialized solutions and targeted applications. Overall, the market exhibits a competitive environment characterized by one dominant leader, an emerging challenger, and a large number of developing competitors, with increasing demand for real-time process monitoring, Quality by Design (QbD), continuous bioprocessing, automation, and data-driven manufacturing expected to drive innovation, strategic collaborations, and intensified competition in the coming years.
Source: Secondary Research, Interviews with Experts, MarketsandMarkets Analysis
KEY MARKET PLAYERS
MARKET SCOPE
| REPORT METRIC | DETAILS |
|---|---|
| Market Size in 2026 (Value) | USD 1.96 billion |
| Market Forecast in 2031 (value) | USD 4.32 billion |
| Growth Rate | CAGR of 17.1% from 2026–2031 |
| Years Considered | 2024–2031 |
| Base Year | 2025 |
| Forecast Period | 2026–2031 |
| Units Considered | Value (USD Billion) |
| Report Coverage | Revenue forecast, company ranking, competitive landscape, growth factors, and trends |
| Segments Covered |
|
| Country Covered | North America, Europe, Asia-Pacific, Latin America, Middle East & Africa |
WHAT IS IN IT FOR YOU: BIOPHARMACEUTICAL PROCESS ANALYTICAL TECHNOLOGY MARKET REPORT CONTENT GUIDE
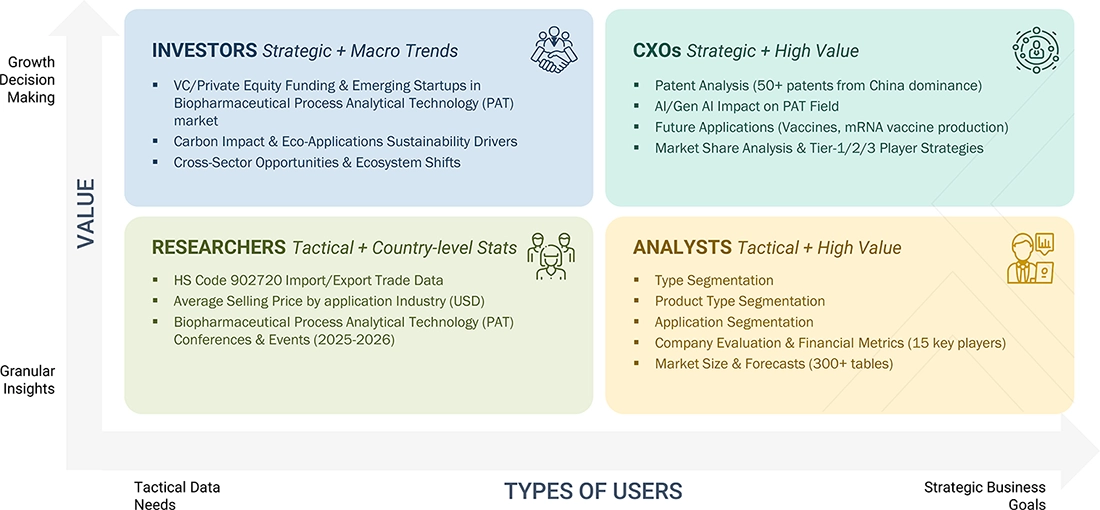
DELIVERED CUSTOMIZATIONS
We have successfully delivered the following deep-dive customizations:
| CLIENT REQUEST | CUSTOMIZATION DELIVERED | VALUE ADDS |
|---|---|---|
| Biopharmaceutical Companies |
|
|
RECENT DEVELOPMENTS
- June 2026 : Agilent Technologies Inc. and Sound Analytics, LLC have announced a partnership to provide an integrated liquid chromatography–triple quadrupole mass spectrometry (LC/MS) workflow aimed at supporting drug metabolism and pharmacokinetics (DMPK) applications in biopharmaceutical and pharmaceutical research.
- May 2026 : Thermo Fisher Scientific expanded its global bioanalytical capabilities by opening a new bioanalytical and biomarker laboratory in Gothenburg, Sweden, strengthening support for pharmaceutical and biotechnology customers across all stages of drug development.
- October 2025 : Thermo Fisher Scientific launched the Thermo Scientific Orbitrap Exploris EFOX Mass Detector, the first high-resolution Orbitrap system designed for environmental and food safety laboratories, enabling faster and more accurate detection of contaminants such as PFAS, pesticides, and other pollutants to support regulatory compliance and public health monitoring.
- May 2025 : The compact, high-speed design of the 8850 GC makes it one of the smallest and fastest benchtop GC/MS systems, ideal for laboratories requiring high performance in a space-saving format.
Table of Contents
 Exclusive indicates content/data unique to MarketsandMarkets and not available with any competitors.
Methodology
The biopharmaceutical process analytical technology market was assessed through a balanced combination of primary and secondary research, with a detailed evaluation of key market variables influencing small, medium, and large enterprises. Primary interviews with industry experts across the value chain were conducted to validate the research findings, assumptions, and market estimates. The overall market size was determined using both top-down and bottom-up estimation approaches, ensuring robust and reliable analysis. The study further evaluates market segments, emerging trends, regulatory developments, competitive landscape, and the strategic initiatives adopted by leading market participants. Finally, data triangulation was applied to reconcile findings from multiple sources and methodologies, resulting in accurate market size estimates, while primary research was used throughout the study to validate key assumptions and hypotheses.
Secondary Research
During the study, secondary research was conducted using a range of sources, including directories and databases such as Bloomberg Businessweek, D&B Hoovers, and Factiva. Additional materials included white papers, annual reports, SEC filings, and investor presentations. This research approach was adopted to collect and analyze data that provides comprehensive, technical, and market-focused insights into the biopharmaceutical process analytical technology market. The findings offer insights into key players and market segmentation, informed by recent industry trends and significant developments. A database comprising leading industry figures was also created as part of this secondary research.
Primary Research
Primary research involved activities designed to gather both qualitative and quantitative data. A variety of individuals from both the supply and demand sides were interviewed during this phase. On the supply side, key figures such as CEOs, vice presidents, directors of marketing and sales, directors of technology and innovation, and other important leaders were interviewed by industry experts. On the demand side, primary sources included academic institutions and research organizations. This research aimed to validate market segmentation, identify prominent market participants, and gain insights into significant industry trends and market dynamics through a real-world primary study.
Following is the breakdown of primary respondents:
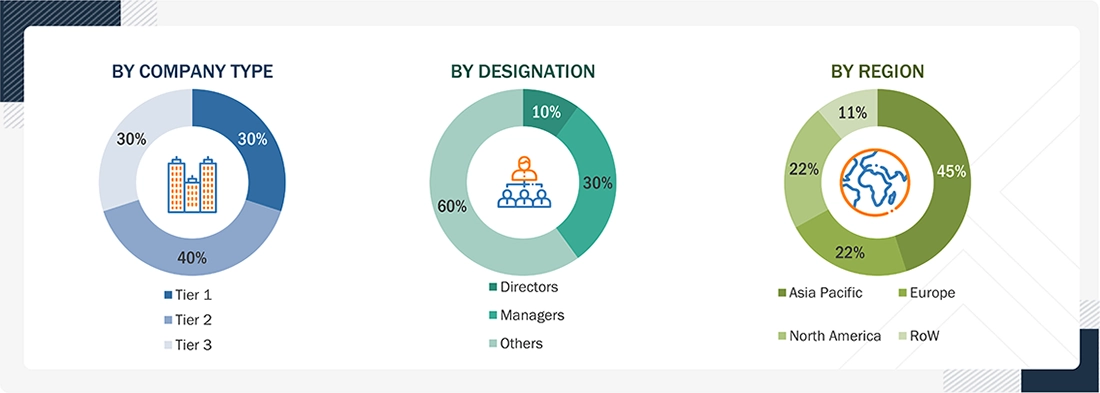
Note: Others include distributors, suppliers, product managers, business development managers, marketing managers, and sales managers.
Companies are categorized into tiers based on their total revenue. As of 2025, Tier 1 = > USD 1,000 million, Tier 2 = USD 500–1,000 million, and Tier 3 = < USD 500 million.
To know about the assumptions considered for the study, download the pdf brochure
Market Size Estimation
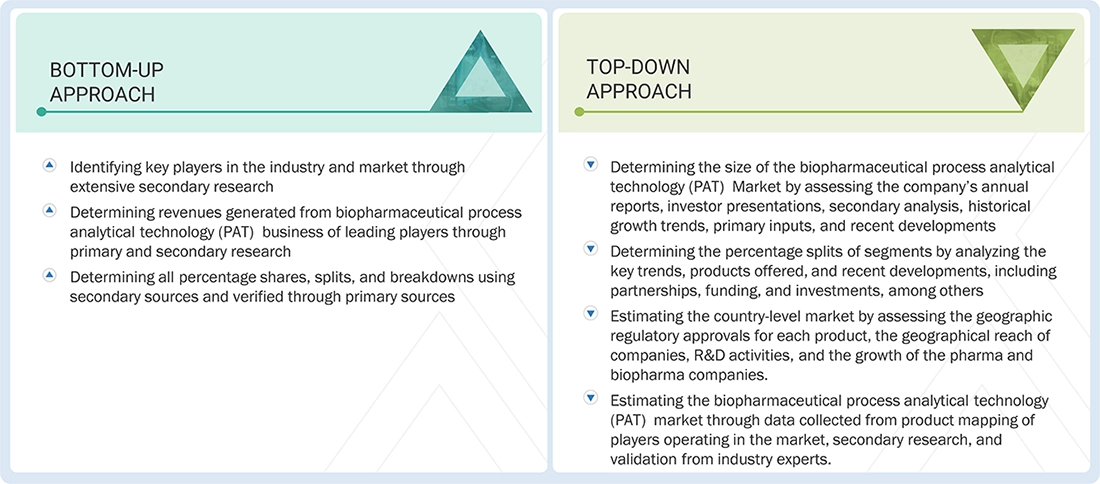
This report provides an analysis of the global biopharmaceutical process analytical technology market size by reviewing the revenue shares of prominent companies. Key players with significant market shares were identified through secondary research, and their revenue from biopharmaceutical process analytical technology sales was calculated and subsequently validated through primary research. The secondary research included an analysis of annual and financial reports from leading market participants. Meanwhile, the primary research involved in-depth interviews with key thought leaders, such as directors, CEOs, and marketing executives.
To calculate the global market value, segmental revenues were determined based on the revenue mapping of service and product providers. The process involved the following steps:
- Generating a list of key players that operate in the biopharmaceutical process analytical technology market at regional or global levels
- Mapping the products of manufacturers of biopharmaceutical process analytical technology and related product lines at the regional level
- Mapping the revenues of listed players through the sales of biopharmaceutical process analytical technology and related products
- Mapping the revenues of major players to cover at least ~40% of the global market share as of 2025
- Extrapolating the mapped revenues of players to arrive at the global market value for the respective segment
- Summing up the market value for all segments and subsegments to achieve the actual value of the global biopharmaceutical process analytical technology market
Biopharmaceutical Process Analytical Technology Market : Top-Down and Bottom-Up Approach
Data Triangulation
Following the estimation of the overall market size, the biopharmaceutical process analytical technology market was segmented into various subsegments. The market engineering process was completed through data triangulation and detailed market segmentation to generate accurate estimates for each segment and subsegment. This process involved evaluating key trends and factors from both the demand and supply sides. The market estimates were further validated using a combination of top-down and bottom-up approaches to ensure the accuracy and consistency of the findings.
Market Definition
The biopharmaceutical process analytical technology (PAT) market comprises analytical instruments and technologies used to monitor, measure, and control critical process parameters and product quality attributes during biopharmaceutical manufacturing in real time. This market includes solutions such as liquid chromatography (HPLC), gas chromatography, mass spectrometry, real-time PCR/qPCR, next-generation sequencing (NGS), nuclear magnetic resonance (NMR) spectroscopy, Raman spectroscopy, infrared spectroscopy, particle counters and imaging, differential light scattering, and other advanced analytical techniques. These technologies enable process optimization, regulatory compliance, improved product quality, and efficient manufacturing across biologics, vaccines, cell and gene therapies, and other biopharmaceutical products.
Key Stakeholders
- Process analytical technology manufacturers, suppliers, and providers
- Pharmaceutical & biopharmaceutical firms
- Contract research organizations (CROs)
- Academic & private research institutions
- Research & development (R&D) companies
- Medical research laboratories
- Academic institutions & private research institutions
- Regulatory agencies
- Quality control & assurance companies
- Contract manufacturing organizations (CMOs)
- Environmental & safety regulatory bodies
- Public & private research institutions
- Third-party testing laboratories
Report Objectives
- To define, describe, and forecast the size of the biopharmaceutical process analytical technology (PAT) market based on type, technology, mode, application, and region
- To provide detailed information regarding the factors influencing the growth potential of the global biopharmaceutical process analytical technology market (drivers, restraints, opportunities, challenges, and trends)
- To analyze micro markets with respect to individual growth trends, prospects, and contributions to the global biopharmaceutical process analytical technology market.
- To analyze key growth opportunities in the global biopharmaceutical process analytical technology market for key stakeholders and provide details of the competitive landscape for market leaders
- To forecast the size of market segments and/or subsegments concerning five regions, namely, North America (US and Canada), Europe (Germany, France, the UK, Spain, Italy, and the rest of Europe), Asia Pacific (Japan, China, India, Australia, South Korea, and the rest of Asia Pacific), Latin America (Brazil, Mexico, and the rest of Latin America), and the Middle East & Africa (GCC Countries and the rest of the Middle East & Africa).
- To profile the key players in the biopharmaceutical process analytical technology market and comprehensively analyze their market shares and core competencies
- To track and analyze the competitive developments undertaken in the global biopharmaceutical process analytical technology market, such as product launches/approvals, agreements, expansions, collaborations, and acquisitions
Available customizations:
With the given market data, MarketsandMarkets offers customizations based on your company’s specific needs. The following customization options are available for the present global biopharmaceutical process analytical technology (PAT) market report:
Product Analysis
-
Product matrix, which gives a detailed comparison of the product portfolios of the top 15 companies
Company Information
- Detailed analysis and profiling of additional market players (up to 13)
Geographical Analysis
-
Further breakdown of the Rest of Europe biopharmaceutical process analytical technology (PAT) market into Russia, Belgium, the Netherlands, Switzerland, Austria, Finland, Sweden, Poland, and Portugal
-
Further breakdown of the Rest of Asia Pacific biopharmaceutical process analytical technology (PAT)market into Singapore, Taiwan, New Zealand, the Philippines, Malaysia, and other Asia Pacific countries
-
Further breakdown of the Rest of Latin America biopharmaceutical process analytical technology (PAT) market into Argentina, Chile, Peru, and Colombia


Personalize This Research
- Triangulate with your Own Data
- Get Data as per your Format and Definition
- Gain a Deeper Dive on a Specific Application, Geography, Customer or Competitor
- Any level of Personalization
Let Us Help You
- What are the Known and Unknown Adjacencies Impacting the Biopharmaceutical Process Analytical Technology Market
- What will your New Revenue Sources be?
- Who will be your Top Customer; what will make them switch?
- Defend your Market Share or Win Competitors
- Get a Scorecard for Target Partners

Custom Market Research Services
We Will Customise The Research For You, In Case The Report Listed Above Does Not Meet With Your Requirements
Get 10% Free CustomisationTESTIMONIALS

JAYANT RAJPUROHIT
Director of Market Insights, Data and Analytics
SFI Health,
Leading Pharmaceutical Companywww.sfihealth.com/

We at SFI Health approached MarketsandMarkets for an Opportunity Assessment on "Incidence and Prevalence of Focus Indications" as we wanted to know the most attractive HCPs like Physician, Functional MD, Naturopath and Pharmacist. The project was critical for us to ensure our focus on the right target which would enable sustainable growth and profitability for SFI Health. The business insights provided exceeded our expectations and we were extremely impressed. The team at MarketsandMarkets is highly professional and detail oriented and very well understood our business needs. MarketsandMarkets offers a unique combination of expertise and dedicated engagement model. We identified 2 new products to be launched in coming months, based on the research findings provided by MarketsandMarkets. We are happy with the services and would strongly recommend MarketsandMarkets to my peers in the industry.

BEATRIZ DE LA CALLE
Head of Commercial Analytics
Qualicaps,
Leading Pharmaceutical Companywww.qualicaps.com/

We partnered with MarketsandMarkets for an assessment study on hard empty capsules. The team was extremely professional in understanding our business requirements and we received timely responses to all our queries. The market intelligence and the recommendations has met our business requirements. We were extremely impressed to see the final study results; it really exceeded our expectations. The market intelligence offered by MarketsandMarkets, and clarity on next steps will help us achieve our business objective for the Year 2021. We are happy with the services and would strongly recommend MarketsandMarkets to my peers in the industry.

Bob Williams,
Senior Director Business Development & Innovation
Bracco Diagnostics Inc.,
Italian Multinational in life sciences sector and a World Leader in imaging diagnosticsimaging.bracco.com/us-en
We were pleased with targeted insights that MarketsandMarkets identified from a custom study on the 'Radiation Dose Management Solutions Market'. Your team identified and characterized the market participants as well as underlying trends accurately. This study was useful to Bracco in formulating business strategies for our dose monitoring product lines and we thank MarketsandMarkets for the job well done.
Cody Coonradt,
Market Development and Strategy Manager
3M Health Information Systems,
Leader in Health care Coding, Payment & Analytics Solutions.www.3m.com/3M/en_US/health-information-systems-us
The value for our organization comes from three things: depth of research, specificity of segments and being easy to work with. As important as the first two are, the third can't be underestimated. MarketsandMarkets, maybe more than any other research vendor, wants to know what is top of mind for our team and what big questions we are grappling to answer.
Their customer first approach and high value engagement model, have given us great analysis and excellent value for money
- US Biopharmaceutical Process Analytical Technology Market
- Canada Biopharmaceutical Process Analytical Technology Market
- Germany Biopharmaceutical Process Analytical Technology Market
- France Biopharmaceutical Process Analytical Technology Market
- UK Biopharmaceutical Process Analytical Technology Market
- Italy Biopharmaceutical Process Analytical Technology Market
- Spain Biopharmaceutical Process Analytical Technology Market
- China Biopharmaceutical Process Analytical Technology Market
- Japan Biopharmaceutical Process Analytical Technology Market
- India Biopharmaceutical Process Analytical Technology Market
- Australia Biopharmaceutical Process Analytical Technology Market
- South Korea Biopharmaceutical Process Analytical Technology Market
- Brazil Biopharmaceutical Process Analytical Technology Market
- Mexico Biopharmaceutical Process Analytical Technology Market
- Rest Of Europe Biopharmaceutical Process Analytical Technology Market
- Rest Of Asia Pacific Biopharmaceutical Process Analytical Technology Market
- Rest Of Latin America Biopharmaceutical Process Analytical Technology Market






Growth opportunities and latent adjacency in Biopharmaceutical Process Analytical Technology Market