Border Security Market Size, Share, Trends & Growth Analysis

Report Code AS 4257
Published in Jul, 2024, By MarketsandMarkets™
Download PDF

Choose License Type

Buy Report Now Inquire Before Buying

Border Security Market by Domain (Land, Maritime, Airborne), Vertical (Military, Homeland Security), System (Surveillance Systems, Detection Systems, Communication Systems, Command and Control Systems), Installation & Region – Global Forecast to 2029

Overview

The global Border Security Market was valued at USD 26.8 billion in 2024 and is projected to grow from USD 28.20 billion in 2025 to USD 34.4 billion by 2029, at a CAGR of 5.1% during the forecast period. This growth trajectory is driven by the rising geopolitical instability and increasing terrorist incidents necessitating enhanced border security measures. The adoption of advanced technologies such as autonomous systems, biometric identification systems, and the Internet of Things (IoT) is reshaping the landscape of border security, providing sophisticated tools for monitoring and defense. However, the market faces challenges with stringent regulatory frameworks and privacy concerns, which can hinder the swift deployment of new technologies.

Key Takeaways:

•  The Global Border Security Industry was valued at USD 26.8 billion in 2024 and is projected to grow from USD 28.20 billion in 2025 to USD 34.4 billion by 2029, at a CAGR of 5.1% during the forecast period.

•  By Technology: The integration of AI-powered analytics and satellite imaging is enhancing border surveillance capabilities, providing real-time data and predictive insights to thwart illegal activities.

•  By System: Surveillance systems, including advanced camera networks and radar systems, are crucial in facilitating continuous monitoring and detection, thereby boosting market growth.

•  By Application: Homeland security applications are expanding with a focus on anti-terrorism operations and drug trafficking prevention, driven by the global rise in these threats.

•  By End User: Military and defense sectors are increasing their investments in border security technologies to address rising territorial conflicts and enhance reconnaissance capabilities.

•  By Region: ASIA PACIFIC is expected to grow fastest at a 6.1% CAGR, fueled by escalating defense budgets and the modernization of border security infrastructure.

•  Industry Trends: The market is witnessing a shift towards digitalization and smart manufacturing, with blockchain and generative AI poised to redefine border security operations.

In conclusion, the Border Security Market is poised for significant growth, driven by technological advancements and increasing government investments in security infrastructure. The ongoing modernization of systems and the integration of cutting-edge technologies present lucrative opportunities for market participants. However, navigating regulatory challenges and ensuring interoperability across systems remain critical for sustained progress. As geopolitical tensions and security threats persist, the demand for robust and efficient border security measures is expected to rise, driving long-term market expansion.

Attractive Opportunities in the Border Security Market

NORTH AMERICA

The North America market is expected to lead the market. The growth in this market is attributed to the technological innovation, and substantial defense spending in the region

By domain, the land platform segment of the market is projected to reach USD 21.8 billion by 2029, growing at a CAGR of 5.4%.

Product developments and contracts are expected to offer lucrative opportunities to market players in the next five years.

The market growth in North America can be attributed to significant investments in R&D activities and technological advancements.

Market growth can be attributed to the need for enhanced situational awareness to protect borders.

Global Border Security Market Dynamics

Driver: Public safety concerns near border areas

Public safety concerns near border areas significantly drive the demand for the border security market due to the critical need to prevent illegal activities that threaten the safety and security of a nation's citizens. Border regions are often hotspots for unlawful activities such as drug trafficking, human trafficking, and smuggling of weapons, which pose serious risks to public security. Governments and security agencies are increasingly investing in advanced technologies and strategies to monitor and secure borders effectively, aiming to deter and detect illegal crossings and safeguard against potential threats.

For instance, the US President's FY25 Budget includes a notable USD 1.9 billion increase in the base budget for Customs and Border Protection (CBP), and Immigration and Customs Enforcement (ICE), representing a 7 percent rise. This funding boost is aimed at bolstering the operational capacity of these agencies, enabling them to better manage and secure US borders against a variety of threats. This includes the deployment of advanced surveillance technologies, improved infrastructure, and enhanced personnel training to ensure more effective border control and immigration enforcement.

Restraint: Stringent regulations

Stringent regulations pose significant restraints on the border security market by limiting the flexibility and responsiveness of companies involved in this market. Regulations often impose rigorous standards on the development, testing, and deployment of border security technologies, which can delay the introduction of innovative solutions. For instance, manufacturers of surveillance equipment, such as drones and biometric scanners, must navigate complex approval processes set by agencies like the Federal Aviation Administration (FAA) and the Department of Homeland Security (DHS) in the US. These processes ensure that the technologies meet stringent safety and privacy standards, but they also slow down the ability to respond swiftly to emerging threats.


Opportunity: Infrastructure modernization of border security systems

The upgradation of existing border security infrastructure presents a significant opportunity within the border security market. With evolving threats and increasing demands for enhanced security measures, governments and agencies worldwide are investing heavily in modernizing their border protection capabilities. Companies operating in the border security market are leveraging these opportunities by developing innovative products and services tailored to the specific needs of border security agencies. This includes advanced surveillance systems, biometric identification tools, automated border control systems, and integrated command and control platforms. As nations prioritize the modernization of their border security frameworks, there is a growing demand for solutions that enhance situational awareness, streamline operations, and improve response times. This demand creates fertile ground for businesses to expand their portfolios and capture a larger market share, while contributing to the overall security and efficiency of border management processes.

Challenge: High Cost of R&D and requirement of critical infrastructure for testing border security systems

The cost incurred for the research and development of the border security system is on the higher side. Significant investments are required at different stages of the value chain of the security system especially in research and development, manufacturing, system integration and assembly stage. Border Security systems need to have attributes such as reliability, accuracy, durability, and energy efficiency among others. In a competitive scenario, to maintain technology leadership position, develop highly functional and efficient security systems, considerable amount of investment is required in the R&D, which includes research scholars, research centers, testing fields and infrastructure, collaboration with universities, research institutes and other companies.

Global Border Security Market Ecosystem Analysis


Based on domain, the land segment of the border security market is expected to lead the market.

Land segment is estimated to lead the market based on domain. Conflict, economic inequality, and climate change are putting increased pressure on people to migrate, which is forcing countries to strengthen border security at their land borders in order to better control and manage the movement of people. Stronger border security measures are required as a result of the increased risk of illegal activities like drug and people trafficking, human trafficking, and the entrance of terrorist and criminal forces..

Based on verticals, the Homeland Security segment will grow at the highest CAGR during the forecast period

Homeland Securitys segment is forecasted to grow at highest CAGR. As security concerns and societal difficulties increase, governments are focusing more on immigration control, counterterrorism operations, and stopping drug and people trafficking. More sophisticated and efficient border security measures are needed to address these problems in order to control migration, stop terrorist attacks, and fight organized crime. As governments invest in cutting-edge technologies like surveillance systems, biometric identification, and detecting techniques to improve their security capabilities and protect their citizens, this increased attention is fueling growth in the border security industry..

The North America Region to Have the Highest Market Marketshare in 2024.

North America is estimated to have the highest market share of 58.5% in the border security market. This is due to several key factors, including the geopolitical landscape, economic capacity of North American countries, and presence of various key players in the region.

North America, particularly the United States, has extensive land and maritime borders, which necessitates robust security measures. The region's focus on preventing illegal immigration, drug trafficking, and potential terrorist activities has led to substantial investments in advanced border security technologies. Additipnally, the economic capacity of North American countries supports large-scale procurement and deployment of sophisticated security systems. Governments in this region have significant budgets allocated to defense and security, enabling them to invest in cutting-edge technologies like surveillance systems, biometrics, and unmanned aerial vehicles (UAVs).

Furthermore, North America is home to many leading technology companies and defense contractors including Lockheed Martin Corporation (US), General Dynamics Corporation (US), Northrop Grumman (US), who are at the forefront of developing and supplying state-of-the-art security solutions. This local expertise and innovation drive the market forward, ensuring that the region remains ahead in terms of technological advancements.


Recent Developments of Drone Package Delivery Market industry

  • In April 2024, Lockheed Martin has received a contract worth up to USD 4.1 billion from the Missile Defense Agency to upgrade the C2BMC system with advanced technology for enhanced response capabilities to emerging threats across domains. Operations will focus on facilities in Huntsville, Alabama, and Colorado Springs, Colorado.
  • In March 2024, BAE Systems was awarded a contract by the U.S. Navy worth approximately USD 86 million to support its Mobile Deployable Command, Control, Communications, Computers, Combat Systems, Intelligence, Surveillance, and Reconnaissance (MDC5ISR) programs. The contract, spanning five years, involves providing engineering and technical services for new and existing MDC5ISR systems and platforms.
  • In January 2024, General Dynamics Information Technology (GDIT) was awarded a USD 1.8 billion contract by U.S. Customs and Border Protection to modernize and expand border surveillance tower systems. The contract, lasting up to 14 years, includes updating sensor towers and enhancing surveillance technology along the U.S. borders.
  • In December 2023, Thales partnered with Trablisa (Spain) to install an Integrated Surveillance System at the Spanish Civil Guard's Melilla Command, featuring high-resolution cameras for enhanced land and maritime border control in Melilla.
  • In September 2023, Lockheed Martin was awarded a USD 23.8 million contract by the US Navy to begin developing the Integrated Combat System, aimed at connecting the Navy’s and U.S. Coast Guard’s surface fleets. This contract, including options that could reach USD 1.1 billion by fiscal 2030, also includes updates for P-3 aircraft.
  • In September 2023, the Australian government has awarded Northrop Grumman a USD 968.5 million contract to purchase its fourth MQ-4C Triton Unmanned Aerial System (UAS) and upgrade its fleet of P-8A maritime patrol aircraft. This contract enhances Australia's capabilities with integrated command, control, communications, computers, intelligence, surveillance, reconnaissance, search and rescue, and maritime strike capabilities across air and sea operations.
  • In February 2023, BAE Systems Digital Intelligence secured USD 46 million contract with the UK's Home Office to develop risk analytics. Over three years, this initiative aims to enhance border security by analyzing data from millions of passenger journeys and freight entries, helping manage and mitigate risks to national security.
  • In December 2022, Thales launched a new multimodal biometric pod for border and travel management, integrating iris and face recognition to streamline ID enrollment and verification processes. It reduces processing times and enhances efficiency at entry and exit points, focusing on security and privacy in data handling.
  • In June 2022, Thales Digital Identity and Security signed a contract with Spain to deploy over 1,500 biometric border terminals. Selected by Spain's Ministry of Interior, Thales and Zelenza will cover land, sea, and air border points, enhancing Spain's biometric entry and exit system for non-European citizens across the Schengen area.
  • In February 2022, Echodyne and Northrop Grumman expanded their partnership with a strategic agreement and minority investment. They are integrating Echodyne's radar technology into Northrop Grumman's advanced defense and security solutions, starting with counter-UAS capabilities. The collaboration aims to explore additional applications for Echodyne's radar technology.
  • In December 2020, Lockheed Martin and Rafael Advanced Defense Systems partnered to develop, test, and manufacture High Energy Laser Weapon Systems (HELWS) in the U.S. and Israel. The collaboration builds on assets developed independently under Israel's IRON BEAM project, aiming to adapt the system for the American market and other potential markets.

Key Market Players

List of Top Border Security Market Companies

These players have adopted various growth strategies expand their presence in the border security market.

Scope of the Report

Report Attribute Details
Estimated Market Size $26.8 billion in 2024
Projected Market Size $34.4 billion in 2029
CAGR 5.1%
Market size available for years 2020-2029
Base year considered 2023
Forecast period 2024-2029
Forecast units Value (USD)
Segments Covered By Domain, Vertical, System, Installation, and Region
Region covered North America, Asia Pacific, Europe, Middle East and Rest of the World.
Companies covered Lockheed Martin Corporation (US), General Dynamics Corporation (US), Northrop Grumman


Key Questions Addressed by the Report

What is the current size of the border security market?

The border security market is projected to reach USD 34.4 billion by 2029, from USD 26.8 billion in 2024, at a CAGR of 5.1% during the forecast period

Who are the winners in the border security market?

Lockheed Martin Corporation (US), General Dynamics Corporation (US), Northrop Grumman (US), BAE Systems (UK), and Thales (France).

What are some of the technological advancements in the market?


  • Autonomous systems: Autonomous systems are advanced technological solutions capable of performing tasks and making decisions without human intervention. These systems use a combination of artificial intelligence (AI), machine learning, robotics, and sensor technologies to understand and interact with their environment. These systems are increasingly transforming border security operations by integrating advanced technologies such as artificial intelligence, machine learning, and robotics. It enhances surveillance, detection, and response capabilities, enabling border security forces to efficiently manage large and often challenging geographical areas.
  • Biometric identification systems: Biometric identification systems, such as facial recognition software, fingerprint readers, and iris scanners, have become integral to border security. These systems provide a sophisticated means of identifying individuals based on unique physical characteristics, ensuring a higher level of accuracy and security.
  • Internet of Things: The Internet of Things (IoT) refers to the network of interconnected physical devices, vehicles, appliances, and other objects embedded with sensors, software, and connectivity capabilities that enable them to collect and exchange data. These devices are often equipped with unique identifiers and can communicate with each other over the internet, without requiring human-to-human or human-to-computer interaction.


What are the factors driving the growth of the market?


  • Rising geopolitical instability
  • Public safety concerns near border areas
  • Growing adoption of new technologies for border security
  • Increasing terrorist fatalities necessitates border security systems


Which region is expected to hold highest market share in the border security market?

Border security market in the North America region is estimated to hold the largest market share of 58.5% of the total market in 2024.

Personalize This Research

  • Triangulate with your Own Data
  • Get Data as per your Format and Definition
  • Gain a Deeper Dive on a Specific Application, Geography, Customer or Competitor
  • Any level of Personalization
Request A Free Customisation

Let Us Help You

  • What are the Known and Unknown Adjacencies Impacting the Border Security Market
  • What will your New Revenue Sources be?
  • Who will be your Top Customer; what will make them switch?
  • Defend your Market Share or Win Competitors
  • Get a Scorecard for Target Partners
Customized Workshop Request

Table of Contents

Exclusive indicates content/data unique to MarketsandMarkets and not available with any competitors.

TITLE
PAGE NO
INTRODUCTION
26
RESEARCH METHODOLOGY
31
EXECUTIVE SUMMARY
46
PREMIUM INSIGHTS
50
MARKET OVERVIEW
53
  • 5.1 INTRODUCTION
  • 5.2 MARKET DYNAMICS
    DRIVERS
    - Rising geopolitical instability
    - Increasing terrorist fatalities necessitating border security
    - Escalating public safety concerns near borders
    - Growing adoption of new technologies for border security
    RESTRAINTS
    - Stringent regulations for development, testing, and deployment of border security technologies
    - Public data privacy concerns
    OPPORTUNITIES
    - Upgrade of existing border security infrastructure
    - Surge in defense spending by emerging economies
    CHALLENGES
    - High cost of R&D and need for critical infrastructure to test border security systems
    - Integration and interoperability limitations
INDUSTRY TRENDS
60
  • 6.1 TRENDS AND DISRUPTIONS IMPACTING CUSTOMERS’ BUSINESSES
  • 6.2 ECOSYSTEM ANALYSIS
    PROMINENT COMPANIES
    PRIVATE AND SMALL ENTERPRISES
    END USERS
  • 6.3 VALUE CHAIN ANALYSIS
  • 6.4 PRICING ANALYSIS
    INDICATIVE PRICING ANALYSIS, BY SYSTEM
    INDICATIVE PRICING ANALYSIS, BY KEY PLAYER
  • 6.5 OPERATIONAL DATA
  • 6.6 CASE STUDY ANALYSIS
    UK INTRODUCED BORDER TARGET OPERATING MODEL TO ENHANCE BIOSECURITY AND STREAMLINE TRADE OPERATIONS
    CUSTOMS AND BORDER PROTECTION IMPLEMENTED STRATEGIC MEASURES TO MITIGATE HUMANITARIAN CRISIS AT SOUTHWEST BORDER
    GARUDA AEROSPACE INTRODUCED TRISHUL BORDER PATROL SURVEILLANCE DRONE TO ENHANCE BORDER SECURITY
  • 6.7 KEY CONFERENCES AND EVENTS, 2024–2025
  • 6.8 TRADE ANALYSIS
    CAMERAS
    - Import data
    - Export data
    RADAR APPARATUS
    - Import data
    - Export data
    COMMUNICATIONS SYSTEMS
    - Import data
    - Export data
    UNMANNED AIRCRAFT
    - Import data
    - Export data
  • 6.9 TARIFF AND REGULATORY LANDSCAPE
    TARIFFS RELATED TO BORDER SECURITY
    REGULATORY BODIES, GOVERNMENT AGENCIES, AND OTHER ORGANIZATIONS
  • 6.10 KEY STAKEHOLDERS AND BUYING CRITERIA
    KEY STAKEHOLDERS IN BUYING PROCESS
    BUYING CRITERIA
  • 6.11 BUSINESS MODELS
  • 6.12 TOTAL COST OF OWNERSHIP
  • 6.13 BILL OF MATERIALS
  • 6.14 INVESTMENT AND FUNDING SCENARIO
  • 6.15 TECHNOLOGY ANALYSIS
    KEY TECHNOLOGY
    - Radar and motion sensors
    - Video surveillance systems
    - Cybersecurity
    COMPLEMENTARY TECHNOLOGY
    - AI-powered analytics
    - Satellite imaging
    ADJACENT TECHNOLOGY
    - Robotics
  • 6.16 TECHNOLOGY ROADMAP
  • 6.17 TECHNOLOGY TRENDS
    INTRODUCTION
    AUTONOMOUS SYSTEMS
    BIOMETRIC IDENTIFICATION SYSTEMS
    INTERNET OF THINGS
    GEOGRAPHIC INFORMATION SYSTEMS
  • 6.18 IMPACT OF MEGATRENDS
    BLOCKCHAIN
    DIGITALIZATION
    SMART MANUFACTURING
  • 6.19 SUPPLY CHAIN ANALYSIS
  • 6.20 PATENT ANALYSIS
  • 6.21 IMPACT OF GENERATIVE AI ON BORDER SECURITY MARKET
    INTRODUCTION
    ADOPTION OF GENERATIVE AI IN MILITARY BY TOP COUNTRIES
    IMPACT OF GENERATIVE AI ON DEFENSE USE CASES
    IMPACT OF GENERATIVE AI ON BORDER SECURITY MARKET
BORDER SECURITY MARKET, BY DOMAIN
109
  • 7.1 INTRODUCTION
  • 7.2 LAND
    INCREASING LAND INFILTRATION TO DRIVE MARKET
  • 7.3 MARITIME
    RISE IN ILLEGAL MARITIME IMMIGRATION TO DRIVE GROWTH
  • 7.4 AIRBORNE
    INCREASE IN ILLICIT AIRBORNE ACTIVITIES TO DRIVE MARKET
BORDER SECURITY MARKET, BY VERTICAL
112
  • 8.1 INTRODUCTION
  • 8.2 MILITARY
    BORDER DEFENSE
    - Rising territorial conflicts to boost need for border defense measures
    SURVEILLANCE & RECONNAISSANCE
    - Need for advanced monitoring capabilities to boost market
  • 8.3 HOMELAND SECURITY
    IMMIGRATION CONTROL
    - Rising economic burden on nations to boost need for robust immigration control measures
    ANTI-TERRORISM OPERATIONS
    - Increasing cases of terrorist attacks to drive market
    DRUG & HUMAN TRAFFICKING PREVENTION
    - Global rise in drug trafficking to boost need for border security systems
BORDER SECURITY MARKET, BY SYSTEM
116
  • 9.1 INTRODUCTION
  • 9.2 SURVEILLANCE SYSTEMS
    CAMERAS
    - Need for enhanced visibility to drive need for security cameras
    RADAR SYSTEMS
    - Need for enhanced continuous monitoring and detection measures to boost growth
    - Ground surveillance radar systems
    - Air surveillance radar systems
    - Coastal surveillance radar systems
    GROUND SENSORS
    - Focus on monitoring remote and difficult terrains to drive market
    COUNTER-DRONE SYSTEMS
    - Rise in drone-based smuggling activities to propel demand for counter-drone systems
  • 9.3 DETECTION SYSTEMS
    BIOMETRIC SYSTEMS
    - Growing emphasis on enhancing identification of individuals to drive market
    CHEMICAL, BIOLOGICAL, RADIOLOGICAL, AND NUCLEAR DETECTION (CBRN) SYSTEMS
    - Rising threat from terrorism and smuggling to spur market growth
    EXPLOSIVE DETECTION SYSTEMS
    - Rising cases of cross-border smuggling of explosives to boost growth
  • 9.4 COMMUNICATIONS SYSTEMS
    FOCUS ON ENHANCING OPERATIONAL EFFICIENCY AND SAFETY TO DRIVE NEED FOR COMMUNICATIONS SYSTEMS
  • 9.5 COMMAND & CONTROL SYSTEMS
    DEMAND FOR ENHANCED SITUATIONAL AWARENESS SYSTEMS TO SPUR GROWTH
  • 9.6 LASER SYSTEMS
    LASER SYSTEMS OFFER ENHANCED DETECTION CAPABILITIES WITH MINIMAL ENVIRONMENTAL IMPACT
  • 9.7 UNMANNED SYSTEMS
    UNMANNED SYSTEMS OFFER ENHANCED SURVEILLANCE CAPABILITIES
  • 9.8 PERIMETER INTRUSION DETECTION SYSTEMS
    PERIMETER INTRUSION DETECTION SYSTEMS ARE FIRST LINE OF DEFENSE AGAINST POTENTIAL THREATS
  • 9.9 CYBERSECURITY SYSTEMS
    RISING NEED TO STRENGTHEN DIGITAL SECURITY AND INTERCONNECTIVITY TO SPUR MARKET
BORDER SECURITY MARKET, BY INSTALLATION
123
  • 10.1 INTRODUCTION
  • 10.2 NEW INSTALLATIONS
    RISE IN SOPHISTICATED CROSS-BORDER ACTIVITIES TO PROPEL NEED FOR ADVANCED BORDER SECURITY SYSTEMS
  • 10.3 UPGRADES
    RISE IN CRIMINAL AND TERRORIST ACTIVITIES TO PROMPT NEED FOR MODERNIZED SYSTEMS
BORDER SECURITY MARKET, BY REGION
126
  • 11.1 INTRODUCTION
  • 11.2 REGIONAL RECESSION IMPACT ANALYSIS
  • 11.3 NORTH AMERICA
    PESTLE ANALYSIS
    RECESSION IMPACT ANALYSIS
    US
    - Rising initiatives to strengthen border security to drive market
    CANADA
    - Ongoing projects on border security system upgrades to drive market
  • 11.4 EUROPE
    PESTLE ANALYSIS
    RECESSION IMPACT ANALYSIS
    UK
    - Commitment to safeguarding national interests to drive market
    GERMANY
    - Emphasis on mitigating risks of irregular migration to drive market
    FRANCE
    - Strategic partnerships and technological advancements to drive market
    ITALY
    - Robust regulatory frameworks by Frontex to drive market
    REST OF EUROPE
  • 11.5 ASIA PACIFIC
    PESTLE ANALYSIS
    RECESSION IMPACT ANALYSIS
    INDIA
    - Significant efforts by Border Security Force to enhance national defense to drive market
    JAPAN
    - Increasing investments in border surveillance systems due to geopolitical tensions to drive market
    SINGAPORE
    - Surge in international tourist arrivals to drive market
    AUSTRALIA
    - Focus on modernizing domestic border security infrastructure to drive market
    REST OF ASIA PACIFIC
  • 11.6 MIDDLE EAST
    PESTLE ANALYSIS
    RECESSION IMPACT ANALYSIS
    GULF COOPERATION COUNCIL (GCC)
    - Saudi Arabia
    - UAE
    ISRAEL
    - Rising regional conflicts near Gaza border to drive market
    TURKEY
    - Government efforts for enhancing underwater defense capabilities to drive market
  • 11.7 REST OF THE WORLD
    PESTLE ANALYSIS
    RECESSION IMPACT ANALYSIS
    AFRICA
    - Government policies aimed at strengthening border security to drive market
    LATIN AMERICA
    - Need to counter illegal migration and human trafficking to drive market
COMPETITIVE LANDSCAPE
193
  • 12.1 INTRODUCTION
  • 12.2 KEY PLAYER STRATEGIES/RIGHT TO WIN
  • 12.3 MARKET SHARE ANALYSIS
  • 12.4 REVENUE ANALYSIS
  • 12.5 COMPARISON OF VENDORS’ BRANDS
  • 12.6 COMPANY VALUATION AND FINANCIAL METRICS
  • 12.7 COMPANY EVALUATION MATRIX: KEY PLAYERS, 2023
    STARS
    EMERGING LEADERS
    PERVASIVE PLAYERS
    PARTICIPANTS
  • 12.8 COMPANY FOOTPRINT: KEY PLAYERS, 2023
  • 12.9 COMPANY EVALUATION MATRIX: STARTUPS/SMES, 2023
    PROGRESSIVE COMPANIES
    RESPONSIVE COMPANIES
    DYNAMIC COMPANIES
    STARTING BLOCKS
    - Competitive benchmarking of startups/SMEs, 2023
  • 12.10 COMPETITIVE SCENARIO
    PRODUCT LAUNCHES
    DEALS
    OTHERS
COMPANY PROFILES
217
  • 13.1 KEY PLAYERS
    LOCKHEED MARTIN CORPORATION
    - Business overview
    - Products/Solutions/Services offered
    - Recent developments
    - MnM view
    GENERAL DYNAMICS CORPORATION
    - Business overview
    - Products/Solutions/Services offered
    - Recent developments
    - MnM view
    BAE SYSTEMS
    - Business overview
    - Products/Solutions/Services offered
    - Recent developments
    - MnM view
    NORTHROP GRUMMAN
    - Business overview
    - Products/Solutions/Services offered
    - Recent developments
    - MnM view
    THALES
    - Business overview
    - Products/Solutions/Services offered
    - Recent developments
    - MnM view
    RTX
    - Business overview
    - Products/Solutions/Services offered
    - Recent developments
    LEONARDO S.P.A.
    - Business overview
    - Products/Solutions/Services offered
    - Recent developments
    ELBIT SYSTEMS LTD.
    - Business overview
    - Products/Solutions/Services offered
    - Recent developments
    L3HARRIS TECHNOLOGIES, INC.
    - Business overview
    - Products/Solutions/Services offered
    - Recent developments
    SAAB AB
    - Business overview
    - Products/Solutions/Services offered
    AIRBUS
    - Business overview
    - Products/Solutions/Services offered
    - Recent developments
    ISRAEL AEROSPACE INDUSTRIES
    - Business overview
    - Products/Solutions/Services offered
    ASELSAN A.S.
    - Business overview
    - Products/Solutions/Services offered
    COBHAM LIMITED
    - Business overview
    - Products/Solutions/Services offered
    BHARAT ELECTRONICS LIMITED (BEL)
    - Business overview
    - Products/Solutions/Services offered
    - Recent developments
    TELEDYNE FLIR LLC
    - Business overview
    - Products/Solutions/Services offered
    - Recent developments
    HENSOLDT AG
    - Business overview
    - Products/Solutions/Services offered
    BOEING
    - Business overview
    - Products/Solutions/Services offered
    DJI
    - Business overview
    - Products/Solutions/Services offered
    HAVELSAN INC.
    - Business overview
    - Products/Solutions/Services offered
    - Recent developments
  • 13.2 OTHER PLAYERS
    TATA ADVANCED SYSTEMS LIMITED
    INDRA SISTEMAS, S.A.
    BLIGHTER SURVEILLANCE SYSTEMS LIMITED
    QINETIQ
    MOTOROLA SOLUTIONS, INC.
    ROHDE & SCHWARZ
    OSI SYSTEMS, INC.
    M2SYS TECHNOLOGY
    PURETECH SYSTEMS
    X INFOTECH
APPENDIX
290
  • 14.1 DISCUSSION GUIDE
  • 14.2 DEFENSE PROGRAMS
  • 14.3 OTHER MAPPED COMPANIES
  • 14.4 KNOWLEDGESTORE: MARKETSANDMARKETS’ SUBSCRIPTION PORTAL
  • 14.5 CUSTOMIZATION OPTIONS
  • 14.6 RELATED REPORTS
  • 14.7 AUTHOR DETAILS
LIST OF TABLES
 
  • TABLE 1 USD EXCHANGE RATES, 2020–2023
  • TABLE 2 IMPACT OF RUSSIA-UKRAINE WAR ON MICRO FACTORS OF BORDER SECURITY MARKET
  • TABLE 3 GLOBAL GEOPOLITICAL CONFLICTS, 2024
  • TABLE 4 TECHNOLOGIES USED FOR BORDER SECURITY
  • TABLE 5 ROLE OF COMPANIES IN MARKET ECOSYSTEM
  • TABLE 6 COST BREAKDOWN OF BORDER SECURITY SYSTEMS
  • TABLE 7 INDICATIVE PRICING ANALYSIS, BY SYSTEM (USD MILLION)
  • TABLE 8 KEY CONFERENCES AND EVENTS, 2024–2025
  • TABLE 9 TARIFFS FOR RADAR APPARATUS (HS CODE: 852610)
  • TABLE 10 TARIFFS FOR TRANSMISSION OR RECEPTION OF VOICE, IMAGES, OR OTHER DATA (HS CODE: 851769)
  • TABLE 11 NORTH AMERICA: REGULATORY BODIES, GOVERNMENT AGENCIES, AND OTHER ORGANIZATIONS
  • TABLE 12 EUROPE: REGULATORY BODIES, GOVERNMENT AGENCIES, AND OTHER ORGANIZATIONS
  • TABLE 13 ASIA PACIFIC: REGULATORY BODIES, GOVERNMENT AGENCIES, AND OTHER ORGANIZATIONS
  • TABLE 14 REST OF THE WORLD: REGULATORY BODIES, GOVERNMENT AGENCIES, AND OTHER ORGANIZATIONS
  • TABLE 15 INFLUENCE OF STAKEHOLDERS ON BUYING PROCESS, BY DOMAIN
  • TABLE 16 KEY BUYING CRITERIA, BY DOMAIN
  • TABLE 17 TOTAL COST OF OWNERSHIP, BY PLATFORM
  • TABLE 18 COMPARISON OF BILL OF MATERIALS
  • TABLE 19 PATENT ANALYSIS, 2020–2024
  • TABLE 20 IMPACT OF GENERATIVE AI ON MILITARY APPLICATIONS
  • TABLE 21 BORDER SECURITY MARKET, BY DOMAIN, 2020–2023 (USD MILLION)
  • TABLE 22 MARKET, BY DOMAIN, 2024–2029 (USD MILLION)
  • TABLE 23 MARKET, BY VERTICAL, 2020–2023 (USD MILLION)
  • TABLE 24 MARKET, BY VERTICAL, 2024–2029 (USD MILLION)
  • TABLE 25 BORDER SECURITY MARKET, BY SYSTEM, 2020–2023 (USD MILLION)
  • TABLE 26 MARKET, BY SYSTEM, 2024–2029 (USD MILLION)
  • TABLE 27 MARKET, BY INSTALLATION, 2020–2023 (USD MILLION)
  • TABLE 28 BORDER SECURITY MARKET, BY INSTALLATION, 2024–2029 (USD MILLION)
  • TABLE 29 MARKET, BY REGION, 2020–2023 (USD MILLION)
  • TABLE 30 MARKET, BY REGION, 2024–2029 (USD MILLION)
  • TABLE 31 NORTH AMERICA: BORDER SECURITY MARKET, BY COUNTRY, 2020–2023 (USD MILLION)
  • TABLE 32 NORTH AMERICA: MARKET, BY COUNTRY, 2024–2029 (USD MILLION)
  • TABLE 33 NORTH AMERICA: MARKET, BY DOMAIN, 2020–2023 (USD MILLION)
  • TABLE 34 NORTH AMERICA: MARKET, BY DOMAIN, 2024–2029 (USD MILLION)
  • TABLE 35 NORTH AMERICA: MARKET, BY VERTICAL, 2020–2023 (USD MILLION)
  • TABLE 36 NORTH AMERICA: MARKET, BY VERTICAL, 2024–2029 (USD MILLION)
  • TABLE 37 NORTH AMERICA: MARKET, BY SYSTEM, 2020–2023 (USD MILLION)
  • TABLE 38 NORTH AMERICA: BORDER SECURITY MARKET, BY SYSTEM, 2024–2029 (USD MILLION)
  • TABLE 39 US: MARKET, BY DOMAIN, 2020–2023 (USD MILLION)
  • TABLE 40 US: MARKET, BY DOMAIN, 2024–2029 (USD MILLION)
  • TABLE 41 US: MARKET, BY VERTICAL, 2020–2023 (USD MILLION)
  • TABLE 42 US: BORDER SECURITY MARKET, BY VERTICAL, 2024–2029 (USD MILLION)
  • TABLE 43 US: MARKET, BY SYSTEM, 2020–2023 (USD MILLION)
  • TABLE 44 US: MARKET, BY SYSTEM, 2024–2029 (USD MILLION)
  • TABLE 45 CANADA: BORDER SECURITY MARKET, BY DOMAIN, 2020–2023 (USD MILLION)
  • TABLE 46 CANADA: MARKET, BY DOMAIN, 2024–2029 (USD MILLION)
  • TABLE 47 CANADA: MARKET, BY VERTICAL, 2020–2023 (USD MILLION)
  • TABLE 48 CANADA: MARKET, BY VERTICAL, 2024–2029 (USD MILLION)
  • TABLE 49 CANADA: MARKET, BY SYSTEM, 2020–2023 (USD MILLION)
  • TABLE 50 CANADA: MARKET, BY SYSTEM, 2024–2029 (USD MILLION)
  • TABLE 51 EUROPE: MARKET, BY COUNTRY, 2020–2023 (USD MILLION)
  • TABLE 52 EUROPE: BORDER SECURITY MARKET, BY COUNTRY, 2024–2029 (USD MILLION)
  • TABLE 53 EUROPE: MARKET, BY DOMAIN, 2020–2023 (USD MILLION)
  • TABLE 54 EUROPE: MARKET, BY DOMAIN, 2024–2029 (USD MILLION)
  • TABLE 55 EUROPE: MARKET, BY VERTICAL, 2020–2023 (USD MILLION)
  • TABLE 56 EUROPE: MARKET, BY VERTICAL, 2024–2029 (USD MILLION)
  • TABLE 57 EUROPE: MARKET, BY SYSTEM, 2020–2023 (USD MILLION)
  • TABLE 58 EUROPE: BORDER SECURITY MARKET, BY SYSTEM, 2024–2029 (USD MILLION)
  • TABLE 59 UK: MARKET, BY DOMAIN, 2020–2023 (USD MILLION)
  • TABLE 60 UK: MARKET, BY DOMAIN, 2024–2029 (USD MILLION)
  • TABLE 61 UK: BORDER SECURITY MARKET, BY VERTICAL, 2020–2023 (USD MILLION)
  • TABLE 62 UK: MARKET, BY VERTICAL, 2024–2029 (USD MILLION)
  • TABLE 63 UK: MARKET, BY SYSTEM, 2020–2023 (USD MILLION)
  • TABLE 64 UK: MARKET, BY SYSTEM, 2024–2029 (USD MILLION)
  • TABLE 65 GERMANY: BORDER SECURITY MARKET, BY DOMAIN, 2020–2023 (USD MILLION)
  • TABLE 66 GERMANY: MARKET, BY DOMAIN, 2024–2029 (USD MILLION)
  • TABLE 67 GERMANY: MARKET, BY VERTICAL, 2020–2023 (USD MILLION)
  • TABLE 68 GERMANY: MARKET, BY VERTICAL, 2024–2029 (USD MILLION)
  • TABLE 69 GERMANY: MARKET, BY SYSTEM, 2020–2023 (USD MILLION)
  • TABLE 70 GERMANY: BORDER SECURITY MARKET, BY SYSTEM, 2024–2029 (USD MILLION)
  • TABLE 71 FRANCE: MARKET, BY DOMAIN, 2020–2023 (USD MILLION)
  • TABLE 72 FRANCE: MARKET, BY DOMAIN, 2024–2029 (USD MILLION)
  • TABLE 73 FRANCE: BORDER SECURITY MARKET, BY VERTICAL, 2020–2023 (USD MILLION)
  • TABLE 74 FRANCE: MARKET, BY VERTICAL, 2024–2029 (USD MILLION)
  • TABLE 75 FRANCE: MARKET, BY SYSTEM, 2020–2023 (USD MILLION)
  • TABLE 76 FRANCE: MARKET, BY SYSTEM, 2024–2029 (USD MILLION)
  • TABLE 77 ITALY: BORDER SECURITY MARKET, BY DOMAIN, 2020–2023 (USD MILLION)
  • TABLE 78 ITALY: MARKET, BY DOMAIN, 2024–2029 (USD MILLION)
  • TABLE 79 ITALY: MARKET, BY VERTICAL, 2020–2023 (USD MILLION)
  • TABLE 80 ITALY: BORDER SECURITY MARKET, BY VERTICAL, 2024–2029 (USD MILLION)
  • TABLE 81 ITALY: MARKET, BY SYSTEM, 2020–2023 (USD MILLION)
  • TABLE 82 ITALY: BORDER SECURITY MARKET, BY SYSTEM, 2024–2029 (USD MILLION)
  • TABLE 83 REST OF EUROPE: MARKET, BY DOMAIN, 2020–2023 (USD MILLION)
  • TABLE 84 REST OF EUROPE: MARKET, BY DOMAIN, 2024–2029 (USD MILLION)
  • TABLE 85 REST OF EUROPE: MARKET, BY VERTICAL, 2020–2023 (USD MILLION)
  • TABLE 86 REST OF EUROPE: MARKET, BY VERTICAL, 2024–2029 (USD MILLION)
  • TABLE 87 REST OF EUROPE: MARKET, BY SYSTEM, 2020–2023 (USD MILLION)
  • TABLE 88 REST OF EUROPE: BORDER SECURITY MARKET, BY SYSTEM, 2024–2029 (USD MILLION)
  • TABLE 89 ASIA PACIFIC: MARKET, BY COUNTRY, 2020–2023 (USD MILLION)
  • TABLE 90 ASIA PACIFIC: MARKET, BY COUNTRY, 2024–2029 (USD MILLION)
  • TABLE 91 ASIA PACIFIC: MARKET, BY DOMAIN, 2020–2023 (USD MILLION)
  • TABLE 92 ASIA PACIFIC: MARKET, BY DOMAIN, 2024–2029 (USD MILLION)
  • TABLE 93 ASIA PACIFIC: MARKET, BY VERTICAL, 2020–2023 (USD MILLION)
  • TABLE 94 ASIA PACIFIC: MARKET, BY VERTICAL, 2024–2029 (USD MILLION)
  • TABLE 95 ASIA PACIFIC: MARKET, BY SYSTEM, 2020–2023 (USD MILLION)
  • TABLE 96 ASIA PACIFIC: BORDER SECURITY MARKET, BY SYSTEM, 2024–2029 (USD MILLION)
  • TABLE 97 INDIA: MARKET, BY DOMAIN, 2020–2023 (USD MILLION)
  • TABLE 98 INDIA: MARKET, BY DOMAIN, 2024–2029 (USD MILLION)
  • TABLE 99 INDIA: BORDER SECURITY MARKET, BY VERTICAL, 2020–2023 (USD MILLION)
  • TABLE 100 INDIA: MARKET, BY VERTICAL, 2024–2029 (USD MILLION)
  • TABLE 101 INDIA: MARKET, BY SYSTEM, 2020–2023 (USD MILLION)
  • TABLE 102 INDIA: MARKET, BY SYSTEM, 2024–2029 (USD MILLION)
  • TABLE 103 JAPAN: BORDER SECURITY MARKET, BY DOMAIN, 2020–2023 (USD MILLION)
  • TABLE 104 JAPAN: MARKET, BY DOMAIN, 2024–2029 (USD MILLION)
  • TABLE 105 JAPAN: MARKET, BY VERTICAL, 2020–2023 (USD MILLION)
  • TABLE 106 JAPAN: MARKET, BY VERTICAL, 2024–2029 (USD MILLION)
  • TABLE 107 JAPAN: MARKET, BY SYSTEM, 2020–2023 (USD MILLION)
  • TABLE 108 JAPAN: BORDER SECURITY MARKET, BY SYSTEM, 2024–2029 (USD MILLION)
  • TABLE 109 SINGAPORE: MARKET, BY DOMAIN, 2020–2023 (USD MILLION)
  • TABLE 110 SINGAPORE: MARKET, BY DOMAIN, 2024–2029 (USD MILLION)
  • TABLE 111 SINGAPORE: MARKET, BY VERTICAL, 2020–2023 (USD MILLION)
  • TABLE 112 SINGAPORE: MARKET, BY VERTICAL, 2024–2029 (USD MILLION)
  • TABLE 113 SINGAPORE: BORDER SECURITY MARKET, BY SYSTEM, 2020–2023 (USD MILLION)
  • TABLE 114 SINGAPORE: MARKET, BY SYSTEM, 2024–2029 (USD MILLION)
  • TABLE 115 AUSTRALIA: MARKET, BY DOMAIN, 2020–2023 (USD MILLION)
  • TABLE 116 AUSTRALIA: MARKET, BY DOMAIN, 2024–2029 (USD MILLION)
  • TABLE 117 AUSTRALIA: BORDER SECURITY MARKET, BY VERTICAL, 2020–2023 (USD MILLION)
  • TABLE 118 AUSTRALIA: MARKET, BY VERTICAL, 2024–2029 (USD MILLION)
  • TABLE 119 AUSTRALIA: BORDER SECURITY MARKET, BY SYSTEM, 2020–2023 (USD MILLION)
  • TABLE 120 AUSTRALIA: MARKET, BY SYSTEM, 2024–2029 (USD MILLION)
  • TABLE 121 REST OF ASIA PACIFIC: MARKET, BY DOMAIN, 2020–2023 (USD MILLION)
  • TABLE 122 REST OF ASIA PACIFIC: MARKET, BY DOMAIN, 2024–2029 (USD MILLION)
  • TABLE 123 REST OF ASIA PACIFIC: MARKET, BY VERTICAL, 2020–2023 (USD MILLION)
  • TABLE 124 REST OF ASIA PACIFIC: MARKET, BY VERTICAL, 2024–2029 (USD MILLION)
  • TABLE 125 REST OF ASIA PACIFIC: MARKET, BY SYSTEM, 2020–2023 (USD MILLION)
  • TABLE 126 REST OF ASIA PACIFIC: MARKET, BY SYSTEM, 2024–2029 (USD MILLION)
  • TABLE 127 MIDDLE EAST: BORDER SECURITY MARKET, BY COUNTRY, 2020–2023 (USD MILLION)
  • TABLE 128 MIDDLE EAST: MARKET, BY COUNTRY, 2024–2029 (USD MILLION)
  • TABLE 129 MIDDLE EAST: MARKET, BY DOMAIN, 2020–2023 (USD MILLION)
  • TABLE 130 MIDDLE EAST: MARKET, BY DOMAIN, 2024–2029 (USD MILLION)
  • TABLE 131 MIDDLE EAST: MARKET, BY VERTICAL,2020–2023 (USD MILLION)
  • TABLE 132 MIDDLE EAST: BORDER SECURITY MARKET, BY VERTICAL, 2024–2029 (USD MILLION)
  • TABLE 133 MIDDLE EAST: MARKET, BY SYSTEM, 2020–2023 (USD MILLION)
  • TABLE 134 MIDDLE EAST: MARKET, BY SYSTEM, 2024–2029 (USD MILLION)
  • TABLE 135 SAUDI ARABIA: MARKET, BY DOMAIN, 2020–2023 (USD MILLION)
  • TABLE 136 SAUDI ARABIA: MARKET, BY DOMAIN, 2024–2029 (USD MILLION)
  • TABLE 137 SAUDI ARABIA: MARKET, BY VERTICAL, 2020–2023 (USD MILLION)
  • TABLE 138 SAUDI ARABIA: MARKET, BY VERTICAL, 2024–2029 (USD MILLION)
  • TABLE 139 SAUDI ARABIA: MARKET, BY SYSTEM, 2020–2023 (USD MILLION)
  • TABLE 140 SAUDI ARABIA: BORDER SECURITY MARKET, BY SYSTEM, 2024–2029 (USD MILLION)
  • TABLE 141 UAE: MARKET, BY DOMAIN, 2020–2023 (USD MILLION)
  • TABLE 142 UAE: MARKET, BY DOMAIN, 2024–2029 (USD MILLION)
  • TABLE 143 UAE: MARKET, BY VERTICAL, 2020–2023 (USD MILLION)
  • TABLE 144 UAE: MARKET, BY VERTICAL, 2024–2029 (USD MILLION)
  • TABLE 145 UAE: MARKET, BY SYSTEM, 2020–2023 (USD MILLION)
  • TABLE 146 UAE: BORDER SECURITY MARKET, BY SYSTEM, 2024–2029 (USD MILLION)
  • TABLE 147 ISRAEL: BORDER SECURITY MARKET, BY DOMAIN, 2020–2023 (USD MILLION)
  • TABLE 148 ISRAEL: MARKET, BY DOMAIN, 2024–2029 (USD MILLION)
  • TABLE 149 ISRAEL: MARKET, BY VERTICAL, 2020–2023 (USD MILLION)
  • TABLE 150 ISRAEL: MARKET, BY VERTICAL, 2024–2029 (USD MILLION)
  • TABLE 151 ISRAEL: MARKET, BY SYSTEM, 2020–2023 (USD MILLION)
  • TABLE 152 ISRAEL: BORDER SECURITY MARKET, BY SYSTEM, 2024–2029 (USD MILLION)
  • TABLE 153 TURKEY: MARKET, BY DOMAIN, 2020–2023 (USD MILLION)
  • TABLE 154 TURKEY: MARKET, BY DOMAIN, 2024–2029 (USD MILLION)
  • TABLE 155 TURKEY:BORDER SECURITY  MARKET, BY VERTICAL, 2020–2023 (USD MILLION)
  • TABLE 156 TURKEY: MARKET, BY VERTICAL, 2024–2029 (USD MILLION)
  • TABLE 157 TURKEY: MARKET, BY SYSTEM, 2020–2023 (USD MILLION)
  • TABLE 158 TURKEY: BORDER SECURITY MARKET, BY SYSTEM, 2024–2029 (USD MILLION)
  • TABLE 159 REST OF THE WORLD: MARKET, BY REGION, 2020–2023 (USD MILLION)
  • TABLE 160 REST OF THE WORLD: MARKET, BY REGION, 2024–2029 (USD MILLION)
  • TABLE 161 REST OF THE WORLD: MARKET, BY DOMAIN, 2020–2023 (USD MILLION)
  • TABLE 162 REST OF THE WORLD: MARKET, BY DOMAIN,2024–2029 (USD MILLION)
  • TABLE 163 REST OF THE WORLD: MARKET, BY VERTICAL, 2020–2023 (USD MILLION)
  • TABLE 164 REST OF THE WORLD: MARKET, BY VERTICAL, 2024–2029 (USD MILLION)
  • TABLE 165 REST OF THE WORLD: MARKET, BY SYSTEM, 2020–2023 (USD MILLION)
  • TABLE 166 REST OF THE WORLD: BORDER SECURITY MARKET, BY SYSTEM, 2024–2029 (USD MILLION)
  • TABLE 167 AFRICA: MARKET, BY DOMAIN, 2020–2023 (USD MILLION)
  • TABLE 168 AFRICA: MARKET, BY DOMAIN, 2024–2029 (USD MILLION)
  • TABLE 169 AFRICA: MARKET, BY VERTICAL, 2020–2023 (USD MILLION)
  • TABLE 170 AFRICA: MARKET, BY VERTICAL, 2024–2029 (USD MILLION)
  • TABLE 171 AFRICA: MARKET, BY SYSTEM, 2020–2023 (USD MILLION)
  • TABLE 172 AFRICA: BORDER SECURITY MARKET, BY SYSTEM, 2024–2029 (USD MILLION)
  • TABLE 173 LATIN AMERICA: MARKET, BY DOMAIN, 2020–2023 (USD MILLION)
  • TABLE 174 LATIN AMERICA: BORDER SECURITY MARKET, BY DOMAIN, 2024–2029 (USD MILLION)
  • TABLE 175 LATIN AMERICA: MARKET, BY VERTICAL, 2020–2023 (USD MILLION)
  • TABLE 176 LATIN AMERICA: MARKET, BY VERTICAL, 2024–2029 (USD MILLION)
  • TABLE 177 LATIN AMERICA: MARKET, BY SYSTEM, 2020–2023 (USD MILLION)
  • TABLE 178 LATIN AMERICA: MARKET, BY SYSTEM, 2024–2029 (USD MILLION)
  • TABLE 179 KEY STRATEGIES ADOPTED BY KEY PLAYERS IN BORDER SECURITY MARKET, 2023
  • TABLE 180 BORDER SECURITY MARKET: DEGREE OF COMPETITION
  • TABLE 181 COMPANY DOMAIN FOOTPRINT
  • TABLE 182 COMPANY VERTICAL FOOTPRINT
  • TABLE 183 COMPANY INSTALLATION FOOTPRINT
  • TABLE 184 COMPANY REGIONAL FOOTPRINT
  • TABLE 185 DETAILED LIST OF STARTUPS/SMES
  • TABLE 186 COMPETITIVE BENCHMARKING OF KEY STARTUPS/SMES
  • TABLE 187 BORDER SECURITY MARKET: PRODUCT LAUNCHES, SEPTEMBER 2021–JUNE 2023
  • TABLE 188 MARKET: DEALS, FEBRUARY 2022–DECEMBER 2023
  • TABLE 189 MARKET: OTHERS, MAY 2020–JUNE 2024
  • TABLE 190 LOCKHEED MARTIN CORPORATION: COMPANY OVERVIEW
  • TABLE 191 LOCKHEED MARTIN CORPORATION: PRODUCTS/SOLUTIONS/SERVICES OFFERED
  • TABLE 192 LOCKHEED MARTIN CORPORATION: DEALS
  • TABLE 193 LOCKHEED MARTIN CORPORATION: OTHERS
  • TABLE 194 GENERAL DYNAMICS CORPORATION: COMPANY OVERVIEW
  • TABLE 195 GENERAL DYNAMICS CORPORATION: PRODUCTS/SOLUTIONS/SERVICES OFFERED
  • TABLE 196 GENERAL DYNAMICS CORPORATION: OTHERS
  • TABLE 197 BAE SYSTEMS: COMPANY OVERVIEW
  • TABLE 198 BAE SYSTEMS: PRODUCTS/SOLUTIONS/SERVICES OFFERED
  • TABLE 199 BAE SYSTEMS: OTHERS
  • TABLE 200 NORTHROP GRUMMAN: COMPANY OVERVIEW
  • TABLE 201 NORTHROP GRUMMAN: PRODUCTS/SOLUTIONS/SERVICES OFFERED
  • TABLE 202 NORTHROP GRUMMAN: DEALS
  • TABLE 203 NORTHROP GRUMMAN: OTHERS
  • TABLE 204 THALES: COMPANY OVERVIEW
  • TABLE 205 THALES: PRODUCTS/SOLUTIONS/SERVICES OFFERED
  • TABLE 206 THALES: PRODUCT LAUNCHES, DECEMBER 2022
  • TABLE 207 THALES: DEALS
  • TABLE 208 THALES: OTHERS
  • TABLE 209 RTX: COMPANY OVERVIEW
  • TABLE 210 RTX: PRODUCTS/SOLUTIONS/SERVICES OFFERED
  • TABLE 211 RTX: OTHERS
  • TABLE 212 LEONARDO S.P.A.: COMPANY OVERVIEW
  • TABLE 213 LEONARDO S.P.A.: PRODUCTS/SOLUTIONS/SERVICES OFFERED
  • TABLE 214 LEONARDO S.P.A.: OTHERS
  • TABLE 215 ELBIT SYSTEMS LTD.: COMPANY OVERVIEW
  • TABLE 216 ELBIT SYSTEMS LTD.: PRODUCTS/SOLUTIONS/SERVICES OFFERED
  • TABLE 217 ELBIT SYSTEMS LTD.: PRODUCT LAUNCHES, JUNE 2022
  • TABLE 218 ELBIT SYSTEMS LTD.: OTHERS
  • TABLE 219 L3HARRIS TECHNOLOGIES, INC.: COMPANY OVERVIEW
  • TABLE 220 L3HARRIS TECHNOLOGIES, INC.: PRODUCTS/SOLUTIONS/SERVICES OFFERED
  • TABLE 221 L3HARRIS TECHNOLOGIES, INC.: OTHERS
  • TABLE 222 SAAB AB: COMPANY OVERVIEW
  • TABLE 223 SAAB AB: PRODUCTS/SOLUTIONS/SERVICES OFFERED
  • TABLE 224 SAAB AB: PRODUCT LAUNCHES, FEBRUARY 2022–JUNE 2023
  • TABLE 225 SAAB AB: OTHERS
  • TABLE 226 AIRBUS: COMPANY OVERVIEW
  • TABLE 227 AIRBUS: PRODUCTS/SOLUTIONS/SERVICES OFFERED
  • TABLE 228 AIRBUS: OTHERS
  • TABLE 229 ISRAEL AEROSPACE INDUSTRIES: COMPANY OVERVIEW
  • TABLE 230 ISRAEL AEROSPACE INDUSTRIES: PRODUCTS/SOLUTIONS/SERVICES OFFERED
  • TABLE 231 ISRAEL AEROSPACE INDUSTRIES: PRODUCT LAUNCHES, SEPTEMBER 2021
  • TABLE 232 ISRAEL AEROSPACE INDUSTRIES: OTHERS
  • TABLE 233 ASELSAN A.S.: COMPANY OVERVIEW
  • TABLE 234 ASELSAN A.S.: PRODUCTS/SOLUTIONS/SERVICES OFFERED
  • TABLE 235 ASELSAN A.S.: OTHERS
  • TABLE 236 COBHAM LIMITED: COMPANY OVERVIEW
  • TABLE 237 COBHAM LIMITED: PRODUCTS/SOLUTIONS/SERVICES OFFERED
  • TABLE 238 BHARAT ELECTRONICS LIMITED (BEL): COMPANY OVERVIEW
  • TABLE 239 BHARAT ELECTRONICS LIMITED (BEL): PRODUCTS/SOLUTIONS/SERVICES OFFERED
  • TABLE 240 BHARAT ELECTRONICS LIMITED (BEL): DEALS
  • TABLE 241 TELEDYNE FLIR LLC: COMPANY OVERVIEW
  • TABLE 242 TELEDYNE FLIR LLC: PRODUCTS/SOLUTIONS/SERVICES OFFERED
  • TABLE 243 TELEDYNE FLIR LLC: OTHERS
  • TABLE 244 HENSOLDT AG: COMPANY OVERVIEW
  • TABLE 245 HENSOLDT AG: PRODUCTS/SOLUTIONS/SERVICES OFFERED
  • TABLE 246 BOEING: COMPANY OVERVIEW
  • TABLE 247 BOEING: PRODUCTS/SOLUTIONS/SERVICES OFFERED
  • TABLE 248 DJI: COMPANY OVERVIEW
  • TABLE 249 DJI: PRODUCTS/SOLUTIONS/SERVICES OFFERED
  • TABLE 250 HAVELSAN INC.: COMPANY OVERVIEW
  • TABLE 251 HAVELSAN INC.: PRODUCTS/SOLUTIONS/SERVICES OFFERED
  • TABLE 252 HAVELSAN INC.: DEALS
  • TABLE 253 HAVELSAN INC.: OTHERS
LIST OF FIGURES
 
  • FIGURE 1 RESEARCH DESIGN MODEL
  • FIGURE 2 RESEARCH DESIGN
  • FIGURE 3 IMPACT OF RUSSIA-UKRAINE WAR ON MACRO FACTORS OF BORDER SECURITY MARKET
  • FIGURE 4 IMPACT OF RUSSIA-UKRAINE WAR ON MICRO FACTORS OF MARKET
  • FIGURE 5 BOTTOM-UP APPROACH
  • FIGURE 6 TOP-DOWN APPROACH
  • FIGURE 7 DATA TRIANGULATION
  • FIGURE 8 LAND SEGMENT TO ACHIEVE HIGHEST GROWTH DURING FORECAST PERIOD
  • FIGURE 9 HOMELAND SECURITY SEGMENT TO ACHIEVE HIGHEST GROWTH DURING FORECAST PERIOD
  • FIGURE 10 CYBERSECURITY SYSTEMS SEGMENT TO LEAD MARKET DURING FORECAST PERIOD
  • FIGURE 11 NEW INSTALLATIONS SEGMENT TO LEAD MARKET DURING FORECAST PERIOD
  • FIGURE 12 NORTH AMERICA TO EMERGE AS LARGEST MARKET FOR BORDER SECURITY SYSTEMS DURING FORECAST PERIOD
  • FIGURE 13 GROWING INSTABILITY IN GLOBAL GEOPOLITICAL LANDSCAPE TO DRIVE MARKET FOR BORDER SECURITY SYSTEMS
  • FIGURE 14 LAND SEGMENT TO BE DOMINANT DURING FORECAST PERIOD
  • FIGURE 15 HOMELAND SECURITY SEGMENT TO LEAD MARKET DURING FORECAST PERIOD
  • FIGURE 16 SURVEILLANCE SYSTEMS SEGMENT TO ACCOUNT FOR LARGEST SHARE DURING FORECAST PERIOD
  • FIGURE 17 NEW INSTALLATIONS SEGMENT TO ACCOUNT FOR LARGER SHARE THAN UPGRADES SEGMENT IN 2024
  • FIGURE 18 BORDER SECURITY MARKET DYNAMICS
  • FIGURE 19 FATALITIES CAUSED DUE TO TERRORIST ATTACKS, 2010–2022
  • FIGURE 20 TRENDS AND DISRUPTIONS IMPACTING CUSTOMERS’ BUSINESSES
  • FIGURE 21 ECOSYSTEM ANALYSIS
  • FIGURE 22 VALUE CHAIN ANALYSIS
  • FIGURE 23 INDICATIVE PRICING ANALYSIS OF SYSTEMS OFFERED BY KEY PLAYERS (USD)
  • FIGURE 24 ACTIVE FLEET OF DRONES USED BY US NAVY AND MARINE (UNITS)
  • FIGURE 25 ACTIVE FLEET OF DRONES USED BY US AIR FORCE (UNITS)
  • FIGURE 26 IMPORT DATA OF CAMERAS, BY COUNTRY, 2022–2023 (USD THOUSAND)
  • FIGURE 27 EXPORT DATA OF CAMERAS, BY COUNTRY, 2022–2023 (USD THOUSAND)
  • FIGURE 28 IMPORT DATA OF RADAR APPARATUS, BY COUNTRY, 2019–2023 (USD THOUSAND)
  • FIGURE 29 EXPORT DATA OF RADAR APPARATUS, BY COUNTRY, 2019–2023 (USD THOUSAND)
  • FIGURE 30 IMPORT DATA OF COMMUNICATIONS SYSTEMS, BY COUNTRY, 2019–2023 (USD THOUSAND)
  • FIGURE 31 EXPORT DATA OF COMMUNICATIONS SYSTEMS, BY COUNTRY, 2019–2023 (USD THOUSAND)
  • FIGURE 32 IMPORT DATA OF UNMANNED AIRCRAFT, BY COUNTRY, 2022–2023 (USD THOUSAND)
  • FIGURE 33 EXPORT DATA OF UNMANNED AIRCRAFT, BY COUNTRY, 2022–2023 (USD THOUSAND)
  • FIGURE 34 INFLUENCE OF STAKEHOLDERS ON BUYING PROCESS, BY DOMAIN
  • FIGURE 35 KEY BUYING CRITERIA, BY DOMAIN
  • FIGURE 36 BUSINESS MODELS
  • FIGURE 37 OWNERSHIP COSTS FOR BORDER SECURITY SYSTEMS
  • FIGURE 38 BILL OF MATERIALS FOR MULTIFUNCTION RADARS
  • FIGURE 39 BILL OF MATERIALS FOR WEATHER RADARS
  • FIGURE 40 BILL OF MATERIALS FOR SURVEILLANCE AND AIRBORNE EARLY WARNING RADARS
  • FIGURE 41 INVESTMENT AND FUNDING SCENARIO
  • FIGURE 42 EVOLUTION OF BORDER SECURITY TECHNOLOGIES
  • FIGURE 43 TECHNOLOGY ROADMAP
  • FIGURE 44 EMERGING TRENDS IN BORDER SECURITY MARKET
  • FIGURE 45 TECHNOLOGY TRENDS IN BORDER SECURITY MARKET
  • FIGURE 46 SUPPLY CHAIN ANALYSIS
  • FIGURE 47 PATENT ANALYSIS
  • FIGURE 48 GENERATIVE AI IN DEFENSE
  • FIGURE 49 ADOPTION OF GENERATIVE AI IN MILITARY BY TOP COUNTRIES
  • FIGURE 50 IMPACT OF GENERATIVE AI ON MILITARY PLATFORMS
  • FIGURE 51 IMPACT OF GENERATIVE AI ON BORDER SECURITY MARKET
  • FIGURE 52 BORDER SECURITY MARKET, BY DOMAIN, 2024 VS. 2029 (USD MILLION)
  • FIGURE 53 MARKET, BY VERTICAL, 2024 VS. 2029 (USD MILLION)
  • FIGURE 54 BORDER SECURITY MARKET, BY SYSTEM, 2024 VS. 2029 (USD MILLION)
  • FIGURE 55 MARKET, BY INSTALLATION, 2024 VS. 2029 (USD MILLION)
  • FIGURE 56 BORDER SECURITY MARKET: REGIONAL SNAPSHOT
  • FIGURE 57 NORTH AMERICA: MARKET SNAPSHOT
  • FIGURE 58 EUROPE: BORDER SECURITY MARKET SNAPSHOT
  • FIGURE 59 ASIA PACIFIC: MARKET SNAPSHOT
  • FIGURE 60 MIDDLE EAST: MARKET SNAPSHOT
  • FIGURE 61 REST OF THE WORLD: BORDER SECURITY MARKET SNAPSHOT
  • FIGURE 62 MARKET SHARE ANALYSIS OF TOP PLAYERS IN BORDER SECURITY MARKET, 2023
  • FIGURE 63 REVENUE ANALYSIS OF TOP FIVE PLAYERS, 2020–2023
  • FIGURE 64 EV/EBIDTA OF PROMINENT MARKET PLAYERS
  • FIGURE 65 VALUATION OF PROMINENT MARKET PLAYERS
  • FIGURE 66 BORDER SECURITY MARKET: COMPANY EVALUATION MARKET (KEY PLAYERS), 2023
  • FIGURE 67 COMPANY PRODUCT FOOTPRINT
  • FIGURE 68 BORDER SECURITY MARKET: COMPANY EVALUATION MATRIX (STARTUPS/SMES), 2023
  • FIGURE 69 LOCKHEED MARTIN CORPORATION: COMPANY SNAPSHOT
  • FIGURE 70 GENERAL DYNAMICS CORPORATION: COMPANY SNAPSHOT
  • FIGURE 71 BAE SYSTEMS: COMPANY SNAPSHOT
  • FIGURE 72 NORTHROP GRUMMAN: COMPANY SNAPSHOT
  • FIGURE 73 THALES: COMPANY SNAPSHOT
  • FIGURE 74 RTX: COMPANY SNAPSHOT
  • FIGURE 75 LEONARDO S.P.A.: COMPANY SNAPSHOT
  • FIGURE 76 ELBIT SYSTEMS LTD.: COMPANY SNAPSHOT
  • FIGURE 77 L3HARRIS TECHNOLOGIES, INC.: COMPANY SNAPSHOT
  • FIGURE 78 SAAB AB: COMPANY SNAPSHOT
  • FIGURE 79 AIRBUS: COMPANY SNAPSHOT
  • FIGURE 80 ISRAEL AEROSPACE INDUSTRIES: COMPANY SNAPSHOT
  • FIGURE 81 ASELSAN A.S.: COMPANY SNAPSHOT
  • FIGURE 82 BHARAT ELECTRONICS LIMITED (BEL): COMPANY SNAPSHOT
  • FIGURE 83 HENSOLDT AG: COMPANY SNAPSHOT
  • FIGURE 84 BOEING: COMPANY SNAPSHOT


This research study involved the substantial use of secondary sources, directories, and databases, such as D&B Hoovers, Bloomberg Businessweek, and Factiva, to identify and collect information on the border security market. Primary sources included experts from core and related industries, suppliers, manufacturers, solution providers, technology developers, alliances, and organizations related to all segments of the industry’s value chain. All primary sources were interviewed to obtain and verify critical qualitative and quantitative information as well as assess prospects for the growth of the market during the forecast period.

Secondary Research

The market size of companies offering border security systems was arrived at based on the secondary data available through paid and unpaid sources, as well as by analyzing the product portfolios of major companies and rating them based on their performance and quality.

In the secondary research process, various secondary sources were referred to identify and collect information for this study. These included government sources; corporate filings such as annual reports, press releases, and investor presentations; white papers, journals, and certified publications; and articles by recognized authors, directories, and databases.

Secondary research was mainly used to obtain key information about the industry’s value and supply chain and identify the key players by various products, market classifications, and segmentation according to their offerings and industry trends related to domain, vertical, system, installation, and region, and key developments from both the market and technology-oriented perspectives.

Primary Research

In the primary research process, various primary sources from both the supply and demand sides were interviewed to obtain qualitative and quantitative information on the market. Primary sources from the supply side included various industry experts, such as vice presidents (VPs), directors from business development, marketing, product development/innovation teams, and related key executives from components vendors, border security systems manufacturers, integrators, distributors, and key opinion leaders.

Primary interviews were conducted to gather insights such as market statistics, data on revenue collected from products, market breakdowns, market size estimations, market forecasting, and data triangulation. Primary research also helped me understand the various trends related to border security systems. Stakeholders from the demand side, such as CIOs, CTOs, CSOs, and installation teams of customers/end users of border security systems, were interviewed to understand the buyer’s perspective on suppliers, products, component providers, their current usage of border security systems, and the outlook of their businesses.

Border Security Market
 Size, and Share

To know about the assumptions considered for the study, download the pdf brochure

Market Size Estimation

Top-down and bottom-up approaches were used to estimate and validate the size of the border security market. The research methodology used to estimate the size of the market includes the following details.

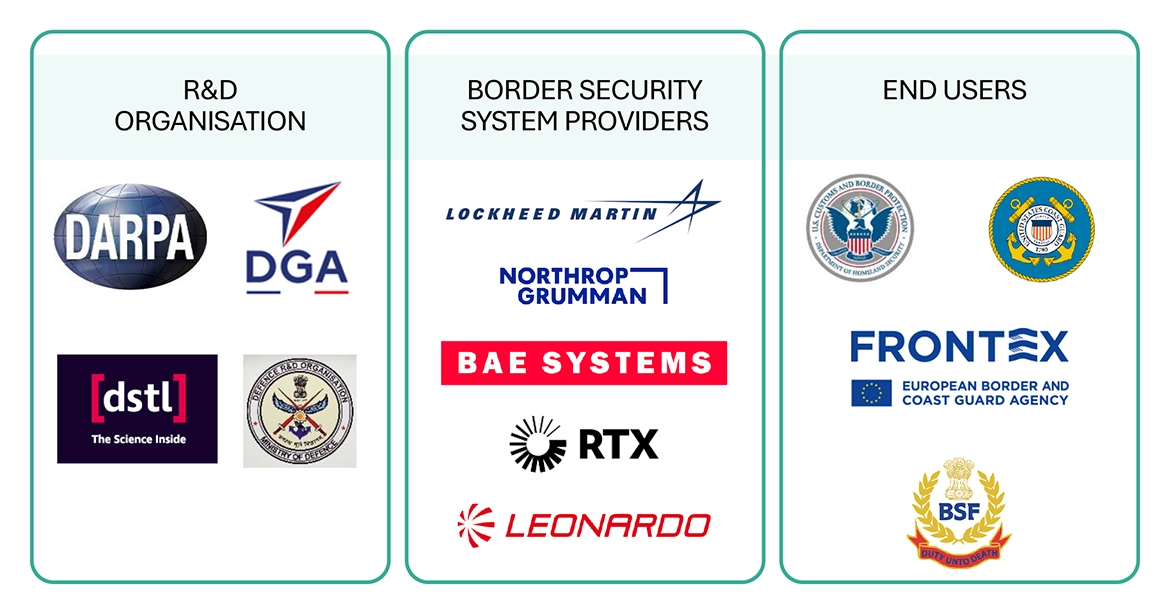
Key players in the border security market were identified through secondary research, and their market share was determined through primary and secondary research. This included a study of the annual and financial reports of top market players and extensive interviews with leaders such as directors, engineers, marketing executives, and other stakeholders of leading companies operating in the border security market.

All percentage shares, splits, and breakdowns were determined using secondary sources and verified through primary sources. All possible parameters that affect the markets covered in this research study were accounted for, viewed in extensive detail, verified through primary research, and analyzed to obtain the final quantitative and qualitative data on the border security market. This data was consolidated, enhanced with detailed inputs, analyzed by MarketsandMarkets, and presented in this report.

Border Security Market Top Down and Bottom Up Approach

Data Triangulation

After arriving at the overall market size from the market size estimation process, the total market was split into several segments and subsegments. Data triangulation and market breakdown procedures explained below were implemented, wherever applicable, to complete the overall market engineering process and arrive at the estimated market numbers for border security systems segments and subsegments. The data was triangulated by studying various factors and trends from both the demand and supply sides. The market size was also validated using both top-down and bottom-up approaches.

Market Definition

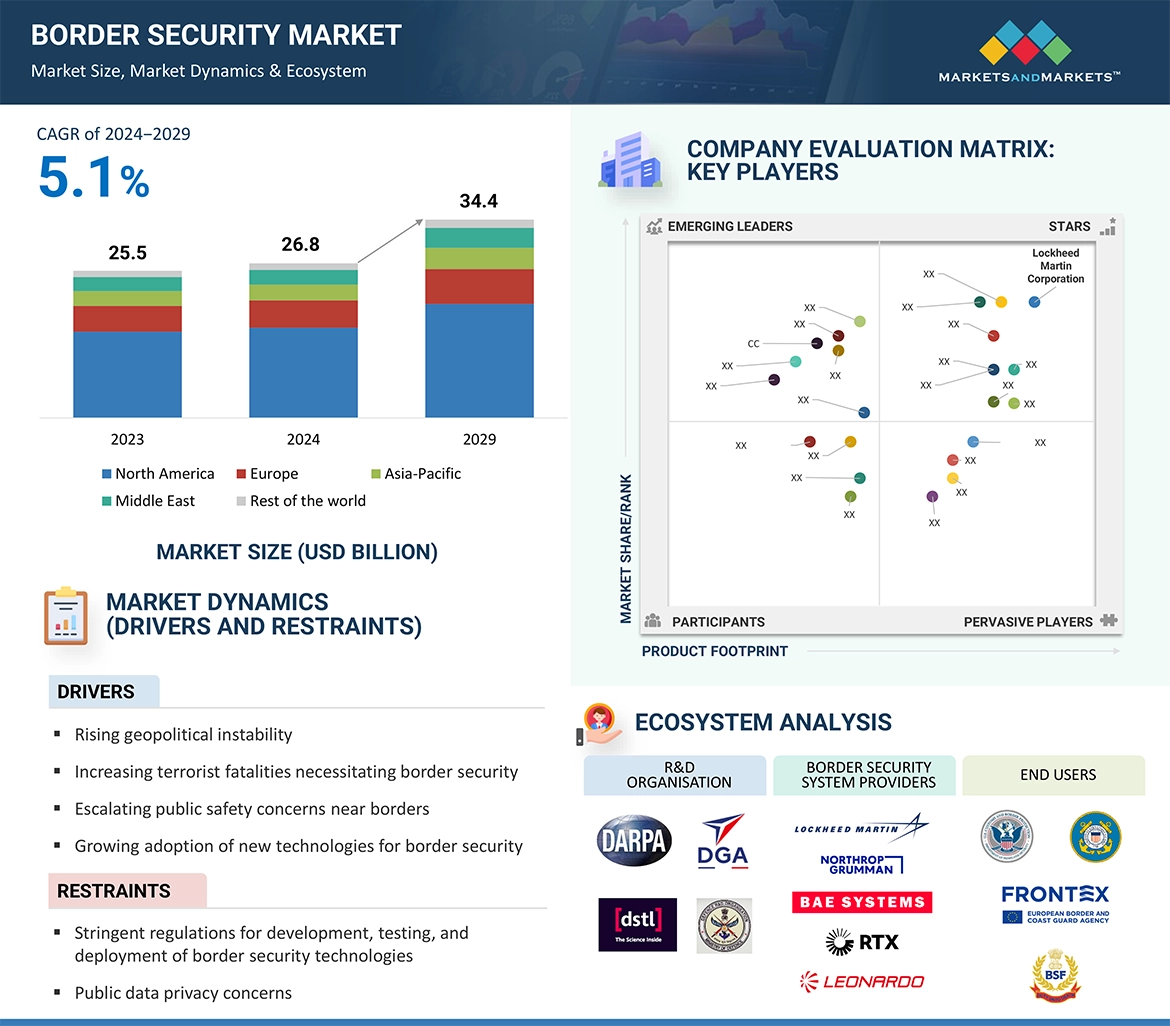
Border Security systems are complete and fully integrated border management solutions as well as specific systems and products for surveillance and control of different environments such as land, airborne, and coastal border surveillance. Border security systems include buried cable/buried sensors, Radar systems, CCTV and thermal imaging IR detection camera systems, perimeter intrusion detection systems/ intelligent fencing systems, unmanned vehicles, wide-band wireless communication systems, command and control (C2) systems, biometric systems, and others (RF jammers, microwave intrusion detection system).

Report Objectives

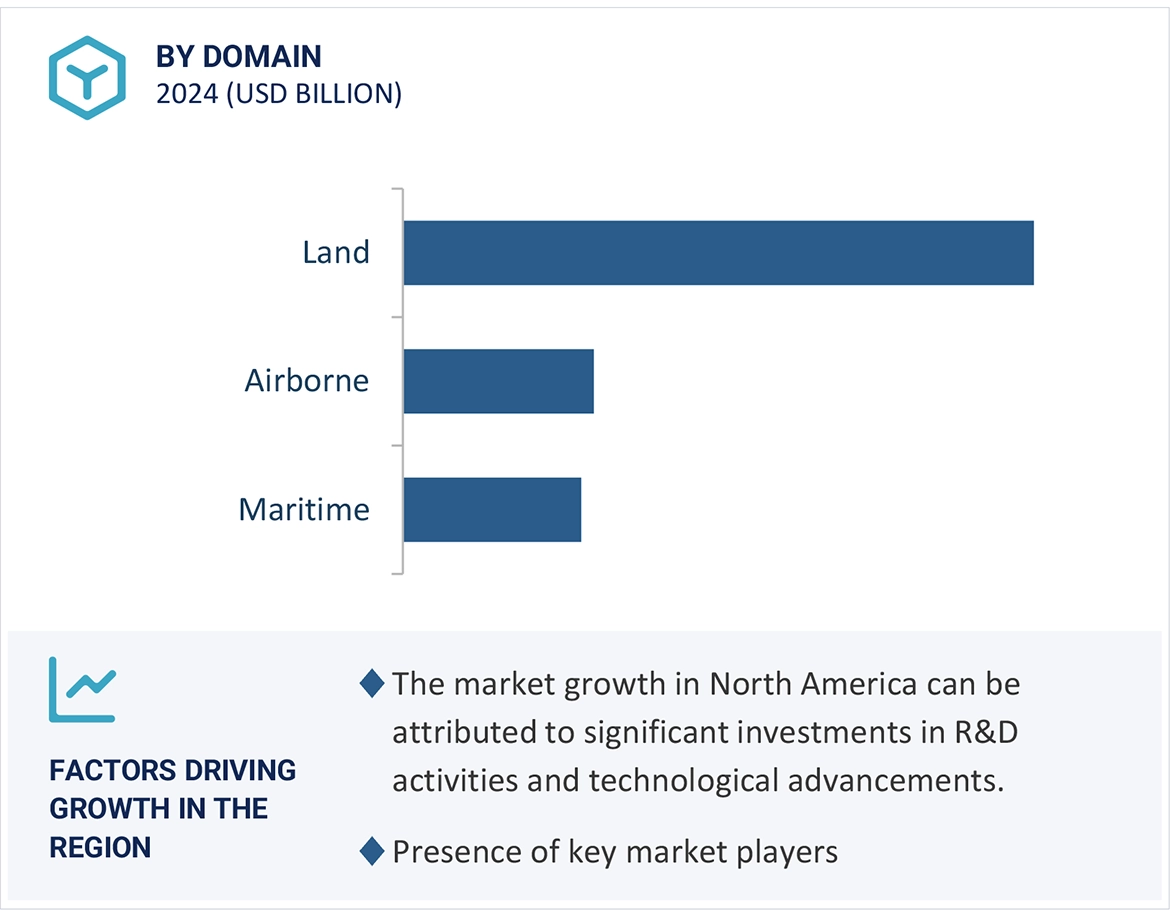
  • To define, describe, segment, and forecast the size of the border security market based on domain, vertical, system, installation, and region
  • To forecast the size of market segments with respect to five regions, namely North America, Europe, Asia Pacific, the Middle East, and the Rest of the World, along with major countries in each region
  • To identify and analyze key drivers, restraints, opportunities, and challenges influencing the market growth
  • To analyze micromarkets1 with respect to individual growth trends, prospects, and their contribution to the overall market
  • To analyze opportunities in the market for stakeholders by identifying key market trends
  • To profile key market players and comprehensively analyze their market shares and core competencies2
  • To identify detailed financial positions, key products, and unique selling points of leading companies in the market
  • To provide a detailed competitive landscape of the market, along with market share analysis, market ranking analysis, and revenue analysis of key players
  • To analyze the degree of competition in the market by identifying key growth strategies adopted by leading market players

Available customizations

Along with the market data, MarketsandMarkets offers customizations as per the specific needs of companies. The following customization options are available for the report:

Product Analysis

  • Product matrix, which gives a detailed comparison of the product portfolio of each company

Regional Analysis

  • Further breakdown of the market segments at country-level

Company Information

  • Detailed analysis and profiling of additional market players (up to 5)

Previous Versions of this Report

Border Security Market by Domain (Land, Maritime, Airborne), Vertical (Military, Homeland Security), System (Surveillance Systems, Detection Systems, Communication Systems, Command and Control Systems), Installation & Region – Global Forecast to 2029

Report Code AS 9079
Published in Apr, 2016, By MarketsandMarkets™
"Our USP is "providing game-changing business opportunities reports with free customization" - so please feel free to provide us with your specific areas of interest / business challenges in much greater detail !!"

We appreciate your interest in this report. Once you fill out the form, you'll be immediately directed to an exclusive solution tailored to your needs. This high-value offering can help boost your revenue by 30% - a must-see opportunity for anyone looking to maximize growth.


By clicking the "Submit" button, you are agreeing to the Terms of Use and Privacy Policy.

Custom Market Research Services

We Will Customise The Research For You, In Case The Report Listed Above Does Not Meet With Your Requirements

Get 10% Free Customisation

Growth opportunities and latent adjacency in Border Security Market

Igor

Mar, 2017

Hi, I'm looking for custom-made market research on Long-range and medium range Land-based Electro-Optics/Infrared observation Systems. The systems on the research have to be stationary (not handheld or vehicle mounted or mobile). The main focus areas of interest are Border security and coastal security, critical Infrastructure protection (CIP) such as Gas and oil, Army bases, Airports etc. And also Land based Automatic Target Detection and Tracking systems manufacturers. .

Maddie

Oct, 2016

I am specifically looking for a report that focuses on the ground environment and radars and cameras only. Does the scope of the Border Security System Market cover it all?.

de

Sep, 2019

Hello I would be pleased to receive some information regarding Border Security System Market. May I have an overview with the brochure to see if I wish to buy the all study?.

Eyal

Mar, 2019

Free sample request for Border Security System Market by Environment (Ground, Aerial, Naval), System (Laser, Radar, Camera, Wide Band Wireless Communication, Perimeter Intrusion, Unmanned Vehicles, C2C, Biometric Systems), and Geography - Global Forecast to 2022.

DMCA.com Protection Status