Defense Cybersecurity Market

Defense Cybersecurity Market by Offering (Hardware, Software, and Services), Security (Network Security, Endpoint Security, Application Security, Cloud Security), End User (Army, Navy, Air Force), Application and Region - Global Forecast to 2028

Report Code: AS 8895 Dec, 2023, by marketsandmarkets.com

[239 Pages Report] The Defense Cybersecurity Market is estimated to be USD 36.9 Billion in 2023 and is projected to reach USD 49.4 Billion by 2028, at a CAGR of 6.0% from 2023 to 2028.  The key driving factor for the growth of the Defense Cybersecurity Industry is the continuously evolving and increasingly sophisticated nature of cyber threats. As technological advancements permeate military operations, the attack surface expands, and cyber adversaries develop new tactics to exploit vulnerabilities. The growing complexity of military systems, coupled with the interconnectedness of defense networks, makes them lucrative targets for various malicious actors, including state-sponsored entities, cybercriminals, and hacktivists.

To counter these evolving threats, defense organizations worldwide are compelled to invest significantly in cybersecurity measures. This includes the development and deployment of advanced technologies such as artificial intelligence, and machine learning, among others, to stay ahead of cyber adversaries. The constant need to innovate and enhance cybersecurity capabilities is a fundamental driving force behind the growth of the defense cybersecurity market.

Defense Cybersecurity Market

Defense Cybersecurity Market

Defense Cybersecurity Market Forecast to 2028

To know about the assumptions considered for the study, Request for Free Sample Report

Defense Cybersecurity Market Dynamics:

Drivers: Expanding Cyberattacks Across Various Defense Industries

In recent years, there has been a substantial rise in the frequency, sophistication, and severity of cyber threats worldwide. These threats come from various sources, including nation-states, hacktivists, cybercriminal organizations, and insider threats. Defense organizations are prime targets for these cyberattacks due to the sensitive and classified nature of the information they handle. For example, in October 2022, the Federal Bureau of Organizations (FBI) National Security agency (NSA) announced State sponsored Cyber attackers successfully breached a defense organization, securing and retaining long-term access to its network, and had illicitly extracted sensitive data from the compromised system from January 2021 till November 2021.

The increasing cyber threats pose a significant challenge to national security. State-sponsored cyberattacks have become a means of waging digital warfare, and defense organizations must be prepared to defend against these attacks. These threats can take many forms, from espionage through Advanced Persistent Threats (APTs), Intellectual Property Theft, and infiltration aimed at stealing classified information to disrupting critical infrastructure and military operations. The consequences of a successful cyberattack on a defense organization can be severe, potentially compromising national security and putting lives at risk.

To mitigate these threats, defense organizations are compelled to invest in robust cybersecurity measures. This includes the development of advanced threat detection and prevention systems, secure communication protocols, and incident response capabilities. Additionally, they must continually adapt and evolve their cybersecurity strategies to keep pace with the ever-changing threat landscape. Thus, the defense cybersecurity market is driven by the need to safeguard national security interests and protect sensitive military information in the face of a growing and evolving cyber threat landscape.

Restraints: Inefficiency of Legacy Systems in the Modern Cybersecurity Landscape

Security legacy systems refer to older, often outdated, technological infrastructures, software, and hardware that have been used within defense organizations for an extended period. These systems were developed in an era when cybersecurity was not a primary concern, and they now pose several restraints in the context of modern cybersecurity efforts.

Legacy systems are typically not designed with robust security features and considerations that contemporary systems benefit from. This makes them highly susceptible to cyberattacks and vulnerabilities. Attackers often target legacy systems because they are aware that these systems may lack the latest security patches, updates, or the capacity to implement advanced security protocols. Updating or replacing these legacy systems can be challenging. The cost associated with updating or replacing these systems is also substantial, requiring a considerable allocation of resources, which may compete with other defense priorities. The rapidly changing nature of cybersecurity requires systems that can be regularly updated and modified to respond to new threats. Legacy systems, with their fixed architectures and limitations, are ill-suited for this purpose.

Opportunities: Boost in International Collaborations

International collaborations refer to the potential for defense organizations from different nations to work together in a coordinated effort to enhance cybersecurity capabilities. In an increasingly interconnected world, where cyber threats often transcend national borders, collaboration on defense cybersecurity is becoming necessary.
One of the key benefits of international collaboration in defense cybersecurity is the pooling of resources, expertise, and threat intelligence. No single nation possesses a monopoly on cybersecurity knowledge or technology. By sharing information, experiences, and best practices, nations can collectively bolster their cybersecurity defenses. This collaboration allows for a more comprehensive understanding of evolving cyber threats and the development of effective countermeasures.

Furthermore, international collaboration can foster the development of global standards and norms in cybersecurity. These standards can guide responsible behavior in cyberspace and establish guidelines for addressing cyberattacks. For example, countries can agree on rules of engagement and response mechanisms in the event of a cyber incident. This reduces the risk of misunderstandings or escalations in a cyber conflict.

Additionally, collaborative efforts can lead to joint research and development initiatives, enabling the creation of cutting-edge cybersecurity technologies. This can reduce duplication of effort, drive cost-efficiency, and accelerate innovation in the field of defense cybersecurity. International collaboration also enhances incident response capabilities. In the event of a large-scale cyberattack, nations can coordinate their responses, share threat intelligence, and work together to identify and neutralize threats, minimizing the impact of the attack.

Challenges: Shortage of Skilled Personnel

The foremost challenge facing the defense cybersecurity landscape involves the shortage of skilled personnel. As the complexity and frequency of cyber threats continue to escalate, the demand for qualified cybersecurity professionals has reached unprecedented levels. The shortage is multifaceted, stemming from the rapid evolution of cyber threats, the expanding attack surface resulting from increased digital connectivity and the intricate nature of the cybersecurity domain.

The field of cybersecurity is marked by its dynamic and ever-changing nature. Cyber threats evolve at an alarming rate, with malicious actors continuously devising new techniques and tactics to breach defense systems. This rapid evolution necessitates a workforce with current knowledge and the agility to adapt swiftly to emerging threats. The shortage is exacerbated by the time it takes to train and educate cybersecurity professionals, creating a perpetual lag between the skills required and those available in the workforce. The expanding attack surface, driven by the increasing interconnectedness of defense networks and the adoption of emerging technologies, puts immense pressure on cybersecurity personnel. The Internet of Things (IoT), cloud computing, and other innovations broaden the scope of potential vulnerabilities, demanding a workforce capable of securing diverse and complex systems. This widening attack surface requires cybersecurity professionals with specialized expertise in cloud security, IoT security, and industrial control systems.

Lastly, the intricacy of the cybersecurity domain itself contributes to the scarcity of skilled personnel. Cybersecurity is not a monolithic field but comprises various specialized domains, including penetration testing, threat intelligence, incident response, and risk management. Each domain requires a unique skill set, and individuals proficient in one area may not necessarily possess expertise in others.

Defense Cybersecurity  Market Ecosystem

Booz Allen Hamilton Inc. (US), General Dynamics Corporation (US),  Cisco Systems, Inc. (US),  Microsoft (US), Leidos (US), IBM (US), Thales (France), Lockheed Martin Corporation (US), Northrop Grumman (US),  Raytheon technologies (US), L3Harris Technologies Inc. (US), Leonardo S.p.A (Italy), CACI International Inc (US), Elbit Systems Ltd (Israel), and BAE Systems (UK) are some of the leading companies in the defense cybersecurity market. 

Defense Cybersecurity Market by Ecosystem

Based on End Users, the Navy Segment Accounts for the Highest Market Share in Defense Cybersecurity Market During the Forecast Period

The Navy segment is expected to account for the highest market share during the forecast period. Naval forces rely extensively on network-centric operations, where ships, submarines, aircraft, and shore-based facilities are interconnected to enhance situational awareness and operational effectiveness. The complexity and scale of maritime networks make them prime targets for cyber threats, necessitating advanced cybersecurity measures. The Navy's emphasis on network-centric warfare positions it at the forefront of investing in robust defense cybersecurity solutions.  Naval assets represent critical infrastructure, including aircraft carriers, submarines, and communication hubs. Securing these assets against cyber threats is vital for maintaining operational capabilities and strategic advantage. The Navy's focus on protecting critical maritime infrastructure contributes to its leadership role in driving advancements in defense cybersecurity.

Based on Offering, the Software and Services Segment Accounts for the Largest Market Share in the Defense Cybersecurity Market During the Forecast Period

The Software and Services segment is anticipated to account for the highest market share in the defense cybersecurity market during the forecast period due  to several key factors:

The defense sector is witnessing a rapid integration of cutting-edge technologies, such as artificial intelligence, machine learning, and quantum-resistant cryptography. Software solutions play a crucial role in implementing and adapting to these advancements, providing the agility required to stay ahead of emerging cyber threats.

The adoption of cloud computing in defense operations requires robust software solutions to secure data stored and processed in cloud environments. Cloud-based cybersecurity services offer scalability and flexibility, allowing defense organizations to adapt to changing requirements efficiently.

Based on Security Type, the Network Security Segment is Projected to Account for the Largest Market Share During the Forecast Period

Network Security is projected to lead the defense cybersecurity market by Security Type. The expanding attack surface resulting from the integration of advanced technologies, such as the Internet of Things (IoT), cloud computing, and 5G networks, introduces new vulnerabilities. Network Security is crucial for protecting against cyber threats targeting these diverse entry points, preventing unauthorized access, and ensuring the secure exchange of information. Network Security solutions enable real-time monitoring of network traffic, allowing for the rapid detection of anomalies and potential cyber threats. The ability to respond promptly to security incidents is critical in minimizing the impact of cyber attacks and maintaining operational continuity.

North America is Expected to Lead the Defense Cybersecurity Market in 2023

The Defense Cybersecurity market in the North American region is experiencing significant growth due to several key factors.

  • Military Modernization: North American nations, especially the U.S., are actively modernizing their military capabilities, integrating advanced technologies such as artificial intelligence, autonomous systems, and network-centric operations. The need to protect these sophisticated military assets against cyber threats propels the demand for advanced defense cybersecurity solutions, further solidifying North America's leadership in the market.
  • Global Cybersecurity Standards: North America plays a leading role in shaping global cybersecurity standards and practices. The region's commitment to establishing and adhering to high cybersecurity standards enhances its influence in international collaborations, making North American solutions and expertise widely recognized and adopted.
  • Large Defense Budgets: The United States, in particular, allocates substantial budgets to defense and cybersecurity initiatives. The significant financial investments in research and development, infrastructure, and cybersecurity capabilities contribute to the region's dominance in the defense cybersecurity market. The financial commitment enables the deployment of state-of-the-art technologies and the continuous improvement of cybersecurity measures.

Defense Cybersecurity Market by Region

Defense Cybersecurity Market by Region

To know about the assumptions considered for the study, download the pdf brochure

Defense Cybersecurity Industry Companies - Top
Key Market Players

Booz Allen Hamilton Inc. (US), General Dynamics Corporation (US),  Cisco Systems, Inc. (US),  Microsoft (US), Leidos (US), IBM (US), Thales (France), Lockheed Martin Corporation (US), Northrop Grumman (US),  Raytheon technologies (US), L3Harris Technologies Inc. (US), Leonardo S.p.A (Italy), CACI International Inc (US), Elbit Systems Ltd (Israel), and BAE Systems (UK) are some of the leading companies in the Defense Cybersecurity Companies.  These companies have well-equipped manufacturing facilities and strong distribution networks across North America, Europe, Asia Pacific, Latin America, and the Middle East & Africa.

Get online access to the report on the World's First Market Intelligence Cloud

  • Easy to Download Historical Data & Forecast Numbers
  • Company Analysis Dashboard for high growth potential opportunities
  • Research Analyst Access for customization & queries
  • Competitor Analysis with Interactive dashboard
  • Latest News, Updates & Trend analysis
Request Sample

Scope of the Report

Report Metric

Details

Estimated Market Size

USD 36.9 Billion in 2023

Projected Market Size

USD 49.4 Billion by 2028

Growth Rate

6.0%

Market Size Available for Years

2019–2028

Base Year Considered

2022

Forecast Period

2023–2028

Forecast Units

Value (USD million)

Segments Covered

By Offering, By Security Type, By End User, By Application and by Region

Geographies Covered

North America, Europe, Asia Pacific, the Middle East Rest of the World

Companies Covered

Booz Allen Hamilton Inc. (US), General Dynamics Corporation (US),  Cisco Systems, Inc. (US),  Microsoft (US), Leidos (US), IBM (US), Thales (France), Lockheed Martin Corporation (US), Northrop Grumman (US),  Raytheon technologies (US), L3Harris Technologies Inc. (US), Leonardo S.p.A (Italy), CACI International Inc (US), Elbit Systems Ltd (Israel),  BAE Systems (UK), SAIC (US), ASGN Incorporated (US),  AT&T (US), Echelon Services (US), Five Stones Research Corporation (US), Rite-Solutions Inc., Sealing Technologies (US), Axellio (US), Hub Security (Israel), Countercraft (Spain)

Defense Cybersecurity Market Highlights

This research report categorizes the Defense Cybersecurity market based on Offering, Security Type, End User, Application, and Region

Segment

Subsegment

By Security Type :

  • Network Security
    • Firewall and Security Appliance
    • Intrusion Detection System (IDS)
    • Intrusion Prevention System (IPS)
    • Secure Network Infrastructure
  • Endpoint Security
    • Antivirus/Antimalware Solution
    • Encryption Tool
    • Biometric Device
  • Application Security
    • Encryption Device
    • Secure Development Tool
    • Application Security Testing
  • Cloud Security
    • Secure Cloud Server and Storage Device
    • Cloud Encryption Software
    • Cloud Access Security Broker (CASB)

By Offering :

  • Hardware
  • Software and Services

By Application :

  • Critical Infrastructure Protection
  • Data Protection and Encryption
  • Incident Response and Forensics
  • Identity and Access Management
  • Secure Communications System

By End User:

  • Army
  • Navy
  • Air Force 

By Region:

  • North America
  • Europe
  • Asia Pacific
  • Middle East
  • Rest of the World

Recent Developments

  • In October 2023, the US Defense Information Systems Agency (DISA) (US) developed a Zero Trust Network named Thunderdome. The contract is valued at USD 1.86 Billion.
  • In January NATO  awarded a contract to IBM, which will encompass the integration of cyber defense capabilities and related configuration services, extending through 2025, with an additional two-year option. The contract is valued at USD 33.6 million.
  • In June 2021, Cisco Systems, Inc. (US) received an investment worth USD 1.18 Billion to provide Smart Net Total Care and software services.  

Key Questions Addressed by the Report:

To speak to our analyst for a discussion on the above findings, click Speak to Analyst

TABLE OF CONTENTS
 
1 INTRODUCTION (Page No. - 33)
    1.1 STUDY OBJECTIVES 
    1.2 MARKET DEFINITION 
    1.3 STUDY SCOPE 
           1.3.1 MARKETS COVERED
                    FIGURE 1 DEFENSE CYBERSECURITY MARKET SEGMENTATION
           1.3.2 REGIONS COVERED
           1.3.3 YEARS CONSIDERED
    1.4 INCLUSIONS AND EXCLUSIONS 
           TABLE 1 INCLUSIONS AND EXCLUSIONS
    1.5 CURRENCY CONSIDERED 
           TABLE 2 USD EXCHANGE RATES
    1.6 STAKEHOLDERS 
 
2 RESEARCH METHODOLOGY (Page No. - 37)
    2.1 RESEARCH DATA 
           FIGURE 2 RESEARCH PROCESS FLOW
           FIGURE 3 RESEARCH DESIGN
           2.1.1 SECONDARY DATA
                    2.1.1.1 Secondary sources
           2.1.2 PRIMARY DATA
                    2.1.2.1 Primary sources
                    2.1.2.2 Key data from primary sources
                    2.1.2.3 Key industry insights
                               FIGURE 4 BREAKDOWN OF PRIMARY INTERVIEWS
    2.2 FACTOR ANALYSIS 
           2.2.1 INTRODUCTION
           2.2.2 DEMAND-SIDE INDICATORS
                    2.2.2.1 Rising geopolitical tensions
                    2.2.2.2 Boost in modernization initiatives
                    2.2.2.3 Trend of remote work
                    2.2.2.4 Increasing frequency and severity of cyberattacks
           2.2.3 SUPPLY-SIDE INDICATORS
                    2.2.3.1 Financial trends of major defense contractors
           2.2.4 RECESSION IMPACT ANALYSIS
    2.3 MARKET SIZE ESTIMATION 
           2.3.1 BOTTOM-UP APPROACH
                    FIGURE 5 BOTTOM-UP APPROACH
           2.3.2 TOP-DOWN APPROACH
                    FIGURE 6 TOP-DOWN APPROACH
    2.4 DATA TRIANGULATION 
           FIGURE 7 DATA TRIANGULATION
    2.5 RESEARCH ASSUMPTIONS 
           FIGURE 8 RESEARCH ASSUMPTIONS
    2.6 RESEARCH LIMITATIONS 
    2.7 RISK ASSESSMENT 
 
3 EXECUTIVE SUMMARY (Page No. - 49)
    FIGURE 9 NETWORK SECURITY TO BE FASTEST-GROWING SEGMENT DURING FORECAST PERIOD
    FIGURE 10 NAVY TO BE LARGEST SEGMENT DURING FORECAST PERIOD
    FIGURE 11 HARDWARE TO RECORD HIGHEST CAGR DURING FORECAST PERIOD
    FIGURE 12 NORTH AMERICA TO BE LARGEST MARKET DURING FORECAST PERIOD
 
4 PREMIUM INSIGHTS (Page No. - 52)
    4.1 ATTRACTIVE OPPORTUNITIES FOR PLAYERS IN DEFENSE CYBERSECURITY MARKET 
           FIGURE 13 RISE IN INVESTMENTS AND TECHNOLOGICAL ADVANCEMENTS TO DRIVE GROWTH
    4.2 DEFENSE CYBERSECURITY MARKET, BY SECURITY TYPE 
           FIGURE 14 NETWORK SECURITY TO SURPASS OTHER SEGMENTS DURING FORECAST PERIOD
    4.3 DEFENSE CYBERSECURITY MARKET, BY OFFERING 
           FIGURE 15 SOFTWARE AND SERVICE SEGMENT TO SECURE LEADING MARKET POSITION DURING FORECAST PERIOD
    4.4 DEFENSE CYBERSECURITY MARKET, BY END USER 
           FIGURE 16 NAVY TO DOMINATE MARKET DURING FORECAST PERIOD
    4.5 DEFENSE CYBERSECURITY MARKET, BY COUNTRY 
           FIGURE 17 INDIA TO BE FASTEST-GROWING MARKET DURING FORECAST PERIOD
 
5 MARKET OVERVIEW (Page No. - 55)
    5.1 INTRODUCTION 
    5.2 MARKET DYNAMICS 
           FIGURE 18 DEFENSE CYBERSECURITY MARKET DYNAMICS
           5.2.1 DRIVERS
                    5.2.1.1 Expanding cyberattacks across various defense industries
                    5.2.1.2 Integration of advanced digital technologies
                    5.2.1.3 Rapid deployment of information technology
                    5.2.1.4 Growing defense spending on modernization of cybersecurity solutions
                               TABLE 3 DEFENSE EXPENDITURE, BY COUNTRY, 2021–2022 (USD BILLION)
                               FIGURE 19 DEFENSE EXPENDITURE, BY COUNTRY, 2021–2022 (%)
           5.2.2 RESTRAINTS
                    5.2.2.1 Inefficiency of legacy systems in modern cybersecurity landscape
                    5.2.2.2 Increase in regulatory compliances
           5.2.3 OPPORTUNITIES
                    5.2.3.1 Rise in international collaborations
           5.2.4 CHALLENGES
                    5.2.4.1 Shortage of skilled personnel
                    5.2.4.2 Interoperability issues within existing defense systems
    5.3 TRENDS AND DISRUPTIONS IMPACTING CUSTOMERS’ BUSINESSES 
           FIGURE 20 TRENDS AND DISRUPTIONS IMPACTING CUSTOMERS’ BUSINESSES
    5.4 ECOSYSTEM MAPPING 
           5.4.1 PROMINENT COMPANIES
           5.4.2 PRIVATE AND SMALL ENTERPRISES
           5.4.3 END USERS
                    FIGURE 21 ECOSYSTEM MAPPING
                    TABLE 4 ROLE OF COMPANIES IN ECOSYSTEM
                    FIGURE 22 KEY PLAYERS IN DEFENSE CYBERSECURITY ECOSYSTEM
    5.5 VALUE CHAIN ANALYSIS 
           FIGURE 23 VALUE CHAIN ANALYSIS
    5.6 PRICING ANALYSIS 
           5.6.1 AVERAGE SELLING PRICE TREND OF DEFENSE CYBERSECURITY, BY OFFERING
                    FIGURE 24 AVERAGE SELLING PRICE TREND OF DEFENSE CYBERSECURITY, BY OFFERING
                    TABLE 5 AVERAGE SELLING PRICE TREND OF DEFENSE CYBERSECURITY, BY OFFERING
           5.6.2 INDICATIVE PRICING ANALYSIS OF DEFENSE CYBERSECURITY
    5.7 TECHNOLOGICAL ANALYSIS 
           5.7.1 ZERO TRUST ARCHITECTURE
           5.7.2 DECEPTION TECHNOLOGIES
                    FIGURE 25 TECHNOLOGICAL ROADMAP FOR DEFENSE CYBERSECURITY MARKET
    5.8 CASE STUDIES 
           5.8.1 DATA PROTECTION AND ENCRYPTION
           5.8.2 INSIDER THREAT MITIGATION
    5.9 PORTER’S FIVE FORCES ANALYSIS 
           TABLE 6 PORTER’S FIVE FORCES ANALYSIS
           FIGURE 26 PORTER’S FIVE FORCES ANALYSIS
           5.9.1 THREAT OF NEW ENTRANTS
           5.9.2 THREAT OF SUBSTITUTES
           5.9.3 BARGAINING POWER OF SUPPLIERS
           5.9.4 BARGAINING POWER OF BUYERS
           5.9.5 INTENSITY OF COMPETITIVE RIVALRY
    5.10 KEY STAKEHOLDERS AND BUYING CRITERIA 
           5.10.1 STAKEHOLDERS IN BUYING PROCESS
                    FIGURE 27 INFLUENCE OF STAKEHOLDERS ON BUYING PROCESS, BY SECURITY TYPE
                    TABLE 7 INFLUENCE OF STAKEHOLDERS ON BUYING PROCESS, BY SECURITY TYPE (%)
           5.10.2 KEY BUYING CRITERIA
                    FIGURE 28 KEY BUYING CRITERIA, BY OFFERING
                    TABLE 8 KEY BUYING CRITERIA, BY OFFERING
    5.11 REGULATORY LANDSCAPE 
           TABLE 9 NORTH AMERICA: REGULATORY BODIES, GOVERNMENT AGENCIES, AND OTHER ORGANIZATIONS
           TABLE 10 EUROPE: REGULATORY BODIES, GOVERNMENT AGENCIES, AND OTHER ORGANIZATIONS
           TABLE 11 ASIA PACIFIC: REGULATORY BODIES, GOVERNMENT AGENCIES, AND OTHER ORGANIZATIONS
           TABLE 12 MIDDLE EAST: REGULATORY BODIES, GOVERNMENT AGENCIES, AND OTHER ORGANIZATIONS
           TABLE 13 REST OF THE WORLD: REGULATORY BODIES, GOVERNMENT AGENCIES, AND OTHER ORGANIZATIONS
    5.12 KEY CONFERENCES AND EVENTS, 2024–2025 
           TABLE 14 KEY CONFERENCES AND EVENTS, 2024–2025
 
6 INDUSTRY TRENDS (Page No. - 76)
    6.1 INTRODUCTION 
    6.2 TECHNOLOGICAL TRENDS 
           6.2.1 ARTIFICIAL INTELLIGENCE AND MACHINE LEARNING
           6.2.2 5G
           6.2.3 CLOUD TECHNOLOGY
           6.2.4 DEVSECOPS
    6.3 IMPACT OF MEGATRENDS 
    6.4 SUPPLY CHAIN ANALYSIS 
           FIGURE 29 SUPPLY CHAIN ANALYSIS
    6.5 PATENT ANALYSIS 
           FIGURE 30 PATENT ANALYSIS
           TABLE 15 PATENT ANALYSIS, 2020–2023
 
7 DEFENSE CYBERSECURITY MARKET, BY SECURITY TYPE (Page No. - 87)
    7.1 INTRODUCTION 
           FIGURE 31 DEFENSE CYBERSECURITY MARKET, BY SECURITY TYPE, 2023–2028
           TABLE 16 DEFENSE CYBERSECURITY MARKET, BY SECURITY TYPE, 2019–2022 (USD MILLION)
           TABLE 17 DEFENSE CYBERSECURITY MARKET, BY SECURITY TYPE, 2023–2028 (USD MILLION)
    7.2 NETWORK SECURITY 
           7.2.1 INTEGRATION OF NEW TECHNOLOGIES INTO MILITARY OPERATIONS TO DRIVE GROWTH
                    7.2.1.1 Firewall and Security Appliance
                    7.2.1.2 Intrusion Detection System
                    7.2.1.3 Intrusion Prevention System
                    7.2.1.4 Secure Network Infrastructure
    7.3 ENDPOINT SECURITY 
           7.3.1 VULNERABILITIES IN ENDPOINT DEVICES TO DRIVE GROWTH
                    7.3.1.1 Antivirus/Antimalware Solution
                    7.3.1.2 Encryption Tool
                    7.3.1.3 Biometric Device
    7.4 APPLICATION SECURITY 
           7.4.1 DEPLOYMENT OF ADVANCED SOFTWARE SYSTEMS TO DRIVE GROWTH
                    7.4.1.1 Encryption Device
                    7.4.1.2 Secure Development Tool
                    7.4.1.3 Application Security Testing
    7.5 CLOUD SECURITY 
           7.5.1 RISING ADOPTION OF CLOUD COMPUTING SOLUTIONS TO DRIVE GROWTH
                    7.5.1.1 Secure Cloud Server and Storage Device
                    7.5.1.2 Cloud Encryption Software
                    7.5.1.3 Cloud Access Security Broker
 
8 DEFENSE CYBERSECURITY MARKET, BY END USER (Page No. - 95)
    8.1 INTRODUCTION 
           FIGURE 32 DEFENSE CYBERSECURITY MARKET, BY END USER, 2023–2028
           TABLE 18 DEFENSE CYBERSECURITY MARKET, BY END USER, 2019–2022 (USD MILLION)
           TABLE 19 DEFENSE CYBERSECURITY MARKET, BY END USER, 2023–2028 (USD MILLION)
    8.2 ARMY 
           8.2.1 INVESTMENTS IN CUTTING-EDGE CYBERSECURITY SOLUTIONS TO DRIVE GROWTH
    8.3 NAVY 
           8.3.1 NEED FOR CRITICAL NAVAL SYSTEMS TO DRIVE GROWTH
    8.4 AIR FORCE 
           8.4.1 RAPID ADOPTION OF ADVANCED TECHNOLOGIES TO DRIVE GROWTH
 
9 DEFENSE CYBERSECURITY MARKET, BY OFFERING (Page No. - 98)
    9.1 INTRODUCTION 
           FIGURE 33 DEFENSE CYBERSECURITY MARKET, BY OFFERING, 2023–2028
           TABLE 20 DEFENSE CYBERSECURITY MARKET, BY OFFERING, 2019–2022 (USD MILLION)
           TABLE 21 DEFENSE CYBERSECURITY MARKET, BY OFFERING, 2023–2028 (USD MILLION)
    9.2 HARDWARE 
           9.2.1 NEED FOR TANGIBLE DEFENSE AGAINST CYBER THREATS TO DRIVE GROWTH
    9.3 SOFTWARE AND SERVICE 
           9.3.1 INCREASING RELIANCE ON DIGITAL TECHNOLOGIES TO DRIVE GROWTH
 
10 DEFENSE CYBERSECURITY MARKET, BY APPLICATION (Page No. - 101)
     10.1 INTRODUCTION 
     10.2 CRITICAL INFRASTRUCTURE PROTECTION 
     10.3 DATA PROTECTION AND ENCRYPTION 
     10.4 INCIDENT RESPONSE AND FORENSICS 
     10.5 IDENTITY AND ACCESS MANAGEMENT 
     10.6 SECURE COMMUNICATIONS SYSTEM 
 
11 DEFENSE CYBERSECURITY MARKET, BY REGION (Page No. - 104)
     11.1 INTRODUCTION 
             FIGURE 34 DEFENSE CYBERSECURITY MARKET, BY REGION, 2023–2028
     11.2 REGIONAL RECESSION IMPACT ANALYSIS 
             TABLE 22 REGIONAL RECESSION IMPACT ANALYSIS
             TABLE 23 DEFENSE CYBERSECURITY MARKET, BY REGION, 2019–2022 (USD MILLION)
             TABLE 24 DEFENSE CYBERSECURITY MARKET, BY REGION, 2023–2028 (USD MILLION)
     11.3 NORTH AMERICA 
             11.3.1 PESTLE ANALYSIS
                        11.3.1.1 Political
                        11.3.1.2 Economic
                        11.3.1.3 Social
                        11.3.1.4 Technological
                        11.3.1.5 Legal
                        11.3.1.6 Environmental
             11.3.2 RECESSION IMPACT ANALYSIS
                        FIGURE 35 NORTH AMERICA: DEFENSE CYBERSECURITY MARKET SNAPSHOT
                        TABLE 25 NORTH AMERICA: DEFENSE CYBERSECURITY MARKET, BY COUNTRY, 2019–2022 (USD MILLION)
                        TABLE 26 NORTH AMERICA: DEFENSE CYBERSECURITY MARKET, BY COUNTRY, 2023–2028 (USD MILLION)
                        TABLE 27 NORTH AMERICA: DEFENSE CYBERSECURITY MARKET, BY SECURITY TYPE, 2019–2022 (USD MILLION)
                        TABLE 28 NORTH AMERICA: DEFENSE CYBERSECURITY MARKET, BY SECURITY TYPE, 2023–2028 (USD MILLION)
                        TABLE 29 NORTH AMERICA: DEFENSE CYBERSECURITY MARKET, BY OFFERING, 2019–2022 (USD MILLION)
                        TABLE 30 NORTH AMERICA: DEFENSE CYBERSECURITY MARKET, BY OFFERING, 2023–2028 (USD MILLION)
                        TABLE 31 NORTH AMERICA: DEFENSE CYBERSECURITY MARKET, BY END USER, 2019–2022 (USD MILLION)
                        TABLE 32 NORTH AMERICA: DEFENSE CYBERSECURITY MARKET, BY END USER, 2023–2028 (USD MILLION)
             11.3.3 US
                        11.3.3.1 Increasing investments in cybersecurity for defense applications to drive growth
                                     TABLE 33 US: DEFENSE CYBERSECURITY MARKET, BY SECURITY TYPE, 2019–2022 (USD MILLION)
                                     TABLE 34 US: DEFENSE CYBERSECURITY MARKET, BY SECURITY TYPE, 2023–2028 (USD MILLION)
                                     TABLE 35 US: DEFENSE CYBERSECURITY MARKET, BY OFFERING, 2019–2022 (USD MILLION)
                                     TABLE 36 US: DEFENSE CYBERSECURITY MARKET, BY OFFERING, 2023–2028 (USD MILLION)
                                     TABLE 37 US: DEFENSE CYBERSECURITY MARKET, BY END USER, 2019–2022 (USD MILLION)
                                     TABLE 38 US: DEFENSE CYBERSECURITY MARKET, BY END USER, 2023–2028 (USD MILLION)
             11.3.4 CANADA
                        11.3.4.1 Rising exports of cybersecurity solutions to drive growth
                                     TABLE 39 CANADA: DEFENSE CYBERSECURITY MARKET, BY SECURITY TYPE, 2019–2022 (USD MILLION)
                                     TABLE 40 CANADA: DEFENSE CYBERSECURITY MARKET, BY SECURITY TYPE, 2023–2028 (USD MILLION)
                                     TABLE 41 CANADA: DEFENSE CYBERSECURITY MARKET, BY OFFERING, 2019–2022 (USD MILLION)
                                     TABLE 42 CANADA: DEFENSE CYBERSECURITY MARKET, BY OFFERING, 2023–2028 (USD MILLION)
                                     TABLE 43 CANADA: DEFENSE CYBERSECURITY MARKET, BY END USER, 2019–2022 (USD MILLION)
                                     TABLE 44 CANADA: DEFENSE CYBERSECURITY MARKET, BY END USER, 2023–2028 (USD MILLION)
     11.4 EUROPE 
             11.4.1 PESTLE ANALYSIS
                        11.4.1.1 Political
                        11.4.1.2 Economic
                        11.4.1.3 Social
                        11.4.1.4 Technological
                        11.4.1.5 Legal
                        11.4.1.6 Environmental
             11.4.2 RECESSION IMPACT ANALYSIS
                        FIGURE 36 EUROPE: DEFENSE CYBERSECURITY MARKET SNAPSHOT
                        TABLE 45 EUROPE: DEFENSE CYBERSECURITY MARKET, BY COUNTRY, 2019–2022 (USD MILLION)
                        TABLE 46 EUROPE: DEFENSE CYBERSECURITY MARKET, BY COUNTRY, 2023–2028 (USD MILLION)
                        TABLE 47 EUROPE: DEFENSE CYBERSECURITY MARKET, BY SECURITY TYPE, 2019–2022 (USD MILLION)
                        TABLE 48 EUROPE: DEFENSE CYBERSECURITY MARKET, BY SECURITY TYPE, 2023–2028 (USD MILLION)
                        TABLE 49 EUROPE: DEFENSE CYBERSECURITY MARKET, BY OFFERING, 2019–2022 (USD MILLION)
                        TABLE 50 EUROPE: DEFENSE CYBERSECURITY MARKET, BY OFFERING, 2023–2028 (USD MILLION)
                        TABLE 51 EUROPE: DEFENSE CYBERSECURITY MARKET, BY END USER, 2019–2022 (USD MILLION)
                        TABLE 52 EUROPE: DEFENSE CYBERSECURITY MARKET, BY END USER, 2023–2028 (USD MILLION)
             11.4.3 UK
                        11.4.3.1 Rising threat of cyberattacks to drive growth
                                     TABLE 53 UK: DEFENSE CYBERSECURITY MARKET, BY SECURITY TYPE, 2019–2022 (USD MILLION)
                                     TABLE 54 UK: DEFENSE CYBERSECURITY MARKET, BY SECURITY TYPE, 2023–2028 (USD MILLION)
                                     TABLE 55 UK: DEFENSE CYBERSECURITY MARKET, BY OFFERING, 2019–2022 (USD MILLION)
                                     TABLE 56 UK: DEFENSE CYBERSECURITY MARKET, BY OFFERING, 2023–2028 (USD MILLION)
                                     TABLE 57 UK: DEFENSE CYBERSECURITY MARKET, BY END USER, 2019–2022 (USD MILLION)
                                     TABLE 58 UK: DEFENSE CYBERSECURITY MARKET, BY END USER, 2023–2028 (USD MILLION)
             11.4.4 FRANCE
                        11.4.4.1 Emphasis on cyber defense to drive growth
                                     TABLE 59 FRANCE: DEFENSE CYBERSECURITY MARKET, BY SECURITY TYPE, 2019–2022 (USD MILLION)
                                     TABLE 60 FRANCE: DEFENSE CYBERSECURITY MARKET, BY SECURITY TYPE, 2023–2028 (USD MILLION)
                                     TABLE 61 FRANCE: DEFENSE CYBERSECURITY MARKET, BY OFFERING, 2019–2022 (USD MILLION)
                                     TABLE 62 FRANCE: DEFENSE CYBERSECURITY MARKET, BY OFFERING, 2023–2028 (USD MILLION)
                                     TABLE 63 FRANCE: DEFENSE CYBERSECURITY MARKET, BY END USER, 2019–2022 (USD MILLION)
                                     TABLE 64 FRANCE: DEFENSE CYBERSECURITY MARKET, BY END USER, 2023–2028 (USD MILLION)
             11.4.5 GERMANY
                        11.4.5.1 Development of new branches of Armed Forces to drive growth
                                     TABLE 65 GERMANY: DEFENSE CYBERSECURITY MARKET, BY SECURITY TYPE, 2019–2022 (USD MILLION)
                                     TABLE 66 GERMANY: DEFENSE CYBERSECURITY MARKET, BY SECURITY TYPE, 2023–2028 (USD MILLION)
                                     TABLE 67 GERMANY: DEFENSE CYBERSECURITY MARKET, BY OFFERING, 2019–2022 (USD MILLION)
                                     TABLE 68 GERMANY: DEFENSE CYBERSECURITY MARKET, BY OFFERING, 2023–2028 (USD MILLION)
                                     TABLE 69 GERMANY: DEFENSE CYBERSECURITY MARKET, BY END USER, 2019–2022 (USD MILLION)
                                     TABLE 70 GERMANY: DEFENSE CYBERSECURITY MARKET, BY END USER, 2023–2028 (USD MILLION)
             11.4.6 REST OF EUROPE
                        TABLE 71 REST OF EUROPE: DEFENSE CYBERSECURITY MARKET, BY SECURITY TYPE, 2019–2022 (USD MILLION)
                        TABLE 72 REST OF EUROPE: DEFENSE CYBERSECURITY MARKET, BY SECURITY TYPE, 2023–2028 (USD MILLION)
                        TABLE 73 REST OF EUROPE: DEFENSE CYBERSECURITY MARKET, BY OFFERING, 2019–2022 (USD MILLION)
                        TABLE 74 REST OF EUROPE: DEFENSE CYBERSECURITY MARKET, BY OFFERING, 2023–2028 (USD MILLION)
                        TABLE 75 REST OF EUROPE: DEFENSE CYBERSECURITY MARKET, BY END USER, 2019–2022 (USD MILLION)
                        TABLE 76 REST OF EUROPE: DEFENSE CYBERSECURITY MARKET, BY END USER, 2023–2028 (USD MILLION)
     11.5 ASIA PACIFIC 
             11.5.1 PESTLE ANALYSIS
                        11.5.1.1 Political
                        11.5.1.2 Economic
                        11.5.1.3 Social
                        11.5.1.4 Technological
                        11.5.1.5 Legal
                        11.5.1.6 Environmental
             11.5.2 RECESSION IMPACT ANALYSIS
                        FIGURE 37 ASIA PACIFIC: DEFENSE CYBERSECURITY MARKET SNAPSHOT
                        TABLE 77 ASIA PACIFIC: DEFENSE CYBERSECURITY MARKET, BY COUNTRY, 2019–2022 (USD MILLION)
                        TABLE 78 ASIA PACIFIC: DEFENSE CYBERSECURITY MARKET, BY COUNTRY, 2023–2028 (USD MILLION)
                        TABLE 79 ASIA PACIFIC: DEFENSE CYBERSECURITY MARKET, BY SECURITY TYPE, 2019–2022 (USD MILLION)
                        TABLE 80 ASIA PACIFIC: DEFENSE CYBERSECURITY MARKET, BY SECURITY TYPE, 2023–2028 (USD MILLION)
                        TABLE 81 ASIA PACIFIC: DEFENSE CYBERSECURITY MARKET, BY OFFERING, 2019–2022 (USD MILLION)
                        TABLE 82 ASIA PACIFIC: DEFENSE CYBERSECURITY MARKET, BY OFFERING, 2023–2028 (USD MILLION)
                        TABLE 83 ASIA PACIFIC: DEFENSE CYBERSECURITY MARKET, BY END USER, 2019–2022 (USD MILLION)
                        TABLE 84 ASIA PACIFIC: DEFENSE CYBERSECURITY MARKET, BY END USER, 2023–2028 (USD MILLION)
             11.5.3 CHINA
                        11.5.3.1 Expansion of domestic companies providing cybersecurity solutions to drive growth
                                     TABLE 85 CHINA: DEFENSE CYBERSECURITY MARKET, BY SECURITY TYPE, 2019–2022 (USD MILLION)
                                     TABLE 86 CHINA: DEFENSE CYBERSECURITY MARKET, BY SECURITY TYPE, 2023–2028 (USD MILLION)
                                     TABLE 87 CHINA: DEFENSE CYBERSECURITY MARKET, BY OFFERING, 2019–2022 (USD MILLION)
                                     TABLE 88 CHINA: DEFENSE CYBERSECURITY MARKET, BY OFFERING, 2023–2028 (USD MILLION)
                                     TABLE 89 CHINA: DEFENSE CYBERSECURITY MARKET, BY END USER, 2019–2022 (USD MILLION)
                                     TABLE 90 CHINA: DEFENSE CYBERSECURITY MARKET, BY END USER, 2023–2028 (USD MILLION)
             11.5.4 JAPAN
                        11.5.4.1 Focus on acquisition and training of human resources for cybersecurity to drive growth
                                     TABLE 91 JAPAN: DEFENSE CYBERSECURITY MARKET, BY SECURITY TYPE, 2019–2022 (USD MILLION)
                                     TABLE 92 JAPAN: DEFENSE CYBERSECURITY MARKET, BY SECURITY TYPE, 2023–2028 (USD MILLION)
                                     TABLE 93 JAPAN: DEFENSE CYBERSECURITY MARKET, BY OFFERING, 2019–2022 (USD MILLION)
                                     TABLE 94 JAPAN: DEFENSE CYBERSECURITY MARKET, BY OFFERING, 2023–2028 (USD MILLION)
                                     TABLE 95 JAPAN: DEFENSE CYBERSECURITY MARKET, BY END USER, 2019–2022 (USD MILLION)
                                     TABLE 96 JAPAN: DEFENSE CYBERSECURITY MARKET, BY END USER, 2023–2028 (USD MILLION)
             11.5.5 INDIA
                        11.5.5.1 Emphasis on indigenous development of cybersecurity technologies to drive growth
                                     TABLE 97 INDIA: DEFENSE CYBERSECURITY MARKET, BY SECURITY TYPE, 2019–2022 (USD MILLION)
                                     TABLE 98 INDIA: DEFENSE CYBERSECURITY MARKET, BY SECURITY TYPE, 2023–2028 (USD MILLION)
                                     TABLE 99 INDIA: DEFENSE CYBERSECURITY MARKET, BY OFFERING, 2019–2022 (USD MILLION)
                                     TABLE 100 INDIA: DEFENSE CYBERSECURITY MARKET, BY OFFERING, 2023–2028 (USD MILLION)
                                     TABLE 101 INDIA: DEFENSE CYBERSECURITY MARKET, BY END USER, 2019–2022 (USD MILLION)
                                     TABLE 102 INDIA: DEFENSE CYBERSECURITY MARKET, BY END USER, 2023–2028 (USD MILLION)
             11.5.6 REST OF ASIA PACIFIC
                        TABLE 103 REST OF ASIA PACIFIC: DEFENSE CYBERSECURITY MARKET, BY SECURITY TYPE, 2019–2022 (USD MILLION)
                        TABLE 104 REST OF ASIA PACIFIC: DEFENSE CYBERSECURITY MARKET, BY SECURITY TYPE, 2023–2028 (USD MILLION)
                        TABLE 105 REST OF ASIA PACIFIC: DEFENSE CYBERSECURITY MARKET, BY OFFERING, 2019–2022 (USD MILLION)
                        TABLE 106 REST OF ASIA PACIFIC: DEFENSE CYBERSECURITY MARKET, BY OFFERING, 2023–2028 (USD MILLION)
                        TABLE 107 REST OF ASIA PACIFIC: DEFENSE CYBERSECURITY MARKET, BY END USER, 2019–2022 (USD MILLION)
                        TABLE 108 REST OF ASIA PACIFIC: DEFENSE CYBERSECURITY MARKET, BY END USER, 2023–2028 (USD MILLION)
     11.6 MIDDLE EAST 
             11.6.1 PESTLE ANALYSIS
                        11.6.1.1 Political
                        11.6.1.2 Economic
                        11.6.1.3 Social
                        11.6.1.4 Technological
                        11.6.1.5 Legal
                        11.6.1.6 Environmental
             11.6.2 RECESSION IMPACT ANALYSIS
                        FIGURE 38 MIDDLE EAST: DEFENSE CYBERSECURITY MARKET SNAPSHOT
                        TABLE 109 MIDDLE EAST: DEFENSE CYBERSECURITY MARKET, BY COUNTRY, 2019–2022 (USD MILLION)
                        TABLE 110 MIDDLE EAST: DEFENSE CYBERSECURITY MARKET, BY COUNTRY, 2023–2028 (USD MILLION)
                        TABLE 111 MIDDLE EAST: DEFENSE CYBERSECURITY MARKET, BY SECURITY TYPE, 2019–2022 (USD MILLION)
                        TABLE 112 MIDDLE EAST: DEFENSE CYBERSECURITY MARKET, BY SECURITY TYPE, 2023–2028 (USD MILLION)
                        TABLE 113 MIDDLE EAST: DEFENSE CYBERSECURITY MARKET, BY OFFERING, 2019–2022 (USD MILLION)
                        TABLE 114 MIDDLE EAST: DEFENSE CYBERSECURITY MARKET, BY OFFERING, 2023–2028 (USD MILLION)
                        TABLE 115 MIDDLE EAST: DEFENSE CYBERSECURITY MARKET, BY END USER, 2019–2022 (USD MILLION)
                        TABLE 116 MIDDLE EAST: DEFENSE CYBERSECURITY MARKET, BY END USER, 2023–2028 (USD MILLION)
             11.6.3 SAUDI ARABIA
                        11.6.3.1 Boost in budgetary allocations for cybersecurity to drive growth
                                     TABLE 117 SAUDI ARABIA: DEFENSE CYBERSECURITY MARKET, BY SECURITY TYPE, 2019–2022 (USD MILLION)
                                     TABLE 118 SAUDI ARABIA: DEFENSE CYBERSECURITY MARKET, BY SECURITY TYPE, 2023–2028 (USD MILLION)
                                     TABLE 119 SAUDI ARABIA: DEFENSE CYBERSECURITY MARKET, BY OFFERING, 2019–2022 (USD MILLION)
                                     TABLE 120 SAUDI ARABIA: DEFENSE CYBERSECURITY MARKET, BY OFFERING, 2023–2028 (USD MILLION)
                                     TABLE 121 SAUDI ARABIA: DEFENSE CYBERSECURITY MARKET, BY END USER, 2019–2022 (USD MILLION)
                                     TABLE 122 SAUDI ARABIA: DEFENSE CYBERSECURITY MARKET, BY END USER, 2023–2028 (USD MILLION)
             11.6.4 UAE
                        11.6.4.1 Development of new cybersecurity programs to drive growth
                                     TABLE 123 UAE: DEFENSE CYBERSECURITY MARKET, BY SECURITY TYPE, 2019–2022 (USD MILLION)
                                     TABLE 124 UAE: DEFENSE CYBERSECURITY MARKET, BY SECURITY TYPE, 2023–2028 (USD MILLION)
                                     TABLE 125 UAE: DEFENSE CYBERSECURITY MARKET, BY OFFERING, 2019–2022 (USD MILLION)
                                     TABLE 126 UAE: DEFENSE CYBERSECURITY MARKET, BY OFFERING, 2023–2028 (USD MILLION)
                                     TABLE 127 UAE: DEFENSE CYBERSECURITY MARKET, BY END USER, 2019–2022 (USD MILLION)
                                     TABLE 128 UAE: DEFENSE CYBERSECURITY MARKET, BY END USER, 2023–2028 (USD MILLION)
             11.6.5 REST OF MIDDLE EAST
                        TABLE 129 REST OF MIDDLE EAST: DEFENSE CYBERSECURITY MARKET, BY SECURITY TYPE, 2019–2022 (USD MILLION)
                        TABLE 130 REST OF MIDDLE EAST: DEFENSE CYBERSECURITY MARKET, BY SECURITY TYPE, 2023–2028 (USD MILLION)
                        TABLE 131 REST OF MIDDLE EAST: DEFENSE CYBERSECURITY MARKET, BY OFFERING, 2019–2022 (USD MILLION)
                        TABLE 132 REST OF MIDDLE EAST: DEFENSE CYBERSECURITY MARKET, BY OFFERING, 2023–2028 (USD MILLION)
                        TABLE 133 REST OF MIDDLE EAST: DEFENSE CYBERSECURITY MARKET, BY END USER, 2019–2022 (USD MILLION)
                        TABLE 134 REST OF MIDDLE EAST: DEFENSE CYBERSECURITY MARKET, BY END USER, 2023–2028 (USD MILLION)
     11.7 REST OF THE WORLD 
             TABLE 135 REST OF THE WORLD: DEFENSE CYBERSECURITY MARKET, BY REGION, 2019–2022 (USD MILLION)
             TABLE 136 REST OF THE WORLD: DEFENSE CYBERSECURITY MARKET, BY REGION, 2023–2028 (USD MILLION)
             TABLE 137 REST OF THE WORLD: DEFENSE CYBERSECURITY MARKET, BY SECURITY TYPE, 2019–2022 (USD MILLION)
             TABLE 138 REST OF THE WORLD: DEFENSE CYBERSECURITY MARKET, BY SECURITY TYPE, 2023–2028 (USD MILLION)
             TABLE 139 REST OF THE WORLD: DEFENSE CYBERSECURITY MARKET, BY OFFERING, 2019–2022 (USD MILLION)
             TABLE 140 REST OF THE WORLD: DEFENSE CYBERSECURITY MARKET, BY OFFERING, 2023–2028 (USD MILLION)
             TABLE 141 REST OF THE WORLD: DEFENSE CYBERSECURITY MARKET, BY END USER, 2019–2022 (USD MILLION)
             TABLE 142 REST OF THE WORLD: DEFENSE CYBERSECURITY MARKET, BY END USER, 2023–2028 (USD MILLION)
             11.7.1 LATIN AMERICA
                        11.7.1.1 Implementation of comprehensive national cybersecurity strategies to drive growth
                                     TABLE 143 LATIN AMERICA: DEFENSE CYBERSECURITY MARKET, BY SECURITY TYPE, 2019–2022 (USD MILLION)
                                     TABLE 144 LATIN AMERICA: DEFENSE CYBERSECURITY MARKET, BY SECURITY TYPE, 2023–2028 (USD MILLION)
                                     TABLE 145 LATIN AMERICA: DEFENSE CYBERSECURITY MARKET, BY OFFERING, 2019–2022 (USD MILLION)
                                     TABLE 146 LATIN AMERICA: DEFENSE CYBERSECURITY MARKET, BY OFFERING, 2023–2028 (USD MILLION)
                                     TABLE 147 LATIN AMERICA: DEFENSE CYBERSECURITY MARKET, BY END USER, 2019–2022 (USD MILLION)
                                     TABLE 148 LATIN AMERICA: DEFENSE CYBERSECURITY MARKET, BY END USER, 2023–2028 (USD MILLION)
             11.7.2 AFRICA
                        11.7.2.1 Improvements in digital infrastructure to drive growth
                                     TABLE 149 AFRICA: DEFENSE CYBERSECURITY MARKET, BY SECURITY TYPE, 2019–2022 (USD MILLION)
                                     TABLE 150 AFRICA: DEFENSE CYBERSECURITY MARKET, BY SECURITY TYPE, 2023–2028 (USD MILLION)
                                     TABLE 151 AFRICA: DEFENSE CYBERSECURITY MARKET, BY OFFERING, 2019–2022 (USD MILLION)
                                     TABLE 152 AFRICA: DEFENSE CYBERSECURITY MARKET, BY OFFERING, 2023–2028 (USD MILLION)
                                     TABLE 153 AFRICA: DEFENSE CYBERSECURITY MARKET, BY END USER, 2019–2022 (USD MILLION)
                                     TABLE 154 AFRICA: DEFENSE CYBERSECURITY MARKET, BY END USER, 2023–2028 (USD MILLION)
 
12 COMPETITIVE LANDSCAPE (Page No. - 159)
     12.1 INTRODUCTION 
     12.2 STRATEGIES ADOPTED BY KEY PLAYERS 
             TABLE 155 STRATEGIES ADOPTED BY KEY PLAYERS IN DEFENSE CYBERSECURITY MARKET
     12.3 MARKET SHARE ANALYSIS, 2022 
             FIGURE 39 MARKET SHARE OF KEY PLAYERS, 2022
             TABLE 156 DEFENSE CYBERSECURITY MARKET: DEGREE OF COMPETITION
     12.4 RANKING ANALYSIS, 2022 
             FIGURE 40 MARKET RANKING OF KEY PLAYERS, 2022
     12.5 REVENUE ANALYSIS, 2019–2022 
             FIGURE 41 REVENUE ANALYSIS OF KEY PLAYERS, 2019–2022 (USD MILLION)
     12.6 COMPANY EVALUATION MATRIX, 2022 
             12.6.1 STARS
             12.6.2 EMERGING LEADERS
             12.6.3 PERVASIVE PLAYERS
             12.6.4 PARTICIPANTS
                        FIGURE 42 COMPANY EVALUATION MATRIX, 2022
             12.6.5 COMPANY FOOTPRINT
                        FIGURE 43 COMPANY FOOTPRINT
                        TABLE 157 SECURITY TYPE FOOTPRINT
                        TABLE 158 OFFERING FOOTPRINT
                        TABLE 159 REGION FOOTPRINT
     12.7 START-UP/SME EVALUATION MATRIX, 2022 
             12.7.1 PROGRESSIVE COMPANIES
             12.7.2 RESPONSIVE COMPANIES
             12.7.3 DYNAMIC COMPANIES
             12.7.4 STARTING BLOCKS
                        FIGURE 44 START-UP/SME EVALUATION MATRIX, 2022
             12.7.5 COMPETITIVE BENCHMARKING
                        TABLE 160 KEY START-UPS/SMES
                        TABLE 161 COMPETITIVE BENCHMARKING OF KEY START-UPS/SMES
     12.8 COMPETITIVE SCENARIO 
             12.8.1 PRODUCT LAUNCHES
                        TABLE 162 PRODUCT LAUNCHES, 2020–2023
             12.8.2 DEALS
                        TABLE 163 DEALS, 2020–2023
 
13 COMPANY PROFILES (Page No. - 179)
(Business Overview, Products/Solutions/Services Offered, Recent Developments, and MnM View (Key strengths/Right to Win, Strategic Choices Made, and Weaknesses and Competitive Threats))*  
     13.1 KEY PLAYERS 
             13.1.1 BOOZ ALLEN HAMILTON INC.
                        TABLE 164 BOOZ ALLEN HAMILTON INC.: COMPANY OVERVIEW
                        FIGURE 45 BOOZ ALLEN HAMILTON INC.: COMPANY SNAPSHOT
                        TABLE 165 BOOZ ALLEN HAMILTON INC.: PRODUCTS/SOLUTIONS/SERVICES OFFERED
                        TABLE 166 BOOZ ALLEN HAMILTON INC.: DEALS
             13.1.2 GENERAL DYNAMICS CORPORATION
                        TABLE 167 GENERAL DYNAMICS CORPORATION: COMPANY OVERVIEW
                        FIGURE 46 GENERAL DYNAMICS CORPORATION: COMPANY SNAPSHOT
                        TABLE 168 GENERAL DYNAMICS CORPORATION: PRODUCTS/SOLUTIONS/SERVICES OFFERED
                        TABLE 169 GENERAL DYNAMICS CORPORATION: DEALS
             13.1.3 CISCO SYSTEMS, INC.
                        TABLE 170 CISCO SYSTEMS, INC.: COMPANY OVERVIEW
                        FIGURE 47 CISCO SYSTEMS, INC.: COMPANY SNAPSHOT
                        TABLE 171 CISCO SYSTEMS, INC.: PRODUCTS/SOLUTIONS/SERVICES OFFERED
                        TABLE 172 CISCO SYSTEMS, INC.: PRODUCT LAUNCHES
                        TABLE 173 CISCO SYSTEMS, INC.: DEALS
             13.1.4 MICROSOFT
                        TABLE 174 MICROSOFT: COMPANY OVERVIEW
                        FIGURE 48 MICROSOFT: COMPANY SNAPSHOT
                        TABLE 175 MICROSOFT: PRODUCTS/SOLUTIONS/SERVICES OFFERED
                        TABLE 176 MICROSOFT: DEALS
             13.1.5 LEIDOS
                        TABLE 177 LEIDOS: COMPANY OVERVIEW
                        FIGURE 49 LEIDOS: COMPANY SNAPSHOT
                        TABLE 178 LEIDOS: PRODUCTS/SOLUTIONS/SERVICES OFFERED
                        TABLE 179 LEIDOS: DEALS
             13.1.6 IBM
                        TABLE 180 IBM: COMPANY OVERVIEW
                        FIGURE 50 IBM: COMPANY SNAPSHOT
                        TABLE 181 IBM: PRODUCTS/SOLUTIONS/SERVICES OFFERED
                        TABLE 182 IBM: PRODUCT LAUNCHES
                        TABLE 183 IBM: DEALS
             13.1.7 THALES
                        TABLE 184 THALES: COMPANY OVERVIEW
                        FIGURE 51 THALES: COMPANY SNAPSHOT
                        TABLE 185 THALES: PRODUCTS/SOLUTIONS/SERVICES OFFERED
                        TABLE 186 THALES: DEALS
             13.1.8 LOCKHEED MARTIN CORPORATION
                        TABLE 187 LOCKHEED MARTIN CORPORATION: COMPANY OVERVIEW
                        FIGURE 52 LOCKHEED MARTIN CORPORATION: COMPANY SNAPSHOT
                        TABLE 188 LOCKHEED MARTIN CORPORATION: PRODUCTS/SOLUTIONS/SERVICES OFFERED
                        TABLE 189 LOCKHEED MARTIN CORPORATION: DEALS
             13.1.9 NORTHROP GRUMMAN
                        TABLE 190 NORTHROP GRUMMAN: COMPANY OVERVIEW
                        FIGURE 53 NORTHROP GRUMMAN: COMPANY SNAPSHOT
                        TABLE 191 NORTHROP GRUMMAN: PRODUCTS/SOLUTIONS/SERVICES OFFERED
             13.1.10 RAYTHEON TECHNOLOGIES
                        TABLE 192 RAYTHEON TECHNOLOGIES: COMPANY OVERVIEW
                        FIGURE 54 RAYTHEON TECHNOLOGIES: COMPANY SNAPSHOT
                        TABLE 193 RAYTHEON TECHNOLOGIES: PRODUCTS/SOLUTIONS/SERVICES OFFERED
             13.1.11 L3HARRIS TECHNOLOGIES, INC.
                        TABLE 194 L3HARRIS TECHNOLOGIES, INC.: COMPANY OVERVIEW
                        FIGURE 55 L3HARRIS TECHNOLOGIES, INC.: COMPANY SNAPSHOT
                        TABLE 195 L3HARRIS TECHNOLOGIES, INC.: PRODUCTS/SOLUTIONS/SERVICES OFFERED
             13.1.12 LEONARDO S.P.A.
                        TABLE 196 LEONARDO S.P.A.: COMPANY OVERVIEW
                        FIGURE 56 LEONARDO S.P.A.: COMPANY SNAPSHOT
                        TABLE 197 LEONARDO S.P.A.: PRODUCTS/SOLUTIONS/SERVICES OFFERED
                        TABLE 198 LEONARDO S.P.A.: DEALS
             13.1.13 CACI INTERNATIONAL INC
                        TABLE 199 CACI INTERNATIONAL INC: COMPANY OVERVIEW
                        FIGURE 57 CACI INTERNATIONAL INC: COMPANY SNAPSHOT
                        TABLE 200 CACI INTERNATIONAL INC: PRODUCTS/SOLUTIONS/SERVICES OFFERED
                        TABLE 201 CACI INTERNATIONAL INC: DEALS
             13.1.14 ELBIT SYSTEMS LTD.
                        TABLE 202 ELBIT SYSTEMS LTD.: COMPANY OVERVIEW
                        FIGURE 58 ELBIT SYSTEMS LTD.: COMPANY SNAPSHOT
                        TABLE 203 ELBIT SYSTEMS LTD.: PRODUCTS/SOLUTIONS/SERVICES OFFERED
             13.1.15 BAE SYSTEMS
                        TABLE 204 BAE SYSTEMS: COMPANY OVERVIEW
                        FIGURE 59 BAE SYSTEMS: COMPANY SNAPSHOT
                        TABLE 205 BAE SYSTEMS: PRODUCTS/SOLUTIONS/SERVICES OFFERED
                        TABLE 206 BAE SYSTEMS: DEALS
             13.1.16 SAIC
                        TABLE 207 SAIC: COMPANY OVERVIEW
                        FIGURE 60 SAIC: COMPANY SNAPSHOT
                        TABLE 208 SAIC: PRODUCTS/SOLUTIONS/SERVICES OFFERED
             13.1.17 ASGN INCORPORATED
                        TABLE 209 ASGN INCORPORATED: COMPANY OVERVIEW
                        FIGURE 61 ASGN INCORPORATED: COMPANY SNAPSHOT
                        TABLE 210 ASGN INCORPORATED: PRODUCTS/SOLUTIONS/SERVICES OFFERED
                        TABLE 211 ASGN INCORPORATED: DEALS
             13.1.18 AT&T
                        TABLE 212 AT&T: COMPANY OVERVIEW
                        FIGURE 62 AT&T: COMPANY SNAPSHOT
                        TABLE 213 AT&T: PRODUCTS/SOLUTIONS/SERVICES OFFERED
     13.2 OTHER PLAYERS 
             13.2.1 ECHELON SERVICES
                        TABLE 214 ECHELON SERVICES: COMPANY OVERVIEW
             13.2.2 FIVE STONES RESEARCH CORPORATION
                        TABLE 215 FIVE STONES RESEARCH CORPORATION: COMPANY OVERVIEW
             13.2.3 RITE-SOLUTIONS, INC.
                        TABLE 216 RITE-SOLUTIONS, INC.: COMPANY OVERVIEW
             13.2.4 SEALING TECHNOLOGIES
                        TABLE 217 SEALING TECHNOLOGIES: COMPANY OVERVIEW
             13.2.5 AXELLIO
                        TABLE 218 AXELLIO: COMPANY OVERVIEW
             13.2.6 HUB SECURITY
                        TABLE 219 HUB SECURITY: COMPANY OVERVIEW
             13.2.7 COUNTERCRAFT
                        TABLE 220 COUNTERCRAFT: COMPANY OVERVIEW
 
14 APPENDIX (Page No. - 233)
     14.1 DISCUSSION GUIDE 
     14.2 KNOWLEDGESTORE: MARKETSANDMARKETS’ SUBSCRIPTION PORTAL 
     14.3 CUSTOMIZATION OPTIONS 
     14.4 RELATED REPORTS 
     14.5 AUTHOR DETAILS 


This research study involved the extensive use of secondary sources, directories, and databases, such as the Stockholm International Peace Research Institute (SIPRI), Department of Defense (DoD), UN Comtrade, Organization for Economic Cooperation and Development (OECD), and Factiva, to identify and collect relevant information on the defense cybersecurity market. Primary sources included industry experts from the concerned market, preferred suppliers, manufacturers, solution providers, technology developers, alliances, and organizations related to all segments of the value chain. All primary sources were interviewed to obtain and verify critical qualitative and quantitative information as well as assess the prospects of the market.

In-depth interviews were conducted with various primary respondents, including key industry participants, subject-matter experts, C-level executives of key market players, and industry consultants, among others, to obtain and verify critical qualitative and quantitative information and to assess future prospects of the market.

Secondary Research

The market share of companies in the defense cybersecurity market was determined using secondary data made available through paid and unpaid sources and by analyzing product portfolios of major companies operating in the market. These companies were rated based on the performance and quality of their products. These data points were further validated by primary sources.

Secondary sources that were referred to for this research study on the defense cybersecurity market included government sources such as the US Department of Defense (DoD), defense budgets, military modernization program documents, corporate filings such as annual reports, investor presentations, and financial statements, and trade, business, and professional associations. This secondary data was collected and analyzed to arrive at the overall size of the rockets and missiles market, which was further validated by primary respondents.

Secondary research was primarily used to obtain critical information about the value and supply chain of the market. It was also used to identify key players by various products, market classifications, and segmentation per their offerings. Secondary information helps understand industry trends related to defense cybersecurity offering, application, security type, end user and regions, and developments from the market and technology-oriented perspectives.

Primary Research

In the primary research process, various sources from the supply and demand sides were interviewed to obtain qualitative and quantitative information on the market. Primary sources from the supply side included industry experts such as vice presidents, directors from business development, marketing, and product development/innovation teams, related key executives from the cyber industry, defense cybersecurity solution providers, integrators, and key opinion leaders.  Extensive primary research was conducted after obtaining information about the current scenario of the defense cybersecurity market through secondary research. Several primary interviews were conducted with the market experts from the demand and supply sides across major countries of North America, Europe, Asia Pacific, the Middle East, and Rest of the World (RoW).

This primary data was collected through questionnaires, emails, and telephonic interviews.
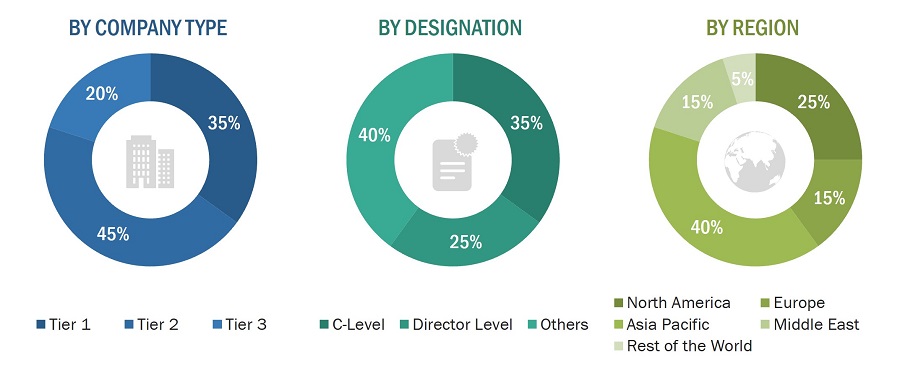
Defense Cybersecurity Market Size, and Share

To know about the assumptions considered for the study, download the pdf brochure

Market Size Estimation

Both the top-down and bottom-up approaches were used to estimate and validate the size of the defense cybersecurity market. The following figure represents the overall market size estimation process employed for this study on the market.

The research methodology used to estimate the market size included the following details:

  • Secondary research identified key players in the defense cybersecurity market, and their market share was determined through primary and secondary research. This included a study of annual and financial reports of top market players and extensive interviews of leaders such as CEOs, directors, and marketing executives of leading companies operating in the market.
  • All percentage shares, splits, and breakdowns were determined using secondary sources and verified through primary sources.
  • All possible parameters that affect the markets covered in this research study were accounted for, viewed in extensive detail, verified through primary research, and analyzed to obtain the final quantitative and qualitative data on the rocket and missile market.

This data was consolidated, enhanced with detailed inputs, analyzed by MarketsandMarkets, and presented in this report.

Bottom-Up Approach

The study analyzed the defense cybersecurity programs of multiple countries to understand various schemes and funding allocations for defense cybersecurity. After this, each program and its spending on procurement were tracked. For example, Booz Allen Hamilton Inc. (US) received an investment worth USD 1.86 Billion for the development of Zero Trust Network for the Defense Information Systems Agency (DISA), US. The above data was further refined by tracking various developments, such as contracts related to the upgrade of existing fleets, procurement of new platforms, and product development issued by the defense departments. The data sources considered for the market estimation and forecasting include the US DoD budget, cybersecurity development and integration, defense program publications, defense insights and data by SIPRI, defense expenditure of countries, and conflicts and geopolitical factors.

The bottom-up approach was employed to arrive at the overall size of the defense cybersecurity market from the revenues of key players and their shares in the market. Calculations based on the revenues of key players identified in the market led to the overall market size. The bottom-up approach was also implemented for data extracted from secondary research to validate the market segment revenues obtained. The market shares were then estimated for each company to verify the revenue shares used earlier in the bottom-up approach. With the data triangulation procedure and data validation through primaries, the overall parent market size and each individual market size were determined and confirmed in this study.

The bottom-up approach, employed to determine the overall size of the defense cybersecurity market, is delineated below.

Step 1:

  • Identifying top countries based on defense cybersecurity programs and budget spending
  • Identifying defense cybersecurity investments for top countries

Step 2:

  • Identifying whether defense cybersecurity considered in the scope is used or not for the top countries
  • Identifying the use of defense cybersecurity by various industries

Step 3:

  • Selecting the top countries based on their military spending
  • Developing a matrix for rating these countries on the basis of the following factors
    • MTCR Member Country
    • Defense Budget
    • Warfare Platform
    • NATO Member Country
    • Development Index
    • Conflicts & Geopolitics
  • Rating the selected countries for each parameter to determine the overall rating
  • Grouping the countries based on the overall rating synergy for correlation analysis

Step 4

  • Adding the data to the matrix after calculating the market size for the selected countries
  • Establishing a relation between the derived market size and the program spending and development of respective countries to arrive at a percentage

Step 5

  • Validating the data with the supply-side analysis by identifying the product revenue during the last five years

In September 2023, the UK Ministry of Defence awarded a contract worth USD 11 million to Leonardo S.p.A. (Italy) to support UK Armed Forces Cyber Operations.

Market Size Estimation Methodology: Bottom-Up Approach
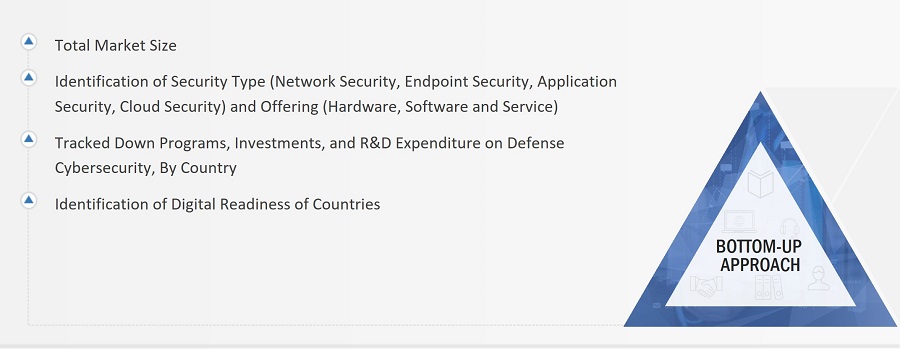
Defense Cybersecurity Market Size, and Bottom-Up Approach

Top-Down Approach

In the top-down approach, the overall size of the defense cybersecurity market was used to estimate the size of individual markets (mentioned in the market segmentation) through percentage splits obtained from secondary and primary research.  The size of the most appropriate, immediate parent market was used to implement the top-down approach to calculate the sizes of specific market segments. The approach was also implemented to validate the revenues obtained for various market segments.  Market share was estimated for each company to verify the revenue share used earlier in the bottom-up approach. With the data triangulation procedure and data validation through primaries, this study determined and confirmed the overall size of the parent market and each market segment. The following figure shows the overall market size estimation process employed for this study.

Market Size Estimation Methodology: Top-Down Approach

Defense Cybersecurity Market Size, and Top-Down Approach

Data Triangulation

After arriving at the overall size of the defense cybersecurity market from the market size estimation process explained above, the total market was split into several segments and subsegments. The data triangulation and market breakdown procedures explained below were implemented, wherever applicable, to complete the overall market engineering process and arrive at the estimated sizes of different market segments and subsegments. The data was triangulated by studying various factors and trends from both the demand and supply sides. Additionally, the market size was validated using both the top-down and bottom-up approaches.

The following figure indicates the market breakdown structure and the data triangulation procedure implemented in the market engineering process to develop this report.
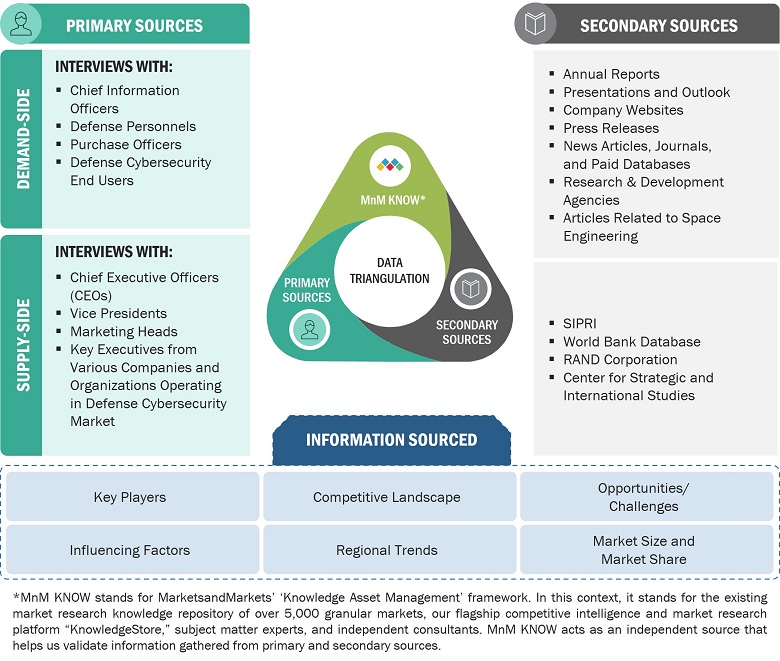
Defense Cybersecurity Market Size, and Data Triangulation

The figure above demonstrates the core data triangulation procedure used in this report for every market, submarket, and subsegment. The percentage splits of various market segments, including offering and security type, were used to determine the size of the defense cybersecurity market.

Market Definition

Defense cybersecurity, often referred to as the field of military and national security cyber defense, encompasses the strategies, technologies, and practices employed to safeguard a nation’s military and critical infrastructure from cyber threats and attacks. Defense cybersecurity focuses on countering a wide range of cyber adversaries, including state-sponsored actors, hacktivists, and criminal organizations, who seek to compromise sensitive government systems, military operations, and essential infrastructure like power grids, transportation networks, and financial institutions.

Defense cybersecurity solutions encompass a spectrum of measures, including intrusion detection, threat intelligence, encryption, secure communication protocols, and the development of resilient infrastructure that can withstand cyberattacks. The defense cybersecurity market involves government agencies, private defense contractors, cybersecurity companies, research institutions, and international collaborations, all working together to stay ahead of evolving threats and protect national security interests.

Key Stakeholders

  • Aerospace & Defense Companies
  • Space Industry Players
  • Research Institutions and Universities
  • Testing and Certification Organizations
  • Material and Technology Providers
  • Investors and Financial Institutions
  • Regulatory Bodies

Report Objectives

  • To define, describe, and forecast the size of the defense cybersecurity market based on security type, end user offering, application, and region from 2023 to 2028
  • To forecast the size of market segments with respect to major regions, namely North America, Europe, Asia Pacific, Middle East, and the Rest of the World (RoW)  Africa & Latin America
  • To identify and analyze key drivers, restraints, opportunities, and challenges influencing the growth of the global defense cybersecurity market
  • To strategically analyze micromarkets1 with respect to individual growth trends, prospects, and their contribution to the defense cybersecurity market
  • To analyze opportunities for stakeholders in the defense cybersecurity market by identifying key market trends
  • To analyze competitive developments such as contracts, acquisitions and expansions, agreements,  partnerships, product launches, and research & development (R&D) activities in the defense cybersecurity market
  • To provide a detailed competitive landscape of the -market, in addition to an analysis of business and corporate strategies adopted by leading market players
  • To strategically profile key market players and comprehensively analyze their core competencies

To strategically profile key market players and comprehensively analyze their core competencies2

1. Micro markets refer to further segments and subsegments of the hypersonic flight market included in the report.

2. The core competencies of the companies were captured in terms of their key developments and strategies adopted by them to sustain their position in the market.

Available customizations

Along with the market data, MarketsandMarkets offers customizations as per the specific needs of companies. The following customization options are available for the report:

Product Analysis

  • Product matrix, which gives a detailed comparison of the product portfolio of each company

Regional Analysis

  • Further breakdown of the market segments at the country level

Company Information

  • Detailed analysis and profiling of additional market players (up to 5)
Custom Market Research Services

We will customize the research for you, in case the report listed above does not meet with your exact requirements. Our custom research will comprehensively cover the business information you require to help you arrive at strategic and profitable business decisions.

Request Customization
Report Code
AS 8895
Published ON
Dec, 2023
Choose License Type
BUY NOW
  • SHARE
X
Request Customization
Speak to Analyst
Speak to Analyst
OR FACE-TO-FACE MEETING
PERSONALIZE THIS RESEARCH
  • Triangulate with your Own Data
  • Get Data as per your Format and Definition
  • Gain a Deeper Dive on a Specific Application, Geography, Customer or Competitor
  • Any level of Personalization
REQUEST A FREE CUSTOMIZATION
LET US HELP YOU!
  • What are the Known and Unknown Adjacencies Impacting the Defense Cybersecurity Market
  • What will your New Revenue Sources be?
  • Who will be your Top Customer; what will make them switch?
  • Defend your Market Share or Win Competitors
  • Get a Scorecard for Target Partners
CUSTOMIZED WORKSHOP REQUEST
+1-888-600-6441
  • Call Us
  • +1-888-600-6441 (Corporate office hours)
  • +1-888-600-6441 (US/Can toll free)
  • +44-800-368-9399 (UK office hours)
CONNECT WITH US
ABOUT TRUST ONLINE
©2024 MarketsandMarkets Research Private Ltd. All rights reserved
DMCA.com Protection Status Website Feedback