The study involved four major activities in estimating the current size of the digital isolator market—exhaustive secondary research collected information on the market and its peer and parent markets. The next step was to validate these findings, assumptions, and sizing with industry experts across the value chain through primary research. Both top-down and bottom-up approaches were employed to estimate the total market size. After that, market breakdown and data triangulation were used to estimate the market size of segments and subsegments.
Secondary Research
Various secondary sources have been referred to in the secondary research process for identifying and collecting information important for this study. These secondary sources include digital isolator technology journals and magazines, annual reports, press releases, investor presentations of companies, white papers, certified publications and articles from recognized authors, and directories and databases such as Factiva, Hoovers, and OneSource.
Primary Research
Various primary sources from both supply and demand sides have been interviewed in the primary research process to obtain qualitative and quantitative information important for this report. The primary sources from the supply side included industry experts such as CEOs, VPs, marketing directors, technology and innovation directors, and related executives from key companies and organizations operating in the digital isolator market. After complete market engineering (including calculations regarding market statistics, market breakdown, market size estimations, market forecasting, and data triangulation), extensive primary research was conducted to gather information as well as to verify and validate the critical numbers arrived at.

To know about the assumptions considered for the study, download the pdf brochure
Market Size Estimation
In the complete market estimation process, both top-down and bottom-up approaches have been implemented, along with several data triangulation methods, to estimate and validate the size of the digital isolator market and other dependent submarkets listed in this report.
-
Extensive secondary research has identified key players in the industry and market.
-
In terms of value, the industry’s supply chain and market size have been determined through primary and secondary research processes.
-
All percentage shares, splits, and breakdowns have been determined using secondary sources and verified through primary sources.
Digital Isolator Market: Bottom-Up Approach

Digital Isolator Market: Top-Down Approach

Data Triangulation
After arriving at the overall market size from the estimation process explained above, the global market has been split into several segments and subsegments. Market breakdown and data triangulation procedures have been employed wherever applicable to complete the overall market engineering process and arrive at exact statistics for all segments and subsegments. The data has been triangulated by studying several factors and trends identified from both the demand and supply sides.
Market Definition
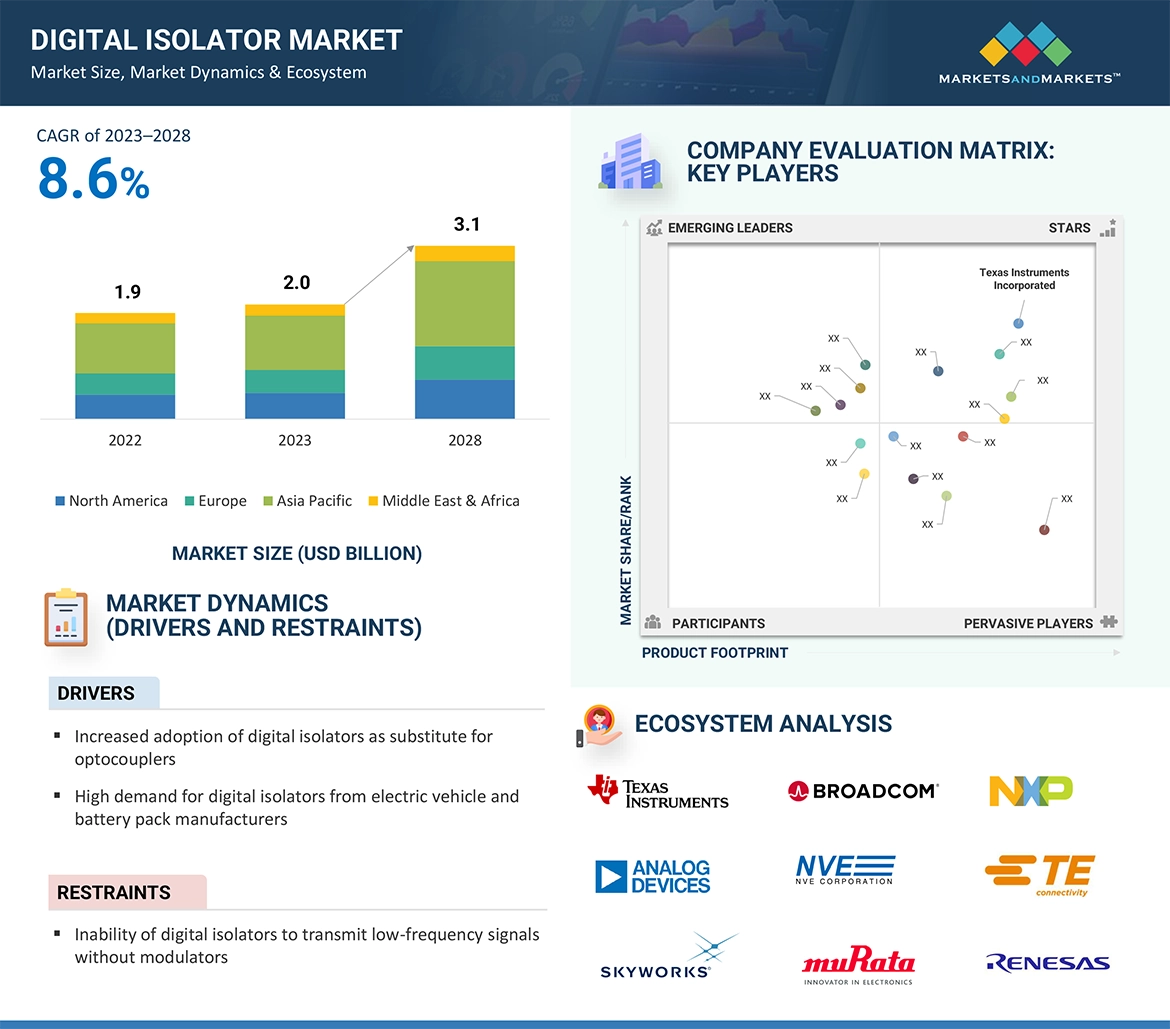
A digital isolator is a semiconductor device that provides electrical isolation between two parts of an electronic system while allowing digital signals to be transmitted across the isolation barrier. The primary purpose of a digital isolator is to prevent electrical currents or potential differences in one part of the system from affecting the other, thereby enhancing safety, reducing noise, and meeting regulatory requirements. They play a critical role in enhancing the safety and reliability of electronic systems by preventing the transmission of potentially harmful electrical currents between different parts of the system. Applications of digital isolators span a wide variety of verticals, including industrial automation, automotive consumer electronics, healthcare, telecommunications, and energy & power. The digital isolator market is concentrated, with companies such as Texas Instruments; Analog Devices; Skyworks Solutions, Inc.; Broadcom Inc.; and Infineon Technologies operating in it.
Key Stakeholders
-
Raw material and wafer suppliers
-
System integrators
-
Original equipment manufacturers (OEMs)
-
Integrated device manufacturers (IDMs)
-
Original design manufacturers (ODMs)
-
Assembling, testing, and packaging companies
-
Suppliers and distributors
-
Governments and other regulatory bodies
-
Research institutes and organizations
-
Market research and consulting firms
Report Objectives
The following are the primary objectives of the study.
-
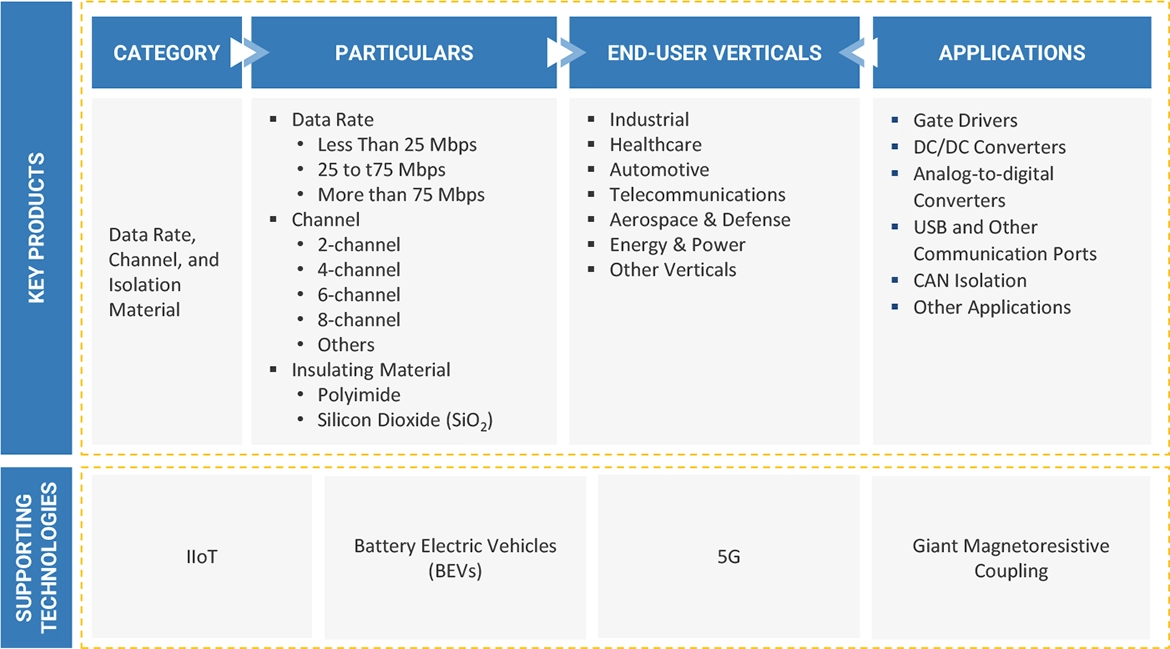
To forecast the size of the digital isolator market based on application and vertical, in terms of value
-
To describe and forecast the digital isolator market based on technology, data rate, channel, and insulating material, in terms of value and volume
-
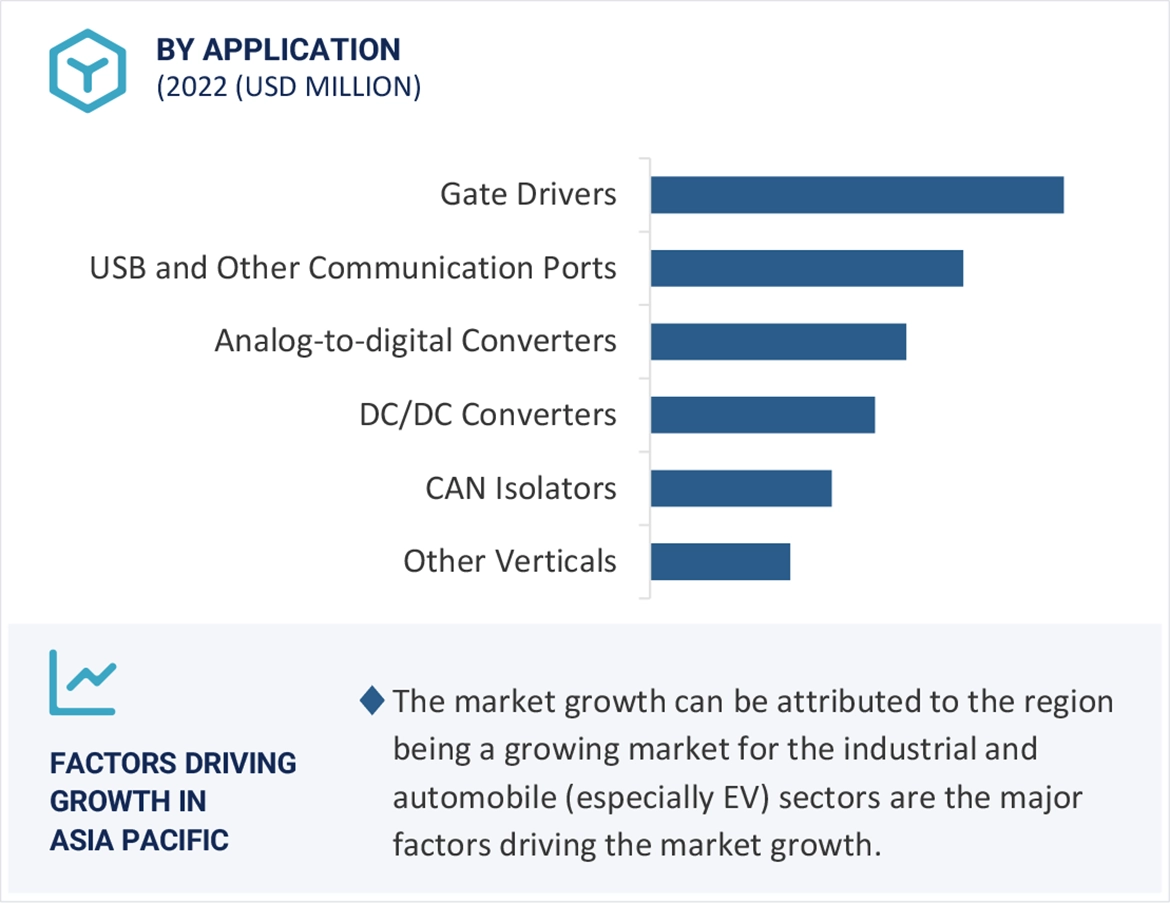
To describe and forecast the market for various segments across four main regions: North America, Asia Pacific, Europe, and Rest of the World (RoW), in terms of value
-
To provide detailed information regarding drivers, restraints, opportunities, and challenges influencing the growth of the market
-
To study the complete value chain and related industry segments and perform a value chain analysis of the digital isolator market landscape
-
To strategically analyze the ecosystem, regulatory landscape, patent landscape, Porter’s five forces, import and export scenarios, trade landscape, and case studies pertaining to the market under study
-
To strategically analyze micromarkets1 with respect to individual growth trends, prospects, and their contributions to the overall market
-
To analyze opportunities in the market for the stakeholders by identifying high-growth segments in the market
-
To strategically profile the key players and provide a detailed competitive landscape of the digital isolator market
-
To analyze strategic approaches adopted by the leading players in the digital isolator market, including product launches/developments and acquisitions
Available Customizations
With the given market data, MarketsandMarkets offers customizations according to a company’s specific needs. The following customization options are available for the report:
Company Information:
-
Detailed analysis and profiling of additional market players (up to 5)


Growth opportunities and latent adjacency in Digital Isolator Market