This research study involved the extensive use of secondary sources, directories, and databases (such as annual reports or presentations of companies, industry association publications, directories, technical handbooks, World Economic Outlook (WEO), trade websites, Hoovers, Bloomberg Businessweek, Factiva, and OneSource) to identify and collect information useful for this technical, market-oriented, and commercial study of the digital scent technology market. Primary sources mainly comprise several experts from the core and related industries, along with preferred suppliers, manufacturers, distributors, service providers, system providers, technology developers, alliances, and standards and certification organizations related to the various phases of this industry’s value chain. In-depth interviews have been conducted with various primary respondents, including key industry participants, subject matter experts (SMEs), C-level executives of key market players, and industry consultants, to obtain and verify critical qualitative and quantitative information and assess market prospects.
Secondary Research
In secondary research, various sources have been referred to identify and collect information important for this study. Secondary sources included corporate filings (such as annual reports, investor presentations, and financial statements); trade, business, and professional associations; white papers; digital scent technology products-related journals and certified publications; articles by recognized authors; directories; and databases.
Secondary research has been conducted to obtain key information about the industry supply chain, market value chain, total pool of key players, market classification and segmentation according to industry trends to the bottom-most level, geographic markets, and key developments from market and technology-oriented perspectives. Data from secondary research has been collected and analyzed to arrive at the overall market size, which has been further validated by primary research.
Primary Research
Extensive primary research was conducted after understanding and analyzing the digital scent technology market through secondary research. Several primary interviews were conducted with key opinion leaders from demand- and supply-side vendors across four major regions—North America, Europe, Asia Pacific, and RoW, which comprises the Middle East, Africa, GCC, and South America. Approximately 25% of the primary interviews were conducted with the demand-side vendors and 75% with the supply-side vendors. This primary data was mainly collected through telephone interviews/web conferences, which comprised 80% of the total primary interviews, questionnaires, and e-mails.

To know about the assumptions considered for the study, download the pdf brochure
Market Size Estimation
In the complete market engineering process, top-down and bottom-up approaches and several data triangulation methods have been used to estimate and forecast the size of the market and its segments and subsegments listed in the report. Extensive qualitative and quantitative analyses have been carried out on the complete market engineering process to list the key information/insights pertaining to the digital scent technology market.
The key players in the market have been identified through secondary research, and their rankings in the respective regions have been determined through primary and secondary research. This entire procedure involved the study of the annual and financial reports of top players and interviews with industry experts such as chief executive officers, vice presidents, directors, and marketing executives for quantitative and qualitative key insights. All percentage shares, splits, and breakdowns have been determined using secondary sources and verified through primary sources. All parameters that affect the markets covered in this research study have been accounted for, viewed in extensive detail, verified through primary research, and analyzed to obtain the final quantitative and qualitative data. This data has been consolidated and enhanced with detailed inputs and analysis from MarketsandMarkets and presented in this report.
Digital Scent Technology Market: Bottom-Up Approach

The bottom-up approach has been employed to arrive at the overall size of the Digital Scent Technology market from the revenues of key players and their share in the market.
Digital Scent Technology Market: Top-Down Approach

In the top-down approach, the overall market size has been used to estimate the size of the individual markets (mentioned in the market segmentation) through percentage splits from secondary and primary research.
The most appropriate immediate parent market size has been used to implement the top-down approach to calculate the size of specific market segments. The bottom-up approach was implemented for the data extracted from secondary research to validate the market size obtained.
The market share of each company was estimated to verify the revenue shares used earlier in the bottom-up approach. The overall parent market size and individual market sizes were determined and confirmed in this study by the data triangulation method and the validation of the data through primaries.
Data Triangulation
After arriving at the overall market size from the market size estimation process explained earlier, the total market was split into several segments and subsegments. Where applicable, data triangulation and market breakdown procedures have been employed to complete the overall market engineering process and arrive at the exact statistics for all segments and subsegments. The data has been triangulated by studying various factors and trends from both the demand and supply sides. Along with this, the digital scent technology market has been validated using both top-down and bottom-up approaches.
Market Definition
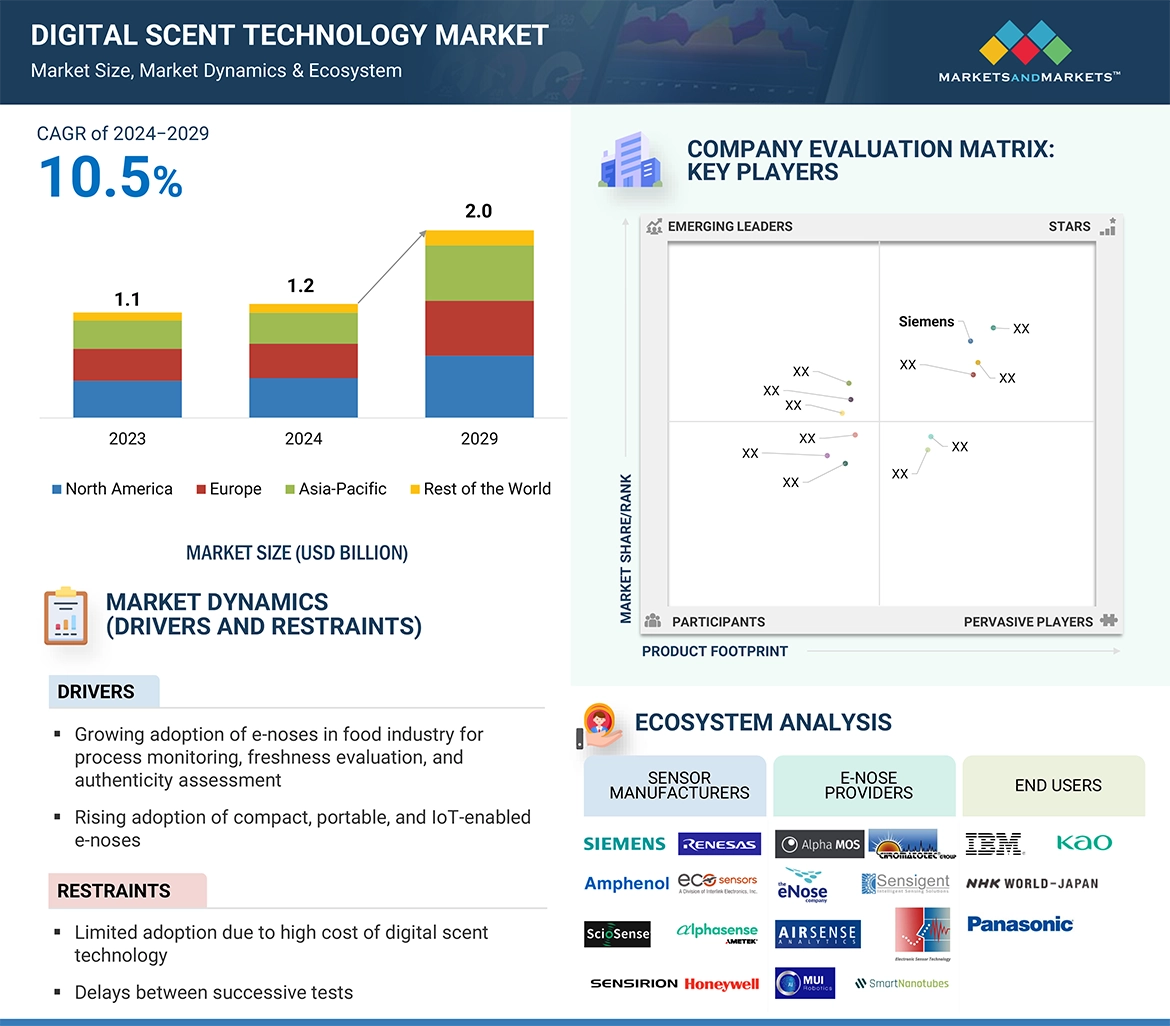
Digital scent technology involves transmitting, receiving, and perceiving scented digital media through hardware devices like e-noses and scent synthesizers. An e-nose, equipped with an array of gas sensors, is designed to detect various odors, while a scent synthesizer releases scents from electronic devices such as TVs, smartphones, and tablets. This technology finds applications across diverse industries, including military & defense, food & beverage, medical, marketing, entertainment, environmental monitoring, and others like communication, agriculture, public security, transportation, and research and development. Despite its potential, the technology is still in its early stages, requiring dedicated partners and strategic investments to tailor its outcomes for companies aiming to incorporate scent as part of their branding strategy.
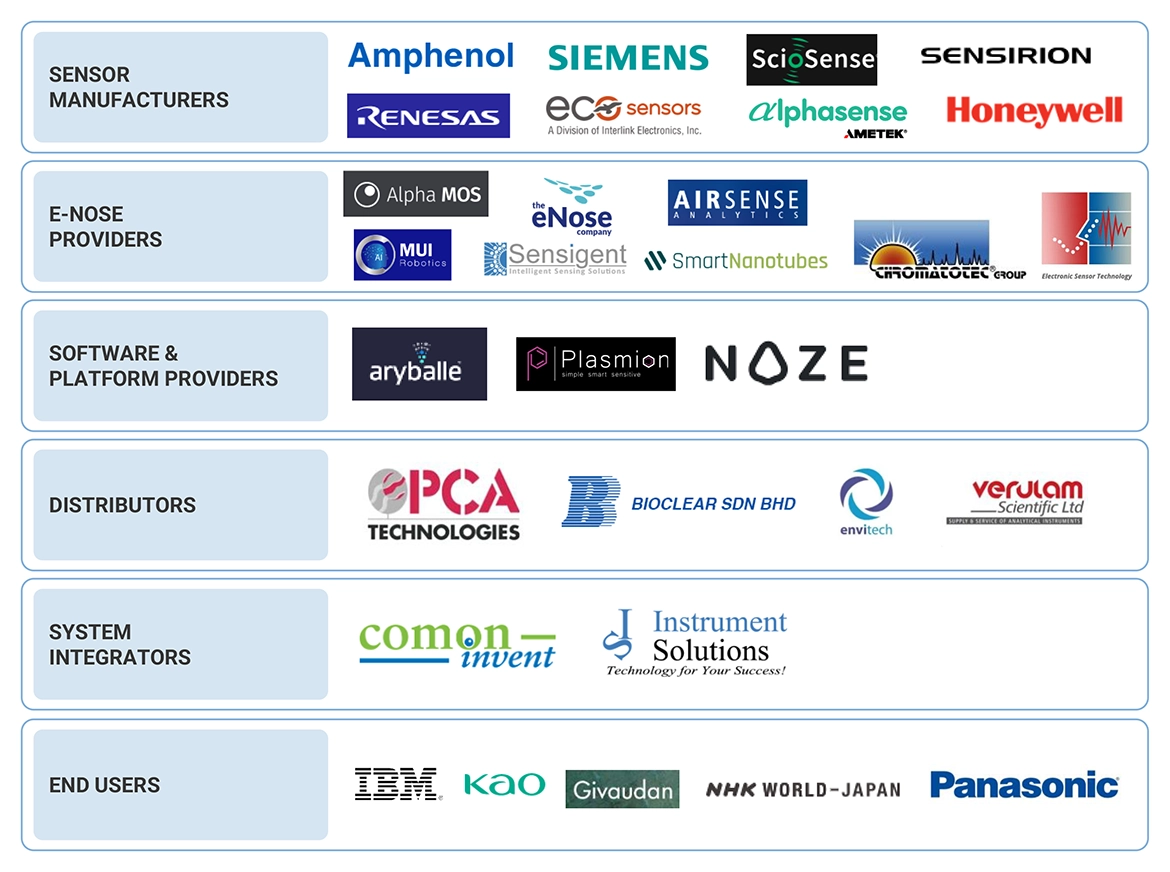
The ecosystem of the digital scent technology market encompasses a range of components such as sensors, e-noses, scent synthesizers, cartridges, and software kits. This market exhibits diversity, with numerous companies vying across its value chain to maintain their foothold and expand their market presence. Anticipated to experience notable expansion in the foreseeable future, the digital scent technology market is driven by increasing demand for e-noses in clinical diagnosis applications.
Key Stakeholders
-
Original technology designers and suppliers
-
Raw material suppliers
-
Integrated device manufacturers (IDMs)
-
Original device manufacturers (ODMs)
-
Digital scent technology original equipment manufacturers (OEMS)
-
Process OEMS
-
Suppliers and distributors
-
System integrators
-
Electronic hardware equipment manufacturers
-
Assembly and packaging vendors
-
Technical universities
-
Government research agencies and private research organizations
-
Research institutes and organizations
-
Market research and consulting firms
-
Sensor manufacturers
-
Technology investors
-
Technology standard organizations, forums, alliances, and associations
Report Objectives
-
To describe and forecast the digital scent technology market, in terms of value, by hardware devices, end-use products, and applications.
-
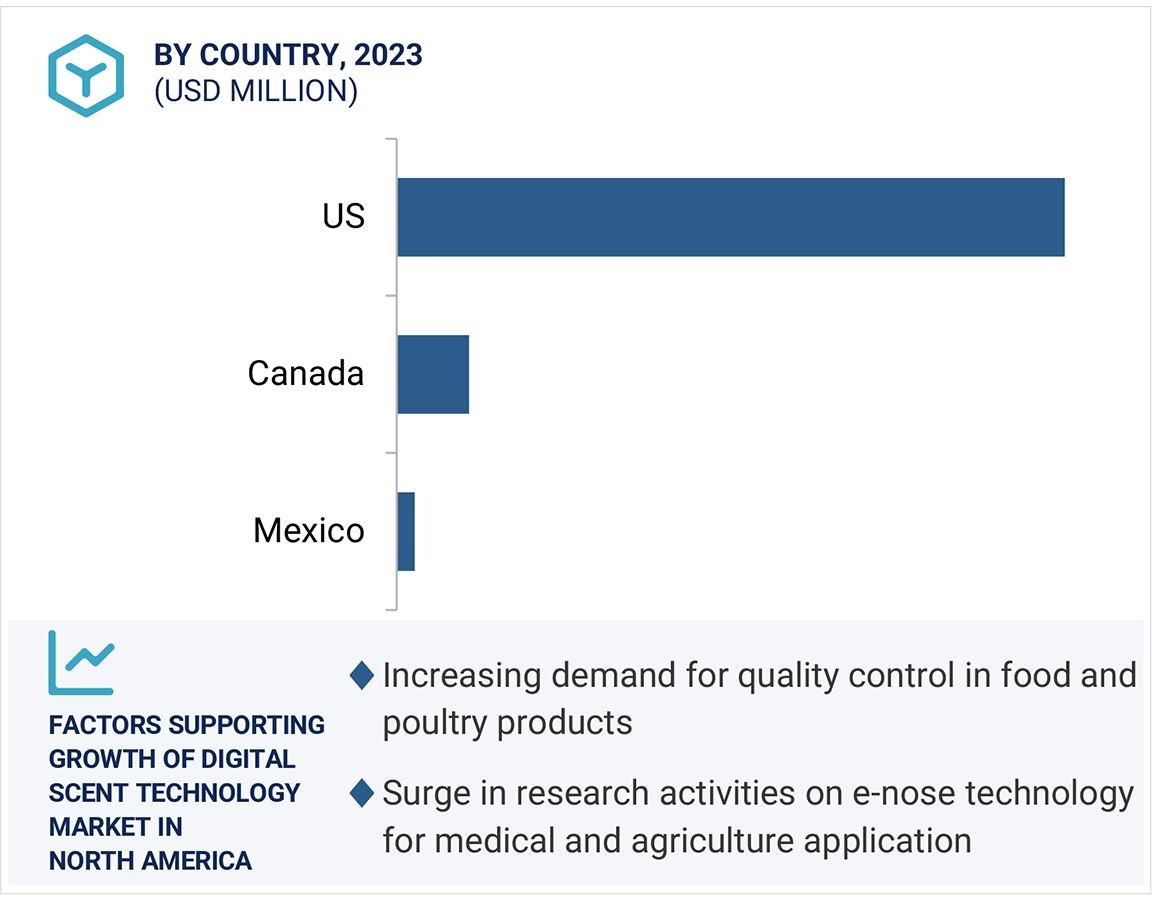
To describe and project the digital scent technology market, in terms of value, for four main regions-North America, Europe, Asia Pacific, and RoW.
-
To present detailed information regarding the major factors influencing the growth of the market (drivers, restraints, opportunities, and challenges)
-
To provide an ecosystem analysis, case study analysis, patent analysis, technology analysis, ASP analysis, Porter's Five Forces analysis, and regulations pertaining to the market.
-
To offer a comprehensive overview of the value chain of the digital scent technology market ecosystem.
-
To critically analyze micromarkets with respect to individual growth trends, prospects, and contributions to the total market.
-
To strategically profile the key players and comprehensively analyze their market shares and core competencies.
-
To assess the opportunities in the market for stakeholders and describe the competitive landscape of the market.
-
To analyze competitive developments such as collaborations, agreements, partnerships, product developments, and research and development (R&D) in the market.
-
To evaluate the impact of the recession on the digital scent technology market
Available Customizations
With the given market data, MarketsandMarkets offers customizations according to the company’s specific needs. The following customization options are available for the report:
Company Information
-
Detailed analysis and profiling of additional market players (up to 7)


Growth opportunities and latent adjacency in Digital Scent Technology Market