Egg Processing Market

Egg Processing Market by product type (Dried Egg Products, Liquid Egg Products, Frozen Egg Products), End-use Application (Food Processing and Manufacturing, Food Service, Retail), Nature and Region - Global Forecast to 2029

Report Code: FB 2690 Feb, 2024, by marketsandmarkets.com

[292 Pages Report] The global egg processing market is expected to reach USD 47.2 billion by 2029, with an estimated value of USD 37.5 billion in 2024, representing a compound annual growth rate (CAGR) of 4.7% from 2024 to 2029. This growth surge is primarily attributed to several key factors such as consumers are increasing awareness of the nutritional value of eggs, rich in protein, vitamins, and essential minerals. This drives the demand for both fresh and processed egg products. The food industry heavily relies on egg products for various applications such as baking, pasta production, sauces, and dressings. The growth of the food industry, particularly in bakery and confectionery segments, directly translates to increased demand for processed eggs. In October 2018, The American Egg Board (AEB) is celebrating World Egg Day by highlighting the egg industry's commitment to "sustainable nutrition." This means providing high-quality protein while minimizing environmental impact. Egg farmers are working to reduce their use of land and water, while also making eggs affordable and accessible to people around the world. Studies have shown that eggs can significantly improve health outcomes in children, especially in areas with limited access to nutritious food.

Additionally, the development of functional egg products presents a significant opportunity for low-cholesterol options for health-conscious individuals, high-protein varieties for fitness enthusiasts, and even allergy-friendly solutions. These cater to niche markets while offering unique functionalities including improved emulsification, gelling, or fortification. Advanced technologies such as freeze-drying and enzyme modification further enhance these properties. While cost and consumer awareness pose challenges, the growth potential is undeniable. By addressing these concerns and leveraging innovation, the egg processing industry can solidify its position in the evolving food landscape.

Egg Processing Market

To know about the assumptions considered for the study, Request for Free Sample Report

Egg Processing Market Opportunities

To know about the assumptions considered for the study, download the pdf brochure

Market Dynamics

Drivers:The expansion of the food and beverage industry catalyzes growth in the egg processing market

The expansive functionality of egg products, offering attributes such as whipping, thickening, and emulsification, positions them as invaluable components transcending various food sectors. In the realm of bakery and confectionery, eggs serve multifaceted roles, including binding, providing moisture, and acting as natural leavening, contributing to the structural integrity, texture, and flavors of baked goods. According to the International Pasta Organization Secretariat General c/o Unione Italiana Food (IPO), global past consumption reaching 16 million tons in 2020 signifies a substantial market for eggs as binding ingredients and natural color enhancers. This statistic underscores the widespread adoption of eggs in pasta manufacturing, contributing to the creation of smooth texture and golden appearance in the final product.

The burgeoning food and beverage industry drives the growth of the egg processing market. As restaurants, bakeries, and manufacturers churn out an ever-increasing variety of products, their demand for processed egg ingredients such as liquid eggs, egg whites, and yolks. This surge is driven by several factors including convenience and efficiency in food preparation, consistent quality and functionality in baked goods, and the versatility of eggs in various recipes. Additionally, the rising popularity of convenience food and ready-to-eat meals further fuels the demand for processed eggs, as they offer a pre-measured and easily incorporated ingredient. Furthermore, the growing health consciousness among consumers is driving the demand for egg-based products perceived as natural and protein-rich. Finally, the expansion of the food service industry, with its extensive use of pre-cooked and pre-processed egg products, contributes significantly to the market's growth.

Restraints: Egg price volatility impacts processing costs and consumer confidence

The egg industry is susceptible to price fluctuations due to various factors such as disease outbreaks, changes in consumer demand, and production costs. These variations can have a cascading effect on processing costs and profit margins, creating an environment of uncertainty within the industry.

A comprehensive assessment of the causes of price volatility in the egg commodity value chain provides valuable insights. One primary factor contributing to this volatility is the imbalance between egg production and demand. To address this, efforts should focus on enhancing egg production through initiatives like improving chicken breeds, implementing efficient chicken feed strategies, and introducing insurance schemes to mitigate risks. Furthermore, the high cost of egg production inputs, particularly chicken feeds, plays a role in price fluctuations. Recommendations include increasing the production of raw materials for animal feed, such as maize and soybeans, and ensuring the availability of other essential ingredients like leftover fish, seashells, sunflower cakes, and vitamins.

Opportunities:Cutting-edge technology enhances efficiency and market appeal in egg processing.

The integration of advanced automation technologies in egg production presents a significant opportunity for the industry's growth and efficiency. In Canada, where labor shortages and the transition to cage-free systems are driving forces, investments in automated packing, stacking, and palletization technologies are enhancing operational efficiency and egg quality. For instance, the adoption of automated packing and stacking equipment, such as Damtech's systems, streamlines egg collection and processing, reducing labor-intensive tasks and improving productivity. Additionally, innovations like the Ovoconcept palletizing robot at Rose Valley Colony exemplify how automation can significantly increase efficiency, with the ability to palletize 10,000 eggs in just 30 minutes. These technological advancements not only optimize operations but also improve egg quality and cleanliness, leading to fewer cracked and broken eggs. With potential return on investments as short as four to five years for equipment like the Ovoconcept robot, the adoption of automation offers a promising opportunity for egg processing companies to enhance efficiency, reduce costs, and meet evolving consumer demands.

Challenges: Plant-based egg substitutes challenge traditional egg products in diverse applications.

According to Good Food Institute reports, the rise of plant-based egg alternatives presents a formidable challenge to the egg processing market. In the US alone, retail sales of plant-based egg alternatives soared to USD 255 million in 2022, marking substantial growth. Despite limited per capita consumption data, household penetration of these alternatives hovered around 2% in 2022, with a notable uptick in repeat purchases, indicating increasing adoption. Unit sales of plant-based eggs in the US have surged by a factor of 7 since 2019, signaling a significant uptick in consumption trends. This growing popularity of plant-based alternatives, driven by factors such as health consciousness and dietary preferences, directly competes with processed egg products in various food applications, posing a significant challenge to the traditional egg processing industry.

Market Ecosystem

Top Companies in Egg Processing Market

Dietary Supplements are One of the Fastest Growing Food Processing and Manufacturing End-Use Application Segments During the Forecast Period

Processed egg products such as powders are increasingly being used in dietary supplements due to their rich nutritional profile and potential health benefits. According to the article provided by EurekAlert in September 2022, Malnutrition affects millions, especially children, in Africa. Egg powder could be a powerful tool to combat malnutrition in children, especially in areas where fresh eggs are scarce. While it lacks some essential fatty acids compared to fresh eggs, it packs a punch of vitamins, amino acids, and trace elements. Plus, it boasts a long shelf life, easy transport, and simple preparation, making it ideal for distribution in deprived areas. A study by the Leibniz Institute for Food Systems Biology confirms its potential, showing that adding egg powder equivalent to one egg daily can significantly reduce underweight and stunting in children. This research highlights the potential of egg powder as a readily available and effective dietary supplement for tackling malnutrition in vulnerable populations.

China is One of the Fastest Growing Markets for Egg Processing In Asia Pacific

According to the Food and Agriculture Organization (FAO), China is the world's largest egg producer, it's estimated that China produces over 34% of the world's eggs, with a total production of around 30 million tons in 2020. Over 95% of their eggs are consumed directly as fresh table eggs. The rapid growth of China's egg processing industry is expected to continue in the coming years. This growth is driven by the factors of rising urbanization, busy lifestyles, increasing disposable incomes, and growing demand for processed egg products.

The Chinese government is also supporting the growth of the egg processing sector, by providing subsidies and investing in research and development. This is expected to further boost the sector's growth in the coming years. In 2023, the Ministry of Agriculture and Rural Affairs (MOA) allocated 160 million yuan (approximately $23.7 million) to support 18 egg processing demonstration projects across China. These projects aim to promote advanced technologies and equipment, improve processing efficiency, and develop new value-added products.

Asia Pacific Egg Processing Market Size, and Share

Key Market Players

The key players in this market include Cal-Maine Foods, Inc. (US), Rose Acre Farms (US), Ovobel Foods Limited (India), SKMEgg.com (India), Rembrandt Foods (US), IGRECA (France), Eurovo Srl (Italy), Hillandale Farms (US), Avril SCA (France), and Interovo Egg Group BV (Netherlands).

Get online access to the report on the World's First Market Intelligence Cloud

  • Easy to Download Historical Data & Forecast Numbers
  • Company Analysis Dashboard for high growth potential opportunities
  • Research Analyst Access for customization & queries
  • Competitor Analysis with Interactive dashboard
  • Latest News, Updates & Trend analysis
Request Sample

Scope of the Report

Report Metric

Details

Market size estimation

2024–2029

Base year considered

2023

Forecast period considered

2024–2029

Units considered

Value (USD)

Segments covered

By Product Type, End-Use Application, Nature, and Region

Regions covered

North America, Europe, Asia Pacific, South America, and RoW

Companies studied

  • Cal-Maine Foods, Inc. (US)
  • Rose Acre Farms (US)
  • Ovobel Foods Limited (India)
  • SKMEgg.com (India)
  • Interovo Egg Group BV. (Netherlands)
  • IGRECA (France)
  • Wabash Valley (US)
  • Rembrandt Foods (US)
  • Avril SCA (France)
  • Eurovo Srl (Italy)
  • Bouwhuis Enthoven (Netherlands)
  • Taj Agro International (India)
  • Hillandale Farms (US)
  • Venkys India (India)
  • Kewpie Corporation  (Japan)
  • Ovobest Eiprodukte GempH & Co. KG (Germany)
  • Taiyo International (Japan)
  • Ready Egg Products (Ireland)
  • Ovovita (Poland)
  • Versova (US)

Egg Processing Market Report Scope:

This research report categorizes the egg processing market, based on offering, product type, end-use application, nature, and region.

By Product Type
  • Dried Egg Products
  • Liquid Egg Products
  • Frozen Egg Products
By End-Use Application
  • Food Processing and Manufacturing
    • Processed Foods and Ready Meals
    • Bakery and Confectionary
    • Dietary Supplements
    • Others (Dairy Alternatives, Baby Food, Pet Food, Etc. )
  • Food Service
  • Retail
By Nature
  • Organic Egg Products
  • Inorganic Egg Products
By Region:
  • North America
  • Europe
  • Asia Pacific
  • South America
  • Rest of the World (RoW)

Target Audience

  • Egg Processing manufacturers, companies, and producers
  • Egg Processing traders, suppliers, distributors, importers, and exporters
  • Government Agricultural Authorities
  • Egg Processing manufacturers
  • Commercial research & development (R&D) organizations and financial institutions
    • Government agricultural departments and regulatory bodies such as the US Department of Agriculture (USDA), Food and Drug Administration (FDA), European Food Safety Authority (EFSA), United Egg Producers (UEP), The Canadian Food Inspection Agency (CFIA), Environmental Protection Agency (EPA).

Recent Developments

  • In November 2023, Rose Acre Farms recently unveiled a groundbreaking initiative in collaboration with Tideland Electric Membership Corp, establishing a cutting-edge microgrid at their Hyde County facility. Incorporating advanced solar technology and battery energy storage systems, this innovative project ensures an uninterrupted power supply, reinforcing its position as a leading player in the egg processing market.
  • In February 2023, Wabash Valley unveiled plans for a USD 63 million expansion in Dubois County, Indiana, aimed at constructing a new facility for processing egg patties, scrambled eggs, and other value-added Egg Products. This strategic move is set to generate 31 new employment opportunities while substantially bolstering production capacity.
  • In January 2023, Cal-Maine Foods has recently partnered with Entegrity Energy Partners to enhance sustainability in their egg processing operations. A 4.15-megawatt solar array will be installed at their Searcy, Arkansas facility, covering 28 acres and projected to offset 91% of the facility's current electrical consumption, underscoring their commitment to environmentally friendly egg processing practices.
  • In September 2020, Bouwhuis Enthoven introduced Eggxellent, a breakthrough protein innovation for high-protein snacks. Their egg white-based ingredients, EPI90 and EPC80, address challenges like texture and shelf-life in bars. With high protein content and neutral taste, they meet demand in the active nutrition sector, enhancing taste and functionality.

Frequently Asked Questions (FAQ):

To speak to our analyst for a discussion on the above findings, click Speak to Analyst

TABLE OF CONTENTS
 
1 INTRODUCTION (Page No. - 39)
    1.1 STUDY OBJECTIVES 
    1.2 MARKET DEFINITION 
    1.3 STUDY SCOPE 
           FIGURE 1 EGG PROCESSING MARKET SEGMENTATION
           1.3.1 INCLUSIONS AND EXCLUSIONS
                    TABLE 1 INCLUSIONS AND EXCLUSIONS
    1.4 REGIONS COVERED 
    1.5 YEARS CONSIDERED 
    1.6 CURRENCY CONSIDERED 
           TABLE 2 USD EXCHANGE RATE, 2019–2023
    1.7 VOLUME UNIT CONSIDERED 
    1.8 STAKEHOLDERS 
    1.9 SUMMARY OF CHANGES 
           1.9.1 RECESSION IMPACT
 
2 RESEARCH METHODOLOGY (Page No. - 45)
    2.1 RESEARCH DATA 
           FIGURE 2 EGG PROCESSING MARKET: RESEARCH DESIGN
           2.1.1 SECONDARY DATA
                    2.1.1.1 Key data from secondary sources
           2.1.2 PRIMARY DATA
                    2.1.2.1 Key data from primary sources
                    2.1.2.2 Key primary insights
                    2.1.2.3 Breakdown of primary interviews
                               FIGURE 3 BREAKDOWN OF PRIMARY INTERVIEWS, BY COMPANY TYPE, DESIGNATION, AND REGION
    2.2 MARKET SIZE ESTIMATION 
           FIGURE 4 EGG PROCESSING MARKET SIZE ESTIMATION, BY KEY PLAYER: SUPPLY SIDE
           2.2.1 TOP-DOWN APPROACH
                    FIGURE 5 EGG PROCESSING MARKET SIZE ESTIMATION: TOP-DOWN APPROACH
           2.2.2 BOTTOM-UP APPROACH
                    FIGURE 6 EGG PROCESSING MARKET SIZE ESTIMATION: BOTTOM-UP APPROACH (BASED ON GLOBAL MARKET)
    2.3 DATA TRIANGULATION 
           FIGURE 7 DATA TRIANGULATION
    2.4 RESEARCH ASSUMPTIONS 
    2.5 LIMITATIONS AND RISK ASSESSMENT 
    2.6 RECESSION IMPACT ANALYSIS 
           2.6.1 RECESSION MACROINDICATORS
                    FIGURE 8 INDICATORS OF RECESSION
                    FIGURE 9 GLOBAL INFLATION RATE, 2012–2022
                    FIGURE 10 GLOBAL GROSS DOMESTIC PRODUCT, 2012–2022 (USD TRILLION)
                    FIGURE 11 RECESSION INDICATORS AND THEIR IMPACT ON EGG PROCESSING MARKET
                    FIGURE 12 GLOBAL EGG PROCESSING MARKET: CURRENT FORECAST VS. RECESSION FORECAST
 
3 EXECUTIVE SUMMARY (Page No. - 58)
    TABLE 3 EGG PROCESSING MARKET SNAPSHOT, 2024 VS. 2029 
    FIGURE 13 EGG PROCESSING MARKET, BY PRODUCT TYPE, 2024 VS. 2029 (USD MILLION) 
    FIGURE 14 EGG PROCESSING MARKET, BY END-USE APPLICATION, 2024 VS. 2029 (USD MILLION) 
    FIGURE 15 EGG PROCESSING MARKET, BY NATURE, 2024 VS. 2029 (USD MILLION) 
    FIGURE 16 EGG PROCESSING MARKET SHARE (VALUE), BY REGION, 2024 
 
4 PREMIUM INSIGHTS (Page No. - 62)
    4.1 ATTRACTIVE OPPORTUNITIES IN EGG PROCESSING MARKET 
           FIGURE 17 EMERGING ECONOMIES TO PROVIDE ATTRACTIVE OPPORTUNITIES IN EGG PROCESSING MARKET
    4.2 EGG PROCESSING MARKET: SHARE OF MAJOR REGIONAL SUBMARKETS 
           FIGURE 18 CHINA TO ACCOUNT FOR LARGEST SHARE DURING FORECAST PERIOD
    4.3 ASIA PACIFIC: EGG PROCESSING MARKET, BY TYPE AND COUNTRY 
           FIGURE 19 LIQUID EGG PRODUCTS SEGMENT AND CHINA TO ACCOUNT FOR LARGEST SHARE IN ASIA PACIFIC MARKET IN 2024
    4.4 EGG PROCESSING MARKET, BY PRODUCT TYPE 
           FIGURE 20 LIQUID EGG PRODUCTS SEGMENT TO DOMINATE MARKET DURING FORECAST PERIOD
    4.5 EGG PROCESSING MARKET, BY END-USE APPLICATION 
           FIGURE 21 FOODSERVICE SEGMENT PROJECTED TO ACCOUNT FOR LARGEST SHARE DURING FORECAST PERIOD
    4.6 EGG PROCESSING MARKET, BY FOOD PROCESSING AND MANUFACTURING END-USE APPLICATION 
           FIGURE 22 PROCESSED FOODS AND READY MEALS SEGMENT TO DOMINATE MARKET DURING FORECAST PERIOD
    4.7 EGG PROCESSING MARKET, BY NATURE 
           FIGURE 23 INORGANIC EGG PRODUCTS TO DOMINATE MARKET DURING FORECAST PERIOD
 
5 MARKET OVERVIEW (Page No. - 68)
    5.1 INTRODUCTION 
    5.2 MACROECONOMIC INDICATORS 
           5.2.1 INCREASE IN RETAIL SALES
                    FIGURE 24 RETAIL & FOOD SERVICE SALES IN US, 2016–2023 (USD BILLION)
           5.2.2 UPSWING IN EGG PROCESSING INDUSTRY ALIGNING WITH GLOBAL RISE IN POPULATION AND GDP
                    FIGURE 25 GLOBAL POPULATION GROWTH, 1950–2050 (MILLION)
                    FIGURE 26 GDP GROWTH, 2016–2022 (TRILLION)
    5.3 MARKET DYNAMICS 
           FIGURE 27 MARKET DYNAMICS
           5.3.1 DRIVERS
                    5.3.1.1 Rising health-consciousness among people
                    5.3.1.2 Widespread popularity of multi-functionality of egg products
                    5.3.1.3 Busy lifestyles leading to adoption of processed egg products
           5.3.2 RESTRAINTS
                    5.3.2.1 High costs and low consumer confidence
                               FIGURE 28 EGG PRODUCTION, EGG DEMAND, AND EGG PRICE FLUCTUATION, 2000–2022
                               FIGURE 29 COST OF PRIMARY PRODUCTION IN ENRICHED CAGES IN EU (AVERAGE) AND CONVENTIONAL CAGES IN NON-EU COUNTRIES (USD PER KILOGRAM OF EGGS), 2021
                               FIGURE 30 COST OF PRODUCTION OF WHOLE EGG POWDER IN NON-EU COUNTRIES (USD PER KILOGRAM OF EGG POWDER), 2021
                    5.3.2.2 Increase in consumer demand for ethical sourcing and animal welfare practices
           5.3.3 OPPORTUNITIES
                    5.3.3.1 Egg producers’ sustainability efforts to attract eco-conscious consumers
                    5.3.3.2 Use of cutting-edge technology in egg processing
           5.3.4 CHALLENGES
                    5.3.4.1 Consumers’ misconceptions regarding risks associated with conventional and processed eggs
                    5.3.4.2 Rapid adoption of plant-based egg substitutes in diverse applications
                               FIGURE 31 PLANT-BASED EGG SALES GROWTH VS. CONVENTIONAL EGG SALES GROWTH, 2021
 
6 INDUSTRY TRENDS (Page No. - 81)
    6.1 INTRODUCTION 
    6.2 VALUE CHAIN ANALYSIS 
           6.2.1 RESEARCH & DEVELOPMENT (R&D)
           6.2.2 RAW MATERIAL SOURCING
           6.2.3 PROCESSING & MANUFACTURING
           6.2.4 DISTRIBUTION
           6.2.5 MARKETING & SALES
                    FIGURE 32 VALUE CHAIN ANALYSIS
    6.3 TECHNOLOGY ANALYSIS 
           6.3.1 KEY TECHNOLOGIES
                    6.3.1.1 Automation of egg separation technology to separate egg whites and yolks with high accuracy
           6.3.2 COMPLEMENTARY TECHNOLOGIES
                    6.3.2.1 High-pressure processing (HPP) and pulsed electric fields (PEF) technologies use intense pressure to eliminate harmful bacteria
           6.3.3 ADJACENT TECHNOLOGIES
                    6.3.3.1 Automation and robotics technologies improve efficiency, consistency, and safety
    6.4 PATENT ANALYSIS 
           FIGURE 33 LIST OF MAJOR PATENTS PERTAINING TO EGG PROCESSING MARKET, 2012–2024
           FIGURE 34 REGIONAL ANALYSIS OF PATENTS GRANTED, 2014–2023
           TABLE 4 LIST OF MAJOR PATENTS GRANTED, 2021–2023
    6.5 ECOSYSTEM ANALYSIS/MARKET MAP 
           6.5.1 DEMAND SIDE
           6.5.2 SUPPLY SIDE
                    FIGURE 35 EGG PROCESSING MARKET: MARKET MAP
                    TABLE 5 EGG PROCESSING MARKET: ECOSYSTEM ANALYSIS
    6.6 TRADE ANALYSIS 
           TABLE 6 TOP 10 IMPORTERS AND EXPORTERS OF SHELL, FRESH, PRESERVED, OR COOKED EGGS, 2022 (USD THOUSAND)
           TABLE 7 TOP 10 IMPORTERS AND EXPORTERS OF SHELL, FRESH, PRESERVED, OR COOKED EGGS, 2022 (USD TONS)
    6.7 PRICING ANALYSIS 
           6.7.1 AVERAGE SELLING PRICE TREND, BY PRODUCT TYPE
                    FIGURE 36 GLOBAL: AVERAGE SELLING PRICE TREND, BY PRODUCT TYPE (USD/KG)
           6.7.2 AVERAGE SELLING PRICE TREND OF KEY PLAYERS, BY PRODUCT TYPE
                    TABLE 8 EGG PROCESSING MARKET: AVERAGE SELLING PRICE (ASP), BY PRODUCT TYPE, 2019–2023 (USD/KG)
           6.7.3 AVERAGE SELLING PRICE TREND OF KEY PLAYERS, BY REGION
                    TABLE 9 EGG PROCESSING MARKET: AVERAGE SELLING PRICE (ASP), BY REGION, 2019–2023 (USD/ KG)
    6.8 TRENDS AND DISRUPTIONS IMPACTING CUSTOMERS’ BUSINESSES 
           FIGURE 37 TRENDS AND DISRUPTIONS IMPACTING CUSTOMERS’ BUSINESSES
    6.9 KEY CONFERENCES & EVENTS 
           TABLE 10 KEY CONFERENCES & EVENTS, 2024
    6.10 TARIFF AND REGULATORY LANDSCAPE 
           6.10.1 REGULATORY BODIES, GOVERNMENT AGENCIES, AND OTHER ORGANIZATIONS
                    TABLE 11 NORTH AMERICA: LIST OF REGULATORY BODIES, GOVERNMENT AGENCIES, AND OTHER ORGANIZATIONS
                    TABLE 12 EUROPE: LIST OF REGULATORY BODIES, GOVERNMENT AGENCIES, AND OTHER ORGANIZATIONS
                    TABLE 13 ASIA PACIFIC: LIST OF REGULATORY BODIES, GOVERNMENT AGENCIES, AND OTHER ORGANIZATIONS
           6.10.2 REGULATORY LANDSCAPE
                    6.10.2.1 NORTH AMERICA
                               6.10.2.1.1 US
                               6.10.2.1.2 Canada
                    6.10.2.2 EUROPEAN UNION
                    6.10.2.3 ASIA PACIFIC
                               6.10.2.3.1 Japan
                               6.10.2.3.2 India
                    6.10.2.4 SOUTH AMERICA
                               6.10.2.4.1 Brazil
                               6.10.2.4.2 Argentina
    6.11 CASE STUDY ANALYSIS 
           6.11.1 CAL-MAINE FOODS COMMITTED TO SUSTAINABILITY FOR ETHICAL AND ENVIRONMENTAL ADVANCEMENT
           6.11.2 SANOVO TECHNOLOGY GROUP OPTIMIZED PRODUCTION WITH DATA-DRIVEN INSIGHTS
           6.11.3 GRANJA CAMPOMAYOR IMPLEMENTED ERP SOLUTION FOR ENHANCED INVENTORY CONTROL, LABELING ACCURACY, AND ORDER-HANDLING EFFICIENCY
    6.12 PORTER’S FIVE FORCES ANALYSIS 
                    TABLE 14 EGG PROCESSING MARKET: PORTER’S FIVE FORCES ANALYSIS
                    FIGURE 38 EGG PROCESSING MARKET: PORTER’S FIVE FORCES ANALYSIS
           6.12.1 DEGREE OF COMPETITION
           6.12.2 THREAT OF NEW ENTRANTS
           6.12.3 THREAT OF SUBSTITUTES
           6.12.4 BARGAINING POWER OF SUPPLIERS
           6.12.5 BARGAINING POWER OF BUYERS
    6.13 KEY STAKEHOLDERS AND BUYING CRITERIA 
           6.13.1 KEY STAKEHOLDERS IN BUYING PROCESS
                    FIGURE 39 INFLUENCE OF STAKEHOLDERS ON BUYING PROCESS FOR PRODUCT TYPES
                    TABLE 15 INFLUENCE OF STAKEHOLDERS ON BUYING PROCESS FOR PRODUCT TYPES
           6.13.2 BUYING CRITERIA
                    TABLE 16 KEY CRITERIA FOR SELECTING SUPPLIER/VENDOR
                    FIGURE 40 KEY CRITERIA FOR SELECTING SUPPLIER/VENDOR
    6.14 EGG PROCESSING MARKET: INVESTMENT AND FUNDING SCENARIO 
                    FIGURE 41 INVESTOR DEALS AND FUNDING IN EGG PROCESSING MARKET
                    FIGURE 42 KEY EGG PROCESSING FIRMS, 2022 (USD BILLION)
 
7 EGG PROCESSING MARKET, BY PRODUCT TYPE (Page No. - 109)
    7.1 INTRODUCTION 
           FIGURE 43 EGG PROCESSING MARKET, BY PRODUCT TYPE, 2024 VS. 2029 (USD MILLION)
           TABLE 17 EGG PROCESSING MARKET, BY PRODUCT TYPE, 2019–2023 (USD MILLION)
           TABLE 18 EGG PROCESSING MARKET, BY PRODUCT TYPE, 2024–2029 (USD MILLION)
           TABLE 19 EGG PROCESSING MARKET, BY PRODUCT TYPE, 2019–2023 (KT)
           TABLE 20 EGG PROCESSING MARKET, BY PRODUCT TYPE, 2024–2029 (KT)
    7.2 DRIED EGG PRODUCTS 
           7.2.1 DRIED EGG PRODUCTS TO WITNESS BOOM WITH INDUSTRY LEADERS MEETING HEALTH-CONSCIOUS DEMANDS OF GLOBAL CONSUMERS
                    TABLE 21 DRIED EGG PRODUCTS: EGG PROCESSING MARKET, BY REGION, 2019–2023 (USD MILLION)
                    TABLE 22 DRIED EGG PRODUCTS: EGG PROCESSING MARKET, BY REGION, 2024–2029 (USD MILLION)
                    TABLE 23 DRIED EGG PRODUCTS: EGG PROCESSING MARKET, BY REGION, 2019–2023 (KT)
                    TABLE 24 DRIED EGG PRODUCTS: EGG PROCESSING MARKET, BY REGION, 2024–2029 (KT)
    7.3 LIQUID EGG PRODUCTS 
           7.3.1 WITH WIDE ADOPTION ACROSS SECTORS, LIQUID EGG PRODUCTS MARKET TO BE DRIVEN BY UNMATCHED CONVENIENCE, SAFETY, AND DIVERSE OFFERINGS
                    TABLE 25 LIQUID EGG PRODUCTS: EGG PROCESSING MARKET, BY REGION, 2019–2023 (USD MILLION)
                    TABLE 26 LIQUID EGG PRODUCTS: EGG PROCESSING MARKET, BY REGION, 2024–2029 (USD MILLION)
                    TABLE 27 LIQUID EGG PRODUCTS: EGG PROCESSING MARKET, BY REGION, 2019–2023 (KT)
                    TABLE 28 LIQUID EGG PRODUCTS: EGG PROCESSING MARKET, BY REGION, 2024–2029 (KT)
    7.4 FROZEN EGG PRODUCTS 
           7.4.1 FROZEN EGG PRODUCTS MARKET TO BE PROPELLED WITH RISING DEMAND FOR CONVENIENT BREAKFASTS
                    TABLE 29 FROZEN EGG PRODUCTS: EGG PROCESSING MARKET, BY REGION, 2019–2023 (USD MILLION)
                    TABLE 30 FROZEN EGG PRODUCTS: EGG PROCESSING MARKET, BY REGION, 2024–2029 (USD MILLION)
                    TABLE 31 FROZEN EGG PRODUCTS: EGG PROCESSING MARKET, BY REGION, 2019–2023 (KT)
                    TABLE 32 FROZEN EGG PRODUCTS: EGG PROCESSING MARKET, BY REGION, 2024–2029 (KT)
 
8 EGG PROCESSING MARKET, BY END-USE APPLICATION (Page No. - 117)
    8.1 INTRODUCTION 
           FIGURE 44 EGG PROCESSING MARKET, BY END-USE APPLICATION,  2024 VS. 2029 (USD MILLION)
           TABLE 33 EGG PROCESSING MARKET, BY END-USE APPLICATION, 2019–2023 (USD MILLION)
           TABLE 34 EGG PROCESSING MARKET, BY END-USE APPLICATION, 2024–2029 (USD MILLION)
           TABLE 35 EGG PROCESSING MARKET, BY END-USE APPLICATION, 2019–2023 (KT)
           TABLE 36 EGG PROCESSING MARKET, BY END-USE APPLICATION, 2024–2029 (KT)
    8.2 FOOD PROCESSING AND MANUFACTURING 
           8.2.1 FOOD PROCESSING AND MANUFACTURING TO BOOM DUE TO INCREASING DEMAND FOR VERSATILE EGG PRODUCTS, DRIVEN BY THEIR ESSENTIAL ROLES IN ENHANCING TEXTURE OF CULINARY CREATIONS
                    TABLE 37 FOOD PROCESSING AND MANUFACTURING: EGG PROCESSING MARKET, BY REGION, 2019–2023 (USD MILLION)
                    TABLE 38 FOOD PROCESSING AND MANUFACTURING: EGG PROCESSING MARKET, BY REGION, 2024–2029 (USD MILLION)
                    TABLE 39 FOOD PROCESSING AND MANUFACTURING: EGG PROCESSING MARKET, BY REGION, 2019–2023 (KT)
                    TABLE 40 FOOD PROCESSING AND MANUFACTURING: EGG PROCESSING MARKET, BY REGION, 2024–2029 (KT)
                    TABLE 41 EGG PROCESSING MARKET, BY FOOD PROCESSING AND MANUFACTURING, 2019–2023 (USD MILLION)
                    TABLE 42 EGG PROCESSING MARKET, BY FOOD PROCESSING AND MANUFACTURING, 2024–2029 (USD MILLION)
                    TABLE 43 EGG PROCESSING MARKET, BY FOOD PROCESSING AND MANUFACTURING, 2019–2023 (KT)
                    TABLE 44 EGG PROCESSING MARKET, BY FOOD PROCESSING AND MANUFACTURING, 2024–2029 (KT)
           8.2.2 PROCESSED FOODS AND READY MEALS
                    8.2.2.1 Innovations in product offerings and market expansion to fuel egg processing industry for plant-based and conventional ready meals
                               TABLE 45 PROCESSED FOOD AND READY MEALS: EGG PROCESSING MARKET, BY REGION, 2019–2023 (USD MILLION)
                               TABLE 46 PROCESSED FOOD AND READY MEALS: EGG PROCESSING MARKET, BY REGION, 2024–2029 (USD MILLION)
                               TABLE 47 PROCESSED FOOD AND READY MEALS: EGG PROCESSING MARKET, BY REGION, 2019–2023 (KT)
                               TABLE 48 PROCESSED FOOD AND READY MEALS: EGG PROCESSING MARKET, BY REGION, 2024–2029 (KT)
           8.2.3 BAKERY AND CONFECTIONERY
                    8.2.3.1 Leveraging egg processing innovations for superior quality and functionality to enhance growth in bakery and confectionery industry
                               TABLE 49 BAKERY AND CONFECTIONERY: EGG PROCESSING MARKET, BY REGION, 2019–2023 (USD MILLION)
                               TABLE 50 BAKERY AND CONFECTIONERY: EGG PROCESSING MARKET, BY REGION, 2024–2029 (USD MILLION)
                               TABLE 51 BAKERY AND CONFECTIONERY: EGG PROCESSING MARKET, BY REGION, 2019–2023 (KT)
                               TABLE 52 BAKERY AND CONFECTIONERY: EGG PROCESSING MARKET, BY REGION, 2024–2029 (KT)
           8.2.4 DIETARY SUPPLEMENTS
                    8.2.4.1 Egg processing industry to witness growth by meeting rising demand for nutrient-rich dietary supplements
                               TABLE 53 DIETARY SUPPLEMENTS: EGG PROCESSING MARKET, BY REGION, 2019–2023 (USD MILLION)
                               TABLE 54 DIETARY SUPPLEMENTS: EGG PROCESSING MARKET, BY REGION, 2024–2029 (USD MILLION)
                               TABLE 55 DIETARY SUPPLEMENTS: EGG PROCESSING MARKET, BY REGION, 2019–2023 (KT)
                               TABLE 56 DIETARY SUPPLEMENTS: EGG PROCESSING MARKET, BY REGION, 2024–2029 (KT)
           8.2.5 OTHERS
                    TABLE 57 OTHERS: EGG PROCESSING MARKET, BY REGION, 2019–2023 (USD MILLION)
                    TABLE 58 OTHERS: EGG PROCESSING MARKET, BY REGION, 2024–2029 (USD MILLION)
                    TABLE 59 OTHERS: EGG PROCESSING MARKET, BY REGION, 2019–2023 (KT)
                    TABLE 60 OTHERS: EGG PROCESSING MARKET, BY REGION, 2024–2029 (KT)
    8.3 FOODSERVICE 
           8.3.1 FOODSERVICE MARKET GROWTH TO BE DRIVEN BY DIVERSE EGG PRODUCTS MEETING VARIED CULINARY NEEDS WITH FOCUS ON CONVENIENCE, SAFETY, AND QUALITY
                    TABLE 61 FOODSERVICE: EGG PROCESSING MARKET, BY REGION, 2019–2023 (USD MILLION)
                    TABLE 62 FOODSERVICE: EGG PROCESSING MARKET, BY REGION, 2024–2029 (USD MILLION)
                    TABLE 63 FOODSERVICE: EGG PROCESSING MARKET, BY REGION, 2019–2023 (KT)
                    TABLE 64 FOODSERVICE: EGG PROCESSING MARKET, BY REGION, 2024–2029 (KT)
    8.4 RETAIL 
           8.4.1 RETAIL CHANNELS TO FUEL GLOBAL ADOPTION OF EGG-BASED INGREDIENTS IN HOME KITCHENS
                    TABLE 65 RETAIL: EGG PROCESSING MARKET, BY REGION, 2019–2023 (USD MILLION)
                    TABLE 66 RETAIL: EGG PROCESSING MARKET, BY REGION, 2024–2029 (USD MILLION)
                    TABLE 67 RETAIL: EGG PROCESSING MARKET, BY REGION, 2019–2023 (KT)
                    TABLE 68 RETAIL: EGG PROCESSING MARKET, BY REGION, 2024–2029 (KT)
 
9 EGG PROCESSING MARKET, BY NATURE (Page No. - 134)
    9.1 INTRODUCTION 
           FIGURE 45 EGG PROCESSING MARKET, BY NATURE, 2024 VS. 2029 (USD MILLION)
           TABLE 69 EGG PROCESSING MARKET, BY NATURE, 2019–2023 (USD MILLION)
           TABLE 70 EGG PROCESSING MARKET, BY NATURE, 2024–2029 (USD MILLION)
           TABLE 71 EGG PROCESSING MARKET, BY NATURE, 2019–2023 (KT)
           TABLE 72 EGG PROCESSING MARKET, BY NATURE, 2024–2029 (KT)
    9.2 ORGANIC EGG PRODUCTS 
           9.2.1 ORGANIC EGG PRODUCTS FUELED BY SUSTAINABLE FARMING PRACTICES, PROPELLING ORGANIC EGG PROCESSING MARKET AMID HEALTH-CONSCIOUS DEMAND
                    TABLE 73 ORGANIC EGG PRODUCTS: EGG PROCESSING MARKET, BY REGION, 2019–2023 (USD MILLION)
                    TABLE 74 ORGANIC EGG PRODUCTS: EGG PROCESSING MARKET, BY REGION, 2024–2029 (USD MILLION)
                    TABLE 75 ORGANIC EGG PRODUCTS: EGG PROCESSING MARKET, BY REGION, 2019–2023 (KT)
                    TABLE 76 ORGANIC EGG PRODUCTS: EGG PROCESSING MARKET, BY REGION, 2024–2029 (KT)
    9.3 INORGANIC EGG PRODUCTS 
           9.3.1 INORGANIC EGG PRODUCTS TO FUEL GROWTH IN EGG PROCESSING MARKET, MEETING DIVERSE CONSUMER AND BUSINESS NEEDS WITH AFFORDABLE PROTEIN SOURCES
                    TABLE 77 INORGANIC EGG PRODUCTS: EGG PROCESSING MARKET, BY REGION, 2019–2023 (USD MILLION)
                    TABLE 78 INORGANIC EGG PRODUCTS: EGG PROCESSING MARKET, BY REGION, 2024–2029 (USD MILLION)
                    TABLE 79 INORGANIC EGG PRODUCTS: EGG PROCESSING MARKET, BY REGION, 2019–2023 (KT)
                    TABLE 80 INORGANIC EGG PRODUCTS: EGG PROCESSING MARKET, BY REGION, 2024–2029 (KT)
 
10 EGG PROCESSING MARKET, BY REGION (Page No. - 141)
     10.1 INTRODUCTION 
               FIGURE 46 INDIA TO BE FASTEST-GROWING COUNTRY IN EGG PROCESSING MARKET
               TABLE 81 EGG PROCESSING MARKET, BY REGION, 2019–2023 (USD MILLION)
               TABLE 82 EGG PROCESSING MARKET, BY REGION, 2024–2029 (USD MILLION)
               TABLE 83 EGG PROCESSING MARKET, BY REGION, 2019–2023 (KT)
               TABLE 84 EGG PROCESSING MARKET, BY REGION, 2024–2029 (KT)
     10.2 NORTH AMERICA 
               FIGURE 47 NORTH AMERICA: EGG PROCESSING MARKET SNAPSHOT, 2024
               TABLE 85 NORTH AMERICA: EGG PROCESSING MARKET, BY COUNTRY, 2019–2023 (USD MILLION)
               TABLE 86 NORTH AMERICA: EGG PROCESSING MARKET, BY COUNTRY, 2024–2029 (USD MILLION)
               TABLE 87 NORTH AMERICA: EGG PROCESSING MARKET, BY COUNTRY, 2019–2023 (KT)
               TABLE 88 NORTH AMERICA: EGG PROCESSING MARKET, BY COUNTRY, 2024–2029 (KT)
               TABLE 89 NORTH AMERICA: EGG PROCESSING MARKET, BY PRODUCT TYPE, 2019–2023 (USD MILLION)
               TABLE 90 NORTH AMERICA: EGG PROCESSING MARKET, BY PRODUCT TYPE, 2024–2029 (USD MILLION)
               TABLE 91 NORTH AMERICA: EGG PROCESSING MARKET, BY PRODUCT TYPE, 2019–2023 (KT)
               TABLE 92 NORTH AMERICA: EGG PROCESSING MARKET, BY PRODUCT TYPE, 2024–2029 (KT)
               TABLE 93 NORTH AMERICA: EGG PROCESSING MARKET, BY END-USE APPLICATION, 2019–2023 (USD MILLION)
               TABLE 94 NORTH AMERICA: EGG PROCESSING MARKET, BY END-USE APPLICATION, 2024–2029 (USD MILLION)
               TABLE 95 NORTH AMERICA: EGG PROCESSING MARKET, BY END-USE APPLICATION, 2019–2023 (KT)
               TABLE 96 NORTH AMERICA: EGG PROCESSING MARKET, BY END-USE APPLICATION, 2024–2029 (KT)
               TABLE 97 NORTH AMERICA: EGG PROCESSING MARKET, BY FOOD PROCESSING AND MANUFACTURING, 2019–2023 (USD MILLION)
               TABLE 98 NORTH AMERICA: EGG PROCESSING MARKET, BY FOOD PROCESSING AND MANUFACTURING, 2024–2029 (USD MILLION)
               TABLE 99 NORTH AMERICA: EGG PROCESSING MARKET, BY FOOD PROCESSING AND MANUFACTURING, 2019–2023 (KT)
               TABLE 100 NORTH AMERICA: EGG PROCESSING MARKET, BY FOOD PROCESSING AND MANUFACTURING, 2024–2029 (KT)
               TABLE 101 NORTH AMERICA: EGG PROCESSING MARKET, BY NATURE, 2019–2023 (USD MILLION)
               TABLE 102 NORTH AMERICA: EGG PROCESSING MARKET, BY NATURE, 2024–2029 (USD MILLION)
               TABLE 103 NORTH AMERICA: EGG PROCESSING MARKET, BY NATURE, 2019–2023 (KT)
               TABLE 104 NORTH AMERICA: EGG PROCESSING MARKET, BY NATURE, 2024–2029 (KT)
             10.2.1 NORTH AMERICA: RECESSION IMPACT ANALYSIS
                       FIGURE 48 NORTH AMERICAN EGG PROCESSING MARKET: RECESSION IMPACT ANALYSIS
             10.2.2 US
                       10.2.2.1 Consumer inclination toward protein-rich foods due to rising prevalence of health diseases to propel market growth
                                   TABLE 105 US: EGG PROCESSING MARKET, BY PRODUCT TYPE, 2019–2023 (USD MILLION)
                                   TABLE 106 US: EGG PROCESSING MARKET, BY PRODUCT TYPE, 2024–2029 (USD MILLION)
                                   TABLE 107 US: EGG PROCESSING MARKET, BY PRODUCT TYPE, 2019–2023 (KT)
                                   TABLE 108 US: EGG PROCESSING MARKET, BY PRODUCT TYPE, 2024–2029 (KT)
             10.2.3 CANADA
                       10.2.3.1 Consumer preferences for convenience, safety, and nutrition to boost egg processing market
                                   TABLE 109 CANADA: EGG PROCESSING MARKET, BY PRODUCT TYPE, 2019–2023 (USD MILLION)
                                   TABLE 110 CANADA: EGG PROCESSING MARKET, BY PRODUCT TYPE, 2024–2029 (USD MILLION)
                                   TABLE 111 CANADA: EGG PROCESSING MARKET, BY PRODUCT TYPE, 2019–2023 (KT)
                                   TABLE 112 CANADA: EGG PROCESSING MARKET, BY PRODUCT TYPE, 2024–2029 (KT)
             10.2.4 MEXICO
                       10.2.4.1 Growing foodservice industry to create high demand for pre-prepared egg products, thereby boosting market
                                   TABLE 113 MEXICO: EGG PROCESSING MARKET, BY PRODUCT TYPE, 2019–2023 (USD MILLION)
                                   TABLE 114 MEXICO: EGG PROCESSING MARKET, BY PRODUCT TYPE, 2024–2029 (USD MILLION)
                                   TABLE 115 MEXICO: EGG PROCESSING MARKET, BY PRODUCT TYPE, 2019–2023 (KT)
                                   TABLE 116 MEXICO: EGG PROCESSING MARKET, BY PRODUCT TYPE, 2024–2029 (KT)
     10.3 EUROPE 
               TABLE 117 EUROPE: EGG PROCESSING MARKET, BY COUNTRY, 2019–2023 (USD MILLION)
               TABLE 118 EUROPE: EGG PROCESSING MARKET, BY COUNTRY, 2024–2029 (USD MILLION)
               TABLE 119 EUROPE: EGG PROCESSING MARKET, BY COUNTRY, 2019–2023 (KT)
               TABLE 120 EUROPE: EGG PROCESSING MARKET, BY COUNTRY, 2024–2029 (KT)
               TABLE 121 EUROPE: EGG PROCESSING MARKET, BY PRODUCT TYPE, 2019–2023 (USD MILLION)
               TABLE 122 EUROPE: EGG PROCESSING MARKET, BY PRODUCT TYPE, 2024–2029 (USD MILLION)
               TABLE 123 EUROPE: EGG PROCESSING MARKET, BY PRODUCT TYPE, 2019–2023 (KT)
               TABLE 124 EUROPE: EGG PROCESSING MARKET, BY PRODUCT TYPE, 2024–2029 (KT)
               TABLE 125 EUROPE: EGG PROCESSING MARKET, BY END-USE APPLICATION, 2019–2023 (USD MILLION)
               TABLE 126 EUROPE: EGG PROCESSING MARKET, BY END-USE APPLICATION, 2024–2029 (USD MILLION)
               TABLE 127 EUROPE: EGG PROCESSING MARKET, BY END-USE APPLICATION, 2019–2023 (KT)
               TABLE 128 EUROPE: EGG PROCESSING MARKET, BY END-USE APPLICATION, 2024–2029 (KT)
               TABLE 129 EUROPE: EGG PROCESSING MARKET, BY FOOD PROCESSING AND MANUFACTURING, 2019–2023 (USD MILLION)
               TABLE 130 EUROPE: EGG PROCESSING MARKET, BY FOOD PROCESSING AND MANUFACTURING, 2024–2029 (USD MILLION)
               TABLE 131 EUROPE: EGG PROCESSING MARKET, BY FOOD PROCESSING AND MANUFACTURING, 2019–2023 (KT)
               TABLE 132 EUROPE: EGG PROCESSING MARKET, BY FOOD PROCESSING AND MANUFACTURING, 2024–2029 (KT)
               TABLE 133 EUROPE: EGG PROCESSING MARKET, BY NATURE, 2019–2023 (USD MILLION)
               TABLE 134 EUROPE: EGG PROCESSING MARKET, BY NATURE, 2024–2029 (USD MILLION)
               TABLE 135 EUROPE: EGG PROCESSING MARKET, BY NATURE, 2019–2023 (KT)
               TABLE 136 EUROPE: EGG PROCESSING MARKET, BY NATURE, 2024–2029 (KT)
             10.3.1 EUROPE: RECESSION IMPACT ANALYSIS
                       FIGURE 49 EUROPEAN EGG PROCESSING MARKET: RECESSION IMPACT ANALYSIS
             10.3.2 GERMANY
                       10.3.2.1 Free-range farming and diversification of egg production in Germany leading to growth in egg processing market
                                   TABLE 137 GERMANY: EGG PROCESSING MARKET, BY PRODUCT TYPE, 2019–2023 (USD MILLION)
                                   TABLE 138 GERMANY: EGG PROCESSING MARKET, BY PRODUCT TYPE, 2024–2029 (USD MILLION)
                                   TABLE 139 GERMANY: EGG PROCESSING MARKET, BY PRODUCT TYPE, 2019–2023 (KT)
                                   TABLE 140 GERMANY: EGG PROCESSING MARKET, BY PRODUCT TYPE, 2024–2029 (KT)
             10.3.3 FRANCE
                       10.3.3.1 Increasing adoption of cage-free methods in response to changing consumer preferences to fuel market growth
                                   TABLE 141 FRANCE: EGG PROCESSING MARKET, BY PRODUCT TYPE, 2019–2023 (USD MILLION)
                                   TABLE 142 FRANCE: EGG PROCESSING MARKET, BY PRODUCT TYPE, 2024–2029 (USD MILLION)
                                   TABLE 143 FRANCE: EGG PROCESSING MARKET, BY PRODUCT TYPE, 2019–2023 (KT)
                                   TABLE 144 FRANCE: EGG PROCESSING MARKET, BY PRODUCT TYPE, 2024–2029 (KT)
             10.3.4 UK
                       10.3.4.1 UK's egg processing market to thrive, demonstrating impressive growth and resilience
                                   TABLE 145 UK: EGG PROCESSING MARKET, BY PRODUCT TYPE, 2019–2023 (USD MILLION)
                                   TABLE 146 UK: EGG PROCESSING MARKET, BY PRODUCT TYPE, 2024–2029 (USD MILLION)
                                   TABLE 147 UK: EGG PROCESSING MARKET, BY PRODUCT TYPE, 2019–2023 (KT)
                                   TABLE 148 UK: EGG PROCESSING MARKET, BY PRODUCT TYPE, 2024–2029 (KT)
             10.3.5 ITALY
                       10.3.5.1 Investments in advanced processing technology to enhance efficiency, safety, and product quality
                                   TABLE 149 ITALY: EGG PROCESSING MARKET, BY PRODUCT TYPE, 2019–2023 (USD MILLION)
                                   TABLE 150 ITALY: EGG PROCESSING MARKET, BY PRODUCT TYPE, 2024–2029 (USD MILLION)
                                   TABLE 151 ITALY: EGG PROCESSING MARKET, BY PRODUCT TYPE, 2019–2023 (KT)
                                   TABLE 152 ITALY: EGG PROCESSING MARKET, BY PRODUCT TYPE, 2024–2029 (KT)
             10.3.6 SPAIN
                       10.3.6.1 Shift toward cage-free eggs to drive growth in Spain’s egg processing industry
                                   TABLE 153 SPAIN: EGG PROCESSING MARKET, BY PRODUCT TYPE, 2019–2023 (USD MILLION)
                                   TABLE 154 SPAIN: EGG PROCESSING MARKET, BY PRODUCT TYPE, 2024–2029 (USD MILLION)
                                   TABLE 155 SPAIN: EGG PROCESSING MARKET, BY PRODUCT TYPE, 2019–2023 (KT)
                                   TABLE 156 SPAIN: EGG PROCESSING MARKET, BY PRODUCT TYPE, 2024–2029 (KT)
             10.3.7 REST OF EUROPE
                       TABLE 157 REST OF EUROPE: EGG PROCESSING MARKET, BY PRODUCT TYPE, 2019–2023 (USD MILLION)
                       TABLE 158 REST OF EUROPE: EGG PROCESSING MARKET, BY PRODUCT TYPE, 2024–2029 (USD MILLION)
                       TABLE 159 REST OF EUROPE: EGG PROCESSING MARKET, BY PRODUCT TYPE, 2019–2023 (KT)
                       TABLE 160 REST OF EUROPE: EGG PROCESSING MARKET, BY PRODUCT TYPE, 2024–2029 (KT)
     10.4 ASIA PACIFIC 
               FIGURE 50 ASIA PACIFIC: EGG PROCESSING MARKET SNAPSHOT, 2024
               TABLE 161 ASIA PACIFIC: EGG PROCESSING MARKET, BY COUNTRY, 2019–2023 (USD MILLION)
               TABLE 162 ASIA PACIFIC: EGG PROCESSING MARKET, BY COUNTRY, 2024–2029 (USD MILLION)
               TABLE 163 ASIA PACIFIC: EGG PROCESSING MARKET, BY COUNTRY, 2019–2023 (KT)
               TABLE 164 ASIA PACIFIC: EGG PROCESSING MARKET, BY COUNTRY, 2024–2029 (KT)
               TABLE 165 ASIA PACIFIC: EGG PROCESSING MARKET, BY PRODUCT TYPE, 2019–2023 (USD MILLION)
               TABLE 166 ASIA PACIFIC: EGG PROCESSING MARKET, BY PRODUCT TYPE, 2024–2029 (USD MILLION)
               TABLE 167 ASIA PACIFIC: EGG PROCESSING MARKET, BY PRODUCT TYPE, 2019–2023 (KT)
               TABLE 168 ASIA PACIFIC: EGG PROCESSING MARKET, BY PRODUCT TYPE, 2024–2029 (KT)
               TABLE 169 ASIA PACIFIC: EGG PROCESSING MARKET, BY END-USE APPLICATION, 2019–2023 (USD MILLION)
               TABLE 170 ASIA PACIFIC: EGG PROCESSING MARKET, BY END-USE APPLICATION, 2024–2029 (USD MILLION)
               TABLE 171 ASIA PACIFIC: EGG PROCESSING MARKET, BY END-USE APPLICATION, 2019–2023 (KT)
               TABLE 172 ASIA PACIFIC: EGG PROCESSING MARKET, BY END-USE APPLICATION, 2024–2029 (KT)
               TABLE 173 ASIA PACIFIC: EGG PROCESSING MARKET, BY FOOD PROCESSING AND MANUFACTURING, 2019–2023 (USD MILLION)
               TABLE 174 ASIA PACIFIC: EGG PROCESSING MARKET, BY FOOD PROCESSING AND MANUFACTURING, 2024–2029 (USD MILLION)
               TABLE 175 ASIA PACIFIC: EGG PROCESSING MARKET, BY FOOD PROCESSING AND MANUFACTURING, 2019–2023 (KT)
               TABLE 176 ASIA PACIFIC: EGG PROCESSING MARKET, BY FOOD PROCESSING AND MANUFACTURING, 2024–2029 (KT)
               TABLE 177 ASIA PACIFIC: EGG PROCESSING MARKET, BY NATURE, 2019–2023 (USD MILLION)
               TABLE 178 ASIA PACIFIC: EGG PROCESSING MARKET, BY NATURE, 2024–2029 (USD MILLION)
               TABLE 179 ASIA PACIFIC: EGG PROCESSING MARKET, BY NATURE, 2019–2023 (KT)
               TABLE 180 ASIA PACIFIC: EGG PROCESSING MARKET, BY NATURE, 2024–2029 (KT)
             10.4.1 ASIA PACIFIC: RECESSION IMPACT ANALYSIS
                       FIGURE 51 ASIA PACIFIC EGG PROCESSING MARKET: RECESSION IMPACT ANALYSIS
             10.4.2 CHINA
                       10.4.2.1 Expansion of egg production variety in China to enhance growth outlook for egg processing market
                                   TABLE 181 CHINA: EGG PROCESSING MARKET, BY PRODUCT TYPE, 2019–2023 (USD MILLION)
                                   TABLE 182 CHINA: EGG PROCESSING MARKET, BY PRODUCT TYPE, 2024–2029 (USD MILLION)
                                   TABLE 183 CHINA: EGG PROCESSING MARKET, BY PRODUCT TYPE, 2019–2023 (KT)
                                   TABLE 184 CHINA: EGG PROCESSING MARKET, BY PRODUCT TYPE, 2024–2029 (KT)
             10.4.3 JAPAN
                       10.4.3.1 Impact of import-export dynamics on Japan's egg processing market to fuel market growth
                                   TABLE 185 JAPAN: EGG PROCESSING MARKET, BY PRODUCT TYPE, 2019–2023 (USD MILLION)
                                   TABLE 186 JAPAN: EGG PROCESSING MARKET, BY PRODUCT TYPE, 2024–2029 (USD MILLION)
                                   TABLE 187 JAPAN: EGG PROCESSING MARKET, BY PRODUCT TYPE, 2019–2023 (KT)
                                   TABLE 188 JAPAN: EGG PROCESSING MARKET, BY PRODUCT TYPE, 2024–2029 (KT)
             10.4.4 INDIA
                       10.4.4.1 Egg production capacity and export dominance fueling egg processing industry growth
                                   TABLE 189 INDIA: EGG PROCESSING MARKET, BY PRODUCT TYPE, 2019–2023 (USD MILLION)
                                   TABLE 190 INDIA: EGG PROCESSING MARKET, BY PRODUCT TYPE, 2024–2029 (USD MILLION)
                                   TABLE 191 INDIA: EGG PROCESSING MARKET, BY PRODUCT TYPE, 2019–2023 (KT)
                                   TABLE 192 INDIA: EGG PROCESSING MARKET, BY PRODUCT TYPE, 2024–2029 (KT)
             10.4.5 AUSTRALIA & NEW ZEALAND
                       10.4.5.1 Scaling operations and regional research in Australia and New Zealand to promote egg industry
                                   FIGURE 52 AUSTRALIA: EGG CONSUMPTION PER CAPITA, PER PERSON, 2018–2023
                                   TABLE 193 AUSTRALIA & NEW ZEALAND: EGG PROCESSING MARKET, BY PRODUCT TYPE, 2019–2023 (USD MILLION)
                                   TABLE 194 AUSTRALIA & NEW ZEALAND: EGG PROCESSING MARKET, BY PRODUCT TYPE, 2024–2029 (USD MILLION)
                                   TABLE 195 AUSTRALIA & NEW ZEALAND: EGG PROCESSING MARKET, BY PRODUCT TYPE, 2019–2023 (KT)
                                   TABLE 196 AUSTRALIA & NEW ZEALAND: EGG PROCESSING MARKET, BY PRODUCT TYPE, 2024–2029 (KT)
             10.4.6 REST OF ASIA PACIFIC
                       TABLE 197 REST OF ASIA PACIFIC: EGG PROCESSING MARKET, BY PRODUCT TYPE, 2019–2023 (USD MILLION)
                       TABLE 198 REST OF ASIA PACIFIC: EGG PROCESSING MARKET, BY PRODUCT TYPE, 2024–2029 (USD MILLION)
                       TABLE 199 REST OF ASIA PACIFIC: EGG PROCESSING MARKET, BY PRODUCT TYPE, 2019–2023 (KT)
                       TABLE 200 REST OF ASIA PACIFIC: EGG PROCESSING MARKET, BY PRODUCT TYPE, 2024–2029 (KT)
     10.5 SOUTH AMERICA 
               TABLE 201 SOUTH AMERICA: EGG PROCESSING MARKET, BY COUNTRY, 2019–2023 (USD MILLION)
               TABLE 202 SOUTH AMERICA: EGG PROCESSING MARKET, BY COUNTRY, 2024–2029 (USD MILLION)
               TABLE 203 SOUTH AMERICA: EGG PROCESSING MARKET, BY COUNTRY, 2019–2023 (KT)
               TABLE 204 SOUTH AMERICA: EGG PROCESSING MARKET, BY COUNTRY, 2024–2029 (KT)
               TABLE 205 SOUTH AMERICA: EGG PROCESSING MARKET, BY PRODUCT TYPE, 2019–2023 (USD MILLION)
               TABLE 206 SOUTH AMERICA: EGG PROCESSING MARKET, BY PRODUCT TYPE, 2024–2029 (USD MILLION)
               TABLE 207 SOUTH AMERICA: EGG PROCESSING MARKET, BY PRODUCT TYPE, 2019–2023 (KT)
               TABLE 208 SOUTH AMERICA: EGG PROCESSING MARKET, BY PRODUCT TYPE, 2024–2029 (KT)
               TABLE 209 SOUTH AMERICA: EGG PROCESSING MARKET, BY END-USE APPLICATION, 2019–2023 (USD MILLION)
               TABLE 210 SOUTH AMERICA: EGG PROCESSING MARKET, BY END-USE APPLICATION, 2024–2029 (USD MILLION)
               TABLE 211 SOUTH AMERICA: EGG PROCESSING MARKET, BY END-USE APPLICATION, 2019–2023 (KT)
               TABLE 212 SOUTH AMERICA: EGG PROCESSING MARKET, BY END-USE APPLICATION, 2024–2029 (KT)
               TABLE 213 SOUTH AMERICA: EGG PROCESSING MARKET, BY FOOD PROCESSING AND MANUFACTURING, 2019–2023 (USD MILLION)
               TABLE 214 SOUTH AMERICA: EGG PROCESSING MARKET, BY FOOD PROCESSING AND MANUFACTURING, 2024–2029 (USD MILLION)
               TABLE 215 SOUTH AMERICA: EGG PROCESSING MARKET, BY FOOD PROCESSING AND MANUFACTURING, 2019–2023 (KT)
               TABLE 216 SOUTH AMERICA: EGG PROCESSING MARKET, BY FOOD PROCESSING AND MANUFACTURING, 2024–2029 (KT)
               TABLE 217 SOUTH AMERICA: EGG PROCESSING MARKET, BY NATURE, 2019–2023 (USD MILLION)
               TABLE 218 SOUTH AMERICA: EGG PROCESSING MARKET, BY NATURE, 2024–2029 (USD MILLION)
               TABLE 219 SOUTH AMERICA: EGG PROCESSING MARKET, BY NATURE, 2019–2023 (KT)
               TABLE 220 SOUTH AMERICA: EGG PROCESSING MARKET, BY NATURE, 2024–2029 (KT)
             10.5.1 SOUTH AMERICA: RECESSION IMPACT ANALYSIS
                       FIGURE 53 SOUTH AMERICAN EGG PROCESSING MARKET: RECESSION IMPACT ANALYSIS
             10.5.2 BRAZIL
                       10.5.2.1 Expanding exports to open up new revenue streams for processors in Brazil
                                   TABLE 221 BRAZIL: EGG PROCESSING MARKET, BY PRODUCT TYPE, 2019–2023 (USD MILLION)
                                   TABLE 222 BRAZIL: EGG PROCESSING MARKET, BY PRODUCT TYPE, 2024–2029 (USD MILLION)
                                   TABLE 223 BRAZIL: EGG PROCESSING MARKET, BY PRODUCT TYPE, 2019–2023 (KT)
                                   TABLE 224 BRAZIL: EGG PROCESSING MARKET, BY PRODUCT TYPE, 2024–2029 (KT)
             10.5.3 ARGENTINA
                       10.5.3.1 Capitalizing on health trends: Growing opportunities in Argentina’s egg processing market
                                   TABLE 225 ARGENTINA: EGG PROCESSING MARKET, BY PRODUCT TYPE, 2019–2023 (USD MILLION)
                                   TABLE 226 ARGENTINA: EGG PROCESSING MARKET, BY PRODUCT TYPE, 2024–2029 (USD MILLION)
                                   TABLE 227 ARGENTINA: EGG PROCESSING MARKET, BY PRODUCT TYPE, 2019–2023 (KT)
                                   TABLE 228 ARGENTINA: EGG PROCESSING MARKET, BY PRODUCT TYPE, 2024–2029 (KT)
             10.5.4 REST OF SOUTH AMERICA
                       TABLE 229 REST OF SOUTH AMERICA: EGG PROCESSING MARKET, BY PRODUCT TYPE, 2019–2023 (USD MILLION)
                       TABLE 230 REST OF SOUTH AMERICA: EGG PROCESSING MARKET, BY PRODUCT TYPE, 2024–2029 (USD MILLION)
                       TABLE 231 REST OF SOUTH AMERICA: EGG PROCESSING MARKET, BY PRODUCT TYPE, 2019–2023 (KT)
                       TABLE 232 REST OF SOUTH AMERICA: EGG PROCESSING MARKET, BY PRODUCT TYPE, 2024–2029 (KT)
     10.6 REST OF THE WORLD (ROW) 
               TABLE 233 ROW: EGG PROCESSING MARKET, BY REGION, 2019–2023 (USD MILLION)
               TABLE 234 ROW: EGG PROCESSING MARKET, BY REGION, 2024–2029 (USD MILLION)
               TABLE 235 ROW: EGG PROCESSING MARKET, BY REGION, 2019–2023 (KT)
               TABLE 236 ROW: EGG PROCESSING MARKET, BY REGION, 2024–2029 (KT)
               TABLE 237 ROW: EGG PROCESSING MARKET, BY PRODUCT TYPE, 2019–2023 (USD MILLION)
               TABLE 238 ROW: EGG PROCESSING MARKET, BY PRODUCT TYPE, 2024–2029 (USD MILLION)
               TABLE 239 ROW: EGG PROCESSING MARKET, BY PRODUCT TYPE, 2019–2023 (KT)
               TABLE 240 ROW: EGG PROCESSING MARKET, BY PRODUCT TYPE, 2024–2029 (KT)
               TABLE 241 ROW: EGG PROCESSING MARKET, BY END-USE APPLICATION, 2019–2023 (USD MILLION)
               TABLE 242 ROW: EGG PROCESSING MARKET, BY END-USE APPLICATION, 2024–2029 (USD MILLION)
               TABLE 243 ROW: EGG PROCESSING MARKET, BY END-USE APPLICATION, 2019–2023 (KT)
               TABLE 244 ROW: EGG PROCESSING MARKET, BY END-USE APPLICATION, 2024–2029 (KT)
               TABLE 245 ROW: EGG PROCESSING MARKET, BY FOOD PROCESSING AND MANUFACTURING, 2019–2023 (USD MILLION)
               TABLE 246 ROW: EGG PROCESSING MARKET, BY FOOD PROCESSING AND MANUFACTURING, 2024–2029 (USD MILLION)
               TABLE 247 ROW: EGG PROCESSING MARKET, BY FOOD PROCESSING AND MANUFACTURING, 2019–2023 (KT)
               TABLE 248 ROW: EGG PROCESSING MARKET, BY FOOD PROCESSING AND MANUFACTURING, 2024–2029 (KT)
               TABLE 249 ROW: EGG PROCESSING MARKET, BY NATURE, 2019–2023 (USD MILLION)
               TABLE 250 ROW: EGG PROCESSING MARKET, BY NATURE, 2024–2029 (USD MILLION)
               TABLE 251 ROW: EGG PROCESSING MARKET, BY NATURE, 2019–2023 (KT)
               TABLE 252 ROW: EGG PROCESSING MARKET, BY NATURE, 2024–2029 (KT)
             10.6.1 ROW: RECESSION IMPACT ANALYSIS
                       FIGURE 54 ROW EGG PROCESSING MARKET: RECESSION IMPACT ANALYSIS
             10.6.2 AFRICA
                       10.6.2.1 FAO to invest in sustainable solutions for Rwanda’s egg market
                       10.6.2.2 South Africa
                       10.6.2.3 Nigeria
                       10.6.2.4 Rest of Africa
                                   TABLE 253 AFRICA: EGG PROCESSING MARKET, BY PRODUCT TYPE, 2019–2023 (USD MILLION)
                                   TABLE 254 AFRICA: EGG PROCESSING MARKET, BY PRODUCT TYPE, 2024–2029 (USD MILLION)
                                   TABLE 255 AFRICA: EGG PROCESSING MARKET, BY PRODUCT TYPE, 2019–2023 (KT)
                                   TABLE 256 AFRICA: EGG PROCESSING MARKET, BY PRODUCT TYPE, 2024–2029 (KT)
             10.6.3 MIDDLE EAST
                       10.6.3.1 Diversifying US egg product exports to meet growing demand in Middle East
                       10.6.3.2 UAE
                       10.6.3.3 Saudi Arabia
                       10.6.3.4 Iran
                       10.6.3.5 Rest of Middle East
                                   TABLE 257 MIDDLE EAST: EGG PROCESSING MARKET, BY PRODUCT TYPE, 2019–2023 (USD MILLION)
                                   TABLE 258 MIDDLE EAST: EGG PROCESSING MARKET, BY PRODUCT TYPE, 2024–2029 (USD MILLION)
                                   TABLE 259 MIDDLE EAST: EGG PROCESSING MARKET, BY PRODUCT TYPE, 2019–2023 (KT)
                                   TABLE 260 MIDDLE EAST: EGG PROCESSING MARKET, BY PRODUCT TYPE, 2024–2029 (KT)
 
11 COMPETITIVE LANDSCAPE (Page No. - 213)
     11.1 OVERVIEW 
     11.2 MARKET SHARE ANALYSIS, 2022 
               TABLE 261 EGG PROCESSING MARKET: INTENSITY OF COMPETITIVE RIVALRY
     11.3 KEY PLAYERS’ STRATEGIES/RIGHT TO WIN 
               TABLE 262 STRATEGIES ADOPTED BY KEY PLAYERS IN EGG PROCESSING MARKET
     11.4 REVENUE ANALYSIS 
               FIGURE 55 REVENUE ANALYSIS OF KEY MARKET PLAYERS, 2018–2023 (USD BILLION)
     11.5 KEY PLAYERS’ ANNUAL REVENUE VS. GROWTH 
               FIGURE 56 ANNUAL REVENUE, 2023 (USD BILLION) VS. REVENUE GROWTH, 2021–2023
     11.6 KEY PLAYERS’ EBIT/EBITDA 
               FIGURE 57 EBIT/EBITDA, 2023 (USD BILLION)
     11.7 BRAND/PRODUCT COMPARATIVE ANALYSIS 
             11.7.1 BRAND/PRODUCT COMPARATIVE ANALYSIS, BY PRODUCT TYPE
                       FIGURE 58 BRAND/PRODUCT COMPARATIVE ANALYSIS, BY PRODUCT TYPE
                       11.7.1.1 Le Naturelle
                       11.7.1.2 SKM Best Eggs
                       11.7.1.3 Ovostar
                       11.7.1.4 Sportprotein.Com
                       11.7.1.5 Eggland’s Best
     11.8 VALUATION AND FINANCIAL METRICS OF EGG PROCESSING COMPANIES 
               FIGURE 59 EV/EBITDA OF EGG PROCESSING, 2023
     11.9 GLOBAL SNAPSHOT OF KEY MARKET PARTICIPANTS 
               FIGURE 60 EGG PROCESSING MARKET: GLOBAL SNAPSHOT OF KEY PARTICIPANTS, 2023
     11.1 COMPANY EVALUATION MATRIX: KEY PLAYERS 
               11.10.1 STARS
               11.10.2 EMERGING LEADERS
               11.10.3 PERVASIVE PLAYERS
               11.10.4 PARTICIPANTS
                                   FIGURE 61 EGG PROCESSING MARKET, COMPANY EVALUATION MATRIX (KEY PLAYERS), 2023
               11.10.5 COMPANY FOOTPRINT
                                   TABLE 263 COMPANY PRODUCT TYPE FOOTPRINT
                                   TABLE 264 COMPANY END-USE APPLICATION FOOTPRINT
                                   TABLE 265 COMPANY REGION FOOTPRINT
                                   TABLE 266 OVERALL COMPANY FOOTPRINT
     11.11 COMPANY EVALUATION MATRIX: STARTUPS/SMES 
               11.11.1 PROGRESSIVE COMPANIES
               11.11.2 RESPONSIVE COMPANIES
               11.11.3 DYNAMIC COMPANIES
               11.11.4 STARTING BLOCKS
                                   FIGURE 62 EGG PROCESSING MARKET, COMPANY EVALUATION MATRIX (STARTUPS/SMES), 2023
               11.11.5 COMPETITIVE BENCHMARKING
            11.11.5.1 Detailed list of key startups/SMEs
                                   TABLE 267 EGG PROCESSING MARKET: DETAILED LIST OF KEY STARTUPS/SMES
                                   TABLE 268 EGG PROCESSING MARKET: COMPETITIVE BENCHMARKING OF KEY STARTUPS/SMES
     11.12 COMPETITIVE SCENARIO 
               11.12.1 PRODUCT LAUNCHES
                                   TABLE 269 EGG PROCESSING MARKET: PRODUCT LAUNCHES, SEPTEMBER 2020
               11.12.2 DEALS
                                   TABLE 270 EGG PROCESSING MARKET: DEALS, NOVEMBER 2019–JANUARY 2024
               11.12.3 EXPANSIONS
                                   TABLE 271 EGG PROCESSING MARKET: EXPANSIONS, JUNE 2020–JANUARY 2024
 
12 COMPANY PROFILES (Page No. - 232)
     12.1 KEY PLAYERS 
(Business Overview, Products Offered, Recent Developments, and MnM View (Key strengths/Right to Win, Strategic Choices Made, and Weaknesses and Competitive Threats))*
             12.1.1 CAL-MAINE FOODS, INC.
                       TABLE 272 CAL-MAINE FOODS, INC.: BUSINESS OVERVIEW
                       FIGURE 63 CAL-MAINE FOODS, INC.: COMPANY SNAPSHOT
                       TABLE 273 CAL-MAINE FOODS, INC.: PRODUCTS/SOLUTIONS/SERVICES OFFERED
                       TABLE 274 CAL-MAINE FOODS, INC.: DEALS, NOVEMBER 2019–JANUARY 2024
                       TABLE 275 CAL-MAINE FOODS, INC.: EXPANSION, JUNE 2020–DECEMBER 2023
             12.1.2 ROSE ACRE FARMS
                       TABLE 276 ROSE ACRE FARMS: BUSINESS OVERVIEW
                       TABLE 277 ROSE ACRE FARMS: PRODUCTS/SOLUTIONS/SERVICES OFFERED
                       TABLE 278 ROSE ACRE FARMS: DEALS, OCTOBER 2020–NOVEMBER 2023
                       TABLE 279 ROSE ACRE FARMS: EXPANSIONS, MAY 2023
             12.1.3 OVOBELFOODS.COM
                       TABLE 280 OVOBELFOODS.COM: BUSINESS OVERVIEW
                       FIGURE 64 OVOBELFOODS.COM: COMPANY SNAPSHOT
                       TABLE 281 OVOBELFOODS.COM: PRODUCTS/SOLUTIONS/SERVICES OFFERED
             12.1.4 SKMEGG.COM
                       TABLE 282 SKMEGG.COM: BUSINESS OVERVIEW
                       FIGURE 65 SKMEGG.COM: COMPANY SNAPSHOT
                       TABLE 283 SKMEGG.COM: PRODUCTS/SOLUTIONS/SERVICES OFFERED
                       TABLE 284 SKMEGG.COM: EXPANSIONS, MAY 2023
             12.1.5 INTEROVO EGG GROUP BV
                       TABLE 285 INTEROVO EGG GROUP BV: BUSINESS OVERVIEW
                       TABLE 286 INTEROVO EGG GROUP BV: PRODUCTS/SOLUTIONS/SERVICES OFFERED
             12.1.6 IGRECA
                       TABLE 287 IGRECA: BUSINESS OVERVIEW
                       TABLE 288 IGRECA: PRODUCTS/SOLUTIONS/SERVICES OFFERED
             12.1.7 WABASH VALLEY
                       TABLE 289 WABASH VALLEY: BUSINESS OVERVIEW
                       TABLE 290 WABASH VALLEY: PRODUCTS/SOLUTIONS/SERVICES OFFERED
                       TABLE 291 WABASH VALLEY: EXPANSIONS, FEBRUARY 2023
             12.1.8 REMBRANDT FOODS
                       TABLE 292 REMBRANDT FOODS: BUSINESS OVERVIEW
                       TABLE 293 REMBRANDT FOODS: PRODUCTS/SOLUTIONS/SERVICES OFFERED
             12.1.9 AVRIL SCA
                       TABLE 294 AVRIL SCA: BUSINESS OVERVIEW
                       TABLE 295 AVRIL SCA: PRODUCTS/SOLUTIONS/SERVICES OFFERED
             12.1.10 EUROVO S.R.L.
                                   TABLE 296 EUROVO S.R.L.: BUSINESS OVERVIEW
                                   TABLE 297 EUROVO S.R.L.: PRODUCTS/SOLUTIONS/SERVICES OFFERED
             12.1.11 BOUWHUIS ENTHOVEN
                                   TABLE 298 BOUWHUIS ENTHOVEN: BUSINESS OVERVIEW
                                   TABLE 299 BOUWHUIS ENTHOVEN: PRODUCTS/SOLUTIONS/SERVICES OFFERED
                                   TABLE 300 BOUWHUIS ENTHOVEN: PRODUCT LAUNCHES, SEPTEMBER 2020
             12.1.12 TAJ AGRO INTERNATIONAL (TAJ PHARMA GROUP)
                                   TABLE 301 TAJ AGRO INTERNATIONAL (TAJ PHARMA GROUP): BUSINESS OVERVIEW
                                   TABLE 302 TAJ AGRO INTERNATIONAL (TAJ PHARMA GROUP): PRODUCTS/SOLUTIONS/SERVICES OFFERED
             12.1.13 HILLANDALE FARMS
                                   TABLE 303 HILLANDALE FARMS: BUSINESS OVERVIEW
                                   TABLE 304 HILLANDALE FARMS: PRODUCTS/SOLUTIONS/SERVICES OFFERED
             12.1.14 VENKY’S INDIA
                                   TABLE 305 VENKY’S INDIA: BUSINESS OVERVIEW
                                   FIGURE 66 VENKY’S INDIA: COMPANY SNAPSHOT
                                   TABLE 306 VENKY’S INDIA: PRODUCTS/SOLUTIONS/SERVICES OFFERED
                                   TABLE 307 VENKY’S INDIA: EXPANSIONS, FEBRUARY 2023
               12.1.15 KEWPIE EGG CORPORATION
                                   TABLE 308 KEWPIE EGG CORPORATION: BUSINESS OVERVIEW
                                   TABLE 309 KEWPIE EGG CORPORATION: PRODUCTS/SOLUTIONS/SERVICES OFFERED
                                   TABLE 310 KEWPIE EGG CORPORATION: EXPANSIONS, JULY 2023–JANUARY 2024
     12.2 OTHER PLAYERS 
             12.2.1 OVOBEST EIPRODUKTE GMBH & CO. KG
             12.2.2 TAIYO INTERNATIONAL
             12.2.3 READY EGG PRODUCTS
             12.2.4 OVOVITA
             12.2.5 VERSOVA
 
13 ADJACENT & RELATED MARKETS (Page No. - 280)
     13.1 INTRODUCTION 
               TABLE 311 MARKETS ADJACENT TO EGG PROCESSING MARKET
     13.2 LIMITATIONS 
     13.3 LECITHIN AND PHOSPHOLIPIDS MARKET 
             13.3.1 MARKET DEFINITION
             13.3.2 MARKET OVERVIEW
                       TABLE 312 PHOSPHOLIPIDS MARKET, BY REGION, 2018–2021 (USD MILLION)
                       TABLE 313 PHOSPHOLIPIDS MARKET, BY REGION, 2022–2027 (USD MILLION)
     13.4 PROTEIN INGREDIENTS MARKET 
             13.4.1 MARKET DEFINITION
             13.4.2 MARKET OVERVIEW
                       TABLE 314 PROTEIN INGREDIENTS MARKET, BY SOURCE, 2019–2022 (USD MILLION)
                       TABLE 315 PROTEIN INGREDIENTS MARKET, BY SOURCE, 2023–2028 (USD MILLION)
*Details on Business Overview, Products Offered, Recent Developments, and MnM View (Key strengths/Right to Win, Strategic Choices Made, and Weaknesses and Competitive Threats) might not be captured in case of unlisted companies.
 
14 APPENDIX (Page No. - 284)
     14.1 DISCUSSION GUIDE 
     14.2 KNOWLEDGESTORE: MARKETSANDMARKETS’ SUBSCRIPTION PORTAL 
     14.3 CUSTOMIZATION OPTIONS 
     14.4 RELATED REPORTS 
     14.5 AUTHOR DETAILS 

The study involved four major activities in estimating the current size of the egg processing market. Exhaustive secondary research was done to collect information on the market, peer, and parent markets. The next step was to validate these findings, assumptions, and sizing with industry experts across the value chain through primary research. Both top-down and bottom-up approaches were employed to estimate the complete market size. After that, market breakdown and data triangulation were used to estimate the market size of segments and subsegments.

Secondary Research

This research study involved the extensive use of secondary sources—directories and databases such as Bloomberg Businessweek and Factiva—to identify and collect information useful for a technical, market-oriented, and commercial study of the egg processing market.

In the secondary research process, various sources such as annual reports, press releases & investor presentations of companies, white papers, food journals, certified publications, articles from recognized authors, gold & silver standard websites, directories, and databases, were referred to identify and collect information. This research study involved the extensive use of secondary sources—directories and databases such as Bloomberg Businessweek and Factiva—to identify and collect information useful for a technical, market-oriented, and commercial study of the egg processing market.

Secondary research was mainly used to obtain key information about the industry’s supply chain, the total pool of key players, and market classification and segmentation as per the industry trends to the bottom-most level, regional markets, and key developments from both market- and technology-oriented perspectives.

Primary Research

Extensive primary research was conducted after obtaining information regarding the egg processing market scenario through secondary research. Several primary interviews were conducted with market experts from both the demand and supply sides across major countries of North America, Europe, Asia Pacific, South America, and the Rest of the World. Primary data was collected through questionnaires, emails, and telephonic interviews. The primary sources from the supply side included various industry experts, such as Chief X Officers (CXOs), Vice Presidents (VPs), Directors, from business development, marketing, research, and development teams, and related key executives from distributors, and key opinion leaders. Primary interviews were conducted to gather insights such as market statistics, data on revenue collected from the products and services, market breakdowns, market size estimations, market forecasting, and data triangulation. Primary research also helped in understanding the various trends related to egg processing, product type, end-use application, nature, and region. Stakeholders from the demand side, such as companies who are using processed eggs were interviewed to understand the buyer’s perspective on the suppliers, products, and their current usage of egg processing and the outlook of their business which will affect the overall market.
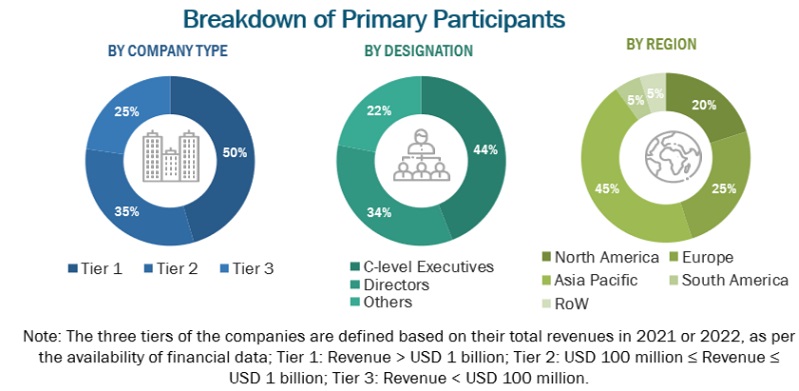
Egg Processing  Market Size, and Share

To know about the assumptions considered for the study, download the pdf brochure

COMPANY NAME

designation

Cal-Maine Foods, Inc.

Sales Manager

Rose Acre Farms

General Manager

Ovobel Foods.com

Manager

SKMEgg.com

Head of egg processing solutions

Inteovo Egg Group BV

Marketing Manager

IGRECA

Sales Executive

Wabash Valley

Head - Research & Development 

Rembrandt Foods

Manager

Avril SCA

R&D, QC, and production  Expert

Eurovo S.C.L

Senior Engineering Manager 

Market Size Estimation

Both the top-down and bottom-up approaches were used to estimate and validate the total size of the egg processing market. These approaches were also used extensively to determine the size of various subsegments in the market. The research methodology used to estimate the market size includes the following details:

  • The key players in the industry and the overall markets were identified through extensive secondary research.
  • All shares, splits, and breakdowns were determined using secondary sources and verified through primary sources.
  • All possible parameters that affect the market covered in this research study were accounted for, viewed in extensive detail, verified through primary research, and analyzed to obtain final quantitative and qualitative data.
  • The research included the study of reports, reviews, and newsletters of top market players, along with extensive interviews for opinions from leaders, such as CEOs, directors, and marketing executives.

Global Egg Processing Market: Bottom-Up Approach
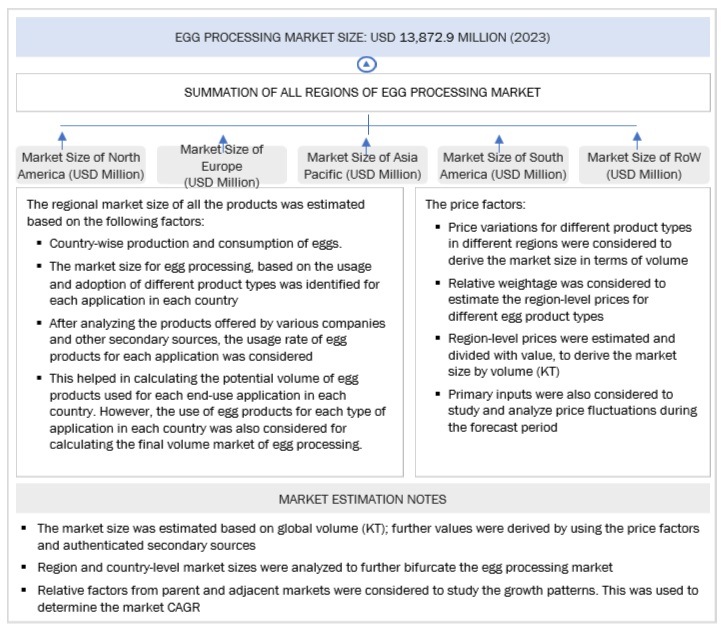
Egg Processing  Market Bottom Up Approach

To know about the assumptions considered for the study, Request for Free Sample Report

Global Egg Processing Market: Top-Down Approach
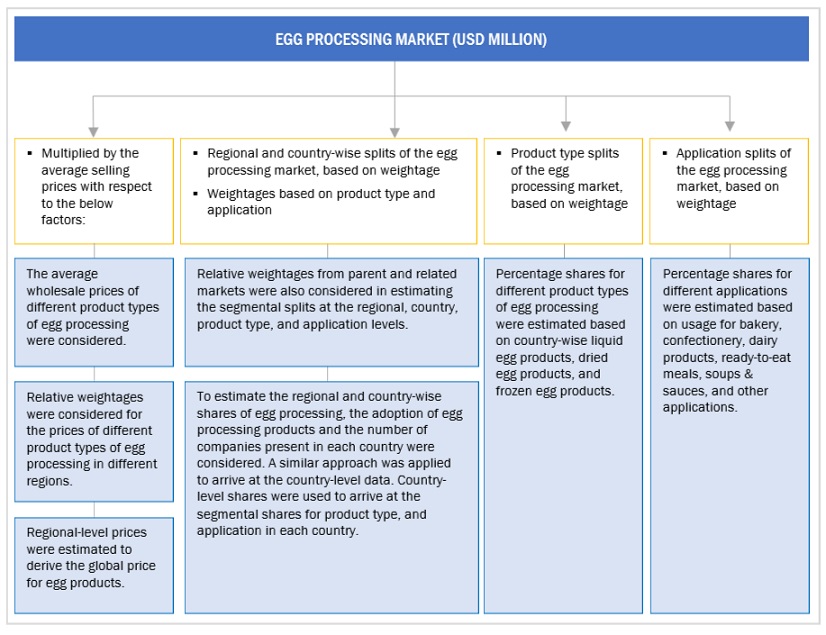
Egg Processing  Market Top Down Approach

Data Triangulation

After arriving at the overall market size from the estimation process explained above, the total market was split into several segments and subsegments. Data triangulation and market breakdown procedures were employed to estimate the egg processing market and arrive at the exact statistics for all segments and subsegments. The data was triangulated by studying numerous factors and trends from the demand and supply sides. The market size was also validated using both the top-down and bottom-up approaches.

Market Definition

According to the United States Department of Agriculture (USDA), egg processing refers to a series of mechanical, thermal, and chemical treatments that eggs undergo to meet specific quality, safety, and market requirements. The process involves cleaning, sorting, packaging, and sometimes cooking or pasteurizing eggs for various applications. The scope of the project primarily focuses on the market evaluation of processed eggs, including dried eggs, liquid eggs, and frozen eggs.

Key Stakeholders

  • Egg producers and suppliers
  • Egg product suppliers and manufacturers
  • Egg processing equipment manufacturers
  • Food service companies
  • Food safety agencies
  • Importers and exporters of egg products
  • Intermediary suppliers, which include traders and distributors of egg processing products.
  • Government and research organizations
  • Associations and industry bodies:
    • Food and Drug Administration (FDA)
    • European Food Safety Authority (EFSA)
    • Animal Welfare Organizations
    • United Egg Producers (UEP)
    • United States Department of Agriculture (USDA), The Food Safety and Inspection Service (FSIS)
    • The Canadian Food Inspection Agency (CFIA)
    • Environmental Protection Agency (EPA)
    • Directorate-General for Health and Food Safety (DG SANTE)
    • The Occupational Safety and Health Administration (OSHA)
    • Ministry of Agriculture or Department of Animal Husbandry
    • The Department of Animal Husbandry and Dairying (DAHD)
    • The Food Safety and Standards Authority of India (FSSAI)

Report Objectives

  • To determine and project the size of the egg processing market concerning the product type, end-use application, nature, and region in terms of value and volume over five years, ranging from 2023 to 2028.
  • To identify the attractive opportunities in the market by determining the largest and fastest-growing segments across regions.
  • To provide detailed information about the key factors influencing market growth (drivers, restraints, opportunities, and challenges).
  • To analyze the opportunities in the market for stakeholders and provide details of the competitive landscape for market leaders.
  • To analyze the micro-markets with respect to individual growth trends, prospects, and their contribution to the total market.
  • To identify and profile the key players in the egg processing market.
  • To understand the competitive landscape and identify the major growth strategies adopted by players across the key regions.
  • To provide insights on key product innovations and investments in the egg processing market.

Available Customizations

With the given market data, MarketsandMarkets offers customizations according to company-specific scientific needs.

The following customization options are available for the report:

Product Analysis

  • Product Matrix, which gives a detailed comparison of the product portfolio of each company.

Geographic Analysis

With the given market data, MarketsandMarkets offers customizations according to company-specific scientific needs.

  • Further breakdown of the Rest of Europe’s market for egg processing into Denmark, Poland, Norway, Ireland, and Belgium.
  • Further breakdown of the Rest of Asia Pacific market for egg processing into Taiwan, Malaysia, Singapore, and Indonesia.
  • Further breakdown of the Rest of South America market for egg processing into Colombia, Peru, and Chile.
  • Further breakdown of the Rest of the World market for egg processing into Africa (South Africa, Nigeria, Gambia, and Guinea) and the Middle East (UAE, Iran, Kuwait, Egypt, and Saudi Arabia).

Company Information

  • Detailed analyses and profiling of additional market players (up to five)
Custom Market Research Services

We will customize the research for you, in case the report listed above does not meet with your exact requirements. Our custom research will comprehensively cover the business information you require to help you arrive at strategic and profitable business decisions.

Request Customization
Report Code
FB 2690
Published ON
Feb, 2024
Choose License Type
BUY NOW
  • SHARE
X
Request Customization
Speak to Analyst
Speak to Analyst
OR FACE-TO-FACE MEETING
PERSONALIZE THIS RESEARCH
  • Triangulate with your Own Data
  • Get Data as per your Format and Definition
  • Gain a Deeper Dive on a Specific Application, Geography, Customer or Competitor
  • Any level of Personalization
REQUEST A FREE CUSTOMIZATION
LET US HELP YOU!
  • What are the Known and Unknown Adjacencies Impacting the Egg Processing Market
  • What will your New Revenue Sources be?
  • Who will be your Top Customer; what will make them switch?
  • Defend your Market Share or Win Competitors
  • Get a Scorecard for Target Partners
CUSTOMIZED WORKSHOP REQUEST
+1-888-600-6441
  • Call Us
  • +1-888-600-6441 (Corporate office hours)
  • +1-888-600-6441 (US/Can toll free)
  • +44-800-368-9399 (UK office hours)
CONNECT WITH US
ABOUT TRUST ONLINE
©2024 MarketsandMarkets Research Private Ltd. All rights reserved
DMCA.com Protection Status Website Feedback