The study involves two major activities in estimating the current market size for the fire resistant glass market. Exhaustive secondary research was done to collect information on the market, peer market, and parent market. The next step was to validate these findings, assumptions, and sizing with industry experts across the value chain through primary research. Both top-down and bottom-up approaches were employed to estimate the complete market size. After that, market breakdown and data triangulation were used to estimate the market size of segments and subsegments.
Secondary Research
Secondary sources referred to for this research study include financial statements of companies offering fire resistant glass and information from various trade, business, and professional associations. Secondary research has been used to obtain critical information about the industry’s value chain, the total pool of key players, market classification, and segmentation according to industry trends to the bottom-most level and regional markets. The secondary data was collected and analyzed to arrive at the overall size of the fire resistant glass market, which was validated by primary respondents.
Primary Research
Extensive primary research was conducted after obtaining information regarding the fire resistant glass market scenario through secondary research. Several primary interviews were conducted with market experts from both the demand and supply sides across major countries of Asia Pacific, Europe, North America, the Middle East & Africa, and South America. Primary data was collected through questionnaires, emails, and telephonic interviews. The primary sources from the supply side included various industry experts, such as Chief X Officers (CXOs), Vice Presidents (VPs), Directors from business development, marketing, product development/innovation teams, and related key executives from fire resistant glass industry vendors; system integrators; component providers; distributors; and key opinion leaders. Primary interviews were conducted to gather insights such as market statistics, data on revenue collected from the products and services, market breakdowns, market size estimations, market forecasting, and data triangulation. Primary research also helped in understanding the various trends related to type, end-use applications, and region. Stakeholders from the demand side, such as CIOs, CTOs, CSOs, and installation teams of the customer/end users who are using fire resistant glass were interviewed to understand the buyer’s perspective on the suppliers, products, component providers, and their current usage of fire resistant glass and outlook of their business which will affect the overall market.
The Breakup of Primary Research:

To know about the assumptions considered for the study, download the pdf brochure
Market Size Estimation
The research methodology used to estimate the size of the fire resistant glass market includes the following details. The market sizing of the market was undertaken from the demand side. The market was upsized based on procurements and modernizations in fire resistant glass in different end-use applications at a regional level. Such procurements provide information on the demand aspects of the fire resistant glass industry for each end-use industry. For each end-use applications, all possible segments of the fire resistant glass market were integrated and mapped.
Fire Resistant Glass Market Size: Botton Up Approach

To know about the assumptions considered for the study, Request for Free Sample Report
Fire Resistant Glass Market Size: Top-Down Approach

Data Triangulation
After arriving at the overall size from the market size estimation process explained above, the total market was split into several segments and subsegments. The data triangulation and market breakdown procedures explained below were implemented, wherever applicable, to complete the overall market engineering process and arrive at the exact statistics for various market segments and subsegments. The data was triangulated by studying various factors and trends from the demand and supply sides. Along with this, the market size was validated using both the top-down and bottom-up approaches.
Market Definition
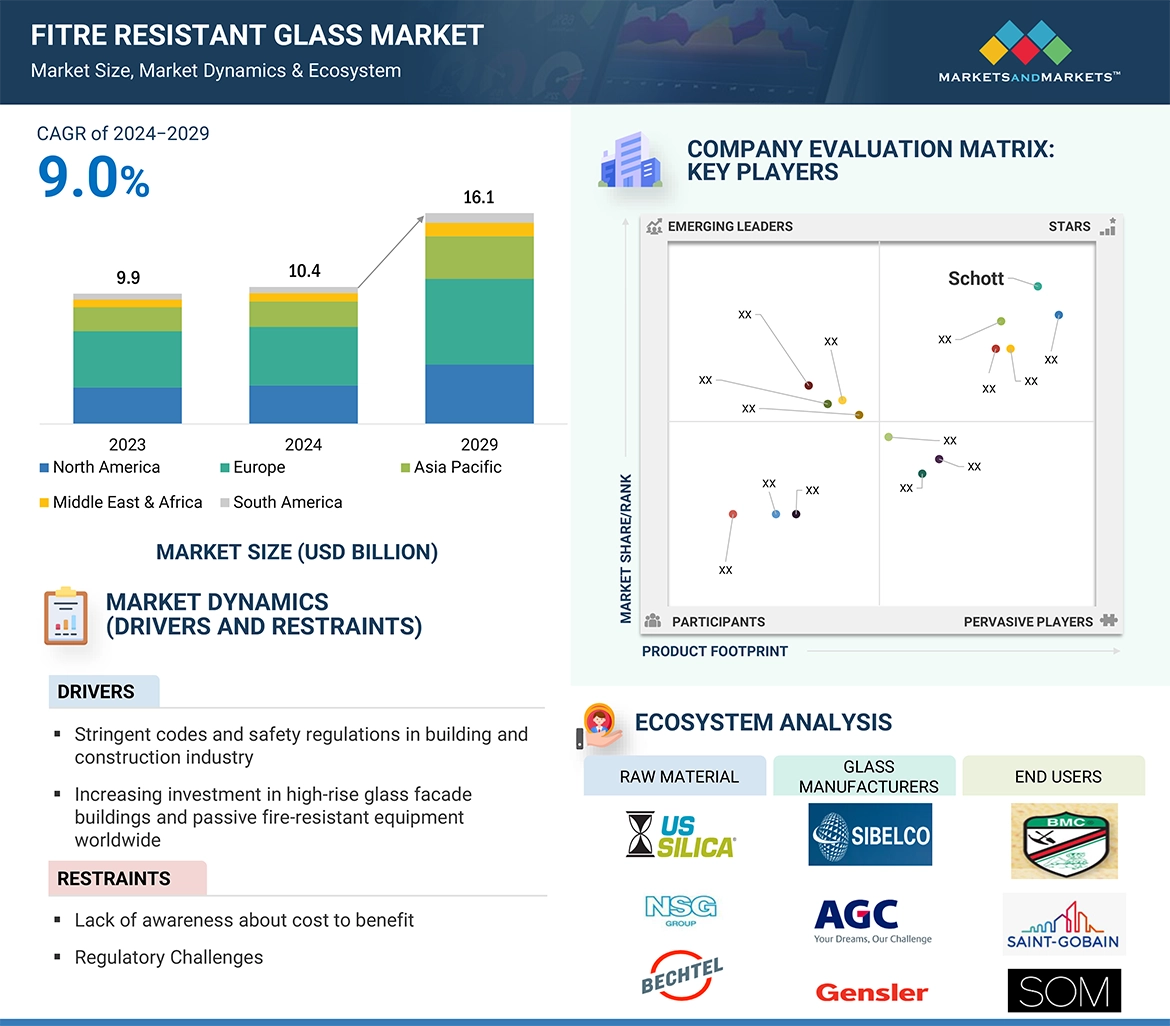
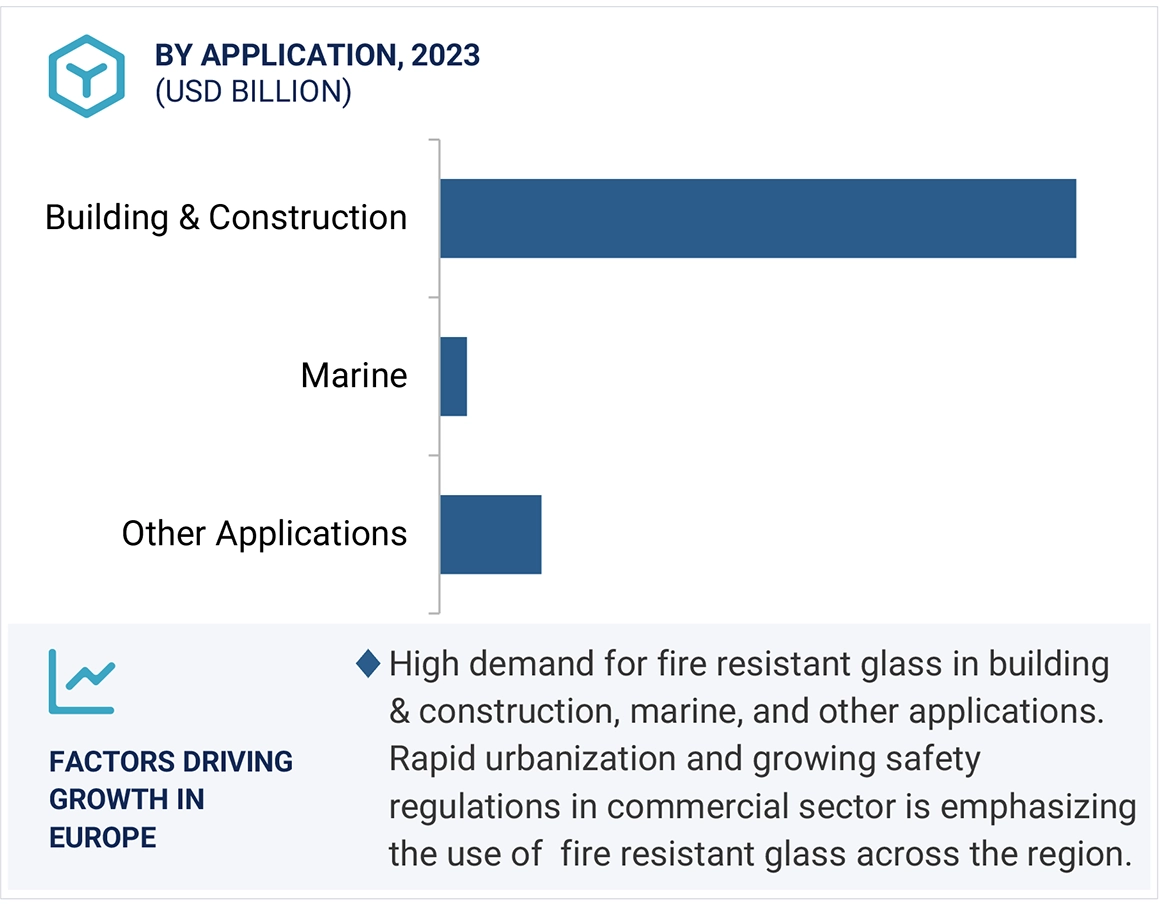
Fire resistant glass is the type of glass material that controls the spread of fire, hazardous smoke, hot gases or flames, and transfer of heat under the condition of use. Fire resistivity depends on the levels of prevention that is classified as integrity (E), insulation (I), and radiant heat control (EW). This glass is used in buildings, marine vessels, and oil refineries. This glass comes with various fire ratings, ranging between 20 and 180 minutes. The use of fire resistant glass depends on the area and size limitations under the applicable building code and/or the authority having jurisdiction. Fire resistant glass is manufactured by sheet glass processing. The main raw materials used in the fire resistant glass manufacturing are silica sand, soda ash, limestone, dolomite alumina, fire retardant intumescent interlayers, ceramics, and wires.
Key Stakeholders
-
Fire resistant glass manufacturers
-
Fire resistant glass suppliers
-
Raw material suppliers
-
End-use industries
-
Government bodies
-
Universities, governments, and research organizations
-
Research and consulting firms
-
R&D institutions
-
Investment banks and private equity firms
Report Objectives
-
To define, describe, and forecast the fire resistant glass market size in terms of volume and value.
-
To provide detailed information regarding the key factors, such as drivers, restraints, opportunities, and challenges influencing market growth
-
To analyze and project the global fire resistant glass market by type, end-use applications, and region.
-
To forecast the market size concerning five main regions (along with country-level data), namely, Asia Pacific, Europe, North America, the Middle East & Africa and South America, and analyze the significant region-specific trends.
-
To strategically analyze micro markets with respect to individual growth trends, prospects, and contributions of the submarkets to the overall market
-
To analyze the market opportunities and the competitive landscape for stakeholders and market leaders
-
To assess recent market developments and competitive strategies, such as agreements, contracts, acquisitions, and new product developments/new product launches, to draw the competitive landscape.
-
To strategically profile the key market players and comprehensively analyze their core competencies.
Available Customizations
MarketsandMarkets offers following customizations for this market report:
-
Additional country-level analysis of the fire resistant glass market
Product Analysis
-
Product matrix, which provides a detailed comparison of the product portfolio of each company's market.


Phiroze
Apr, 2019
Indian market analysis for protection glass.
Alan
Aug, 2018
Major manufacturers along with their competitve benchmarking present in the market.
gerson
Feb, 2018
Information on knowing about fire resistant glass.
batuhan
May, 2019
Looking for market research report on Fire rated Glass market.