Hypersonic Weapons Market

Hypersonic Weapons Market Size, Share, Trends Growth Report by Type (Hypersonic Missiles, Hypersonic Gliding Vehicles), Domain (Land, Naval, Airborne), Range(Short-range, Medium-range, Long-range), Subsystem and Region (North America, Europe, Asia Pacific, ROW) - Global Forecast to 2030

Report Code: AS 8690 Jun, 2023, by marketsandmarkets.com

The Hypersonic Weapons Market is estimated to be USD 6.8 Billion in 2023 and is projected to reach USD 14.5 Billion by 2030, at a Compound Annual Growth Rate CAGR of 11.4% from 2023 to 2030. One of the key factors driving the growth of hypersonic technology is the increasing need for faster and more advanced military capabilities. Hypersonic systems offer unprecedented speed and maneuverability, enabling enhanced defense capabilities and military superiority. Hypersonic Weapons Industry have the potential to revolutionize military operations by offering significantly faster speeds than traditional ballistic or cruise missiles. This enables the ability to strike targets with unprecedented speed, reducing the response time for military actions and increasing the effectiveness of offensive operations.

Hypersonic Weapons Market

Hypersonic Weapons Market

Hypersonic Weapons Market Forecast to 2030

To know about the assumptions considered for the study, Request for Free Sample Report

Hypersonic Weapons Market Dynamics:

Drivers: Military Modernization Programs and Arms Races to Accelerate Demand for Hypersonic Weapons

Military modernization programs primarily drive the global demand for hypersonic weapons as countries seek to upgrade their military capabilities. With hypersonic weapons offering advantages in terms of speed, range, and precision,  countries increasingly invest in research, development, and acquisition programs to incorporate these advanced systems into their armed forces to enhance strategic deterrence, increase operational flexibility, and ensure national security. This ongoing modernization creates a lucrative market for hypersonic weapons and stimulates advancements and investments in the field. The arms race further fuels the demand for hypersonic weapons. When one country deploys hypersonic weapons, it can trigger responses from other countries striving to gain an edge. The fear of being at a strategic disadvantage compels countries to invest in hypersonic weapons to match or surpass their rivals. The arms race fosters competition, spurs innovation, and leads to increased research, development, and procurement activities in the hypersonic weapons market. Consequently, the market experiences growth and accelerated technological advancements.

These military modernization programs and arms races create a self-perpetuating cycle in the hypersonic weapons market. Modernization efforts drive the initial demand, while the arms race sustains and amplifies it. This encourages investments, research, and development, leading to a continuous evolution of hypersonic weapon systems and technologies. The perceived advantages of hypersonic weapons have created a sense of urgency to develop and deploy these weapons. Countries such as the US, Russia, China, and others have been actively investing in the research, development, and testing of hypersonic technologies. For instance, In 2021, China field-tested a hypersonic missile, which worried many defense officials globally, especially the US. Accordingly, the US made a significant investment of USD 13 billion in hypersonic weapons with a request by the DoD (Department of Defense) to develop hypersonic missiles from 2023 to 2027.

Restraints:  Need for High Investments in Early Stages of Hypersonic Weapon Development

During the early stages of development, significant investment is required to fund research, prototyping, testing, and validation of hypersonic weapons. The complexity of hypersonic technology results in high development costs, which can strain the financial resources of governments and organizations. Limited financial resources may prevent smaller nations or entities from participating in the hypersonic weapons market, leading to an uneven distribution of capabilities and potential technological gaps. Moreover, the need for high investments in the early stages can prolong the development timeline. Research and development of hypersonic weapons often involve iterative testing, design refinements, and technical challenges that require significant time and resources to overcome. Delays in development can limit the availability of operational hypersonic weapon systems in the near term, potentially slowing down the market’s growth.

The early phase investment restraint also poses risks in terms of return on investment. There is inherent uncertainty in the successful development and deployment of hypersonic weapons, and investments made in the early stages may not yield immediate or guaranteed returns. This uncertainty can deter potential investors or stakeholders who are cautious about committing substantial resources without assurance of commercial or strategic viability. Additionally, high investments may lead to budgetary constraints, diverting funds from other defense priorities. Governments and organizations need to carefully balance their investment allocations to ensure a comprehensive and balanced approach to national security. In January 2023, US Congressional budget office stated that buying 300 intermediate ballistic missiles and sustaining them for 20 years would cost USD 13.4 billion, while a similar range of hypersonic missiles would cost USD 17.9 billion. Owing to these factors, the development of a hypersonic weapon can be more expensive than a supersonic missile.

Opportunities: Compact Hypersonic Weapons Create New Growth Avenues

Compact hypersonic weapons offer several advantages that open up new opportunities for military applications. Their small size allows for easier deployment and integration onto various platforms, including aircraft, ships, and ground-based launchers. This flexibility enables hypersonic weapons to be rapidly deployed to different theaters of operation and provides excellent mission adaptability. Furthermore, the enhanced performance resulting from compactness, such as higher speeds and maneuverability, enables hypersonic weapons to penetrate and evade advanced air defenses. This capability significantly increases the weapon’s lethality and survivability, enhancing its operational effectiveness in contested environments.

The cost-effectiveness of compact hypersonic weapons is another key opportunity. Small size and reduced weight can lead to lower production costs, as well as decreased transportation and storage expenses. This cost advantage may make hypersonic weapons more accessible to a broader range of countries, enabling them to acquire and integrate these advanced capabilities into their military forces. Compactness can also foster innovation in materials science, miniaturization techniques, and manufacturing processes. Researchers and engineers are continually exploring novel materials, advanced propulsion systems, and optimized designs to achieve compactness without compromising performance. These technological advancements drive the evolution of hypersonic weapons, leading to improved efficiency, reliability, and operational capabilities.

Challenges: Overheating and Complex Manufacturing

One of the major challenges in hypersonic weapons is the issue of overheating. Hypersonic speeds generate intense heat due to air friction and compression, exposing the weapon’s components to extreme temperatures. This thermal stress can lead to material degradation, structural failure, and a reduction in overall performance. Designing and developing materials that can withstand these extreme conditions is crucial to ensure the durability and reliability of hypersonic weapons. The complex manufacturing of hypersonic weapons also presents challenges. The manufacturing of hypersonic weapons involves intricate components and geometries, requiring advanced manufacturing techniques, such as additive manufacturing (3D printing). The precise fabrication and assembly of these complex structures demand stringent quality control measures to ensure the components meet the required specifications.

Specialized materials used in hypersonic weapons, such as advanced ceramics, carbon composites, and heat-resistant alloys, add complexity to the manufacturing process. These materials often have unique properties and processing requirements, requiring specialized manufacturing expertise and equipment. The high speeds and unique flight characteristics of hypersonic weapons also make their testing and evaluation challenging. Facilities capable of simulating hypersonic conditions for testing are limited and expensive to construct. Conducting comprehensive testing to verify the performance, reliability, and safety of hypersonic weapons under realistic conditions poses significant logistical and technical challenges.

Addressing these challenges requires collaborative efforts between researchers, engineers, and manufacturers. Advances in materials science, thermal management techniques, and manufacturing processes are necessary to mitigate the effects of overheating and ensure the production of reliable hypersonic weapon systems. Additionally, the development of specialized testing facilities and methodologies is crucial to accurately assess the performance and capabilities of hypersonic weapons. Overcoming the challenges associated with overheating and complex manufacturing is essential to enhance the operational capabilities and reliability of hypersonic weapons. Continued research, innovation, and investment in these areas will contribute to the growth and maturation of the hypersonic weapons market, enabling their broader adoption and integration into military and aerospace applications.

Hypersonic Weapons Market Ecosystem

The Hypersonic Weapons Companies is dominated by globally established players such as Lockheed Martin Corporation (US), Raytheon Technologies Corporation (US), Northrop Grumann Corporation (US), L3Harris Technologies Inc. (US), Leidos (US), Thales Group (UK), General Dynamics Corporation (US), Boeing (US), Israel Aerospace Industries (Israel), Bae Systems (UK). These players have adopted various growth strategies such as contracts, joint ventures, partnerships & agreements, acquisitions, and new product launches to further expand their presence in the Hypersonic Weapons Market.

Hypersonic Weapons Market by Ecosystem

Based on Propulsion System, the Boost Glide Segment is Highest Market Share Hypersonic Weapons During the Forecast Period

Hypersonic weapons in boost glide segment are experiencing significant growth due to several factors. Boost glide systems propulsion high maneuverability during the glide phase, allowing hypersonic weapons to change their trajectory, adjust their flight path, and perform evasive maneuvers. This makes them more difficult to track and intercept, enhancing their survivability against enemy defenses.  Hypersonic weapons utilizing boost glide propulsion spend a significant portion of their flight at high altitudes, which makes them less susceptible to ground-based defenses, such as anti-ballistic missile systems. The combination of speed, altitude, and maneuverability makes it challenging for interceptors to track and engage these weapons effectively.

Based on Warheads, the Electromagnetic Pulse (EMP) Segment is Projected to Grow at the Highest CAGR During the Forecast Period

Hypersonic weaponns in electromagnetic pulse segment are witnessing rapid growth due to their ability  to disrupt or disable electronic systems, including communication networks, radar systems, sensors, and command and control infrastructure. By incorporating an EMP warhead or device into a hypersonic weapon, it can create a powerful burst of electromagnetic energy upon detonation, effectively disabling or damaging enemy electronic systems within a certain radius. This can significantly degrade an adversary's ability to detect, track, and engage the incoming hypersonic weapon, thereby increasing its chances of reaching its target successfully.

Based on Guidance Systems, the Command Guidance Segment is Projected to Grow at the Highest CAGR During the Forecast Period

Hypersonic weapons are seeing considerable growth rate in increase in command guidance segment due to various reasons, Command guidance provides a high level of accuracy by allowing real-time control and adjustments to the weapon's trajectory. This allows the ground-based controller to monitor the target and make precise course corrections to ensure the weapon stays on track and accurately engages the intended target. This level of control reduces the chances of missing the target and improves overall accuracy. Also Command guidance enables mid-course corrections to compensate for factors like wind, target movement, or changes in the environment. By continuously transmitting control signals to the weapon, adjustments can be made to maintain the desired trajectory and optimize the weapon's path towards the target.

Asia Pacific is Expected to Lead the Hypersonic Weapons Market in 2023

Hypersonic weapons in the North America region are experiencing significant growth due to several key factors. Firstly, The Asia-Pacific region is home to several major military powers which includes China, Japan, India, Australia among others. These countries have high military budgets and have been modernizing its military capabilities and has invested heavily in areas such as missile technology. Secondly, the rapid technological advancements and investments in hypersonic weapons technology drive the market in this region, major Asian pacific countries have developed or invested in the development of hypersonic weapons technology.

Hypersonic Weapons Market by Region

Hypersonic Weapons Market by Region

To know about the assumptions considered for the study, download the pdf brochure

Hypersonic Weapons Industry Companies: Top Key Market Players

The Hypersonic Weapons Companies are dominated by globally established players such as Lockheed Martin Corporation (US), Raytheon Technologies Corporation (US), Northrop Grumann Corporation (US), L3Harris Technologies Inc. (US), Leidos (US), Thales Group (UK), General Dynamics Corporation (US), Boeing (US), Israel Aerospace Industries (Israel), Bae Systems (UK). These companies have well-equipped manufacturing facilities and strong distribution networks across North America, Europe, Asia Pacific, Latin America, and Middle East & Africa.

Get online access to the report on the World's First Market Intelligence Cloud

  • Easy to Download Historical Data & Forecast Numbers
  • Company Analysis Dashboard for high growth potential opportunities
  • Research Analyst Access for customization & queries
  • Competitor Analysis with Interactive dashboard
  • Latest News, Updates & Trend analysis
Request Sample

Scope of the Report

Report Metric

Details

Estimated Market Size
USD 6.8 Billion in 2023
Projected Market Size
USD 14.5 Billion by 2030
Growth Rate
CAGR of 11.4%

Market Size Available for Years

2019–2030

Base Year Considered

2022

Forecast Period

2023–2030

Forecast Units

Value (USD billion)

Segments Covered

Type, domain, range, subsystem, and region

Geographies Covered

North America, Europe, Asia Pacific, Rest of the World

Companies Covered

Lockheed Martin Corporation (US), Northrop Grumman Corporation (US), Raytheon Technologies Corporation (US), BAE Systems (UK), Thales Group (France), Hanwha Group (South Korea), Brahmos Aerospace Corporation (India), Israel Aerospace Industries (Israel), L3harris technologies Inc (US),
Safran (France), Tactical Missiles Corporation (Russia), MBDA (France)
 China Aerospace Science and Industry Corporation (China), Boeing (US), General Atomics (US), Rostec (Russia), Leidos (US), General Dynamics Corporation (US), Kratos Defense & Security Solutions US), Calspan Corporation (US), Aerojet Rocketdyne (US), Mitsubishi Heavy Industries Ltd (Japan), Roketsan AS (Turkey), NPO Mashinostroyeniya (Russia), Votkinsk Machine Building Plant (Russia)

Hypersonic Weapons Market Highlights

This research report categorizes hypersonic weapons based on Type, domain, range, subsystem, and region.

Segment

Subsegment

By Type:

  • Hypersonic missiles
  • Hypersonic glide vehicles

By Domain:

  • Land
  • Naval
  • Airborne

By Range:

  • Short-range
  • Medium-range
  • Long-range

By Subsystem:

  • Guidance System
    • Inertial Navigation System (INS)
    • Global Navigation Satellite System (GNSS)
    •  Terrestrial Guidance Systems
    • Laser Guidance Systems
    • Command Guidance Systems
  • Propulsion Systems
    • Scramjet
  • Boost-Glide
  • Warheads
    • Explosive Warheads
    • Kinetic Energy Penetrators
    • Electromagnetic Pulse

By Region:

  • North America
  • Europe
  • Asia Pacific
  • Rest of the World

Recent Developments

  • In April 2023, Mitsubishi Heavy Industries (Japan) was awarded numerous contracts from the Ministry of Defense (Japan) for development of missile systems including hypersonic weapons. The contract was valued at USD 883 million and was aimed to develop hypersonic cruise missile and hypersonic glide vehicles.
  • In March 2023, Raytheon Technologies Corporation (US) was awarded a contract by the US Air Force to build hypersonic cruise missile under the HACM Programme (Hypersonic attack cruise missile). The contract was worth USD 985 million. 
  • In January 2021, Bae Systems (UK) was awarded contract worth USD 4 million Defense Advanced Research Projects Agency (DARPA) (US) to develop data link for hypersonic weapons.  The contract was aimed to develop prototypes prototypes of data link systems to guide future hypersonic Tactical Boost Glide (TBG) vehicle.

Frequently Asked Questions (FAQ):

To speak to our analyst for a discussion on the above findings, click Speak to Analyst

TABLE OF CONTENTS
 
1 INTRODUCTION (Page No. - 32)
    1.1 STUDY OBJECTIVES 
    1.2 MARKET DEFINITION 
    1.3 STUDY SCOPE 
           1.3.1 MARKETS COVERED
                    FIGURE 1 HYPERSONIC WEAPONS MARKET SEGMENTATION
           1.3.2 REGIONS COVERED
           1.3.3 YEARS CONSIDERED
    1.4 INCLUSIONS AND EXCLUSIONS 
           TABLE 1 INCLUSIONS AND EXCLUSIONS
    1.5 CURRENCY AND PRICING 
           TABLE 2 USD EXCHANGE RATES
    1.6 STUDY LIMITATIONS 
    1.7 MARKET STAKEHOLDERS 
    1.8 SUMMARY OF CHANGES 
    1.9 RECESSION IMPACT ANALYSIS 
 
2 RESEARCH METHODOLOGY (Page No. - 37)
    2.1 RESEARCH DATA 
           FIGURE 2 RESEARCH FLOW
           FIGURE 3 RESEARCH DESIGN
           2.1.1 SECONDARY DATA
                    2.1.1.1 Key data from secondary sources
           2.1.2 PRIMARY DATA
                    2.1.2.1 Key data from primary sources
                               FIGURE 4 BREAKDOWN OF PRIMARY INTERVIEWS
                    2.1.2.2 Key industry insights
    2.2 MARKET SIZE ESTIMATION 
    2.3 RESEARCH APPROACH AND METHODOLOGY 
           2.3.1 BOTTOM-UP APPROACH
           FIGURE 5 BOTTOM-UP APPROACH
           2.3.2 TOP-DOWN APPROACH
           FIGURE 6 TOP-DOWN APPROACH
    2.4 FACTOR ANALYSIS 
           2.4.1 INTRODUCTION
           2.4.2 DEMAND-SIDE INDICATORS
                    2.4.2.1 Increased global military spending
                               FIGURE 7 MILITARY EXPENDITURE, BY COUNTRY, 2019–2021 (USD BILLION)
                    2.4.2.2 Rising incidences of regional disputes
           2.4.3 SUPPLY-SIDE INDICATORS
                    2.4.3.1 Financial trends of major US defense contractors
           2.4.4 RECESSION IMPACT ANALYSIS
    2.5 DATA TRIANGULATION 
           FIGURE 8 DATA TRIANGULATION
           2.5.1 TRIANGULATION THROUGH PRIMARY AND SECONDARY RESEARCH
    2.6 GROWTH ASSUMPTIONS 
    2.7 RESEARCH ASSUMPTIONS 
    2.8 RESEARCH LIMITATIONS 
 
3 EXECUTIVE SUMMARY (Page No. - 48)
    FIGURE 9 AIRBORNE SEGMENT TO REGISTER HIGHEST CAGR FROM 2023 TO 2030
    FIGURE 10 LONG-RANGE SEGMENT TO LEAD MARKET BETWEEN 2023 AND 2030
    FIGURE 11 PROPULSION SYSTEMS TO SECURE LEADING MARKET POSITION DURING FORECAST PERIOD
    FIGURE 12 HYPERSONIC MISSILES TO ACQUIRE LARGEST MARKET SHARE BY 2030
    FIGURE 13 SCRAMJET TO BE FASTEST-GROWING SEGMENT FROM 2023 TO 2030
    FIGURE 14 INERTIAL NAVIGATION SYSTEMS TO EXCEED OTHER SEGMENTS BY 2030
    FIGURE 15 ASIA PACIFIC TO BE FASTEST-GROWING REGION DURING FORECAST PERIOD
 
4 PREMIUM INSIGHTS (Page No. - 53)
    4.1 ATTRACTIVE GROWTH OPPORTUNITIES FOR PLAYERS IN HYPERSONIC WEAPONS MARKET 
           FIGURE 16 INCREASED ADOPTION OF HYPERSONIC WEAPONS AND TECHNOLOGIES
    4.2 HYPERSONIC WEAPONS MARKET, BY DOMAIN 
           FIGURE 17 LAND TO EXCEED OTHER DOMAINS BETWEEN 2023 AND 2030
    4.3 HYPERSONIC WEAPONS MARKET, BY TYPE 
           FIGURE 18 HYPERSONIC MISSILES TO COMMAND LARGEST MARKET SHARE DURING FORECAST PERIOD
    4.4 HYPERSONIC WEAPONS MARKET, BY SUBSYSTEM 
           FIGURE 19 PROPULSION SYSTEMS TO COMMAND MAXIMUM SHARES DURING FORECAST PERIOD
    4.5 HYPERSONIC WEAPONS MARKET, BY RANGE 
           FIGURE 20 LONG-RANGE SEGMENT TO REGISTER HIGHEST CAGR FROM 2023 TO 2030
    4.6 HYPERSONIC WEAPONS MARKET, BY REGION 
           FIGURE 21 ASIA PACIFIC TO LEAD MARKET DURING FORECAST PERIOD
    4.7 HYPERSONIC WEAPONS MARKET, BY COUNTRY 
           FIGURE 22 CHINA TO BE FASTEST-GROWING MARKET FROM 2023 TO 2030
 
5 MARKET OVERVIEW (Page No. - 57)
    5.1 INTRODUCTION 
    5.2 MARKET DYNAMICS 
           FIGURE 23 HYPERSONIC WEAPONS MARKET: DRIVERS, RESTRAINTS, OPPORTUNITIES, AND CHALLENGES
           5.2.1 DRIVERS
                    5.2.1.1 Military modernization programs and arms race to accelerate demand for hypersonic weapons
                    5.2.1.2 Technological advancements in hypersonic weapons to reshape military operations and conflict strategies
                    5.2.1.3 Increased R&D investments to fuel development of hypersonic weapons
                    5.2.1.4 Strategic deterrence to propel development and deployment of hypersonic weapons
                    5.2.1.5 Increased military expenditure on hypersonic weapons and subsystems to boost growth
                               TABLE 3 DEFENSE EXPENDITURE OF MAJOR COUNTRIES (USD BILLION)
                               FIGURE 24 DEFENSE EXPENDITURE OF MAJOR COUNTRIES (%)
           5.2.2 RESTRAINTS
                    5.2.2.1 Need for high investments in early stages of hypersonic weapons development
                    5.2.2.2 Communications and data transfer constraints
           5.2.3 OPPORTUNITIES
                    5.2.3.1 Compact hypersonic weapons create new growth avenues
                    5.2.3.2 Expanding military capabilities by harnessing power of hypersonic weapons
           5.2.4 CHALLENGES
                    5.2.4.1 Overheating of hypersonic weapons and complex manufacturing
                    5.2.4.2 Supply chain and testing infrastructure constraints
    5.3 TRENDS/DISRUPTIONS IMPACTING CUSTOMER BUSINESS 
           5.3.1 REVENUE SHIFT AND NEW REVENUE POCKETS FOR HYPERSONIC WEAPON MANUFACTURERS
                    FIGURE 25 REVENUE SHIFT IN HYPERSONIC WEAPONS MARKET
    5.4 RECESSION IMPACT ANALYSIS 
           FIGURE 26 IMPACT OF RECESSION ON HYPERSONIC WEAPONS MARKET
    5.5 AVERAGE SELLING PRICE ANALYSIS 
           TABLE 4 AVERAGE SELLING PRICE OF HYPERSONIC WEAPONS (USD MILLION)
    5.6 HYPERSONIC WEAPONS VOLUME, BY REGION 
           TABLE 5 HYPERSONIC WEAPONS VOLUME, BY REGION
    5.7 HYPERSONIC WEAPONS MARKET ECOSYSTEM 
           5.7.1 PROMINENT COMPANIES
           5.7.2 PRIVATE AND SMALL ENTERPRISES
           5.7.3 END USERS
                    FIGURE 27 HYPERSONIC WEAPONS MARKET ECOSYSTEM
                    TABLE 6 HYPERSONIC WEAPONS MARKET ECOSYSTEM
    5.8 VALUE CHAIN ANALYSIS 
           FIGURE 28 VALUE CHAIN ANALYSIS
    5.9 USE CASE ANALYSIS 
           TABLE 7 USE CASE: HYPERSONIC ANTI-SHIP MISSILE SYSTEMS TO COUNTER ENEMY VESSELS
           TABLE 8 USE CASE: HYPERSONIC CRUISE MISSILES TO EVADE MODERN AIR DEFENSE SYSTEMS
           TABLE 9 USE CASE: EVADING ANTI-ACCESS/AREA DENIAL (A2/AD) SYSTEMS
    5.10 PORTER’S FIVE FORCES ANALYSIS 
           TABLE 10 PORTER’S FIVE FORCES ANALYSIS
           FIGURE 29 PORTER’S FIVE FORCES ANALYSIS
           5.10.1 THREAT OF NEW ENTRANTS
           5.10.2 THREAT OF SUBSTITUTES
           5.10.3 BARGAINING POWER OF SUPPLIERS
           5.10.4 BARGAINING POWER OF BUYERS
           5.10.5 INTENSITY OF COMPETITIVE RIVALRY
    5.11 KEY STAKEHOLDERS AND BUYING CRITERIA 
           5.11.1 KEY STAKEHOLDERS IN BUYING PROCESS
                    FIGURE 30 INFLUENCE OF STAKEHOLDERS ON BUYING PROCESS, BY DOMAIN
                    TABLE 11 INFLUENCE OF STAKEHOLDERS ON BUYING PROCESS, BY DOMAIN (%)
           5.11.2 BUYING CRITERIA
                    FIGURE 31 KEY BUYING CRITERIA FOR TOP THREE DOMAINS
                    TABLE 12 KEY BUYING CRITERIA FOR TOP THREE DOMAIN
    5.12 TARIFF AND REGULATORY LANDSCAPE 
           TABLE 13 NORTH AMERICA: REGULATORY BODIES, GOVERNMENT AGENCIES, AND OTHER AGENCIES
           TABLE 14 EUROPE: REGULATORY BODIES, GOVERNMENT AGENCIES, AND OTHER AGENCIES
           TABLE 15 ASIA PACIFIC: REGULATORY BODIES, GOVERNMENT AGENCIES, AND OTHER AGENCIES
           TABLE 16 ROW: REGULATORY BODIES, GOVERNMENT AGENCIES, AND OTHER AGENCIES
    5.13 KEY CONFERENCES AND EVENTS, 2023–2024 
           TABLE 17 KEY CONFERENCES AND EVENTS, 2023−2024
 
6 INDUSTRY TRENDS (Page No. - 78)
    6.1 INTRODUCTION 
           FIGURE 32 EVOLUTION OF HYPERSONIC WEAPON TECHNOLOGY: ROADMAP FROM 1980 TO 2050
    6.2 TECHNOLOGICAL TRENDS 
           6.2.1 THERMAL PROTECTION SYSTEMS
           6.2.2 ARTIFICIAL INTELLIGENCE
           6.2.3 SENSORS
           6.2.4 ADVANCED SIMULATION SYSTEMS
    6.3 IMPACT OF MEGATRENDS 
           6.3.1 EMERGENCE OF INTERNET OF THINGS
           6.3.2 PROLIFERATION OF HYPERSONIC WEAPONS
    6.4 SUPPLY CHAIN ANALYSIS 
           FIGURE 33 SUPPLY CHAIN ANALYSIS
    6.5 INNOVATION AND PATENT REGISTRATIONS 
           TABLE 18 HYPERSONIC WEAPONS MARKET: KEY PATENTS, 2020
           TABLE 19 HYPERSONIC WEAPONS MARKET: RESEARCH PAPERS, BY COUNTRY
 
7 HYPERSONIC WEAPONS MARKET, BY TYPE (Page No. - 85)
    7.1 INTRODUCTION 
           FIGURE 34 HYPERSONIC WEAPONS MARKET, BY TYPE, 2023–2030 (USD MILLION)
           TABLE 20 HYPERSONIC WEAPONS MARKET, BY TYPE, 2019–2022 (USD MILLION)
           TABLE 21 HYPERSONIC WEAPONS MARKET, BY TYPE, 2023–2030 (USD MILLION)
    7.2 HYPERSONIC MISSILES 
           7.2.1 HIGH SPEED AND PRECISION TO DRIVE THIS SEGMENT
    7.3 HYPERSONIC GLIDE VEHICLES 
           7.3.1 EVASIVE MANEUVERS AND LOW VULNERABILITY TO SPUR DEMAND
 
8 HYPERSONIC WEAPONS MARKET, BY DOMAIN (Page No. - 88)
    8.1 INTRODUCTION 
           FIGURE 35 HYPERSONIC WEAPONS MARKET, BY DOMAIN, 2023–2030 (USD MILLION)
           TABLE 22 HYPERSONIC WEAPONS MARKET, BY DOMAIN, 2019–2022 (USD MILLION)
           TABLE 23 HYPERSONIC WEAPONS MARKET, BY DOMAIN, 2023–2030 (USD MILLION)
    8.2 LAND 
           8.2.1 LOW OPERATION COST AND EASY MAINTENANCE TO FUEL DEVELOPMENT OF LAND-BASED WEAPONS
    8.3 NAVAL 
           8.3.1 RISING TERRITORIAL DISPUTES IN SEA TO RAISE DEMAND FOR NAVAL-BASED PLATFORMS
    8.4 AIRBORNE 
           8.4.1 INCREASED FLEXIBILITY AND HIGH RANGE TO EXPAND ADOPTION OF AIRBORNE WEAPONS
 
9 HYPERSONIC WEAPONS MARKET, BY RANGE (Page No. - 92)
    9.1 INTRODUCTION 
           FIGURE 36 HYPERSONIC WEAPONS MARKET, BY RANGE, 2023–2030 (USD MILLION)
           TABLE 24 HYPERSONIC WEAPONS MARKET, BY RANGE, 2019–2022 (USD MILLION)
           TABLE 25 HYPERSONIC WEAPONS MARKET, BY RANGE, 2023–2030 (USD MILLION)
    9.2 SHORT-RANGE 
           9.2.1 BROAD APPLICABILITY OF SHORT-RANGE HYPERSONIC WEAPONS TO DRIVE MARKET
    9.3 MEDIUM-RANGE 
           9.3.1 INCREASED INVESTMENTS IN MEDIUM-RANGE HYPERSONIC WEAPONS TO FOSTER DEMAND
    9.4 LONG-RANGE 
           9.4.1 EXTENDED RANGE CAPABILITY TO BE KEY GROWTH FACTOR
 
10 HYPERSONIC WEAPONS MARKET, BY SUBSYSTEM (Page No. - 95)
     10.1 INTRODUCTION 
             FIGURE 37 HYPERSONIC WEAPONS MARKET, BY SUBSYSTEM, 2023–2030 (USD MILLION)
             TABLE 26 HYPERSONIC WEAPONS MARKET, BY SUBSYSTEM, 2019–2022 (USD MILLION)
             TABLE 27 HYPERSONIC WEAPONS MARKET, BY SUBSYSTEM, 2023–2030 (USD MILLION)
     10.2 GUIDANCE SYSTEMS 
             10.2.1 INCORPORATION OF CUTTING-EDGE TECHNOLOGIES TO INCREASE DEMAND FOR GUIDANCE SYSTEMS IN HYPERSONIC WEAPONS
                        FIGURE 38 HYPERSONIC WEAPONS MARKET, BY GUIDANCE SYSTEMS, 2023–2030 (USD MILLION)
                        TABLE 28 HYPERSONIC WEAPONS MARKET, BY GUIDANCE SYSTEMS, 2019–2022 (USD MILLION)
                        TABLE 29 HYPERSONIC WEAPONS MARKET, BY GUIDANCE SYSTEMS, 2023–2030 (USD MILLION)
             10.2.2 INERTIAL NAVIGATION SYSTEMS
             10.2.3 GLOBAL NAVIGATION SATELLITE SYSTEMS
             10.2.4 TERRESTRIAL GUIDANCE SYSTEMS
             10.2.5 LASER GUIDANCE SYSTEMS
             10.2.6 COMMAND GUIDANCE SYSTEMS
     10.3 PROPULSION SYSTEMS 
             10.3.1 HIGH SPEED OF PROPULSION SYSTEMS TO BE MAJOR FACTOR PROMOTING DEMAND
                        FIGURE 39 HYPERSONIC WEAPONS MARKET, BY PROPULSION SYSTEMS, 2023–2030 (USD MILLION)
                        TABLE 30 HYPERSONIC WEAPONS MARKET, BY PROPULSION SYSTEMS, 2019–2022 (USD MILLION)
                        TABLE 31 HYPERSONIC WEAPONS MARKET, BY PROPULSION SYSTEMS, 2023–2030 (USD MILLION)
             10.3.2 SCRAMJET
             10.3.3 BOOST-GLIDE
     10.4 WARHEADS 
             10.4.1 DESTRUCTIVE POWER AND HIGH DAMAGE CAPABILITIES TO FUEL INTEGRATION OF WARHEADS IN HYPERSONIC WEAPONS
                        FIGURE 40 HYPERSONIC WEAPONS MARKET, BY WARHEADS, 2023–2030 (USD MILLION)
                        TABLE 32 HYPERSONIC WEAPONS MARKET, BY WARHEADS, 2019–2022 (USD MILLION)
                        TABLE 33 HYPERSONIC WEAPONS MARKET, BY WARHEADS, 2023–2030 (USD MILLION)
             10.4.2 EXPLOSIVE WARHEADS
             10.4.3 KINETIC ENERGY PENETRATORS
             10.4.4 ELECTROMAGNETIC PULSE
 
11 HYPERSONIC WEAPONS MARKET, BY REGION (Page No. - 107)
     11.1 INTRODUCTION 
             FIGURE 41 HYPERSONIC WEAPONS MARKET, BY REGION, 2023–2030
     11.2 REGIONAL RECESSION IMPACT ANALYSIS 
             TABLE 34 REGIONAL RECESSION IMPACT ANALYSIS
             TABLE 35 HYPERSONIC WEAPONS MARKET, BY REGION, 2019–2022 (USD MILLION)
             TABLE 36 HYPERSONIC WEAPONS MARKET, BY REGION, 2023–2030 (USD MILLION)
     11.3 NORTH AMERICA 
             11.3.1 PESTLE ANALYSIS: NORTH AMERICA
             11.3.2 RECESSION IMPACT ANALYSIS: NORTH AMERICA
                        FIGURE 42 NORTH AMERICA: HYPERSONIC WEAPONS MARKET SNAPSHOT
                        TABLE 37 NORTH AMERICA: HYPERSONIC WEAPONS MARKET, BY COUNTRY, 2019–2022 (USD MILLION)
                        TABLE 38 NORTH AMERICA: HYPERSONIC WEAPONS MARKET, BY COUNTRY, 2023–2030 (USD MILLION)
                        TABLE 39 NORTH AMERICA: HYPERSONIC WEAPONS MARKET, BY TYPE, 2019–2022 (USD MILLION)
                        TABLE 40 NORTH AMERICA: HYPERSONIC WEAPONS MARKET, BY TYPE, 2023–2030 (USD MILLION)
                        TABLE 41 NORTH AMERICA: HYPERSONIC WEAPONS MARKET, BY SUBSYSTEM, 2019–2022 (USD MILLION)
                        TABLE 42 NORTH AMERICA: HYPERSONIC WEAPONS MARKET, BY SUBSYSTEM, 2023–2030 (USD MILLION)
                        TABLE 43 NORTH AMERICA: HYPERSONIC WEAPONS MARKET, BY DOMAIN, 2019–2022 (USD MILLION)
                        TABLE 44 NORTH AMERICA: HYPERSONIC WEAPONS MARKET, BY DOMAIN, 2023–2030 (USD MILLION)
                        TABLE 45 NORTH AMERICA: HYPERSONIC WEAPONS MARKET, BY RANGE, 2019–2022 (USD MILLION)
                        TABLE 46 NORTH AMERICA: HYPERSONIC WEAPONS MARKET, BY RANGE, 2023–2030 (USD MILLION)
             11.3.3 US
                        11.3.3.1 Growing awareness toward strategic significance of hypersonic technology to amplify demand
                                     TABLE 47 US: HYPERSONIC WEAPONS MARKET, BY DOMAIN, 2019–2022 (USD MILLION)
                                     TABLE 48 US: HYPERSONIC WEAPONS MARKET, BY DOMAIN, 2023–2030 (USD MILLION)
                                     TABLE 49 US: HYPERSONIC WEAPONS MARKET, BY RANGE, 2019–2022 (USD MILLION)
                                     TABLE 50 US: HYPERSONIC WEAPONS MARKET, BY RANGE, 2023–2030 (USD MILLION)
                                     TABLE 51 US: HYPERSONIC WEAPONS MARKET, BY TYPE, 2019–2022 (USD MILLION)
                                     TABLE 52 US: HYPERSONIC WEAPONS MARKET, BY TYPE, 2023–2030 (USD MILLION)
             11.3.4 CANADA
                        11.3.4.1 Rising concerns about hypersonic threats to drive Canadian market
                                     TABLE 53 CANADA: HYPERSONIC WEAPONS MARKET, BY DOMAIN, 2019–2022 (USD MILLION)
                                     TABLE 54 CANADA: HYPERSONIC WEAPONS MARKET, BY DOMAIN, 2023–2030 (USD MILLION)
                                     TABLE 55 CANADA: HYPERSONIC WEAPONS MARKET, BY RANGE, 2019–2022 (USD MILLION)
                                     TABLE 56 CANADA: HYPERSONIC WEAPONS MARKET, BY RANGE, 2023–2030 (USD MILLION)
                                     TABLE 57 CANADA: HYPERSONIC WEAPONS MARKET, BY TYPE, 2019–2022 (USD MILLION)
                                     TABLE 58 CANADA: HYPERSONIC WEAPONS MARKET, BY TYPE, 2023–2030 (USD MILLION)
     11.4 EUROPE 
             11.4.1 PESTLE ANALYSIS: EUROPE
             11.4.2 RECESSION IMPACT ANALYSIS: EUROPE
                        FIGURE 43 EUROPE: HYPERSONIC WEAPONS MARKET SNAPSHOT
                        TABLE 59 EUROPE: HYPERSONIC WEAPONS MARKET, BY COUNTRY, 2019–2022 (USD MILLION)
                        TABLE 60 EUROPE: HYPERSONIC WEAPONS MARKET, BY COUNTRY, 2023–2030 (USD MILLION)
                        TABLE 61 EUROPE: HYPERSONIC WEAPONS MARKET, BY TYPE, 2019–2022 (USD MILLION)
                        TABLE 62 EUROPE: HYPERSONIC WEAPONS MARKET, BY TYPE, 2023–2030 (USD MILLION)
                        TABLE 63 EUROPE: HYPERSONIC WEAPONS MARKET, BY SUBSYSTEM, 2019–2022 (USD MILLION)
                        TABLE 64 EUROPE: HYPERSONIC WEAPONS MARKET, BY SUBSYSTEM, 2023–2030 (USD MILLION)
                        TABLE 65 EUROPE: HYPERSONIC WEAPONS MARKET, BY DOMAIN, 2019–2022 (USD MILLION)
                        TABLE 66 EUROPE: HYPERSONIC WEAPONS MARKET, BY DOMAIN, 2023–2030 (USD MILLION)
                        TABLE 67 EUROPE: HYPERSONIC WEAPONS MARKET, BY RANGE, 2019–2022 (USD MILLION)
                        TABLE 68 EUROPE: HYPERSONIC WEAPONS MARKET, BY RANGE, 2023–2030 (USD MILLION)
             11.4.3 UK
                        11.4.3.1 New collaborations and investments to spur domestic demand
                                     TABLE 69 UK: HYPERSONIC WEAPONS MARKET, BY DOMAIN, 2019–2022 (USD MILLION)
                                     TABLE 70 UK: HYPERSONIC WEAPONS MARKET, BY DOMAIN, 2023–2030 (USD MILLION)
                                     TABLE 71 UK: HYPERSONIC WEAPONS MARKET, BY RANGE, 2019–2022 (USD MILLION)
                                     TABLE 72 UK: HYPERSONIC WEAPONS MARKET, BY RANGE, 2023–2030 (USD MILLION)
                                     TABLE 73 UK: HYPERSONIC WEAPONS MARKET, BY TYPE, 2019–2022 (USD MILLION)
                                     TABLE 74 UK: HYPERSONIC WEAPONS MARKET, BY TYPE, 2023–2030 (USD MILLION)
             11.4.4 FRANCE
                        11.4.4.1 Improved investments in R&D to fuel development of hypersonic weapons
                                     TABLE 75 FRANCE: HYPERSONIC WEAPONS MARKET, BY DOMAIN, 2019–2022 (USD MILLION)
                                     TABLE 76 FRANCE: HYPERSONIC WEAPONS MARKET, BY DOMAIN, 2023–2030 (USD MILLION)
                                     TABLE 77 FRANCE: HYPERSONIC WEAPONS MARKET, BY RANGE, 2019–2022 (USD MILLION)
                                     TABLE 78 FRANCE: HYPERSONIC WEAPONS MARKET, BY RANGE, 2023–2030 (USD MILLION)
                                     TABLE 79 FRANCE: HYPERSONIC WEAPONS MARKET, BY TYPE, 2019–2022 (USD MILLION)
                                     TABLE 80 FRANCE: HYPERSONIC WEAPONS MARKET, BY TYPE, 2023–2030 (USD MILLION)
             11.4.5 GERMANY
                        11.4.5.1 Increased emphasis on research activities to propel market
                                     TABLE 81 GERMANY: HYPERSONIC WEAPONS MARKET, BY DOMAIN, 2019–2022 (USD MILLION)
                                     TABLE 82 GERMANY: HYPERSONIC WEAPONS MARKET, BY DOMAIN, 2023–2030 (USD MILLION)
                                     TABLE 83 GERMANY: HYPERSONIC WEAPONS MARKET, BY RANGE, 2019–2022 (USD MILLION)
                                     TABLE 84 GERMANY: HYPERSONIC WEAPONS MARKET, BY RANGE, 2023–2030 (USD MILLION)
                                     TABLE 85 GERMANY: HYPERSONIC WEAPONS MARKET, BY TYPE, 2019–2022 (USD MILLION)
                                     TABLE 86 GERMANY: HYPERSONIC WEAPONS MARKET, BY TYPE, 2023–2030 (USD MILLION)
             11.4.6 RUSSIA
                        11.4.6.1 Technological advances to support demand
                                     TABLE 87 RUSSIA: HYPERSONIC WEAPONS MARKET, BY DOMAIN, 2019–2022 (USD MILLION)
                                     TABLE 88 RUSSIA: HYPERSONIC WEAPONS MARKET, BY DOMAIN, 2023–2030 (USD MILLION)
                                     TABLE 89 RUSSIA: HYPERSONIC WEAPONS MARKET, BY RANGE, 2019–2022 (USD MILLION)
                                     TABLE 90 RUSSIA: HYPERSONIC WEAPONS MARKET, BY RANGE, 2023–2030 (USD MILLION)
                                     TABLE 91 RUSSIA: HYPERSONIC WEAPONS MARKET, BY TYPE, 2019–2022 (USD MILLION)
                                     TABLE 92 RUSSIA: HYPERSONIC WEAPONS MARKET, BY TYPE, 2023–2030 (USD MILLION)
             11.4.7 REST OF EUROPE
                        TABLE 93 REST OF EUROPE: HYPERSONIC WEAPONS MARKET, BY DOMAIN, 2019–2022 (USD MILLION)
                        TABLE 94 REST OF EUROPE: HYPERSONIC WEAPONS MARKET, BY DOMAIN, 2023–2030 (USD MILLION)
                        TABLE 95 REST OF EUROPE: HYPERSONIC WEAPONS MARKET, BY RANGE, 2019–2022 (USD MILLION)
                        TABLE 96 REST OF EUROPE: HYPERSONIC WEAPONS MARKET, BY RANGE, 2023–2030 (USD MILLION)
                        TABLE 97 REST OF EUROPE: HYPERSONIC WEAPONS MARKET, BY TYPE, 2019–2022 (USD MILLION)
                        TABLE 98 REST OF EUROPE: HYPERSONIC WEAPONS MARKET, BY TYPE, 2023–2030 (USD MILLION)
     11.5 ASIA PACIFIC 
             11.5.1 PESTLE ANALYSIS: ASIA PACIFIC
             11.5.2 RECESSION IMPACT ANALYSIS: ASIA PACIFIC
                        FIGURE 44 ASIA PACIFIC: HYPERSONIC WEAPONS MARKET SNAPSHOT
                        TABLE 99 ASIA PACIFIC: HYPERSONIC WEAPONS MARKET, BY COUNTRY, 2019–2022 (USD MILLION)
                        TABLE 100 ASIA PACIFIC: HYPERSONIC WEAPONS MARKET, BY COUNTRY, 2023–2030 (USD MILLION)
                        TABLE 101 ASIA PACIFIC: HYPERSONIC WEAPONS MARKET, BY TYPE, 2019–2022 (USD MILLION)
                        TABLE 102 ASIA PACIFIC: HYPERSONIC WEAPONS MARKET, BY TYPE, 2023–2030 (USD MILLION)
                        TABLE 103 ASIA PACIFIC: HYPERSONIC WEAPONS MARKET, BY SUBSYSTEM, 2019–2022 (USD MILLION)
                        TABLE 104 ASIA PACIFIC: HYPERSONIC WEAPONS MARKET, BY SUBSYSTEM, 2023–2030 (USD MILLION)
                        TABLE 105 ASIA PACIFIC: HYPERSONIC WEAPONS MARKET, BY DOMAIN, 2019–2022 (USD MILLION)
                        TABLE 106 ASIA PACIFIC: HYPERSONIC WEAPONS MARKET, BY DOMAIN, 2023–2030 (USD MILLION)
                        TABLE 107 ASIA PACIFIC: HYPERSONIC WEAPONS MARKET, BY RANGE, 2019–2022 (USD MILLION)
                        TABLE 108 ASIA PACIFIC: HYPERSONIC WEAPONS MARKET, BY RANGE, 2023–2030 (USD MILLION)
             11.5.3 CHINA
                        11.5.3.1 High defense budget to strengthen domestic market
                                     TABLE 109 CHINA: HYPERSONIC WEAPONS MARKET, BY DOMAIN, 2019–2022 (USD MILLION)
                                     TABLE 110 CHINA: HYPERSONIC WEAPONS MARKET, BY DOMAIN, 2023–2030 (USD MILLION)
                                     TABLE 111 CHINA: HYPERSONIC WEAPONS MARKET, BY RANGE, 2019–2022 (USD MILLION)
                                     TABLE 112 CHINA: HYPERSONIC WEAPONS MARKET, BY RANGE, 2023–2030 (USD MILLION)
                                     TABLE 113 CHINA: HYPERSONIC WEAPONS MARKET, BY TYPE, 2019–2022 (USD MILLION)
                                     TABLE 114 CHINA: HYPERSONIC WEAPONS MARKET, BY TYPE, 2023–2030 (USD MILLION)
             11.5.4 JAPAN
                        11.5.4.1 Strong technological base to expand market
                                     TABLE 115 JAPAN: HYPERSONIC WEAPONS MARKET, BY DOMAIN, 2019–2022 (USD MILLION)
                                     TABLE 116 JAPAN: HYPERSONIC WEAPONS MARKET, BY DOMAIN, 2023–2030 (USD MILLION)
                                     TABLE 117 JAPAN: HYPERSONIC WEAPONS MARKET, BY RANGE, 2019–2022 (USD MILLION)
                                     TABLE 118 JAPAN: HYPERSONIC WEAPONS MARKET, BY RANGE, 2023–2030 (USD MILLION)
                                     TABLE 119 JAPAN: HYPERSONIC WEAPONS MARKET, BY TYPE, 2019–2022 (USD MILLION)
                                     TABLE 120 JAPAN: HYPERSONIC WEAPONS MARKET, BY TYPE, 2023–2030 (USD MILLION)
             11.5.5 INDIA
                        11.5.5.1 Territorial and border disputes to foster demand for hypersonic weapons
                                     TABLE 121 INDIA: HYPERSONIC WEAPONS MARKET, BY DOMAIN, 2019–2022 (USD MILLION)
                                     TABLE 122 INDIA: HYPERSONIC WEAPONS MARKET, BY DOMAIN, 2023–2030 (USD MILLION)
                                     TABLE 123 INDIA: HYPERSONIC WEAPONS MARKET, BY RANGE, 2019–2022 (USD MILLION)
                                     TABLE 124 INDIA: HYPERSONIC WEAPONS MARKET, BY RANGE, 2023–2030 (USD MILLION)
                                     TABLE 125 INDIA: HYPERSONIC WEAPONS MARKET, BY TYPE, 2019–2022 (USD MILLION)
                                     TABLE 126 INDIA: HYPERSONIC WEAPONS MARKET, BY TYPE, 2023–2030 (USD MILLION)
             11.5.6 SOUTH KOREA
                        11.5.6.1 Rigorous development of new technologies to drive market
                                     TABLE 127 SOUTH KOREA: HYPERSONIC WEAPONS MARKET, BY DOMAIN, 2019–2022 (USD MILLION)
                                     TABLE 128 SOUTH KOREA: HYPERSONIC WEAPONS MARKET, BY DOMAIN, 2023–2030 (USD MILLION)
                                     TABLE 129 SOUTH KOREA: HYPERSONIC WEAPONS MARKET, BY RANGE, 2019–2022 (USD MILLION)
                                     TABLE 130 SOUTH KOREA: HYPERSONIC WEAPONS MARKET, BY RANGE, 2023–2030 (USD MILLION)
                                     TABLE 131 SOUTH KOREA: HYPERSONIC WEAPONS MARKET, BY TYPE, 2019–2022 (USD MILLION)
                                     TABLE 132 SOUTH KOREA: HYPERSONIC WEAPONS MARKET, BY TYPE, 2023–2030 (USD MILLION)
             11.5.7 REST OF ASIA PACIFIC
                        TABLE 133 REST OF ASIA PACIFIC: HYPERSONIC WEAPONS MARKET, BY DOMAIN, 2019–2022 (USD MILLION)
                        TABLE 134 REST OF ASIA PACIFIC: HYPERSONIC WEAPONS MARKET, BY DOMAIN, 2023–2030 (USD MILLION)
                        TABLE 135 REST OF ASIA PACIFIC: HYPERSONIC WEAPONS MARKET, BY RANGE, 2019–2022 (USD MILLION)
                        TABLE 136 REST OF ASIA PACIFIC: HYPERSONIC WEAPONS MARKET, BY RANGE, 2023–2030 (USD MILLION)
                        TABLE 137 REST OF ASIA PACIFIC: HYPERSONIC WEAPONS MARKET, BY TYPE, 2019–2022 (USD MILLION)
                        TABLE 138 REST OF ASIA PACIFIC: HYPERSONIC WEAPONS MARKET, BY TYPE, 2023–2030 (USD MILLION)
     11.6 ROW 
             11.6.1 RECESSION IMPACT ANALYSIS: ROW
                        TABLE 139 ROW: HYPERSONIC WEAPONS MARKET, BY REGION, 2019–2022 (USD MILLION)
                        TABLE 140 ROW: HYPERSONIC WEAPONS MARKET, BY REGION, 2023–2030 (USD MILLION)
                        TABLE 141 ROW: HYPERSONIC WEAPONS MARKET, BY TYPE, 2019–2022 (USD MILLION)
                        TABLE 142 ROW: HYPERSONIC WEAPONS MARKET, BY TYPE, 2023–2030 (USD MILLION)
                        TABLE 143 ROW: HYPERSONIC WEAPONS MARKET, BY SUBSYSTEM, 2019–2022 (USD MILLION)
                        TABLE 144 ROW: HYPERSONIC WEAPONS MARKET, BY SUBSYSTEM, 2023–2030 (USD MILLION)
                        TABLE 145 ROW: HYPERSONIC WEAPONS MARKET, BY DOMAIN, 2019–2022 (USD MILLION)
                        TABLE 146 ROW: HYPERSONIC WEAPONS MARKET, BY DOMAIN, 2023–2030 (USD MILLION)
                        TABLE 147 ROW: HYPERSONIC WEAPONS MARKET, BY RANGE, 2019–2022 (USD MILLION)
                        TABLE 148 ROW: HYPERSONIC WEAPONS MARKET, BY RANGE, 2023–2030 (USD MILLION)
             11.6.2 MIDDLE EAST & AFRICA
                        11.6.2.1 Increased geopolitical competition to raise demand for hypersonic weapons
                                     TABLE 149 MIDDLE EAST & AFRICA: HYPERSONIC WEAPONS MARKET, BY DOMAIN, 2019–2022 (USD MILLION)
                                     TABLE 150 MIDDLE EAST & AFRICA: HYPERSONIC WEAPONS MARKET, BY DOMAIN, 2023–2030 (USD MILLION)
                                     TABLE 151 MIDDLE EAST & AFRICA: HYPERSONIC WEAPONS MARKET, BY RANGE, 2019–2022 (USD MILLION)
                                     TABLE 152 MIDDLE EAST & AFRICA: HYPERSONIC WEAPONS MARKET, BY RANGE, 2023–2030 (USD MILLION)
                                     TABLE 153 MIDDLE EAST & AFRICA: HYPERSONIC WEAPONS MARKET, BY TYPE, 2019–2022 (USD MILLION)
                                     TABLE 154 MIDDLE EAST & AFRICA: HYPERSONIC WEAPONS MARKET, BY TYPE, 2023–2030 (USD MILLION)
             11.6.3 LATIN AMERICA
                        11.6.3.1 New developments in hypersonic technology to push market
                                     TABLE 155 LATIN AMERICA: HYPERSONIC WEAPONS MARKET, BY DOMAIN, 2019–2022 (USD MILLION)
                                     TABLE 156 LATIN AMERICA: HYPERSONIC WEAPONS MARKET, BY DOMAIN, 2023–2030 (USD MILLION)
                                     TABLE 157 LATIN AMERICA: HYPERSONIC WEAPONS MARKET, BY RANGE, 2019–2022 (USD MILLION)
                                     TABLE 158 LATIN AMERICA: HYPERSONIC WEAPONS MARKET, BY RANGE, 2023–2030 (USD MILLION)
                                     TABLE 159 LATIN AMERICA: HYPERSONIC WEAPONS MARKET, BY TYPE, 2019–2022 (USD MILLION)
                                     TABLE 160 LATIN AMERICA: HYPERSONIC WEAPONS MARKET, BY TYPE, 2023–2030 (USD MILLION)
 
12 COMPETITIVE LANDSCAPE (Page No. - 153)
     12.1 INTRODUCTION 
     12.2 COMPETITIVE OVERVIEW 
             TABLE 161 KEY DEVELOPMENTS BY LEADING PLAYERS IN HYPERSONIC WEAPONS MARKET,  2020–2023
     12.3 RANKING ANALYSIS, 2022 
             FIGURE 45 MARKET RANKING OF TOP FIVE PLAYERS, 2022
     12.4 MARKET SHARE ANALYSIS, 2022 
             FIGURE 46 MARKET SHARE OF TOP FIVE PLAYERS, 2022
             TABLE 162 HYPERSONIC WEAPONS MARKET: DEGREE OF COMPETITION
     12.5 REVENUE ANALYSIS, 2022 
             FIGURE 47 REVENUE OF TOP FIVE PLAYERS, 2022
     12.6 COMPANY FOOTPRINT ANALYSIS 
             TABLE 163 PRODUCT FOOTPRINT
             TABLE 164 REGION FOOTPRINT
             TABLE 165 DOMAIN FOOTPRINT
             TABLE 166 TYPE FOOTPRINT
     12.7 COMPANY EVALUATION MATRIX 
             12.7.1 STARS
             12.7.2 EMERGING LEADERS
             12.7.3 PERVASIVE PLAYERS
             12.7.4 PARTICIPANTS
                        FIGURE 48 HYPERSONIC WEAPONS MARKET: COMPANY EVALUATION MATRIX, 2023
     12.8 START-UP/SME EVALUATION MATRIX 
             12.8.1 PROGRESSIVE COMPANIES
             12.8.2 RESPONSIVE COMPANIES
             12.8.3 DYNAMIC COMPANIES
             12.8.4 STARTING BLOCKS
                        FIGURE 49 HYPERSONIC WEAPONS MARKET: START-UP/SME EVALUATION MATRIX, 2023
     12.9 COMPETITIVE SCENARIO 
             12.9.1 MARKET EVALUATION FRAMEWORK
             12.9.2 PRODUCT DEVELOPMENTS
                        TABLE 167 HYPERSONIC WEAPONS MARKET: PRODUCT DEVELOPMENTS, MARCH 2023
             12.9.3 DEALS
                        TABLE 168 HYPERSONIC WEAPONS MARKET: DEALS, AUGUST 2019–APRIL 2023
 
13 COMPANY PROFILES (Page No. - 171)
(Business overview, Products/Services/Solutions offered, Recent Developments, MNM view)*  
     13.1 INTRODUCTION 
     13.2 KEY PLAYERS 
             13.2.1 RAYTHEON TECHNOLOGIES CORPORATION
                        TABLE 169 RAYTHEON TECHNOLOGIES CORPORATION: BUSINESS OVERVIEW
                        FIGURE 50 RAYTHEON TECHNOLOGIES CORPORATION: COMPANY SNAPSHOT
                        TABLE 170 RAYTHEON TECHNOLOGIES CORPORATION: PRODUCTS/SOLUTIONS/SERVICES OFFERED
                        TABLE 171 RAYTHEON TECHNOLOGIES CORPORATION: PRODUCT LAUNCHES
                        TABLE 172 RAYTHEON TECHNOLOGIES CORPORATION: DEALS
             13.2.2 LOCKHEED MARTIN CORPORATION
                        TABLE 173 LOCKHEED MARTIN CORPORATION: BUSINESS OVERVIEW
                        FIGURE 51 LOCKHEED MARTIN CORPORATION: COMPANY SNAPSHOT
                        TABLE 174 LOCKHEED MARTIN CORPORATION: PRODUCTS/SOLUTIONS/SERVICES OFFERED
                        TABLE 175 LOCKHEED MARTIN CORPORATION: PRODUCT LAUNCHES
                        TABLE 176 LOCKHEED MARTIN CORPORATION: DEALS
             13.2.3 NORTHROP GRUMMAN CORPORATION
                        TABLE 177 NORTHROP GRUMMAN CORPORATION: BUSINESS OVERVIEW
                        FIGURE 52 NORTHROP GRUMMAN CORPORATION: COMPANY SNAPSHOT
                        TABLE 178 NORTHROP GRUMMAN CORPORATION: PRODUCTS/SOLUTIONS/SERVICES OFFERED
                        TABLE 179 NORTHROP GRUMMAN CORPORATION: DEALS
             13.2.4 L3HARRIS TECHNOLOGIES, INC.
                        TABLE 180 L3HARRIS TECHNOLOGIES, INC.: BUSINESS OVERVIEW
                        FIGURE 53 L3HARRIS TECHNOLOGIES, INC.: COMPANY SNAPSHOT
                        TABLE 181 L3HARRIS TECHNOLOGIES, INC.: PRODUCTS/SOLUTIONS/SERVICES OFFERED
                        TABLE 182 L3HARRIS TECHNOLOGIES, INC.: DEALS
             13.2.5 LEIDOS
                        TABLE 183 LEIDOS: BUSINESS OVERVIEW
                        FIGURE 54 LEIDOS: COMPANY SNAPSHOT
                        TABLE 184 LEIDOS: PRODUCTS/SOLUTIONS/SERVICES OFFERED
                        TABLE 185 LEIDOS: DEALS
             13.2.6 THALES GROUP
                        TABLE 186 THALES GROUP: BUSINESS OVERVIEW
                        FIGURE 55 THALES GROUP: COMPANY SNAPSHOT
                        TABLE 187 THALES GROUP: PRODUCTS/SOLUTIONS/SERVICES OFFERED
                        TABLE 188 THALES GROUP: DEALS
             13.2.7 BAE SYSTEMS
                        TABLE 189 BAE SYSTEMS: BUSINESS OVERVIEW
                        FIGURE 56 BAE SYSTEMS: COMPANY SNAPSHOT
                        TABLE 190 BAE SYSTEMS: PRODUCTS/SOLUTIONS/SERVICES OFFERED
                        TABLE 191 BAE SYSTEMS: DEALS
             13.2.8 GENERAL DYNAMICS CORPORATION
                        TABLE 192 GENERAL DYNAMICS CORPORATION: BUSINESS OVERVIEW
                        FIGURE 57 GENERAL DYNAMICS CORPORATION: COMPANY SNAPSHOT
                        TABLE 193 GENERAL DYNAMICS CORPORATION: PRODUCTS/SOLUTIONS/SERVICES OFFERED
                        TABLE 194 GENERAL DYNAMICS CORPORATION: DEALS
             13.2.9 MITSUBISHI HEAVY INDUSTRIES LTD.
                        TABLE 195 MITSUBISHI HEAVY INDUSTRIES LTD.: BUSINESS OVERVIEW
                        FIGURE 58 MITSUBISHI HEAVY INDUSTRIES LTD.: COMPANY SNAPSHOT
                        TABLE 196 MITSUBISHI HEAVY INDUSTRIES LTD.: PRODUCTS/SOLUTIONS/SERVICES OFFERED
                        TABLE 197 MITSUBISHI HEAVY INDUSTRIES LTD.: DEALS
             13.2.10 KRATOS DEFENSE & SECURITY SOLUTIONS
                        TABLE 198 KRATOS DEFENSE & SECURITY SOLUTIONS: BUSINESS OVERVIEW
                        FIGURE 59 KRATOS DEFENSE & SECURITY SOLUTIONS: COMPANY SNAPSHOT
                        TABLE 199 KRATOS DEFENSE & SECURITY SOLUTIONS: PRODUCTS/SOLUTIONS/SERVICES OFFERED
                        TABLE 200 KRATOS DEFENSE & SECURITY SOLUTIONS: DEALS
             13.2.11 BOEING
                        TABLE 201 BOEING: BUSINESS OVERVIEW
                        FIGURE 60 BOEING: COMPANY SNAPSHOT
                        TABLE 202 BOEING: PRODUCTS/SOLUTIONS/SERVICES OFFERED
                        TABLE 203 BOEING: DEALS
             13.2.12 ISRAEL AEROSPACE INDUSTRIES LTD.
                        TABLE 204 ISRAEL AEROSPACE INDUSTRIES LTD.: BUSINESS OVERVIEW
                        TABLE 205 ISRAEL AEROSPACE INDUSTRIES LTD.: PRODUCTS/SOLUTIONS/SERVICES OFFERED
             13.2.13 BRAHMOS AEROSPACE
                        TABLE 206 BRAHMOS AEROSPACE: BUSINESS OVERVIEW
                        TABLE 207 BRAHMOS AEROSPACE: PRODUCTS/SOLUTIONS/SERVICES OFFERED
             13.2.14 HANWHA GROUP
                        TABLE 208 HANWHA GROUP: BUSINESS OVERVIEW
                        TABLE 209 HANWHA GROUP: PRODUCTS/SOLUTIONS/SERVICES OFFERED
                        TABLE 210 HANWHA GROUP: DEALS
             13.2.15 MBDA
                        TABLE 211 MBDA: BUSINESS OVERVIEW
                        TABLE 212 MBDA: PRODUCTS/SOLUTIONS/SERVICES OFFERED
                        TABLE 213 MBDA: DEALS
     13.3 OTHER PLAYERS 
             13.3.1 ROSTEC
                        TABLE 214 ROSTEC: COMPANY OVERVIEW
             13.3.2 ROKETSAN AS
                        TABLE 215 ROKETSAN AS: COMPANY OVERVIEW
             13.3.3 CHINA AEROSPACE SCIENCE AND INDUSTRY CORPORATION
                        TABLE 216 CHINA AEROSPACE SCIENCE AND INDUSTRY CORPORATION: COMPANY OVERVIEW
             13.3.4 NPO MASHINOSTROYENIYA
                        TABLE 217 NPO MASHINOSTROYENIYA: COMPANY OVERVIEW
             13.3.5 VOTKINSK MACHINE BUILDING PLANT
                        TABLE 218 VOTKINSK MACHINE BUILDING PLANT: COMPANY OVERVIEW
             13.3.6 TACTICAL MISSILES CORPORATION
                        TABLE 219 TACTICAL MISSILES CORPORATION: COMPANY OVERVIEW
             13.3.7 GENERAL ATOMICS
                        TABLE 220 GENERAL ATOMICS: COMPANY OVERVIEW
             13.3.8 CALSPAN CORPORATION
                        TABLE 221 CALSPAN CORPORATION: COMPANY OVERVIEW
             13.3.9 SAFRAN S.A.
                        TABLE 222 SAFRAN S.A.: COMPANY OVERVIEW
             13.3.10 AEROJET ROCKETDYNE
                        TABLE 223 AEROJET ROCKETDYNE: COMPANY OVERVIEW
*Details on Business overview, Products/Services/Solutions offered, Recent Developments, MNM view might not be captured in case of unlisted companies.  
 
14 APPENDIX (Page No. - 216)
     14.1 DISCUSSION GUIDE 
     14.2 KNOWLEDGESTORE: MARKETSANDMARKETS’  SUBSCRIPTION PORTAL 
     14.3 CUSTOMIZATION OPTIONS 
     14.4 RELATED REPORTS 
     14.5 AUTHOR DETAILS 


The research study conducted on the hypersonic weapons market involved extensive use of secondary sources, including directories, databases of articles, journals on hypersonic weapons, company newsletters, and information portals such as Hoover’s, Bloomberg, and Factiva to identify and collect information useful for this extensive, technical, market-oriented, and commercial study of the hypersonic weapons market. Primary sources are several industry experts from the core and related industries, alliances, organizations, Original Equipment Manufacturers (OEMs), vendors, suppliers, and technology developers. These sources relate to all segments of the value chain of the hypersonic weapons market.

In-depth interviews were conducted with various primary respondents, including key industry participants, subject-matter experts, C-level executives of key market players, and industry consultants, among others, to obtain and verify critical qualitative and quantitative information and to assess prospects of the market.

Secondary Research

In the secondary research process, various secondary sources were referred to identify and collect information for this study on the hypersonic weapons market. Secondary sources included annual reports, press releases, and investor presentations of companies; white papers and certified publications; articles from recognized authors; manufacturer's associations; directories; and databases. Secondary research was mainly used to obtain key information about the supply chain of the hypersonic weapons industry, the monetary chain of the market, the total pool of key players, market classification and segmentation according to the industry trends to the bottom-most level, regional markets, and key developments from both market- and technology-oriented perspectives.

Primary Research

Extensive primary research was conducted to obtain qualitative and quantitative information for this report on the hypersonic weapons market. Several primary interviews were conducted with the market experts from both demand- and supply-side across major regions, namely, North America, Europe, Asia Pacific, the Middle East, Latin America, and Africa. Primary sources from the supply-side included industry experts such as business development managers, sales heads, technology and innovation directors, and related key executives from various key companies and organizations operating in the hypersonic weapons market.

Hypersonic Weapons Market Size, and Share

To know about the assumptions considered for the study, download the pdf brochure

Market Size Estimation

Both the top-down and bottom-up approaches were used to estimate and validate the size of the hypersonic weapons market. The following figure represents the overall market size estimation process employed for this study on the market.

The research methodology used to estimate the market size included the following details:

  • Secondary research identified key players in the hypersonic weapons market, and their market share was determined through primary and secondary research. This included a study of annual and financial reports of top market players and extensive interviews of leaders such as Chief Executive Officers (CEOs), directors, and marketing executives of leading companies operating in the market.
  • All percentage shares, splits, and breakdowns were determined using secondary sources and verified through primary sources.
  • All possible parameters that affect the markets covered in this research study were accounted for, viewed in extensive detail, verified through primary research, and analyzed to obtain the final quantitative and qualitative data on the hypersonic weapons market.

This data was consolidated, enhanced with detailed inputs, analyzed by MarketsandMarkets, and presented in this report.

Market size estimation methodology: Bottom-up Approach

Hypersonic Weapons Market Size, and Bottom-up Approach

Market size estimation methodology: Top-Down Approach

In the top-down approach, the overall size of the hypersonic weapons market was used to estimate the size of individual markets (mentioned in the market segmentation) through percentage splits obtained from secondary and primary research.  The size of the most appropriate, immediate parent market was used to implement the top-down approach to calculate the sizes of specific market segments. The approach was also implemented to validate the revenues obtained for various market segments.

Market share was estimated for each company to verify the revenue share used earlier in the bottom-up approach. With the data triangulation procedure and data validation through primary, this study determined and confirmed the overall size of the parent market and each market segment. The following figure shows the overall market size estimation process employed for this study.

Hypersonic Weapons Market Size, and Top-Down Approach

The overall market size derived through the primary-based approach was used in the top-down procedure to estimate the market size of the hyperspectral imaging systems market by product, technology, and application. The percentage contributions of each region were derived and evaluated to arrive at the market size for each country. Further percentage splits were applied to derive country-level markets in each region. Percentage contributions of the respective markets were obtained based on extensive secondary research and insights from industry experts.

Data Triangulation

After arriving at the total market size, the market was split into several segments and subsegments. The data triangulation and market breakdown procedures explained below were implemented, wherever applicable, to complete the overall market engineering process and arrive at the estimated market numbers for hypersonic weapons segments and subsegments. The data was triangulated by studying various factors and trends from both the demand and supply sides. The market size was also validated using the top-down and bottom-up approaches.

The following figure indicates the market breakdown structure and the data triangulation procedure implemented in the market engineering process used to develop this report.

Hypersonic Weapons Market Size, and Data Triangulation

Market Definition

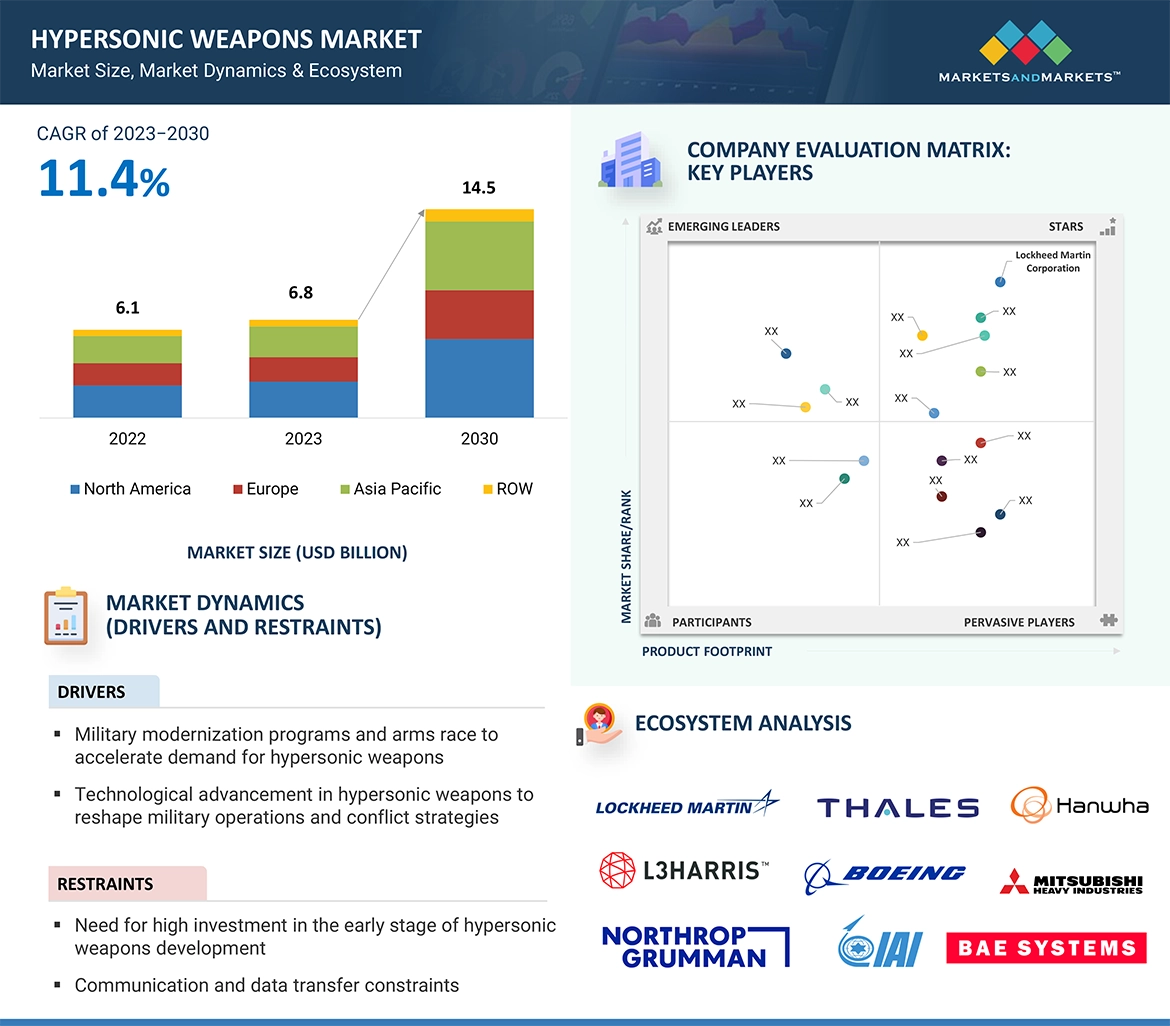
Hypersonic weapons are advanced missiles or other types of projectiles that can travel at speeds exceeding Mach 5, or five times the speed of sound (approximately 3,800 miles per hour or 6,100 kilometres per hour) or more. These weapons use advanced technologies, such as scramjet engines and specialized materials, to achieve their high speeds and maneuverability.

Hypersonic weapons are designed to be highly maneuverable and difficult to detect and intercept, making them potentially effective in a variety of military scenarios. They have the ability to hit targets with high accuracy and very high speed, making them capable of delivering gigantic amounts of kinetic energy. The potential applications for hypersonic weapons are vast, and they can be used in various military scenarios, including long-range precision strikes, anti-ship warfare, and anti-aircraft defense.  Hypersonic weapons pose a significant challenge to radar systems due to their high speeds and maneuverability. Traditional radar systems are designed to detect and track objects traveling at subsonic or supersonic speeds, making it difficult to detect hypersonic weapons. Hypersonic weapons are currently in demand and are considered a significant area of investment and research for several countries around the world, particularly in the field of military technology.
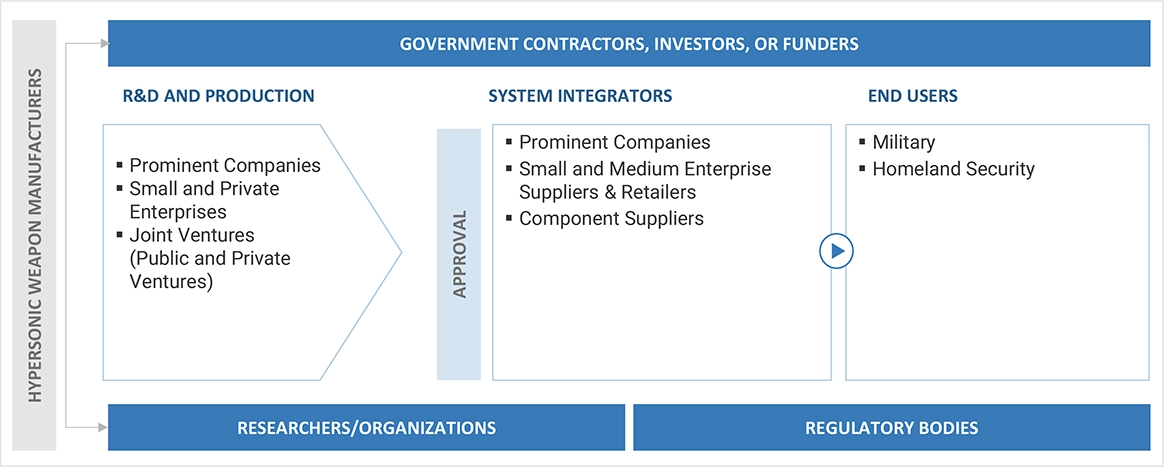
Key Stakeholders

  • Senior Management
  • End User
  • Finance/Procurement Department
  • R&D Department
  • Ministry of Defense
  • Regulatory Bodies
  • R&D Companies
  • Providers of hypersonic weapons Subsystem and Sub-components
  • Armed Forces
  • Intelligence Agencies

Report Objectives

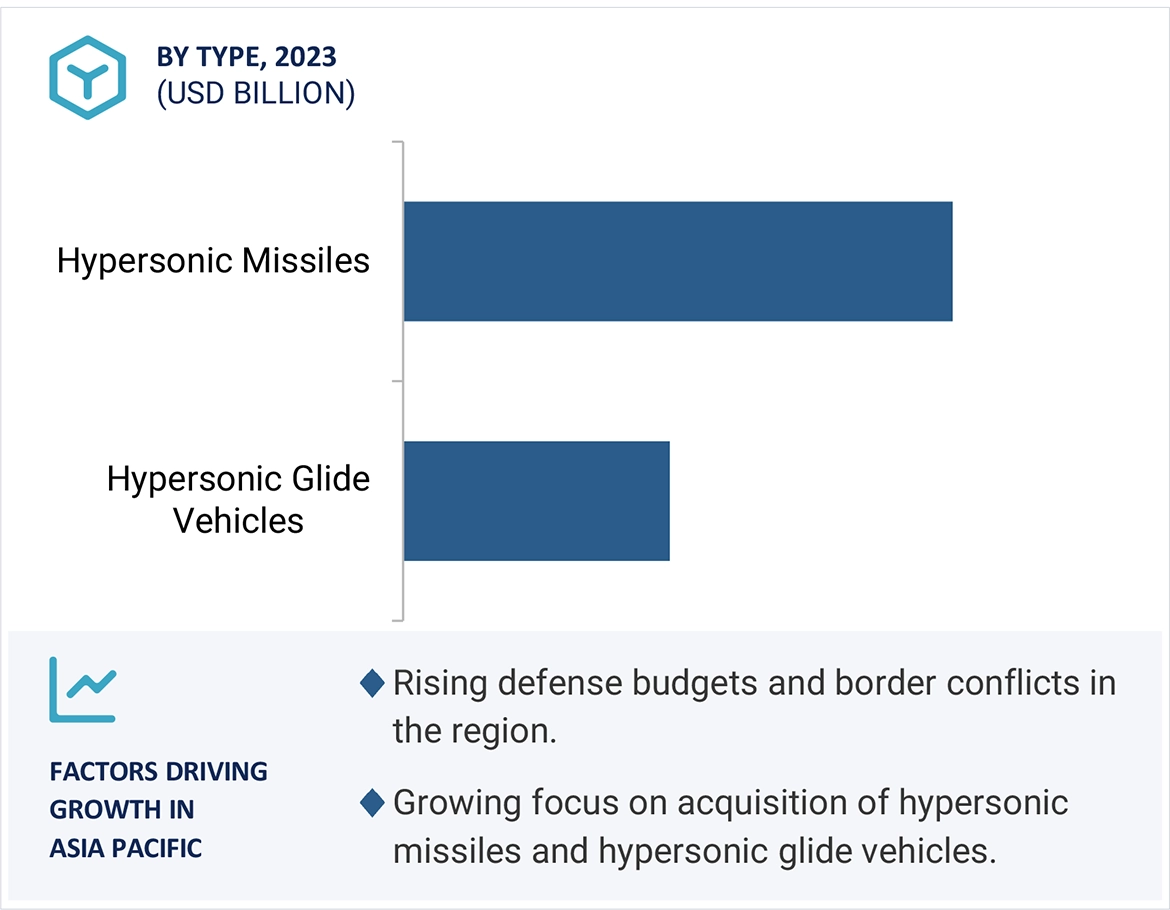
  • To define, describe, and forecast the size of the hypersonic weapons market based on type, domain, range, subsystem, and region from 2023 to 2030.
  • To forecast the size of various segments of the market with respect to major regions, namely, North America, Europe, Asia Pacific, and the Rest of the World (RoW), which comprises the Middle East & Africa, Latin America
  • To identify and analyze key drivers, restraints, opportunities, and challenges influencing the growth of the hypersonic weapons market across the globe.
  • To strategically analyze micromarkets1 with respect to individual growth trends, prospects, and their contribution to the hypersonic weapons market.
  • To analyze opportunities for stakeholders in the market by identifying key market trends
  • To analyze competitive developments such as contracts, acquisitions and expansions, agreements, joint ventures and partnerships, new product launches, and Research & Development (R&D) activities in the hypersonic weapons market.
  • To provide a detailed competitive landscape of the -market, in addition to an analysis of business and corporate strategies adopted by leading market players.
  • To strategically profile key market players and comprehensively analyze their core competencies2.

1. Micro markets refer to further segments and subsegments of the hypersonic weapons market included in the report.

2. Core competencies of the companies were captured in terms of their key developments and strategies adopted by them to sustain their position in the market.

Available customizations

Along with the market data, MarketsandMarkets offers customizations as per the specific needs of companies. The following customization options are available for the report:

Product Analysis

  • Product matrix, which gives a detailed comparison of the product portfolio of each company

Regional Analysis

  • Further breakdown of the market segments at country-level

Company Information

  • Detailed analysis and profiling of additional market players (up to 5)
Custom Market Research Services

We will customize the research for you, in case the report listed above does not meet with your exact requirements. Our custom research will comprehensively cover the business information you require to help you arrive at strategic and profitable business decisions.

Request Customization
Report Code
AS 8690
Published ON
Jun, 2023
Choose License Type
BUY NOW
  • SHARE
X
Request Customization
Speak to Analyst
Speak to Analyst
OR FACE-TO-FACE MEETING
PERSONALIZE THIS RESEARCH
  • Triangulate with your Own Data
  • Get Data as per your Format and Definition
  • Gain a Deeper Dive on a Specific Application, Geography, Customer or Competitor
  • Any level of Personalization
REQUEST A FREE CUSTOMIZATION
LET US HELP YOU!
  • What are the Known and Unknown Adjacencies Impacting the Hypersonic Weapons Market
  • What will your New Revenue Sources be?
  • Who will be your Top Customer; what will make them switch?
  • Defend your Market Share or Win Competitors
  • Get a Scorecard for Target Partners
CUSTOMIZED WORKSHOP REQUEST
+1-888-600-6441
  • Call Us
  • +1-888-600-6441 (Corporate office hours)
  • +1-888-600-6441 (US/Can toll free)
  • +44-800-368-9399 (UK office hours)
CONNECT WITH US
ABOUT TRUST ONLINE
©2024 MarketsandMarkets Research Private Ltd. All rights reserved
DMCA.com Protection Status Website Feedback