In-flight Entertainment & Connectivity Market by Product (IFE Hardware, IFE Connectivity, IFE Content), Class, Aircraft Type (Narrow Body Aircraft, Wide Body Aircraft, Business Jets), End User and Region 2026
The in-flight entertainment and connectivity market is expected to grow from USD 4.7 billion in 2021 to USD 6.1 billion by 2026, at a CAGR of 5.2% during the forecast period. The growth of this market is mainly driven by the increased demand for in-flight experience, increase in aircraft renewals and aircraft deliveries and technological shift.
To know about the assumptions considered for the study, Request for Free Sample Report
COVID-19 Impact on the Global In-flight Entertainment & Connectivity Market
The COVID-19 pandemic has impacted the end-use industries adversely, resulting in a sudden dip in 2020 aircraft orders and deliveries. This is expected to negatively impact the aircraft market in the short term, with slow recovery expected in Q1 of 2021.
The in-flight entertainment & connectivity market includes major players Thales Group (France), Viasat, Inc. (US), Astronics Corporation (US), Iridium Communications Inc. (US), Gogo LLC (US). These players have spread their business across various countries includes North America, Europe, Asia Pacific, Middle East, and Rest of the World. COVID-19 has impacted their businesses as well. Industry experts believe that COVID-19 could affect aircraft wire and cable production and services by 7–10% globally in 2020.
In-flight Entertainment & Connectivity Market Segment Overview
Increasing product launches of IFE hardware is expected to fuel the growth of the in-flight entertainment & connectivity market.
The IFE hardware segment is estimated to lead the market during the forecast period, with a share of 60% in 2021.
IFE hardware enables airline operators to upload, store, and transfer entertainment content on the in-flight entertainment systems. Increasing product launches by companies such as Thales Group drive the growth of the segment. These products offer features such as open operating system and 4K HDR displays.
The first class segment is projected to witness the highest CAGR during the forecast period.
Based on class, the first class segment is projected to be the highest CAGR rate for the in-flight entertainment & connectivity market during the forecast period.
The demand for in-flight comfort and premium services laid the foundation for first class segment. It is the most premium of all the segments. The services start even before the actual flight with transfer from hotels, private check in, premium lounge access. In-flight, the first-class seats are more comfortable and spacious with high quality.
The narrow body aircraft segment is projected to witness the highest CAGR during the forecast period.
Based on the aircraft type, the narrow body aircraft segment is projected to grow at the highest CAGR rate for the in-flight entertainment & connectivity market during the forecast period.
In countries such as India, Japan, Australia, China, the US, and Russia, the demand for domestic air travel has been increasing over the years. According to IATA, in 2019, international air passenger traffic increased 4.1% compared to 2018. Due to the increase in air travel, the demand for narrow body aircraft is expected to grow across the world.
The OEM segment is projected to witness the highest CAGR during the forecast period
Based on end user, the OEM segment is projected to grow at the highest CAGR rate for the in-flight entertainment & connectivity market during the forecast period.
The new airlines focus on pre-installed in-flight system provided by manufacturers. The increase demand of Low-cost carrier can also be seen the southeast Asian region. With the increase in number of passengers aided by the increase in number of aircrafts around the world. The demand of in-flight entertainment has also picked up pace.
The North American market is projected to contribute the largest share
In-flight entertainment & connectivity market in North America is projected to hold the highest market share during the forecast period.
North America accounted for the largest share of 50.0% of the in-flight entertainment & connectivity market and is expected to grow at a CAGR of 5.7% during the forecast period. The presence of major in-flight entertainment & connectivity manufacturers like Viasat, Inc., Astronics Corporation ridium Communications Inc. and Gogo LLC is one of the major reasons for the growth.
To know about the assumptions considered for the study, download the pdf brochure
Top 5 Key Market Players in In-flight Entertainment & Connectivity Market
- Thales Group (France),
- Viasat, Inc. (US),
- Astronics Corporation (US),
- Iridium Communications Inc. (US),
- Gogo LLC (US).
Get online access to the report on the World's First Market Intelligence Cloud
- Easy to Download Historical Data & Forecast Numbers
- Company Analysis Dashboard for high growth potential opportunities
- Research Analyst Access for customization & queries
- Competitor Analysis with Interactive dashboard
- Latest News, Updates & Trend analysis
In-flight Entertainment & Connectivity Market Scope
Report Metric |
Details |
Estimated Market Size | USD 4.7 billion |
Projected Market Size | USD 6.1 billion |
Growth Rate | 5.2% |
Market size available for years |
2017–2026 |
Base year considered |
2020 |
Forecast period |
2021-2026 |
Forecast units |
Value (USD Million) |
Segments covered |
By Product, By Class, By Aircraft Type, By End User |
Geographies covered |
North America, Europe, Asia Pacific, Middle East, and Rest of the World |
Companies covered |
Thales Group (France), Viasat, Inc. (US), Astronics Corporation (US), Iridium Communications Inc. (US), Gogo LLC (US) |
In-flight Entertainment & Connectivity Market Dynamics
Drivers: Increase in demand for in-flight experience
Increasing air passenger traffic in Asia Pacific and developing regions, the air passengers’ traffic has reached to 88% of pre-pandemic levels.
The demand of IFE is increasing rapidly. With DGCA permitting onboard Wi-Fi in India for commercial flights in 2020, the passengers are looking towards it as an experience rather than travel. According to Honeywell, passengers are willing to pay premium for services in flight like customized content.
Passengers nowadays are using more devices than ever before in-flight. According to SITA Passenger IT trends, it was revealed that 65% customers are streaming content on their own devices compared to 44% preferring seat back unit LCDs for in-flight entertainment purpose. According to Inmarsat survey, 55% air passengers consider in-flight Wi-Fi as a crucial requirement while 67% will re-book with an airline if high quality in-flight Wi-Fi is provided. Hence, increasing demand for in-flight experience is driving the growth of IFEC market.
Opportunities: Emerging markets in South-East Asia
The emerging markets contribute significantly to the growth of in-flight entertainment and connectivity market. Countries in Southeast Asia such as India, Pakistan, China, Nepal are emerging markets for IFE&C.
For example, in India, majority of airlines are low-cost carriers or ultra-low-cost carriers. Indigo, GoFirst, Spice jet are the major airlines providing only economy seating in their aircrafts. Passengers don’t have in-flight entertainment available to them. According to Boeing, airliners in Southeast Asian countries will require more than 4,500 airplanes to meet the growing demand. In last decade, Vietnam, Thailand and Indonesia have added the greatest number of airlines in the region. Hence, increasing demand for new aircraft is expected to drive the market for IFEC market.
Challenges: High-Cost IFE
IFE&C market is characterized by high research & development and installation cost. As per Zauba data, seat electronic components cost USD 4500 for a single unit.
The modem unit for connectivity cost USD 18000 per unit. The installation cost for IFE systems goes up to USD 6 million. Hence, high cost of IFEC systems might hamper the growth of the market.
In-flight Entertainment & Connectivity Market Categorization
The study categorizes the in-flight entertainment & connectivity based on product, class, aircraft type, end user, and by region.
By Product
- IFE Hardware
- IFE Connectivity
- IFE Content
By Class
- First Class
- Business Class
- Premium Economy
- Economy
By Aircraft Type
- Narrow Body Aircraft
- Wide Body Aircraft
- Business Jets
By End Use
- OEM
- Aftermarket
By Region
- North America
- Asia Pacific
- Europe
- Middle East
- Rest of the World
Recent Developments in In-flight Entertainment & Connectivity Industry
- In June 2021, Thales launched AVANT UP. An in-flight entertainment system that offers features such as 4K HDR displays, in-seat power, and open operating system. The launch of the product enabled the company to strengthen its position in the global IFEC market.
- In May 2021, Viasat, Inc. signed a contract with JetBlue to provide in-flight connectivity (IFC) solution for its new Airbus A220-300 and Airbus A321 Long Range (LR) aircraft. The contract enabled the company to expand its customer base.
- In January 2021, Panasonic Avionics Corporation and IMG extended their agreement, wherein Panasonic Avionics Corporation will continue to stream Sport 24 and Sport 24 Extra sports content for its international airline customers. The agreement enabled the company to offer enhanced content to its airline customers.
Frequently Asked Questions (FAQ):
What are your views on the growth prospect of the in-flight entertainment & connectivity market?
The in-flight entertainment & connectivity market is expected to grow substantially. The growth of this market is mainly driven by the increased demand for in-flight experience, increase in aircraft renewals and aircraft deliveries and technological shift.
What are the key sustainability strategies adopted by leading players operating in the in-flight entertainment & connectivity market?
Key players have adopted various organic and inorganic strategies to strengthen their position in the in-flight entertainment & connectivity market. The major players include Thales Group (France), Viasat, Inc. (US), Astronics Corporation (US), Iridium Communications Inc. (US), Gogo LLC (US), these players have adopted various strategies, such as acquisitions, contracts, new product launches, and partnerships & agreements, to expand their presence in the market further.
What are the new emerging technologies and use cases disrupting the in-flight entertainment & connectivity market?
With the development of new improved connectivity solutions using satellites and air-to-ground connectivity air passengers are now able to enjoy fast internet for video streaming on personal devices over longer ranges and it is gaining popularity in the industry. With advancement in technology the connectivity solutions have attained next level now such as adoption of electronically steered antennas on flight for better in-flight connectivity. Phasor Antenna Network was the first to introduce the technology in the market, which was quickly followed by others like SatixFy and Gilat Satellite Networks.
IFE trends include 5G connectivity, truly wireless IFE systems, consume VR, and BYOD (Bring your own device). The airlines are providing passengers with viewing content, custom playlists and updates.
Who are the key players and innovators in the ecosystem of the in-flight entertainment & connectivity market?
The key players in the in-flight entertainment & connectivity market include Thales Group (France), Viasat, Inc. (US), Astronics Corporation (US), Iridium Communications Inc. (US), Gogo LLC (US).
Which region is expected to hold the highest market share in the in-flight entertainment & connectivity market?
In-flight entertainment & connectivity market in North America is projected to hold the highest market share during the forecast period. North America accounted for the largest share of 50.0% of the in-flight entertainment & connectivity market and is expected to grow at a CAGR of 5.7% during the forecast period. The presence of major in-flight entertainment & connectivity manufacturers like Viasat, Inc., Astronics Corporation ridium Communications Inc. and Gogo LLC is one of the major reasons for the growth. .
To speak to our analyst for a discussion on the above findings, click Speak to Analyst
TABLE OF CONTENTS
1 INTRODUCTION (Page No. - 29)
1.1 OBJECTIVES OF THE STUDY
1.2 MARKET DEFINITION
1.2.1 MARKETS COVERED
FIGURE 1 IFEC MARKET SEGMENTATION
1.2.2 YEARS CONSIDERED FOR THE STUDY
1.2.3 INCLUSIONS AND EXCLUSIONS
TABLE 1 INCLUSIONS AND EXCLUSIONS IN IFEC MARKET
1.3 CURRENCY & PRICING
1.4 LIMITATIONS
1.5 MARKET STAKEHOLDERS
1.6 SUMMARY OF CHANGES
FIGURE 2 IFEC MARKET TO GROW AT A LOWER RATE COMPARED TO PREVIOUS ESTIMATES
2 RESEARCH METHODOLOGY (Page No. - 34)
2.1 RESEARCH DATA
FIGURE 3 REPORT PROCESS FLOW
FIGURE 4 RESEARCH DESIGN
2.1.1 SECONDARY DATA
2.1.1.1 Key data from secondary sources
2.1.2 PRIMARY DATA
2.1.2.1 Key primary sources
2.2 MARKET SIZE ESTIMATION
2.2.1 SEGMENTS AND SUBSEGMENTS
2.3 RESEARCH APPROACH & METHODOLOGY
2.3.1 BOTTOM-UP APPROACH
2.3.2 IN-FLIGHT ENTERTAINMENT AND CONNECTIVITY OEM MARKET
FIGURE 5 OEM MARKET SIZE CALCULATION
2.3.3 IN-FLIGHT ENTERTAINMENT AND CONNECTIVITY AFTERMARKET
FIGURE 6 MARKET SIZE CALCULATION FOR AFTERMARKET
FIGURE 7 MARKET SIZE ESTIMATION: BOTTOM-UP APPROACH
2.3.4 TOP-DOWN APPROACH
FIGURE 8 MARKET SIZE ESTIMATION METHODOLOGY: TOP-DOWN APPROACH
2.4 DATA TRIANGULATION
FIGURE 9 DATA TRIANGULATION
2.4.1 TRIANGULATION THROUGH PRIMARY AND SECONDARY RESEARCH
2.5 GROWTH RATE ASSUMPTIONS
2.6 ASSUMPTIONS FOR RESEARCH STUDY
2.7 RISKS
3 EXECUTIVE SUMMARY (Page No. - 43)
FIGURE 10 IFE HARDWARE SEGMENT ESTIMATED TO ACCOUNT FOR LARGEST SHARE OF IN-FLIGHT ENTERTAINMENT AND CONNECTIVITY MARKET IN 2021
FIGURE 11 IN-FLIGHT ENTERTAINMENT AND CONNECTIVITY MARKET, BY CLASS, 2021
FIGURE 12 AFTERMARKET ESTIMATED TO ACCOUNT FOR A LARGER SHARE IN 2021
FIGURE 13 IN-FLIGHT ENTERTAINMENT AND CONNECTIVITY MARKET IN NORTH AMERICA TO GROW AT HIGHEST CAGR DURING FORECAST PERIOD
4 PREMIUM INSIGHTS (Page No. - 46)
4.1 ATTRACTIVE GROWTH OPPORTUNITIES IN IN-FLIGHT ENTERTAINMENT AND CONNECTIVITY MARKET
FIGURE 14 DEMAND FOR IN-FLIGHT EXPERIENCE EXPECTED TO DRIVE MARKET FROM 2O21 TO 2026
4.2 IN-FLIGHT ENTERTAINMENT AND CONNECTIVITY MARKET, BY AIRCRAFT TYPE
FIGURE 15 WIDE BODY AIRCRAFT SEGMENT PROJECTED TO LEAD MARKET FROM 2021 TO 2026
4.3 IN-FLIGHT ENTERTAINMENT AND CONNECTIVITY MARKET, BY PRODUCT
FIGURE 16 IFE HARDWARE SEGMENT PROJECTED TO LEAD MARKET FROM 2021 TO 2026
4.4 IN-FLIGHT ENTERTAINMENT AND CONNECTIVITY MARKET, BY COUNTRY
FIGURE 17 MARKET IN INDIA PROJECTED TO GROW AT HIGHEST CAGR FROM 2021 TO 2026
5 MARKET OVERVIEW (Page No. - 48)
5.1 INTRODUCTION
5.2 MARKET DYNAMICS
FIGURE 18 IN-FLIGHT ENTERTAINMENT AND CONNECTIVITY MARKET DYNAMICS
5.2.1 DRIVERS
5.2.1.1 Increase in demand for in-flight experience
TABLE 2 FEATURES OF IN-FLIGHT ENTERTAINMENT SYSTEMS
5.2.1.2 Technology shift
5.2.1.3 Rise in aircraft orders and deliveries
FIGURE 19 FLEET SIZE FOR TOP 20 AIRLINERS
5.2.2 RESTRAINTS
5.2.2.1 Complex design architecture
5.2.2.2 Regulations and certifications
5.2.3 OPPORTUNITIES
5.2.3.1 Emerging markets in Southeast Asia
5.2.3.2 Rise in adoption rate of IFEC
5.2.4 CHALLENGES
5.2.4.1 COVID-19 impact
5.2.4.2 High cost of IFE systems
5.3 COVID-19 IMPACT SCENARIOS
5.4 TRENDS/DISRUPTIONS IMPACTING CUSTOMERS’ BUSINESS
5.5 MARKET ECOSYSTEM
5.5.1 PROMINENT COMPANIES
5.5.2 PRIVATE AND SMALL ENTERPRISES
5.5.3 END CUSTOMERS AND USERS
FIGURE 20 IFEC MARKET ECOSYSTEM
TABLE 3 IFEC MARKET ECOSYSTEM
5.6 PRICING ANALYSIS
TABLE 4 AVERAGE SELLING PRICE: IN-FLIGHT ENTERTAINMENT & CONNECTIVITY, BY AIRCRAFT TYPE (USD)
5.7 TARIFF REGULATORY LANDSCAPE FOR IFEC INDUSTRY
5.8 VALUE CHAIN ANALYSIS OF IN-FLIGHT ENTERTAINMENT AND CONNECTIVITY MARKET
FIGURE 21 VALUE CHAIN ANALYSIS
5.9 PORTER’S FIVE FORCES MODEL
TABLE 5 IN-FLIGHT ENTERTAINMENT AND CONNECTIVITY MARKET: PORTER’S FIVE FORCES ANALYSIS
5.9.1 THREAT OF NEW ENTRANTS
5.9.2 THREAT OF SUBSTITUTES
5.9.3 BARGAINING POWER OF SUPPLIERS
5.9.4 BARGAINING POWER OF BUYERS
5.9.5 COMPETITION IN THE INDUSTRY
5.10 TECHNOLOGY ANALYSIS
5.10.1 5G TECHNOLOGY
5.10.2 WIRELESS ARCHITECTURE
5.10.3 WI-FI AND CONNECTIVITY AND CONSUMER VR
5.11 USE CASES
5.11.1 URBAN AIR MOBILITY
5.11.2 ENABLING A2G AND SATELLITE CONNECTIVITY
5.11.3 AIRCRAFT NETWORK INTEGRATION WITH 5G
5.12 OPERATIONAL DATA
TABLE 6 NEW COMMERCIAL AIRPLANE DELIVERIES, BY REGION, 2019-2038
5.13 VOLUME DATA
TABLE 7 OEM: IN-FLIGHT ENTERTAINMENT & CONNECTIVITY, BY AIRCRAFT TYPE (UNITS)
TABLE 8 AFTERMARKET: IN-FLIGHT ENTERTAINMENT & CONNECTIVITY, BY AIRCRAFT TYPE (UNITS)
6 INDUSTRY TRENDS (Page No. - 63)
6.1 INTRODUCTION
6.2 TECHNOLOGY ROADMAP
6.3 TECHNOLOGY TRENDS
6.3.1 5G CONNECTIVITY ONBOARD
6.3.2 TRULY WIRELESS IFE SYSTEMS
6.3.3 CONSUMER VR
6.3.4 EYE-TRACKING TECHNOLOGY
6.4 INNOVATIONS & PATENT REGISTRATION
6.5 IMPACT OF MEGATREND
7 IN-FLIGHT ENTERTAINMENT & CONNECTIVITY MARKET, BY PRODUCT (Page No. - 67)
7.1 INTRODUCTION
FIGURE 22 IFE HARDWARE SEGMENT TO GROW AT HIGHEST CAGR DURING FORECAST PERIOD
TABLE 9 IN-FLIGHT ENTERTAINMENT AND CONNECTIVITY MARKET, BY PRODUCT, 2017–2020 (USD MILLION)
TABLE 10 IN-FLIGHT ENTERTAINMENT AND CONNECTIVITY MARKET, BY PRODUCT, 2021–2026 (USD MILLION)
7.2 IFE HARDWARE
TABLE 11 IFE HARDWARE MARKET, BY TYPE, 2017–2020 (USD MILLION)
TABLE 12 IFE HARDWARE MARKET, BY TYPE, 2021–2026 (USD MILLION)
7.2.1 PORTABLE HARDWARE
TABLE 13 PORTABLE HARDWARE MARKET, BY TYPE, 2017–2020 (USD MILLION)
TABLE 14 PORTABLE HARDWARE MARKET, BY TYPE, 2021–2026 (USD MILLION)
7.2.1.1 Dock able seatback units
7.2.1.1.1 Increasing aircraft deliveries to drive segment growth
7.2.1.2 Removable storage devices
7.2.1.2.1 Convenience offered by removable storage devices to fuel the segment growth
7.2.1.3 Others
7.2.1.3.1 Advancement in technology to drive this segment
7.2.2 NON-PORTABLE HARDWARE
TABLE 15 NON-PORTABLE HARDWARE MARKET, BY TYPE, 2017–2020 (USD MILLION)
TABLE 16 NON-PORTABLE HARDWARE MARKET, BY PRODUCT TYPE, 2021–2026 (USD MILLION)
7.2.2.1 Embedded seat back units
7.2.2.1.1 Advanced products offered by market players to drive segment
7.2.2.2 Seat electronic boxes
7.2.2.2.1 Increasing air passenger traffic to fuel segment growth
7.2.2.3 Media servers
7.2.2.3.1 Increasing demand for advanced IFEC systems to drive segment
7.2.2.4 Others
7.2.2.4.1 Features provided by processors and digital video content to drive segment growth
7.3 IFE CONNECTIVITY
TABLE 17 IFE CONNECTIVITY MARKET, BY TYPE, 2017–2020 (USD MILLION)
TABLE 18 IFE CONNECTIVITY MARKET, BY TYPE, 2021–2026 (USD MILLION)
7.3.1 IFE WIRED CONNECTIVITY
TABLE 19 IFE WIRED CONNECTIVITY MARKET, BY TYPE, 2017–2020 (USD MILLION)
TABLE 20 IFE WIRED CONNECTIVITY MARKET, BY TYPE, 2021–2026 (USD MILLION)
7.3.1.1 Wires & cables
7.3.1.1.1 Increasing demand for connected aircraft to fuel the segment growth
7.3.1.2 Ethernet cables
7.3.1.2.1 High-performance offered by ethernet cables drive their demand
7.3.1.3 Control units
7.3.1.3.1 Growing demand for onboard internet connectivity to drive the demand for control units
7.3.1.4 Others
7.3.1.4.1 Features offered by connectors propel the growth of other wired IFE connectivity solutions
7.3.2 IFE WIRELESS CONNECTIVITY
TABLE 21 IFE WIRELESS CONNECTIVITY MARKET, BY TYPE, 2017–2020 (USD MILLION)
TABLE 22 IFE WIRELESS CONNECTIVITY MARKET, BY TYPE, 2021–2026 (USD MILLION)
7.3.2.1 Wireless access points
7.3.2.1.1 Rising demand for in-flight Wi-Fi will drive this segment
7.3.2.2 Wireless antennas
7.3.2.2.1 Increasing satellite launches propel demand for wireless antennas
7.3.2.3 Others
7.3.2.3.1 Features provided by modems drive this segment
7.4 IFE CONTENT
TABLE 23 IFE CONTENT MARKET, BY TYPE, 2017–2020 (USD MILLION)
TABLE 24 IFE CONTENT MARKET, BY TYPE, 2021–2026 (USD MILLION)
7.4.1 STORED CONTENT SERVICES
7.4.2 STREAMED CONTENT SERVICES
TABLE 25 STREAMED CONTENT SERVICES MARKET, BY TYPE, 2017–2020 (USD MILLION)
TABLE 26 STREAMED CONTENT SERVICESMARKET, BY TYPE, 2021–2026 (USD MILLION)
7.4.2.1 In-flight media
7.4.2.1.1 Rising demand for streaming platforms like Netflix to drive the segment
7.4.2.2 In-flight information
7.4.2.2.1 Increasing demand from passengers to access real-time aircraft information is driving this segment
7.4.2.3 In-flight internet
7.4.2.3.1 Adoption of in-flight internet by prominent airlines to drive segment
7.4.2.4 In-flight online shopping/advertisement
7.4.2.4.1 Increasing need for ancillary revenue by airlines to fuel the segment growth
7.4.2.5 In-flight phone/messaging/email
7.4.2.5.1 Increasing need of passengers to remain connected during air travel propel demand for these connectivity solutions
7.4.2.6 Others
7.4.2.6.1 Advanced services offered by IFEC players is fueling growth this segment
8 IN-FLIGHT ENTERTAINMENT & CONNECTIVITY MARKET, BY AIRCRAFT TYPE (Page No. - 79)
8.1 INTRODUCTION
FIGURE 23 WIDE BODY AIRCRAFT SEGMENT TO LEAD MARKET FOR DURING FORECAST PERIOD
TABLE 27 IN-FLIGHT ENTERTAINMENT AND CONNECTIVITY MARKET, BY AIRCRAFT TYPE, 2017–2020 (USD MILLION)
TABLE 28 IN-FLIGHT ENTERTAINMENT AND CONNECTIVITY MARKET, BY AIRCRAFT TYPE, 2021–2026 (USD MILLION)
8.2 NARROW BODY AIRCRAFT
8.2.1 GROWTH IN AIR PASSENGER TRAFFIC TO DRIVE DEMAND
FIGURE 24 NARROW BODY AIRCRAFT DELIVERIES (UNITS), 2019-2021
8.3 WIDE BODY AIRCRAFT
8.3.1 INCREASING DEMAND FOR IN-FLIGHT ENTERTAINMENT OVER LONG DISTANCES TO FUEL GROWTH OF THESE AIRCRAFT
FIGURE 25 WIDE BODY AIRCRAFT DELIVERIES (UNITS), 2019 TO 2021 (Q1)
8.4 BUSINESS JETS
8.4.1 INCREASE IN CORPORATE PROFITS TO DRIVE SEGMENT GROWTH
9 IN-FLIGHT ENTERTAINMENT & CONNECTIVITY MARKET, BY CLASS (Page No. - 83)
9.1 INTRODUCTION
FIGURE 26 FIRST CLASS SEGMENT TO LEAD IFEC MARKET DURING FORECAST PERIOD
TABLE 29 IN-FLIGHT ENTERTAINMENT AND CONNECTIVITY MARKET, BY CLASS, 2017–2020 (USD MILLION)
TABLE 30 IN-FLIGHT ENTERTAINMENT AND CONNECTIVITY MARKET, BY CLASS, 2021–2026 (USD MILLION)
9.2 FIRST CLASS
9.2.1 DEMAND FOR IN-FLIGHT COMFORT AND PREMIUM SERVICES DRIVES THIS SEGMENT
9.3 BUSINESS CLASS
9.3.1 INCREASING NUMBER OF BUSINESS TRAVELERS FUELS SEGMENT GROWTH
9.4 PREMIUM ECONOMY
9.4.1 UPGRADATION OF IN-FLIGHT ENTERTAINMENT SYSTEMS DRIVES THIS SEGMENT
9.5 ECONOMY
9.5.1 DEMAND FOR ADDITIONAL IN-FLIGHT SERVICES FUELS GROWTH OF THIS SEGMENT
10 IN-FLIGHT ENTERTAINMENT & CONNECTIVITY MARKET, BY END USER (Page No. - 87)
10.1 INTRODUCTION
FIGURE 27 OEM SEGMENT TO GROW AT HIGHER CAGR DURING FORECAST PERIOD
TABLE 31 IN-FLIGHT ENTERTAINMENT AND CONNECTIVITY MARKET, BY END USER, 2017–2020 (USD MILLION)
TABLE 32 IN-FLIGHT ENTERTAINMENT AND CONNECTIVITY MARKET, BY END USER, 2021–2026 (USD MILLION)
10.2 OEM
10.2.1 INCREASING NEW AIRCRAFT DELIVERIES DRIVES THE SEGMENT
TABLE 33 IN-FLIGHT ENTERTAINMENT AND CONNECTIVITY OEM MARKET, BY AIRCRAFT TYPE, 2017–2020 (USD MILLION)
TABLE 34 IN-FLIGHT ENTERTAINMENT AND CONNECTIVITY OEM MARKET, BY AIRCRAFT TYPE, 2021–2026 (USD MILLION)
10.3 AFTERMARKET
10.3.1 RISE IN UPGRADATION OF IFEC SYSTEMS DRIVES THIS SEGMENT
TABLE 35 IN-FLIGHT ENTERTAINMENT AND CONNECTIVITY AFTERMARKET, BY AIRCRAFT TYPE, 2017–2020 (USD MILLION)
TABLE 36 IN-FLIGHT ENTERTAINMENT AND CONNECTIVITY AFTERMARKET, BY AIRCRAFT TYPE, 2021–2026 (USD MILLION)
11 REGIONAL ANALYSIS (Page No. - 91)
11.1 INTRODUCTION
FIGURE 28 IN-FLIGHT ENTERTAINMENT & CONNECTIVITY MARKET: REGIONAL SNAPSHOT
11.2 IMPACT OF COVID-19
FIGURE 29 IMPACT OF COVID-19 ON IN-FLIGHT ENTERTAINMENT AND CONNECTIVITY MARKET
TABLE 37 IN-FLIGHT ENTERTAINMENT AND CONNECTIVITY MARKET, BY REGION, 2017–2020 (USD MILLION)
TABLE 38 IN-FLIGHT ENTERTAINMENT AND CONNECTIVITY MARKET, BY REGION, 2021–2026 (USD MILLION)
11.3 NORTH AMERICA
FIGURE 30 NORTH AMERICA: IN-FLIGHT ENTERTAINMENT & CONNECTIVITY MARKET SNAPSHOT
TABLE 39 NORTH AMERICA: MARKET, BY COUNTRY, 2017–2020 (USD MILLION)
TABLE 40 NORTH AMERICA: MARKET, BY COUNTRY, 2021–2026 (USD MILLION)
TABLE 41 NORTH AMERICA: MARKET, BY END USER, 2017–2020 (USD MILLION)
TABLE 42 NORTH AMERICA: MARKET, BY END USER, 2021–2026 (USD MILLION)
TABLE 43 NORTH AMERICA: IN-FLIGHT ENTERTAINMENT & CONNECTIVITY OEM MARKET, BY AIRCRAFT TYPE, 2017–2020 (USD MILLION)
TABLE 44 NORTH AMERICA: IN-FLIGHT ENTERTAINMENT & CONNECTIVITY OEM MARKET, BY AIRCRAFT TYPE, 2021–2026 (USD MILLION)
TABLE 45 NORTH AMERICA: IN-FLIGHT ENTERTAINMENT & CONNECTIVITY AFTERMARKET, BY AIRCRAFT TYPE, 2017–2020 (USD MILLION)
TABLE 46 NORTH AMERICA: IN-FLIGHT ENTERTAINMENT & CONNECTIVITY AFTERMARKET, BY AIRCRAFT TYPE, 2021–2026 (USD MILLION)
11.3.1 NORTH AMERICA: PESTLE ANALYSIS
11.3.2 US
11.3.2.1 Growing civil aviation to drive market
TABLE 47 US: IN-FLIGHT ENTERTAINMENT & CONNECTIVITY MARKET, BY END USER, 2017–2020 (USD MILLION)
TABLE 48 US: MARKET, BY END USER, 2021–2026 (USD MILLION)
TABLE 49 US: IN-FLIGHT ENTERTAINMENT & CONNECTIVITY OEM MARKET, BY AIRCRAFT TYPE, 2017–2020 (USD MILLION)
TABLE 50 US: IN-FLIGHT ENTERTAINMENT & CONNECTIVITY OEM MARKET, BY AIRCRAFT TYPE, 2021–2026 (USD MILLION)
TABLE 51 US: IN-FLIGHT ENTERTAINMENT & CONNECTIVITY AFTERMARKET, BY AIRCRAFT TYPE, 2017–2020 (USD MILLION)
TABLE 52 US: IN-FLIGHT ENTERTAINMENT & CONNECTIVITY AFTERMARKET, BY AIRCRAFT TYPE, 2021–2026 (USD MILLION)
11.3.3 CANADA
11.3.3.1 Increased R&D in aerospace sector to drive market
TABLE 53 CANADA: IN-FLIGHT ENTERTAINMENT & CONNECTIVITY MARKET, BY END USER, 2017–2020 (USD MILLION)
TABLE 54 CANADA: MARKET, BY END USER, 2021–2026 (USD MILLION)
TABLE 55 CANADA: IN-FLIGHT ENTERTAINMENT & CONNECTIVITY OEM MARKET, BY AIRCRAFT TYPE, 2017–2020 (USD MILLION)
TABLE 56 CANADA: IN-FLIGHT ENTERTAINMENT & CONNECTIVITY OEM MARKET, BY AIRCRAFT TYPE, 2021–2026 (USD MILLION)
TABLE 57 CANADA: IN-FLIGHT ENTERTAINMENT & CONNECTIVITY AFTERMARKET, BY AIRCRAFT TYPE, 2017–2020 (USD MILLION)
TABLE 58 CANADA: IN-FLIGHT ENTERTAINMENT & CONNECTIVITY AFTERMARKET, BY AIRCRAFT TYPE, 2021–2026 (USD MILLION)
11.4 EUROPE
FIGURE 31 EUROPE: IN-FLIGHT ENTERTAINMENT & CONNECTIVITY MARKET SNAPSHOT
TABLE 59 EUROPE: MARKET, BY COUNTRY, 2017–2020 (USD MILLION)
TABLE 60 EUROPE: MARKET, BY COUNTRY, 2021–2026 (USD MILLION)
TABLE 61 EUROPE: IN-FLIGHT ENTERTAINMENT AND CONNECTIVITY MARKET, BY END USER, 2017–2020 (USD MILLION)
TABLE 62 EUROPE: MARKET, BY END USER, 2021–2026 (USD MILLION)
TABLE 63 EUROPE: IN-FLIGHT ENTERTAINMENT & CONNECTIVITY OEM MARKET, BY AIRCRAFT TYPE, 2017–2020 (USD MILLION)
TABLE 64 EUROPE: IN-FLIGHT ENTERTAINMENT & CONNECTIVITY OEM MARKET, BY AIRCRAFT TYPE, 2021–2026 (USD MILLION)
TABLE 65 EUROPE: IN-FLIGHT ENTERTAINMENT & CONNECTIVITY AFTERMARKET, BY AIRCRAFT TYPE, 2017–2020 (USD MILLION)
TABLE 66 EUROPE: IN-FLIGHT ENTERTAINMENT & CONNECTIVITY AFTERMARKET, BY AIRCRAFT TYPE, 2021–2026 (USD MILLION)
11.4.1 EUROPE: PESTLE ANALYSIS
11.4.2 FRANCE
11.4.2.1 Investment in the aerospace sector and presence of major IFE players and aircraft OEM to drive market
TABLE 67 FRANCE: IN-FLIGHT ENTERTAINMENT & CONNECTIVITY MARKET, BY END USER, 2017–2020 (USD MILLION)
TABLE 68 FRANCE: MARKET, BY END USER, 2021–2026 (USD MILLION)
TABLE 69 FRANCE: IN-FLIGHT ENTERTAINMENT & CONNECTIVITY OEM MARKET, BY AIRCRAFT TYPE, 2017–2020 (USD MILLION)
TABLE 70 FRANCE: IN-FLIGHT ENTERTAINMENT & CONNECTIVITY OEM MARKET, BY AIRCRAFT TYPE, 2021–2026 (USD MILLION)
TABLE 71 FRANCE: IN-FLIGHT ENTERTAINMENT & CONNECTIVITY AFTERMARKET, BY AIRCRAFT TYPE, 2017–2020 (USD MILLION)
TABLE 72 FRANCE: IN-FLIGHT ENTERTAINMENT & CONNECTIVITY AFTERMARKET, BY AIRCRAFT TYPE, 2021–2026 (USD MILLION)
11.4.3 RUSSIA
11.4.3.1 Presence of prominent airlines to drive market in Russia
TABLE 73 RUSSIA: IN-FLIGHT ENTERTAINMENT & CONNECTIVITY MARKET, BY END USER, 2017–2020 (USD MILLION)
TABLE 74 RUSSIA: MARKET, BY END USER, 2021–2026 (USD MILLION)
TABLE 75 RUSSIA: IN-FLIGHT ENTERTAINMENT & CONNECTIVITY OEM MARKET, BY AIRCRAFT TYPE, 2021–2026 (USD MILLION)
TABLE 76 RUSSIA: IN-FLIGHT ENTERTAINMENT & CONNECTIVITY AFTERMARKET, BY AIRCRAFT TYPE, 2017–2020 (USD MILLION)
TABLE 77 RUSSIA: IN-FLIGHT ENTERTAINMENT & CONNECTIVITY AFTERMARKET, BY AIRCRAFT TYPE, 2021–2026 (USD MILLION)
11.4.4 GERMANY
11.4.4.1 Rising investments in air travel and aircraft to drive the market
TABLE 78 GERMANY: IN-FLIGHT ENTERTAINMENT & CONNECTIVITY MARKET, BY END USER, 2017–2020 (USD MILLION)
TABLE 79 GERMANY: MARKET, BY END USER, 2021–2026 (USD MILLION)
TABLE 80 GERMANY: IN-FLIGHT ENTERTAINMENT & CONNECTIVITY AFTERMARKET, BY AIRCRAFT TYPE, 2017–2020 (USD MILLION)
TABLE 81 GERMANY: IN-FLIGHT ENTERTAINMENT & CONNECTIVITY AFTERMARKET, BY AIRCRAFT TYPE, 2021–2026 (USD MILLION)
11.4.5 UK
11.4.5.1 Investments in airports to drive the market
TABLE 82 UK: IN-FLIGHT ENTERTAINMENT & CONNECTIVITY MARKET, BY END USER, 2017–2020 (USD MILLION)
TABLE 83 UK: MARKET, BY END USER, 2021–2026 (USD MILLION)
TABLE 84 UK: IN-FLIGHT ENTERTAINMENT & CONNECTIVITY AFTERMARKET, BY AIRCRAFT TYPE, 2017–2020 (USD MILLION)
TABLE 85 UK: IN-FLIGHT ENTERTAINMENT & CONNECTIVITY AFTERMARKET, BY AIRCRAFT TYPE, 2021–2026 (USD MILLION)
11.4.6 REST OF EUROPE
11.4.6.1 Rising air passenger traffic to boost market growth
TABLE 86 REST OF EUROPE: IN-FLIGHT ENTERTAINMENT & CONNECTIVITY MARKET, BY END USER, 2017–2020 (USD MILLION)
TABLE 87 REST OF EUROPE: IN-FLIGHT ENTERTAINMENT AND CONNECTIVITY MARKET, BY END USER, 2021–2026 (USD MILLION)
TABLE 88 REST OF EUROPE: IN-FLIGHT ENTERTAINMENT & CONNECTIVITY OEM MARKET, BY AIRCRAFT TYPE, 2017–2020 (USD MILLION)
TABLE 89 REST OF EUROPE: IN-FLIGHT ENTERTAINMENT & CONNECTIVITY OEM MARKET, BY AIRCRAFT TYPE, 2021–2026 (USD MILLION)
TABLE 90 REST OF EUROPE: IN-FLIGHT ENTERTAINMENT & CONNECTIVITY AFTERMARKET, BY AIRCRAFT TYPE, 2017–2020 (USD MILLION)
TABLE 91 REST OF EUROPE: IN-FLIGHT ENTERTAINMENT & CONNECTIVITY AFTERMARKET, BY AIRCRAFT TYPE, 2021–2026 (USD MILLION)
11.5 ASIA PACIFIC
FIGURE 32 ASIA PACIFIC: IN-FLIGHT ENTERTAINMENT & CONNECTIVITY MARKET SNAPSHOT
TABLE 92 ASIA PACIFIC: MARKET, BY COUNTRY, 2017–2020 (USD MILLION)
TABLE 93 ASIA PACIFIC: MARKET, BY COUNTRY, 2021–2026 (USD MILLION)
TABLE 94 ASIA PACIFIC: MARKET, BY END USER, 2017–2020 (USD MILLION)
TABLE 95 ASIA PACIFIC: MARKET, BY END USER, 2021–2026 (USD MILLION)
TABLE 96 ASIA PACIFIC: IN-FLIGHT ENTERTAINMENT & CONNECTIVITY AFTERMARKET, BY AIRCRAFT TYPE, 2017–2020 (USD MILLION)
TABLE 97 ASIA PACIFIC: IN-FLIGHT ENTERTAINMENT & CONNECTIVITY AFTERMARKET, BY AIRCRAFT TYPE, 2021–2026 (USD MILLION)
11.5.1 ASIA PACIFIC: PESTLE ANALYSIS
11.5.2 CHINA
11.5.2.1 Increasing demand for new aircraft to drive the market
TABLE 98 CHINA: IN-FLIGHT ENTERTAINMENT & CONNECTIVITY MARKET, BY END USER, 2017–2020 (USD MILLION)
TABLE 99 CHINA: MARKET, BY END USER, 2021–2026 (USD MILLION)
TABLE 100 CHINA: IN-FLIGHT ENTERTAINMENT & CONNECTIVITY AFTERMARKET, BY AIRCRAFT TYPE, 2017–2020 (USD MILLION)
TABLE 101 CHINA: IN-FLIGHT ENTERTAINMENT & CONNECTIVITY AFTERMARKET, BY AIRCRAFT TYPE, 2021–2026 (USD MILLION)
11.5.3 INDIA
11.5.3.1 Development of airport infrastructure to drive market
TABLE 102 INDIA: IN-FLIGHT ENTERTAINMENT & CONNECTIVITY MARKET, BY END USER, 2017–2020 (USD MILLION)
TABLE 103 INDIA: MARKET, BY END USER, 2021–2026 (USD MILLION)
TABLE 104 INDIA: IN-FLIGHT ENTERTAINMENT & CONNECTIVITY AFTERMARKET, BY AIRCRAFT TYPE, 2017–2020 (USD MILLION)
TABLE 105 INDIA: IN-FLIGHT ENTERTAINMENT & CONNECTIVITY AFTERMARKET, BY AIRCRAFT TYPE, 2021–2026 (USD MILLION)
11.5.4 JAPAN
11.5.4.1 High economic stability to drive IFEC market in Japan
TABLE 106 JAPAN: IN-FLIGHT ENTERTAINMENT & CONNECTIVITY MARKET, BY END USER, 2017–2020 (USD MILLION)
TABLE 107 JAPAN: MARKET, BY END USER, 2021–2026 (USD MILLION)
TABLE 108 JAPAN: IN-FLIGHT ENTERTAINMENT & CONNECTIVITY AFTERMARKET, BY AIRCRAFT TYPE, 2017–2020 (USD MILLION)
TABLE 109 JAPAN: IN-FLIGHT ENTERTAINMENT & CONNECTIVITY AFTERMARKET, BY AIRCRAFT TYPE, 2021–2026 (USD MILLION)
11.5.5 SINGAPORE
11.5.5.1 Increasing adoption of IFEC systems to enhance passenger experience to drive the market
TABLE 110 SINGAPORE: IN-FLIGHT ENTERTAINMENT & CONNECTIVITY MARKET, BY END USER, 2017–2020 (USD MILLION)
TABLE 111 SINGAPORE: MARKET, BY END USER, 2021–2026 (USD MILLION)
TABLE 112 SINGAPORE: IN-FLIGHT ENTERTAINMENT & CONNECTIVITY AFTERMARKET, BY AIRCRAFT TYPE, 2017–2020 (USD MILLION)
TABLE 113 SINGAPORE: IN-FLIGHT ENTERTAINMENT & CONNECTIVITY AFTERMARKET, BY AIRCRAFT TYPE, 2021–2026 (USD MILLION)
11.5.6 REST OF ASIA PACIFIC
11.5.6.1 Replacement of old aircraft to drive IFEC market
TABLE 114 REST OF ASIA PACIFIC: IN-FLIGHT ENTERTAINMENT & CONNECTIVITY MARKET, BY END USER, 2017–2020 (USD MILLION)
TABLE 115 REST OF ASIA PACIFIC: MARKET, BY END USER, 2021–2026 (USD MILLION)
TABLE 116 REST OF ASIA PACIFIC: IN-FLIGHT ENTERTAINMENT & CONNECTIVITY AFTERMARKET, BY AIRCRAFT TYPE, 2017–2020 (USD MILLION)
TABLE 117 REST OF ASIA PACIFIC: IN-FLIGHT ENTERTAINMENT & CONNECTIVITY AFTERMARKET, BY AIRCRAFT TYPE, 2021–2026 (USD MILLION)
11.6 MIDDLE EAST
FIGURE 33 MIDDLE EAST: IN-FLIGHT ENTERTAINMENT & CONNECTIVITY MARKET SNAPSHOT
TABLE 118 MIDDLE EAST: MARKET, BY COUNTRY, 2017–2020 (USD MILLION)
TABLE 119 MIDDLE EAST: MARKET, BY COUNTRY, 2021–2026 (USD MILLION)
TABLE 120 MIDDLE EAST: MARKET, BY END USER, 2017–2020 (USD MILLION)
TABLE 121 MIDDLE EAST: MARKET, BY END USER, 2021–2026 (USD MILLION)
TABLE 122 MIDDLE EAST: IN-FLIGHT ENTERTAINMENT & CONNECTIVITY AFTERMARKET, 2017–2020 (USD MILLION)
TABLE 123 MIDDLE EAST: IN-FLIGHT ENTERTAINMENT & CONNECTIVITY AFTERMARKET, 2021–2026 (USD MILLION)
11.6.1 MIDDLE EAST: PESTLE ANALYSIS
11.6.2 UAE
11.6.2.1 Growth of civil aviation to drive market
TABLE 124 UAE: IN-FLIGHT ENTERTAINMENT & CONNECTIVITY MARKET, BY END USER, 2017–2020 (USD MILLION)
TABLE 125 UAE: IN-FLIGHT ENTERTAINMENT AND CONNECTIVITY MARKET, BY END USER, 2021–2026 (USD MILLION)
TABLE 126 UAE: IN-FLIGHT ENTERTAINMENT & CONNECTIVITY AFTERMARKET, BY AIRCRAFT TYPE, 2017–2020 (USD MILLION)
TABLE 127 UAE: IN-FLIGHT ENTERTAINMENT & CONNECTIVITY AFTERMARKET, BY AIRCRAFT TYPE, 2021–2026 (USD MILLION)
11.6.3 QATAR
11.6.3.1 High air passenger traffic to drive the market
TABLE 128 QATAR: IN-FLIGHT ENTERTAINMENT & CONNECTIVITY MARKET, BY END USER, 2017–2020 (USD MILLION)
TABLE 129 QATAR: IN-FLIGHT ENTERTAINMENT AND CONNECTIVITY MARKET, BY END USER, 2021–2026 (USD MILLION)
TABLE 130 QATAR: IN-FLIGHT ENTERTAINMENT & CONNECTIVITY AFTERMARKET, BY AIRCRAFT TYPE, 2017–2020 (USD MILLION)
TABLE 131 QATAR: IN-FLIGHT ENTERTAINMENT & CONNECTIVITY AFTERMARKET, BY AIRCRAFT TYPE, 2021–2026 (USD MILLION)
11.6.4 SAUDI ARABIA
11.6.4.1 Construction of airports to drive market
TABLE 132 SAUDI ARABIA: IN-FLIGHT ENTERTAINMENT & CONNECTIVITY MARKET, BY END USER, 2017–2020 (USD MILLION)
TABLE 133 SAUDI ARABIA: MARKET, BY END USER, 2021–2026 (USD MILLION)
TABLE 134 SAUDI ARABIA: IN-FLIGHT ENTERTAINMENT & CONNECTIVITY AFTERMARKET, BY AIRCRAFT TYPE, 2017–2020 (USD MILLION)
TABLE 135 SAUDI ARABIA: IN-FLIGHT ENTERTAINMENT & CONNECTIVITY AFTERMARKET, BY AIRCRAFT TYPE, 2021–2026 (USD MILLION)
11.6.5 REST OF MIDDLE EAST
11.6.5.1 Growth of IFE aftermarket services in wide body aircraft will drive market
TABLE 136 REST OF MIDDLE EAST: IN-FLIGHT ENTERTAINMENT & CONNECTIVITY MARKET, BY END USER, 2017–2020 (USD MILLION)
TABLE 137 REST OF MIDDLE EAST: IN-FLIGHT ENTERTAINMENT AND CONNECTIVITY MARKET, BY END USER, 2021–2026 (USD MILLION)
TABLE 138 REST OF MIDDLE EAST: IN-FLIGHT ENTERTAINMENT & CONNECTIVITY AFTERMARKET, BY AIRCRAFT TYPE, 2017–2020 (USD MILLION)
TABLE 139 REST OF MIDDLE EAST: IN-FLIGHT ENTERTAINMENT & CONNECTIVITY AFTERMARKET, BY AIRCRAFT TYPE, 2021–2026 (USD MILLION)
11.7 REST OF THE WORLD
FIGURE 34 REST OF THE WORLD: IN-FLIGHT ENTERTAINMENT & CONNECTIVITY MARKET SNAPSHOT
TABLE 140 REST OF THE WORLD: MARKET, BY COUNTRY, 2017–2020 (USD MILLION)
TABLE 141 REST OF THE WORLD: MARKET, BY COUNTRY, 2021–2026 (USD MILLION)
TABLE 142 REST OF THE WORLD: MARKET, BY END USER, 2017–2020 (USD MILLION)
TABLE 143 REST OF THE WORLD: MARKET, BY END USER, 2021–2026 (USD MILLION)
TABLE 144 REST OF THE WORLD: IN-FLIGHT ENTERTAINMENT & CONNECTIVITY OEM MARKET, BY AIRCRAFT TYPE, 2017–2020 (USD MILLION)
TABLE 145 REST OF THE WORLD: IN-FLIGHT ENTERTAINMENT & CONNECTIVITY OEM MARKET, BY AIRCRAFT TYPE, 2021–2026 (USD MILLION)
TABLE 146 REST OF THE WORLD: IN-FLIGHT ENTERTAINMENT & CONNECTIVITY AFTERMARKET, BY AIRCRAFT TYPE, 2017–2020 (USD MILLION)
TABLE 147 REST OF THE WORLD: IN-FLIGHT ENTERTAINMENT & CONNECTIVITY AFTERMARKET, BY AIRCRAFT TYPE, 2021–2026 (USD MILLION)
11.7.1 REST OF THE WORLD: PESTLE ANALYSIS
11.7.2 SOUTH AFRICA
11.7.2.1 Single African Transport Market to aid the growth of aviation sector and IFEC market in the region
TABLE 148 SOUTH AFRICA: IN-FLIGHT ENTERTAINMENT & CONNECTIVITY MARKET, BY END USER, 2017–2020 (USD MILLION)
TABLE 149 SOUTH AFRICA: MARKET, BY END USER, 2021–2026 (USD MILLION)
TABLE 150 SOUTH AFRICA: IN-FLIGHT ENTERTAINMENT & CONNECTIVITY AFTERMARKET, BY AIRCRAFT TYPE, 2017–2020 (USD MILLION)
TABLE 151 SOUTH AFRICA: IN-FLIGHT ENTERTAINMENT & CONNECTIVITY AFTERMARKET, BY AIRCRAFT TYPE, 2021–2026 (USD MILLION)
11.7.3 BRAZIL
11.7.3.1 Growing investment in aviation sector will drive market
TABLE 152 BRAZIL: IN-FLIGHT ENTERTAINMENT & CONNECTIVITY MARKET, BY END USER, 2017–2020 (USD MILLION)
TABLE 153 BRAZIL: MARKET, BY END USER, 2021–2026 (USD MILLION)
TABLE 154 BRAZIL: IN-FLIGHT ENTERTAINMENT & CONNECTIVITY OEM MARKET, BY AIRCRAFT TYPE, 2017–2020 (USD MILLION)
TABLE 155 BRAZIL: IN-FLIGHT ENTERTAINMENT & CONNECTIVITY OEM MARKET, BY AIRCRAFT TYPE, 2021–2026 (USD MILLION)
TABLE 156 BRAZIL: IN-FLIGHT ENTERTAINMENT & CONNECTIVITY AFTERMARKET, BY AIRCRAFT TYPE, 2017–2020 (USD MILLION)
TABLE 157 BRAZIL: IN-FLIGHT ENTERTAINMENT & CONNECTIVITY AFTERMARKET, BY AIRCRAFT TYPE, 2021–2026 (USD MILLION)
12 COMPETITIVE LANDSCAPE (Page No. - 140)
12.1 INTRODUCTION
TABLE 158 KEY DEVELOPMENTS BY LEADING PLAYERS IN IN-FLIGHT ENTERTAINMENT & CONNECTIVITY MARKET BETWEEN 2018 AND 2021
12.2 MARKET SHARE ANALYSIS OF LEADING PLAYERS 2020
TABLE 159 DEGREE OF COMPETITION
FIGURE 35 MARKET SHARE OF THE TOP PLAYERS IN THE IN-FLIGHT ENTERTAINMENT & CONNECTIVITY MARKET, 2020
12.3 REVENUE ANALYSIS OF THE TOP FIVE MARKET PLAYERS, 2020
FIGURE 36 COLLECTIVE REVENUE SHARE OF TOP 5 PLAYERS
TABLE 160 COMPANY REGION FOOTPRINT
TABLE 161 COMPANY PRODUCT FOOTPRINT
TABLE 162 COMPANY AIRCRAFT TYPE FOOTPRINT
12.4 COMPETITIVE EVALUATION QUADRANT
12.4.1 STAR
12.4.2 PERVASIVE
12.4.3 EMERGING LEADER
12.4.4 PARTICIPANT
FIGURE 37 IN-FLIGHT ENTERTAINMENT & CONNECTIVITY MARKET COMPETITIVE LEADERSHIP MAPPING, 2021
12.4.5 PROGRESSIVE COMPANIES
12.4.6 RESPONSIVE COMPANIES
12.4.7 STARTING BLOCKS
12.4.8 DYNAMIC COMPANIES
FIGURE 38 IN-FLIGHT ENTERTAINMENT & CONNECTIVITY COMPETITIVE LEADERSHIP MAPPING (SME)
12.5 COMPETITIVE SCENARIO
12.5.1 NEW PRODUCT LAUNCHES
TABLE 163 NEW PRODUCT LAUNCHES, AUGUST 2018–AUGUST 2021
12.5.2 DEALS
TABLE 164 DEALS, AUGUST 2018– AUGUST 2021
12.5.3 DIVESTMENTS
TABLE 165 DIVESTMENTS, AUGUST 2018–AUGUST 2021
12.5.4 EXPANSION
TABLE 166 EXPANSION, AUGUST 2018–AUGUST 2021
12.5.5 ACQUISITION
TABLE 167 ACQUISITION, AUGUST 2017–AUGUST 2021
13 COMPANY PROFILES (Page No. - 156)
(Business Overview, Products Offered, Recent Developments, MnM View Right to win, Strategic choices made, Weaknesses and competitive threats) *
13.1 INTRODUCTION
13.2 KEY PLAYERS
13.2.1 PANASONIC AVIONICS CORPORATION
TABLE 168 PANASONIC AVIONICS CORPORATION: BUSINESS OVERVIEW
TABLE 169 PANASONIC AVIONICS CORPORATION: AGREEMENT
TABLE 170 PANASONIC AVIONICS CORPORATION: PRODUCT LAUNCH
13.2.2 THALES GROUP
TABLE 171 THALES GROUP: BUSINESS OVERVIEW
FIGURE 39 THALES GROUP: COMPANY SNAPSHOT
TABLE 172 THALES GROUP: PRODUCT LAUNCH
TABLE 173 THALES GROUP: AGREEMENT
TABLE 174 THALES GROUP: EXPANSION
TABLE 175 THALES GROUP: PARTNERSHIP
13.2.3 GOGO LLC
TABLE 176 GOGO LLC: BUSINESS OVERVIEW
FIGURE 40 GOGO LLC.: COMPANY SNAPSHOT
13.2.4 VIASAT INC.
TABLE 177 VIASAT, INC.: BUSINESS OVERVIEW
FIGURE 41 VIASAT, INC.: COMPANY SNAPSHOT
13.2.5 SAFRAN GROUP
TABLE 178 SAFRAN GROUP: BUSINESS OVERVIEW
FIGURE 42 SAFRAN GROUP: COMPANY SNAPSHOT
13.2.6 SITA
TABLE 179 SITA: BUSINESS OVERVIEW
13.2.7 HONEYWELL INTERNATIONAL INC.
TABLE 180 HONEYWELL INTERNATIONAL INC.: BUSINESS OVERVIEW
FIGURE 43 HONEYWELL INTERNATIONAL INC.: COMPANY SNAPSHOT
13.2.8 ASTRONICS CORPORATION
TABLE 181 ASTRONICS CORPORATION: BUSINESS OVERVIEW
FIGURE 44 ASTRONICS CORPORATION: COMPANY SNAPSHOT
TABLE 182 ASTRONICS CORPORATION: AGREEMENT
13.2.9 BAE SYSTEMS
TABLE 183 BAE SYSTEMS: BUSINESS OVERVIEW
FIGURE 45 BAE SYSTEMS: COMPANY SNAPSHOT
13.2.10 IRIDIUM COMMUNICATIONS INC.
TABLE 184 IRIDIUM COMMUNICATIONS INC.: BUSINESS OVERVIEW
FIGURE 46 IRIDIUM COMMUNICATIONS INC.: COMPANY SNAPSHOT
13.2.11 COLLINS AEROSPACE
TABLE 185 COLLINS AEROSPACE: BUSINESS OVERVIEW
13.3 OTHER PLAYERS
13.3.1 ANUVU
13.3.2 LUFTHANSA SYSTEMS
13.3.3 COBHAM AEROSPACE COMMUNICATION
13.3.4 EUTELSAT COMMUNICATIONS SA
13.3.5 INMARSAT GLOBAL LIMITED
13.3.6 IMMFLY
13.3.7 INFLIGHT VR
13.3.8 SMARTSKY NETWORKS, LLC
13.3.9 FDS AVIONICS CORP.
13.3.10 AEROPLAY ENTERTAINMENT
13.3.11 IMAGIK INTERNATIONAL CORP.
13.3.12 BLUEBOX AVIATION
13.3.13 SKYLIGHTS
13.3.14 BURRANA
*Details on Business Overview, Products Offered, Recent Developments, MnM View, Right to win, Strategic choices made, Weaknesses and competitive threats might not be captured in case of unlisted companies.
14 APPENDIX (Page No. - 200)
14.1 DISCUSSION GUIDE
14.2 KNOWLEDGE STORE: MARKETSANDMARKETS’ SUBSCRIPTION PORTAL
14.3 AVAILABLE CUSTOMIZATION
14.4 RELATED REPORTS
14.5 AUTHOR DETAILS
The research study involved the extensive use of secondary sources, directories, and databases such as D&B Hoovers, Bloomberg, and Factiva to identify and collect information relevant to the in-flight entertainment & connectivity market. Primary sources include industry experts from the in-flight entertainment & connectivity market as well as suppliers, manufacturers, solution providers, technology developers, alliances, and organizations related to all segments of the value chain of this market. In-depth interviews with various primary respondents, including key industry participants, subject matter experts (SMEs), industry consultants, and C-level executives, were conducted to obtain and verify critical qualitative and quantitative information pertaining to the in-flight entertainment & connectivity market as well as to assess the growth prospects of the market.
Secondary Research
In the secondary research process, various sources were referred to for identifying and collecting information for this study. The secondary sources included government sources, such as the International Air Transport Association (IATA); the Federal Aviation Administration (FAA); the General Aviation Manufacturers Association (GAMA); corporate filings such as annual reports, press releases, and investor presentations of companies; white papers, journals, and certified publications; and articles from recognized authors, directories, and databases.
Primary Research
In the primary research process, various primary sources from both supply and demand sides were interviewed to obtain qualitative and quantitative information on the market. The primary sources from the supply side included various industry experts, such as Chief X Officers (CXOs), Vice Presidents (VPs), Directors, from business development, marketing, product development/innovation teams, and related key executives from in-flight entertainment & connectivity manufacturers; system integrators; component providers; distributors; and key opinion leaders.
Primary interviews were conducted to gather insights such as market statistics, data of revenue collected from the products and services, market breakdowns, market size estimations, market forecasting, and data triangulation. Primary research also helped in understanding the various trends related to technology, product, end user, and region. Stakeholders from the demand side, such as CIOs, CTOs, and CSOs, and installation teams of the customer/end users who are using in-flight entertainment & connectivity were interviewed to understand the buyer’s perspective on the suppliers, products, component providers, and their current usage of in-flight entertainment & connectivity and future outlook of their business which will affect the overall market.
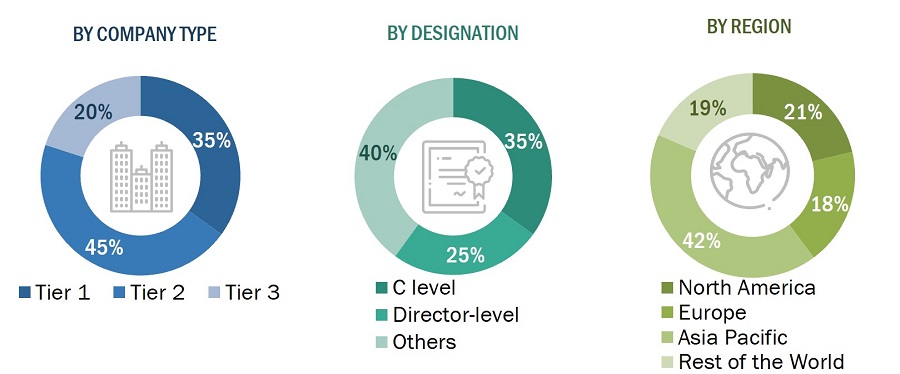
The breakup of Primary Research:
To know about the assumptions considered for the study, download the pdf brochure
Market Size Estimation
Both top-down and bottom-up approaches were used to estimate and validate the total size of the in-flight entertainment & connectivity market. These methods were also used extensively to estimate the size of various segments and subsegments of the market. The research methodology used to estimate the market size included the following:
- Key players in the industry and market were identified through extensive secondary research of their product matrix and geographical presence and developments undertaken by them.
- All percentage shares, splits, and breakdowns were determined using secondary sources and verified through primary sources.
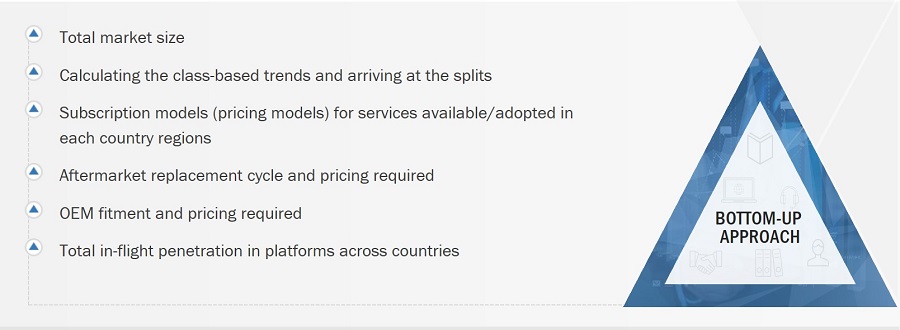
Global In-flight Entertainment & Connectivity Market Size: Bottom-Up Approach
To know about the assumptions considered for the study, Request for Free Sample Report
Data Triangulation
After arriving at the overall size of the in-flight entertainment & connectivity market from the estimation process explained above, the total market was split into several segments and subsegments. The data triangulation and market breakdown procedures explained below were implemented, wherever applicable, to complete the overall market engineering process and arrive at the exact statistics for various market segments and subsegments. The data was triangulated by studying various factors and trends. Along with this, the market size was validated using the top-down and bottom-up approaches.
Report Objectives
- To define, describe, segment, and forecast the In-flight Entertainment and Connectivity market based on product, class, aircraft type and end user.
- To forecast the size of various segments of the In-Flight Entertainment and Connectivity market based on five regions—North America, Europe, Asia Pacific, the Middle East, and Rest of the World¯along with major countries in each region.
- To identify and analyze key drivers, restraints, opportunities, and challenges influencing the growth of the market
- To analyze technological advancements and product launches in the market
- To analyze micromarkets with respect to their growth trends, prospects, and contribution to the overall market
- To provide a detailed competitive landscape of the market, along with market share analysis of key players
- To strategically profile key players and comprehensively analyze their market position in terms of shares and core competencies
Available Customizations
MarketsandMarkets offers the following customizations for this market report:
- Additional country-level analysis of the in-flight entertainment & connectivity market
- Profiling of additional market players (up to 5)
Product Analysis
- Product matrix, which provides a detailed comparison of the product portfolio of each company in the In-flight Entertainment & Connectivity Market
Growth opportunities and latent adjacency in In-flight Entertainment & Connectivity Market
Trying to assess the value chain revenue share and profitability for the in-flight connectivity market.
I am curious to learn more about in-flight entertainment in the airline industry. How can I gain access to this report?