The study involved four major activities in estimating the size of the IT asset disposition market. Exhaustive secondary research has been done to collect information on the market, peer market, and parent market. Validation of these findings, assumptions, and sizing with industry experts across the value chain through primary research has been the next step. Both top-down and bottom-up approaches have been employed to estimate the global market size. After that, market breakdown and data triangulation have been used to estimate the market sizes of segments and subsegments.
Secondary Research
Various secondary sources were used to identify and collect relevant information. These include corporate filings such as annual reports, press releases, investor presentations, and financial statements; trade, business, and professional associations; white papers, journals, and articles from recognized authors; certified publications related to IT asset disposition; directories; and databases.
Secondary research was conducted to obtain key information about the supply chain of the industry, the monetary chain of the market, the total pool of key players, the segmentation of the market according to industry trends to the bottommost level, geographic markets, and key developments from the market-oriented perspective. Secondary data was collected and analyzed to arrive at the overall market size, which was further validated through primary research.
Primary Research
In the primary research process, various primary sources, from both supply and demand sides, were interviewed to obtain qualitative and quantitative information for this report. Primary sources from the supply side included experts such as chief executive officers (CEOs), vice presidents, marketing directors, technology and innovation directors, SMEs, consultants, and related key executives from the major companies and organizations operating in the IT asset disposition market.
After the complete market engineering process (which includes market statistics calculations, market breakdown, market size estimations, market forecasting, and data triangulation), extensive primary research was conducted to gather information and verify and validate the critical market numbers.
Several primary interviews were conducted with experts from both the demand and supply sides across four major regions—North America, Europe, Asia Pacific, and RoW. Approximately 25% of the primary interviews were conducted with demand respondents and 75% with supply respondents. This primary data was collected through questionnaires, emails, and telephonic interviews.

To know about the assumptions considered for the study, download the pdf brochure
Market Size Estimation
Both top-down and bottom-up approaches have been used to estimate and validate the total size of the IT asset disposition market. These methods have also been extensively used to estimate the sizes of various market subsegments. The research methodology used to estimate the market sizes includes the following:
-
More than 25 companies offering IT asset disposition services were identified, and their offerings were mapped based on service, end-user, and region.
-
The global IT asset disposition market was derived through the data sanity method. The revenues of ITAD service providers were analyzed through annual reports and press releases and summed up to derive the overall market size.
-
For each company, a percentage was assigned to the overall revenue to derive the revenues from the IT asset disposition segment.
-
The percentage of each company was assigned after analyzing various factors, including the company’s product offerings, its range of IT asset disposition-related offerings, geographic presence, research & development expenditure and initiatives, and recent developments/strategies adopted for growth in the IT asset disposition market.
-
For the CAGR, the market trend analysis of IT asset disposition was carried out by understanding the industry penetration rate and the demand for and supply of IT asset disposition services in different sectors.
-
Estimates at every level were verified and crosschecked through discussions with key opinion leaders, including CXOs, directors, operation managers, and domain experts in MarketsandMarkets.
-
Various paid and unpaid information sources were studied, such as annual reports, press releases, white papers, and databases.
Market Size Estimation Methodology-Bottom-up Approach

Market Size Estimation Methodology-Top-Down Approach

Data Triangulation
After arriving at the overall market size through the earlier process, the total market was split into several segments. The market breakdown and data triangulation procedures were employed, wherever applicable, to complete the overall market engineering process and arrive at the exact statistics for all the segments and subsegments. The data was triangulated by studying various factors and trends from both the demand and supply sides. The market was validated using both the top-down and bottom-up approaches.
Market Definition
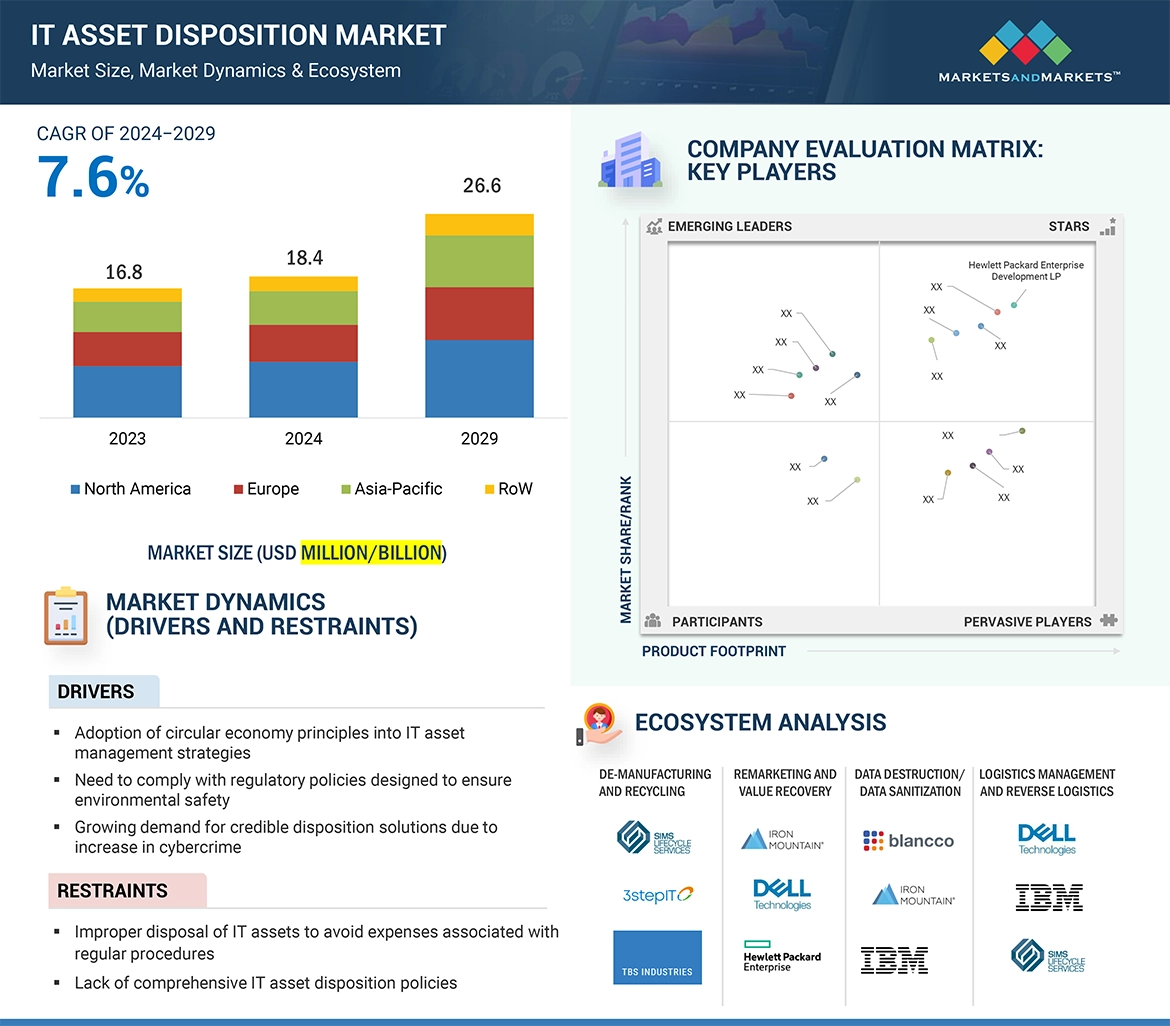
IT asset disposition refers to the disposal of obsolete or unwanted IT equipment in a safe, secure, and environmentally friendly manner. Due to rapid technological advances and the innovation of new products, the IT market is becoming more advanced and competitive. As a result, there is a rise in the number of obsolete equipment in the market—the proper and safe disposal of which is critical to ensure compliance with stringent regulatory standards for the safety of the environment.
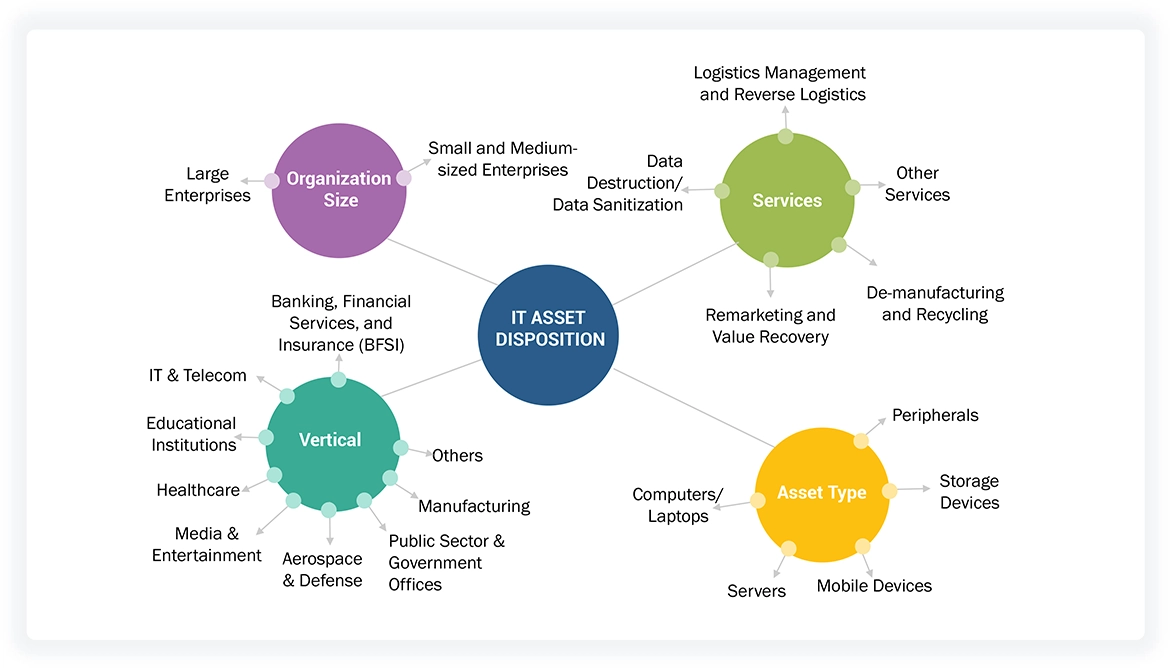
End-user organizations often prefer third-party vendors or service providers for the disposition of their used and old IT assets in a safe and secure manner. The key offerings of these service providers in this market space are data destruction/data sanitization, asset recycling, asset remarketing, logistics management, and reverse logistics. These service providers are certified in accordance with regulatory compliances and mandates for the proper disposal of e-waste and data destruction. Assets such as computers/laptops, servers, storage devices, mobile devices, and peripherals are considered for disposition. The market is diversified, with more than 25 companies competing across the value chain to sustain their position and increase their market share.
Stakeholders
-
IT asset disposition service providers
-
IT asset manufacturing organizations
-
Research organizations and consulting companies
-
Associations, organizations, forums, and alliances related to IT asset disposition
-
Government bodies such as regulatory authorities and policymakers
-
Venture capitalists, private equity firms, and start-up companies
Research Objectives
-
To define, describe, and forecast the IT asset disposition (ITAD) market, by service, asset type, organization size, vertical, and region, in terms of value
-
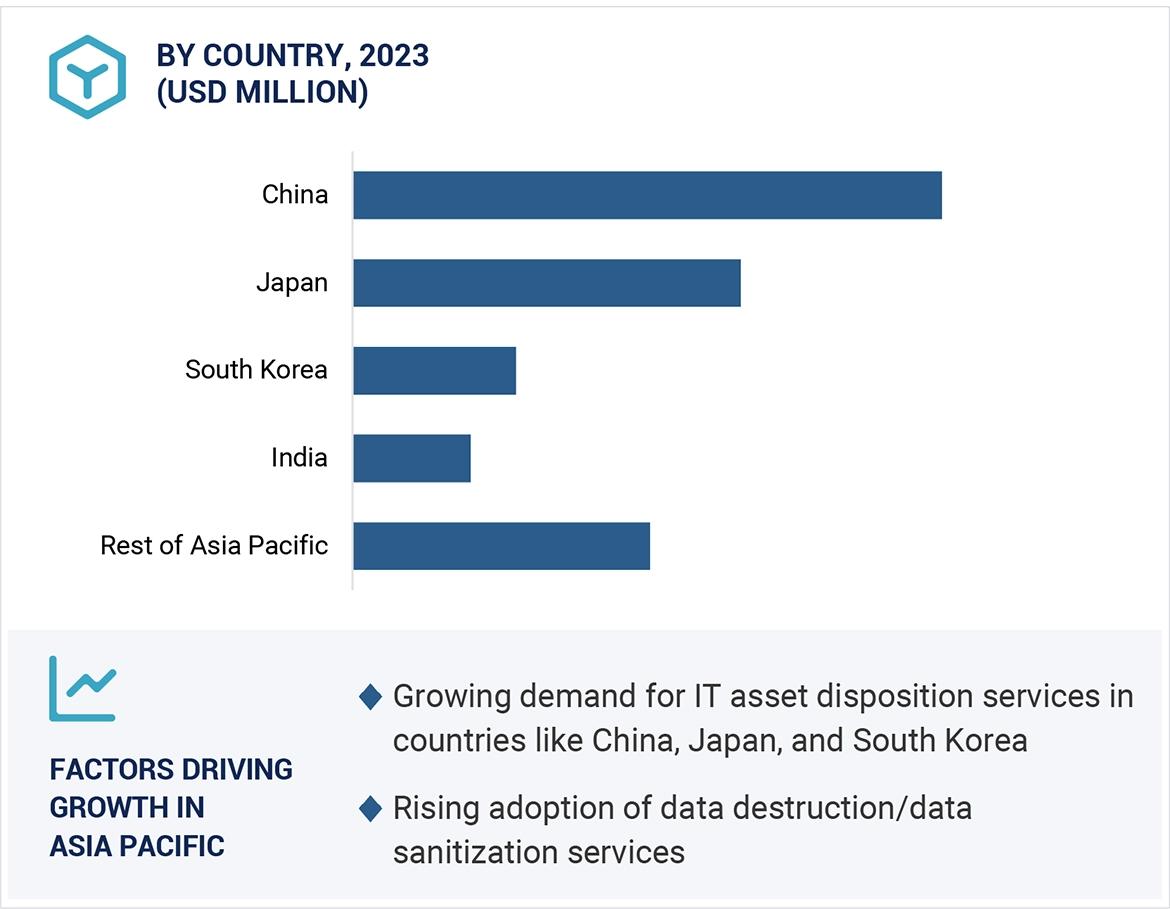
To provide the market size for North America, Europe, Asia Pacific, and Rest of the World (RoW), along with their respective country-level market sizes, in terms of value
-
To provide detailed information regarding the drivers, restraints, opportunities, and challenges that influence market growth
-
To provide a detailed overview of the IT asset disposition value chain
-
To strategically analyze micromarkets1 with respect to individual growth trends, prospects, and contributions to the total market
-
To analyze key trends that shape and influence the global IT asset disposition market
-
To profile key players and comprehensively analyze their ranking/share based on their revenues and core competencies2
-
To evaluate opportunities in the market for stakeholders and provide details about the competitive landscape of the market
-
To scrutinize competitive developments in the IT asset disposition market, such as partnerships, contracts, and research and development (R&D)
Available Customizations:
MarketsandMarkets offers the following customizations for this market report:
-
Further breakdown of the market in different regions to the country-level
-
Detailed analysis and profiling of additional market players (up to 5)


John
Aug, 2019
Looking for detailed breakdown of ITAD market size by region and by asset type. Particular looking for laptops, notebooks, desktops, tablets etc....
Alejandro
Feb, 2019
Hi everybody. I am looking for information about the IT remarketing and I think this PDF could have interesting information about it. .
ed
Jan, 2019
I am very interested in learning more about the ITAD market and would like some additional market research info.
Aura
May, 2019
I would like to know more about the stronger ITAD suppliers in the region (North America and Latin America). .