Laboratory Filtration Market

Laboratory Filtration Market by Product (Filter Media, Filtration Assembly, Accessories), Technology (Ultrafiltration, Microfiltration, Nanofiltration, Reverse Osmosis), End User (Pharma, Biopharma, F&B, Academic institutes) - Global Forecast to 2026

Report Code: BT 2761 Nov, 2021, by marketsandmarkets.com

[252 Pages Report] The global laboratory filtration market is projected to reach USD 5.3 billion by 2026 from USD 3.6 billion in 2021, at a CAGR of 7.8% from 2021 to 2026. Growth in this market is driven majorly by the rising R&D spending in the pharmaceutical & biopharmaceutical industry, growing demand for membrane filtration technology, increasing purity requirements in end-user segments, and growing focus on developing large-molecule biopharmaceuticals. However, the high cost of systems is expected to restrain the growth of the lab filtration market to a certain extent during the forecast period.

Laboratory Filtration Market

To know about the assumptions considered for the study, Request for Free Sample Report

COVID-19 impact on the Laboratory Filtration Market

COVID-19 is an infectious disease caused by the most recently discovered novel coronavirus. Largely unknown before the outbreak began in Wuhan (China) in December 2019, COVID-19 has moved from a regional crisis to a global pandemic in just a matter of a few weeks. With the World Health Organization (WHO) officially declaring the outbreak of COVID-19 a pandemic, a mix of established pharmaceutical and biopharmaceutical companies, as well as small startups, have stepped forward to develop treatments and vaccines that target the infection caused by the novel coronavirus.

The economic and social burden of the pandemic has prompted government bodies globally to increase support for vaccine development and manufacturing, which has led to an increase in the adoption of laboratory filtration products for COVID-19 research. Various filtration techniques are used in the development and production of vaccines. Clarification (removal of suspended matter from a fluid medium) of vaccines is a crucial step that impacts product recovery and subsequent downstream purification.

To support the downstream process (including filtration and purification) of vaccine development, biopharmaceutical firms are opting for various filtration techniques and materials. For instance, in September 2020, Merck Millipore donated Eijkman Institute for Molecular Biology (Indonesia) research instruments and materials worth IDR 1.2 billion (USD 0.086 million) to expedite the process of vaccine development. Merck donated water purification systems that produce high-quality type-3 pure water with integrated reverse osmosis membranes for pretreatment and high performance.

Global the Laboratory Filtration Market Dynamics

DRIVER: Rising R&D spending in pharmaceutical & biotechnology industries

Pharmaceutical and biotechnology companies use laboratory filtration products for making new drugs. The importance of drugs based on biotechnology is expected to grow. According to Evaluate Pharma, biotechnology products will account for 37% of the total prescription and OTC sales in 2026, up from 30% in 2020. By 2026, biotechnology will account for more than half the 100 top-selling medicines (Source: Evaluate Pharma).

Pharmaceutical companies invest in R&D to deliver high-quality and innovative products in the market. The trend suggests that the top pharmaceutical companies are increasing their R&D efficiencies through heavy R&D investments to see returns on their investment in the longer term and through collaborative R&D efforts. According to Evaluate Pharma, worldwide pharmaceutical R&D spending was valued at USD 160 billion in 2016; this figure will reach USD 254 billion by 2026. As per previous reports, this R&D spending is expected to grow steadily between 2019 and 2026 at a CAGR of 4.2% to reach USD 254 billion, slower than the historical CAGR of 4.7% between 2012 and 2019.

CHALLENGES: High price sensitivity among end users

Currently, end users of laboratory filtration equipment such as the pharmaceutical & biotechnology industry are facing the challenge of cost containment, despite their demand for better and technologically advanced products. This has increased the pressure on laboratory filtration equipment and accessory manufacturers to offer quality products at lower prices. This price sensitivity has resulted in stagnated prices in the laboratory filtration equipment market. Moreover, the intense competition in most laboratory filtration markets prevents manufacturers from passing on R&D costs and other increases in production costs to end users, resulting in lower profit margins

OPPORTUNITY: Advances in nanofiber technology

In pharmaceutical filtration, the newly developed nanofiber coating technology offers greater flexibility, control, and durability as compared to the traditional process of electrospinning. This new coating is made of fibers typically ranging from 0.3 to 0.5 microns in size, which can be increased to up to 1 micron. The fiber diameter distribution and layer thickness can easily be changed according to application requirements. The NANOWEB advanced nanofiber technology offers benefits in both air and liquid filtration and can be specifically designed to meet the stringent filtration requirements of many liquid applications. It also addresses the growing need for advanced microfiltration as well as reverse osmosis and ultrafiltration in a variety of liquid service applications, including life sciences, food & beverage, and process liquid filtration.

The filtration media segment accounted for the largest share of the market, by product, in 2020:

Based on product, the market is segmented into filtration media (filter papers, membrane filters, syringe and syringeless filters, filtration microplates, and other filtration media), filtration assemblies (microfiltration assemblies, reverse osmosis assemblies, ultrafiltration assemblies, vacuum filtration assemblies, and other filtration assemblies), and filtration accessories (filter holders, filter funnels, filter flasks, membrane dispensers, filter housings, cartridges, vacuum pumps, seals, and other filtration accessories). The filtration media segment accounted for the largest market share in 2018. The major factors driving market growth in this segment are the wider application of filtration media in processes such as sterilizing, final filtration, sample preparation, filtration of aqueous & organic solutions, fluid monitoring, and venting & gas filtration, as well as the increasing R&D activities in the biopharmaceutical & pharmaceutical industries.

Pharmaceutical & biopharmaceutical companies are the largest end users of the lab filtration market

Based on end user, the market is segmented into pharmaceutical & biopharmaceutical companies, the food & beverage industry, hospitals & diagnostic laboratories, and academic & research institutions. The pharmaceutical & biotechnology companies segment accounted for the largest market share in 2020. The high adoption of lab filtration in pharmaceutical & biotechnology companies for the development of large drug molecules accounts for the large share of this segment. Furthermore, increasing regulations for the manufacturing of defect-free end products will also drive focus on quality control measures in the pharmaceutical & biotechnology industry and, thereby, support market growth

Laboratory Filtration Market by Region

To know about the assumptions considered for the study, download the pdf brochure

North America was the largest regional market for laboratory filtration in 2020.

The global laboratory filtration market is segmented into North America, Europe, the Asia Pacific, Latin America, and the Middle East & Africa. In 2020, North America accounted for the largest share of 37.4% of the global laboratory filtration market, followed by Europe with a share of 30.0%. The large share of the North American region can be attributed to a large number of pharmaceutical & biotechnology and food & beverage companies in the region, the presence of a well-established healthcare market, and the stringent regulatory scenario in the pharmaceutical industry.

Key Market Players

The prominent players in the market are Merck Millipore (US), Danaher Corporation (US), Sartorius AG (Germany), 3M Company (US), GEA GROUP AKTIENGESELLSCHAFT (Germany), Steris (US), Thermo Fisher Scientific (US), Veolia Water Technologies (France), Avantor, Inc. (US), GVS S.p.A (Italy), MANN+HUMMEL (Germany), Agilent Technologies, Inc. (US), Ahlstrom-Munksjö (Finland), MACHEREY-NAGEL GmbH & Co. KG (Germany), AMD Manufacturing, Inc. (Canada), Koch Membrane Systems (US), Cole-Parmer (US), AQUAPORIN A/S (Denmark), and Sterlitech Corporation (US).

Get online access to the report on the World's First Market Intelligence Cloud

  • Easy to Download Historical Data & Forecast Numbers
  • Company Analysis Dashboard for high growth potential opportunities
  • Research Analyst Access for customization & queries
  • Competitor Analysis with Interactive dashboard
  • Latest News, Updates & Trend analysis
Request Sample

Scope of the Report

Report Metric

Details

Market size available for years

2019–2026

Base year considered

2020

Forecast period

2021–2026

Forecast units

Value (USD)

Segments covered

Product, Technique, End user and Region

Geographies covered

North America, Europe, Asia Pacific, Latin America, Middle East & Africa

Companies covered

Merck Millipore (US), Danaher Corporation (US), Sartorius AG (Germany), 3M Company (US), GEA GROUP AKTIENGESELLSCHAFT (Germany), STERIS (US), Thermo Fisher Scientific (US), Veolia Water Technologies (France), Avantor, Inc (US), GVS S.p.A (Italy), MANN+HUMMEL (Germany), Agilent Technologies, Inc (US), Ahlstrom-Munksjö (Finland), MACHEREY-NAGEL GmbH & Co. KG (Germany), AMD Manufacturing, Inc. (Canada), Koch Separation Solutions (US), Cole-Parmer (US), AQUAPORIN A/S (Denmark), and Sterlitech Corporation (US), NS Filtration ApS (Denmark), Membracon (England), Synder Filtration (US), Filtros Anoia (Spain), Hawach Scientific (China), Prosperity Biotech (Shandong) Co., Ltd. (China).

This report categorizes the laboratory filtration market into the following segments and subsegments:

Laboratory Filtration Market, by Product

  • Filtration Media
    • Membrane Filters
    • Filter Papers
    • Filtration Microplates
    • Syringeless Filters
    • Syringe Filters
    • Capsule Filters
    • Other Filtration Media
  • Filtration Assemblies
    • Microfiltration Assemblies
    • Ultrafiltration Assemblies
    • Reverse Osmosis Assemblies
    • Vacuum Filtration Assemblies
    • Other Filtration Assemblies
  • Filtration Accessories
    • Filter Holders
    • Filter Flasks
    • Filter Funnels
    • Dispensers
    • Cartridges
    • Filter Housings
    • Vacuum Pumps
    • Seals
    • Other Filtration Accessories

Laboratory filtration, by Technique

  • Microfiltration
  • Ultrafiltration
  • Reverse Osmosis
  • Vacuum Filtration
  • Nanofiltration

Laboratory filtration, by End users

  • Pharmaceutical & Biotechnology Companies
  • Food & Beverage Industry
  • Hospitals & Diagnostic Laboratories
  • Academic & Research Institutions

Laboratory filtration, by Region

  • North America
    • US
    • Canada
  • Europe
    • Germany
    • France
    • UK
    • Spain
    • Rest of Europe (RoE)
  • Asia Pacific (APAC)
    • Japan
    • China
    • India
    • Rest of Asia Pacific (RoAPAC)
  • Latin America
  • MEA

Recent Developments

  • In November 2019, Koch Membrane Systems acquired Eco-Tec Inc. Eco-Tec offers resource-recovery and purification solutions to industries across the globe. This acquisition was aimed at expanding its existing capabilities in order to provide innovative ion exchange-based solutions.
  • In March 2019, Sartorius Stedim Biotech collaborated with Novasep to develop novel systems for membrane chromatography.

Frequently Asked Questions (FAQ):

To speak to our analyst for a discussion on the above findings, click Speak to Analyst

TABLE OF CONTENTS

1 INTRODUCTION (Page No. - 30)
    1.1 OBJECTIVES OF THE STUDY
    1.2 MARKET DEFINITION
           1.2.1 INCLUSIONS & EXCLUSIONS OF THE STUDY
           1.2.2 MARKETS COVERED
                    FIGURE 1 MARKET SEGMENTATION
           1.2.3 YEARS CONSIDERED FOR THE STUDY
    1.3 CURRENCY
    1.4 LIMITATIONS
    1.5 STAKEHOLDERS
    1.6 SUMMARY OF CHANGES

2 RESEARCH METHODOLOGY (Page No. - 35)
    2.1 RESEARCH APPROACH
           FIGURE 2 RESEARCH DESIGN
           2.1.1 SECONDARY RESEARCH
           2.1.2 PRIMARY RESEARCH
                    FIGURE 3 BREAKDOWN OF PRIMARIES: LABORATORY FILTRATION MARKET
           2.1.3 MARKET DATA ESTIMATION
           2.1.4 DATA TRIANGULATION APPROACH
                    FIGURE 4 DATA TRIANGULATION METHODOLOGY
    2.2 MARKET ESTIMATION METHODOLOGY
           FIGURE 5 MARKET SIZE ESTIMATION (APPROACH 1): REVENUE SHARE ANALYSIS
           FIGURE 6 MARKET SIZE ESTIMATION (APPROACH 2): REVENUE ANALYSIS OF MARKET PLAYERS
           FIGURE 7 ILLUSTRATION OF REVENUE SHARE ANALYSIS
    2.3 GROWTH RATE ASSUMPTIONS/GROWTH FORECAST
           FIGURE 8 GROWTH RATE ASSUMPTIONS BASED ON MARKET DYNAMICS
           FIGURE 9 FINAL CAGR PROJECTIONS (2021−2026)
    2.4 INSIGHTS FROM PRIMARIES
           FIGURE 10 MARKET VALIDATION FROM PRIMARY EXPERTS
    2.5 RESEARCH ASSUMPTIONS
    2.6 RISK ASSESSMENT
           TABLE 1 RISK ASSESSMENT

3 EXECUTIVE SUMMARY (Page No. - 44)
    FIGURE 11 LABORATORY FILTRATION MARKET, BY PRODUCT,  2021 VS. 2026 (USD MILLION)
    FIGURE 12 LABORATORY FILTRATION MARKET, BY TECHNIQUE,  2021 VS. 2026 (USD MILLION)
    FIGURE 13 LABORATORY FILTRATION MARKET, BY END USER,  2021 VS. 2026 (USD MILLION)
    FIGURE 14 LABORATORY FILTRATION MARKET: REGIONAL SNAPSHOT

4 PREMIUM INSIGHTS (Page No. - 48)
    4.1 LABORATORY FILTRATION MARKET OVERVIEW
           FIGURE 15 RISING R&D SPENDING IN THE PHARMACEUTICAL & BIOPHARMACEUTICAL INDUSTRY TO SUPPORT MARKET GROWTH
    4.2 NORTH AMERICA: LABORATORY FILTRATION MARKET,  BY PRODUCT & COUNTRY (2020)
           FIGURE 16 FILTRATION MEDIA ACCOUNTED FOR THE LARGEST SHARE OF THE NORTH AMERICAN LABORATORY FILTRATION MARKET IN 2020
    4.3 LABORATORY FILTRATION MARKET, BY PRODUCT,  2021 VS. 2026 (USD MILLION)
           FIGURE 17 FILTRATION MEDIA WILL CONTINUE TO DOMINATE THE LABORATORY FILTRATION MARKET IN 2026
    4.4 LABORATORY FILTRATION MARKET SHARE, BY END USER, 2020
           FIGURE 18 PHARMACEUTICAL & BIOPHARMACEUTICAL COMPANIES ACCOUNTED FOR THE LARGEST MARKET SHARE IN 2020
    4.5 LABORATORY FILTRATION MARKET: GEOGRAPHIC GROWTH OPPORTUNITIES
           FIGURE 19 ASIA PACIFIC TO REGISTER THE HIGHEST GROWTH IN THE LABORATORY FILTRATION MARKET FROM 2021 TO 2026

5 MARKET OVERVIEW (Page No. - 51)
    5.1 INTRODUCTION
    5.2 MARKET DYNAMICS
           FIGURE 20 LABORATORY FILTRATION MARKET: DRIVERS, OPPORTUNITIES, AND CHALLENGES
           TABLE 2 LABORATORY FILTRATION MARKET: IMPACT ANALYSIS
           5.2.1 DRIVERS
                    5.2.1.1 Rising R&D spending in pharmaceutical & biotechnology industries
                               FIGURE 21 GLOBAL PHARMACEUTICAL R&D SPENDING, 2012–2026
                    5.2.1.2 Growing demand for membrane filtration
                    5.2.1.3 Increasing purity requirements in end-user segments
                    5.2.1.4 Increasing focus on developing large-molecule biopharmaceuticals
           5.2.2 OPPORTUNITIES
                    5.2.2.1 Untapped market potential of emerging regions
                    5.2.2.2 Advances in nanofiber technology
           5.2.3 CHALLENGES
                    5.2.3.1 High price sensitivity among end users
                    5.2.3.2 Technological developments and alternative technologies
                    5.2.3.3 High capital investments for setting up production facilities
    5.3 RANGES/SCENARIOS
           FIGURE 22 SCENARIOS BASED ON THE IMPACT OF UNCERTAINTIES ON THE GROWTH OF THE LABORATORY FILTRATION MARKET
    5.4 IMPACT OF COVID-19 ON THE LABORATORY FILTRATION MARKET
    5.5 TRENDS/DISRUPTIONS IMPACTING CUSTOMERS’ BUSINESSES
           FIGURE 23 REVENUE SHIFT & NEW POCKETS FOR LABORATORY FILTRATION PROVIDERS
    5.6 PRICING ANALYSIS
           TABLE 3 PRICING OF LABORATORY FILTRATION PRODUCTS (2020)
    5.7 VALUE CHAIN ANALYSIS
           FIGURE 24 LABORATORY FILTRATION MARKET: VALUE CHAIN ANALYSIS
    5.8 SUPPLY CHAIN ANALYSIS
           FIGURE 25 LABORATORY FILTRATION MARKET: SUPPLY CHAIN ANALYSIS
    5.9 ECOSYSTEM ANALYSIS
           FIGURE 26 ECOSYSTEM ANALYSIS: LABORATORY FILTRATION MARKET
           TABLE 4 SUPPLY CHAIN ECOSYSTEM
    5.10 TECHNOLOGY ANALYSIS
           TABLE 5 COMPARISON OF LABORATORY FILTRATION TECHNOLOGIES
    5.11 PATENT ANALYSIS
                    FIGURE 27 PATENTS GRANTED IN THE LABORATORY FILTRATION MARKET IN  THE LAST 10 YEARS
                    FIGURE 28 TOP 10 COMPANIES WITH THE HIGHEST NUMBER OF PATENT APPLICATIONS IN THE LAST TEN YEARS
                    TABLE 6 TOP 20 PATENT OWNERS IN THE LAST TEN YEARS
                    TABLE 7 INDICATIVE LIST OF PATENTS IN THE LABORATORY FILTRATION MARKET
    5.12 REGULATORY ANALYSIS
           5.12.1 UNITED STATES PHARMACOPOEIA (USP) CLASS VI
           5.12.2 CURRENT GOOD MANUFACTURING PRACTICE
    5.13 PORTER’S FIVE FORCES ANALYSIS
                    TABLE 8 LABORATORY FILTRATION MARKET: PORTER’S FIVE FORCES ANALYSIS
           5.13.1 THREAT OF NEW ENTRANTS
           5.13.2 THREAT OF SUBSTITUTES
           5.13.3 BARGAINING POWER OF SUPPLIERS
           5.13.4 BARGAINING POWER OF BUYERS
           5.13.5 INTENSITY OF COMPETITIVE RIVALRY

6 LABORATORY FILTRATION MARKET, BY PRODUCT (Page No. - 70)
    6.1 INTRODUCTION
           TABLE 9 LABORATORY FILTRATION MARKET, BY PRODUCT, 2019–2026 (USD MILLION)
    6.2 FILTRATION MEDIA
           TABLE 10 LABORATORY FILTRATION MEDIA MARKET, BY TYPE, 2019–2026 (USD MILLION)
           TABLE 11 LABORATORY FILTRATION MEDIA MARKET, BY COUNTRY, 2019–2026 (USD MILLION)
           6.2.1 MEMBRANE FILTERS
                    6.2.1.1 Higher adoption of membrane filters in manufacturing and research to drive the growth of this segment
                               TABLE 12 KEY PLAYERS PROVIDING MEMBRANE FILTERS
                               TABLE 13 MEMBRANE FILTERS MARKET, BY COUNTRY, 2019–2026 (USD MILLION)
           6.2.2 FILTER PAPERS
                    TABLE 14 FILTER PAPERS MARKET, BY TYPE, 2019–2026 (USD MILLION)
                    TABLE 15 FILTER PAPERS MARKET, BY COUNTRY, 2019–2026 (USD MILLION)
                    6.2.2.1 Cellulose filter papers
                               6.2.2.1.1 Wide usage in laboratory sample preparation and compound classification have driven market growth
                               TABLE 16 KEY PLAYERS PROVIDING CELLULOSE FILTER PAPERS
                               TABLE 17 CELLULOSE FILTER PAPERS MARKET, BY COUNTRY, 2019–2026 (USD MILLION)
                    6.2.2.2 Glass microfiber filter papers
                               6.2.2.2.1 Chemical resistance properties have driven the demand for glass microfiber filter papers
                               TABLE 18 KEY PLAYERS PROVIDING GLASS MICROFIBER FILTER PAPERS
                               TABLE 19 GLASS MICROFIBER FILTER PAPERS MARKET, BY COUNTRY, 2019–2026 (USD MILLION)
                    6.2.2.3 Quartz filter papers
                               6.2.2.3.1 Quartz filter papers are preferred for baking and autoclaving solutions
                               TABLE 20 KEY PLAYERS PROVIDING QUARTZ FILTER PAPERS
                               TABLE 21 QUARTZ FILTER PAPERS MARKET, BY COUNTRY, 2019–2026 (USD MILLION)
           6.2.3 FILTRATION MICROPLATES
                    6.2.3.1 Filtration microplates are economical and allow control over flow rates and retention characteristics
                               TABLE 22 KEY PLAYERS PROVIDING FILTRATION MICROPLATES
                               TABLE 23 FILTRATION MICROPLATES MARKET, BY COUNTRY, 2019–2026 (USD MILLION)
           6.2.4 SYRINGELESS FILTERS
                    6.2.4.1 Syringeless filters offer a wide range of membrane choices, which is a key advantage in HPLC
                               TABLE 24 KEY PLAYERS PROVIDING SYRINGELESS FILTERS
                               TABLE 25 SYRINGELESS FILTERS MARKET, BY COUNTRY, 2019–2026 (USD MILLION)
           6.2.5 SYRINGE FILTERS
                    6.2.5.1 Growth in R&D activity is a key factor driving the syringe filters market
                               TABLE 26 KEY PLAYERS PROVIDING SYRINGE FILTERS
                               TABLE 27 SYRINGE FILTERS MARKET, BY COUNTRY, 2019–2026 (USD MILLION)
           6.2.6 CAPSULE FILTERS
                    6.2.6.1 Growth in the production of biologics and large molecules is expected to drive the capsule filters market
                               TABLE 28 KEY PLAYERS PROVIDING CAPSULE FILTERS
                               TABLE 29 CAPSULE FILTERS MARKET, BY COUNTRY, 2019–2026 (USD MILLION)
           6.2.7 OTHER FILTRATION MEDIA
                    TABLE 30 OTHER FILTRATION MEDIA MARKET, BY COUNTRY, 2019–2026 (USD MILLION)
    6.3 FILTRATION ASSEMBLIES
           TABLE 31 LABORATORY FILTRATION ASSEMBLIES MARKET, BY TYPE, 2019–2026 (USD MILLION)
           TABLE 32 LABORATORY FILTRATION ASSEMBLIES MARKET, BY COUNTRY,  2019–2026 (USD MILLION)
           6.3.1 MICROFILTRATION ASSEMBLIES
                    6.3.1.1 Microfiltration assemblies are the most widely used assembly type in the pharmaceutical and biopharmaceutical industries
                               TABLE 33 KEY PLAYERS PROVIDING MICROFILTRATION ASSEMBLIES
                               TABLE 34 MICROFILTRATION ASSEMBLIES MARKET, BY COUNTRY, 2019–2026 (USD MILLION)
           6.3.2 ULTRAFILTRATION ASSEMBLIES
                    6.3.2.1 Ultrafiltration assemblies are recommended for applications where high efficiency and consistent quality are required
                               TABLE 35 KEY PLAYERS PROVIDING ULTRAFILTRATION ASSEMBLIES
                               TABLE 36 ULTRAFILTRATION ASSEMBLIES MARKET, BY COUNTRY, 2019–2026 (USD MILLION)
           6.3.3 REVERSE OSMOSIS ASSEMBLIES
                    6.3.3.1 The major advantages offered by these systems include cost-effectiveness and reliability
                               TABLE 37 KEY PLAYERS PROVIDING REVERSE OSMOSIS ASSEMBLIES
                               TABLE 38 REVERSE OSMOSIS ASSEMBLIES MARKET, BY COUNTRY, 2019–2026 (USD MILLION)
           6.3.4 VACUUM FILTRATION ASSEMBLIES
                    6.3.4.1 Rising research activity has contributed to the demand for vacuum filtration assemblies
                               TABLE 39 KEY PLAYERS PROVIDING VACUUM FILTRATION ASSEMBLIES
                               TABLE 40 VACUUM FILTRATION ASSEMBLIES MARKET, BY COUNTRY, 2019–2026 (USD MILLION)
           6.3.5 OTHER FILTRATION ASSEMBLIES
                    TABLE 41 OTHER FILTRATION ASSEMBLIES MARKET, BY COUNTRY, 2019–2026 (USD MILLION)
    6.4 FILTRATION ACCESSORIES
           TABLE 42 LABORATORY FILTRATION ACCESSORIES MARKET, BY TYPE, 2019–2026 (USD MILLION)
           TABLE 43 LABORATORY FILTRATION ACCESSORIES MARKET, BY COUNTRY,  2019–2026 (USD MILLION)
           6.4.1 FILTER HOLDERS
                    6.4.1.1 Holders prevent the displacement and distortion of filters during filtration
                               TABLE 44 KEY PLAYERS PROVIDING FILTER HOLDERS
                               TABLE 45 FILTER HOLDERS MARKET, BY COUNTRY, 2019–2026 (USD MILLION)
           6.4.2 FILTER FLASKS
                    6.4.2.1 Merck Millipore, Thermo Fisher Scientific, and Sterlitech Corporation are some of the key players providing filter flasks
                               TABLE 46 KEY PLAYERS PROVIDING FILTER FLASKS
                               TABLE 47 FILTER FLASKS MARKET, BY COUNTRY, 2019–2026 (USD MILLION)
           6.4.3 FILTER FUNNELS
                    6.4.3.1 High efficiency of disposable filter funnels has driven market growth
                               TABLE 48 KEY PLAYERS PROVIDING FILTER FUNNELS
                               TABLE 49 FILTER FUNNELS MARKET, BY COUNTRY, 2019–2026 (USD MILLION)
           6.4.4 FILTER DISPENSERS
                    6.4.4.1 The market for filter dispensers is driven by the growing importance of microbiological analysis in the pharmaceutical, biotechnology, and food & beverage industries
                               TABLE 50 KEY PLAYERS PROVIDING FILTER DISPENSERS
                               TABLE 51 FILTER DISPENSERS MARKET, BY COUNTRY, 2019–2026 (USD MILLION)
           6.4.5 CARTRIDGE FILTERS
                    6.4.5.1 One major disadvantage of cartridge filters is that other prefilter treatment methods are required for filtering a large number of solids at high-flow rates
                               TABLE 52 KEY PLAYERS PROVIDING CARTRIDGE FILTERS
                               TABLE 53 CARTRIDGE FILTERS MARKET, BY COUNTRY, 2019–2026 (USD MILLION)
           6.4.6 FILTER HOUSINGS
                    6.4.6.1 Growing use of filter housings in clarification, sterilization, and high-purity filtration of fluids will stimulate segmental growth
                               TABLE 54 KEY PLAYERS PROVIDING FILTER HOUSINGS
                               TABLE 55 FILTER HOUSINGS MARKET, BY COUNTRY, 2019–2026 (USD MILLION)
           6.4.7 VACUUM PUMPS
                    6.4.7.1 Applications of vacuum pumps in healthcare verticals have driven market demand
                               TABLE 56 KEY PLAYERS PROVIDING VACUUM PUMPS
                               TABLE 57 VACUUM PUMPS MARKET, BY COUNTRY, 2019–2026 (USD MILLION)
           6.4.8 SEALS
                    6.4.8.1 Seals play a crucial role in maintaining the sterility of samples and preventing leakages
                               TABLE 58 KEY PLAYERS PROVIDING SEALS
                               TABLE 59 SEALS MARKET, BY COUNTRY, 2019–2026 (USD MILLION)
           6.4.9 OTHER LABORATORY FILTRATION ACCESSORIES
                    TABLE 60 OTHER LABORATORY FILTRATION ACCESSORIES MARKET, BY COUNTRY,  2019–2026 (USD MILLION)

7 LABORATORY FILTRATION MARKET, BY TECHNIQUE (Page No. - 107)
    7.1 INTRODUCTION
           TABLE 61 LABORATORY FILTRATION MARKET, BY TECHNIQUE, 2019–2026 (USD MILLION)
    7.2 MICROFILTRATION
           7.2.1 RISING R&D ACTIVITY IN THE PHARMA INDUSTRY AND WIDE APPLICATIONS IN FOOD & BEVERAGE DRIVE MARKET GROWTH
                    TABLE 62 LABORATORY MICROFILTRATION MARKET, BY COUNTRY, 2019–2026 (USD MILLION)
    7.3 ULTRAFILTRATION
           7.3.1 GROWING PRODUCTION OF BIOTHERAPEUTIC MOLECULES IS EXPECTED TO DRIVE THE DEMAND FOR ULTRAFILTRATION
                    TABLE 63 LABORATORY ULTRAFILTRATION MARKET, BY COUNTRY, 2019–2026 (USD MILLION)
    7.4 REVERSE OSMOSIS
           7.4.1 LOW OPERATING COSTS AND THE ABILITY TO AVOID HEAT TREATMENT PROCESSES HAVE DRIVEN THE DEMAND FOR REVERSE OSMOSIS
                    TABLE 64 LABORATORY REVERSE OSMOSIS MARKET, BY COUNTRY, 2019–2026 (USD MILLION)
    7.5 VACUUM FILTRATION
           7.5.1 VACUUM FILTRATION IS WIDELY USED IN PHARMACEUTICAL LABORATORIES FOR THE MICROBIAL TESTING OF SAMPLES
                    TABLE 65 LABORATORY VACUUM FILTRATION MARKET, BY COUNTRY, 2019–2026 (USD MILLION)
    7.6 NANOFILTRATION
           7.6.1 MARKET GROWTH IS ATTRIBUTED TO THE RISING DEMAND FOR NANOFILTRATION IN THE BIOTECHNOLOGY INDUSTRY
                    TABLE 66 LABORATORY NANOFILTRATION MARKET, BY COUNTRY, 2019–2026 (USD MILLION)

8 LABORATORY FILTRATION MARKET, BY END USER (Page No. - 114)
    8.1 INTRODUCTION
           TABLE 67 LABORATORY FILTRATION MARKET, BY END USER, 2019–2026 (USD MILLION)
    8.2 PHARMACEUTICAL & BIOPHARMACEUTICAL COMPANIES
           8.2.1 PHARMACEUTICAL & BIOPHARMACEUTICAL COMPANIES ARE THE LARGEST END USERS OF LABORATORY FILTRATION EQUIPMENT
                    TABLE 68 LABORATORY FILTRATION MARKET FOR PHARMACEUTICAL & BIOPHARMACEUTICAL COMPANIES, BY COUNTRY, 2019–2026 (USD MILLION)
    8.3 ACADEMIC & RESEARCH INSTITUTES
           8.3.1 INCREASING R&D EXPENDITURE IS SUPPORTING THE GROWTH OF THIS END-USER SEGMENT
                    TABLE 69 LABORATORY FILTRATION MARKET FOR ACADEMIC & RESEARCH INSTITUTES,  BY COUNTRY, 2019–2026 (USD MILLION)
    8.4 FOOD & BEVERAGE COMPANIES
           8.4.1 GROWING HEALTH CONCERNS ARE SUPPORTING THE INCREASED ADOPTION OF LAB FILTRATION PRODUCTS IN FOOD & BEVERAGE COMPANIES
                    TABLE 70 LABORATORY FILTRATION MARKET FOR FOOD & BEVERAGE COMPANIES, BY COUNTRY, 2019–2026 (USD MILLION)
    8.5 HOSPITALS & DIAGNOSTIC LABORATORIES
           8.5.1 DEVELOPING HEALTHCARE INFRASTRUCTURE IS A KEY FACTOR DRIVING THE GROWTH OF THIS END-USER SEGMENT
                    TABLE 71 LABORATORY FILTRATION MARKET FOR HOSPITALS & DIAGNOSTIC LABORATORIES,  BY COUNTRY, 2019–2026 (USD MILLION)

9 LABORATORY FILTRATION MARKET, BY REGION (Page No. - 121)
    9.1 INTRODUCTION
           TABLE 72 LABORATORY FILTRATION MARKET, BY REGION, 2019–2026 (USD MILLION)
    9.2 NORTH AMERICA
           FIGURE 29 NORTH AMERICA: LABORATORY FILTRATION MARKET SNAPSHOT
           TABLE 73 NORTH AMERICA: LABORATORY FILTRATION MARKET, BY COUNTRY,  2019–2026 (USD MILLION)
           TABLE 74 NORTH AMERICA: LABORATORY FILTRATION MARKET, BY PRODUCT,  2019–2026 (USD MILLION)
           TABLE 75 NORTH AMERICA: LABORATORY FILTRATION MEDIA MARKET, BY TYPE,  2019–2026 (USD MILLION)
           TABLE 76 NORTH AMERICA: LABORATORY FILTRATION ASSEMBLIES MARKET, BY TYPE,  2019–2026 (USD MILLION)
           TABLE 77 NORTH AMERICA: LABORATORY FILTRATION ACCESSORIES MARKET, BY TYPE,  2019–2026 (USD MILLION)
           TABLE 78 NORTH AMERICA: LABORATORY FILTRATION MARKET, BY TECHNIQUE,  2019–2026 (USD MILLION)
           TABLE 79 NORTH AMERICA: LABORATORY FILTRATION MARKET, BY END USER,  2019–2026 (USD MILLION)
           9.2.1 US
                    9.2.1.1 Presence of many biopharmaceutical manufacturers and academic & research laboratories to support market growth
                               FIGURE 30 NIH FUNDING IN THE LAST 10 YEARS (2011–2021)
                               TABLE 80 US: LABORATORY FILTRATION MARKET, BY PRODUCT, 2019–2026 (USD MILLION)
                               TABLE 81 US: LABORATORY FILTRATION MEDIA MARKET, BY TYPE, 2019–2026 (USD MILLION)
                               TABLE 82 US: LABORATORY FILTRATION ASSEMBLIES MARKET, BY TYPE,  2019–2026 (USD MILLION)
                               TABLE 83 US: LABORATORY FILTRATION ACCESSORIES MARKET, BY TYPE,  2019–2026 (USD MILLION)
                               TABLE 84 US: LABORATORY FILTRATION MARKET, BY TECHNIQUE, 2019–2026 (USD MILLION)
                               TABLE 85 US: LABORATORY FILTRATION MARKET, BY END USER, 2019–2026 (USD MILLION)
           9.2.2 CANADA
                    9.2.2.1 Increase in R&D activities to drive market growth in Canada
                               TABLE 86 CANADA: LABORATORY FILTRATION MARKET, BY PRODUCT, 2019–2026 (USD MILLION)
                               TABLE 87 CANADA: LABORATORY FILTRATION MEDIA MARKET, BY TYPE, 2019–2026 (USD MILLION)
                               TABLE 88 CANADA: LABORATORY FILTRATION ASSEMBLIES MARKET, BY TYPE,  2019–2026 (USD MILLION)
                               TABLE 89 CANADA: LABORATORY FILTRATION ACCESSORIES MARKET, BY TYPE,  2019–2026 (USD MILLION)
                               TABLE 90 CANADA: LABORATORY FILTRATION MARKET, BY TECHNIQUE, 2019–2026 (USD MILLION)
                               TABLE 91 CANADA: LABORATORY FILTRATION MARKET, BY END USER, 2019–2026 (USD MILLION)
    9.3 EUROPE
           TABLE 92 EUROPE: LABORATORY FILTRATION MARKET, BY COUNTRY, 2019–2026 (USD MILLION)
           TABLE 93 EUROPE: LABORATORY FILTRATION MARKET, BY PRODUCT, 2019–2026 (USD MILLION)
           TABLE 94 EUROPE: LABORATORY FILTRATION MEDIA MARKET, BY TYPE, 2019–2026 (USD MILLION)
           TABLE 95 EUROPE: LABORATORY FILTRATION ASSEMBLIES MARKET, BY TYPE,  2019–2026 (USD MILLION)
           TABLE 96 EUROPE: LABORATORY FILTRATION ACCESSORIES MARKET, BY TYPE,  2019–2026 (USD MILLION)
           TABLE 97 EUROPE: LABORATORY FILTRATION MARKET, BY TECHNIQUE, 2019–2026 (USD MILLION)
           TABLE 98 EUROPE: LABORATORY FILTRATION MARKET, BY END USER, 2019–2026 (USD MILLION)
           9.3.1 GERMANY
                    9.3.1.1 The strong base of biotechnology and pharmaceutical companies is contributing to the large share of Germany in the European market
                               FIGURE 31 GERMANY: BIOTECHNOLOGY COMPANY OVERVIEW
                               TABLE 99 GERMANY: LABORATORY FILTRATION MARKET, BY PRODUCT, 2019–2026 (USD MILLION)
                               TABLE 100 GERMANY: LABORATORY FILTRATION MEDIA MARKET, BY TYPE,  2019–2026 (USD MILLION)
                               TABLE 101 GERMANY: LABORATORY FILTRATION ASSEMBLIES MARKET, BY TYPE,  2019–2026 (USD MILLION)
                               TABLE 102 GERMANY: LABORATORY FILTRATION ACCESSORIES MARKET, BY TYPE,  2019–2026 (USD MILLION)
                               TABLE 103 GERMANY: LABORATORY FILTRATION MARKET, BY TECHNIQUE,  2019–2026 (USD MILLION)
                               TABLE 104 GERMANY: LABORATORY FILTRATION MARKET, BY END USER, 2019–2026 (USD MILLION)
           9.3.2 FRANCE
                    9.3.2.1 Increasing focus on ensuring compliance with good manufacturing practices (GMPs) to drive market growth
                               TABLE 105 FRANCE: LABORATORY FILTRATION MARKET, BY PRODUCT, 2019–2026 (USD MILLION)
                               TABLE 106 FRANCE: LABORATORY FILTRATION MEDIA MARKET, BY TYPE, 2019–2026 (USD MILLION)
                               TABLE 107 FRANCE: LABORATORY FILTRATION ASSEMBLIES MARKET, BY TYPE,  2019–2026 (USD MILLION)
                               TABLE 108 FRANCE: LABORATORY FILTRATION ACCESSORIES MARKET, BY TYPE,  2019–2026 (USD MILLION)
                               TABLE 109 FRANCE: LABORATORY FILTRATION MARKET, BY TECHNIQUE, 2019–2026 (USD MILLION)
                               TABLE 110 FRANCE: LABORATORY FILTRATION MARKET, BY END USER, 2019–2026 (USD MILLION)
           9.3.3 UK
                    9.3.3.1 Growing awareness of the quality of healthcare and food products has increased the uptake of laboratory filtration products in the UK
                               TABLE 111 UK: LABORATORY FILTRATION MARKET, BY PRODUCT, 2019–2026 (USD MILLION)
                               TABLE 112 UK: LABORATORY FILTRATION MEDIA MARKET, BY TYPE, 2019–2026 (USD MILLION)
                               TABLE 113 UK: LABORATORY FILTRATION ASSEMBLIES MARKET, BY TYPE,  2019–2026 (USD MILLION)
                               TABLE 114 UK: LABORATORY FILTRATION ACCESSORIES MARKET, BY TYPE,  2019–2026 (USD MILLION)
                               TABLE 115 UK: LABORATORY FILTRATION MARKET, BY TECHNIQUE, 2019–2026 (USD MILLION)
                               TABLE 116 UK: LABORATORY FILTRATION MARKET, BY END USER, 2019–2026 (USD MILLION)
           9.3.4 ITALY
                    9.3.4.1 The need for compliance with international quality standards is boosting the demand for advanced laboratory filtration products
                               TABLE 117 ITALY: LABORATORY FILTRATION MARKET, BY PRODUCT, 2019–2026 (USD MILLION)
                               TABLE 118 ITALY: LABORATORY FILTRATION MEDIA MARKET, BY TYPE, 2019–2026 (USD MILLION)
                               TABLE 119 ITALY: LABORATORY FILTRATION ASSEMBLIES MARKET, BY TYPE,  2019–2026 (USD MILLION)
                               TABLE 120 ITALY: LABORATORY FILTRATION ACCESSORIES MARKET, BY TYPE,  2019–2026 (USD MILLION)
                               TABLE 121 ITALY: LABORATORY FILTRATION MARKET, BY TECHNIQUE, 2019–2026 (USD MILLION)
                               TABLE 122 ITALY: LABORATORY FILTRATION MARKET, BY END USER, 2019–2026 (USD MILLION)
           9.3.5 SPAIN
                    9.3.5.1 Increasing adoption of modern, sophisticated filtration methods by pharmaceutical manufacturers in the country to support market growth
                               TABLE 123 SPAIN: LABORATORY FILTRATION MARKET, BY PRODUCT, 2019–2026 (USD MILLION)
                               TABLE 124 SPAIN: LABORATORY FILTRATION MEDIA MARKET, BY TYPE, 2019–2026 (USD MILLION)
                               TABLE 125 SPAIN: LABORATORY FILTRATION ASSEMBLIES MARKET, BY TYPE,  2019–2026 (USD MILLION)
                               TABLE 126 SPAIN: LABORATORY FILTRATION ACCESSORIES MARKET, BY TYPE,  2019–2026 (USD MILLION)
                               TABLE 127 SPAIN: LABORATORY FILTRATION MARKET, BY TECHNIQUE, 2019–2026 (USD MILLION)
                               TABLE 128 SPAIN: LABORATORY FILTRATION MARKET, BY END USER, 2019–2026 (USD MILLION)
           9.3.6 REST OF EUROPE
                    TABLE 129 ROE: LABORATORY FILTRATION MARKET, BY PRODUCT, 2019–2026 (USD MILLION)
                    TABLE 130 ROE: LABORATORY FILTRATION MEDIA MARKET, BY TYPE, 2019–2026 (USD MILLION)
                    TABLE 131 ROE: LABORATORY FILTRATION ASSEMBLIES MARKET, BY TYPE,  2019–2026 (USD MILLION)
                    TABLE 132 ROE: LABORATORY FILTRATION ACCESSORIES MARKET, BY TYPE,  2019–2026 (USD MILLION)
                    TABLE 133 ROE: LABORATORY FILTRATION MARKET, BY TECHNIQUE, 2019–2026 (USD MILLION)
                    TABLE 134 ROE: LABORATORY FILTRATION MARKET, BY END USER, 2019–2026 (USD MILLION)
    9.4 ASIA PACIFIC
           FIGURE 32 ASIA PACIFIC: LABORATORY FILTRATION MARKET SNAPSHOT
           TABLE 135 ASIA PACIFIC: LABORATORY FILTRATION MARKET, BY COUNTRY,  2019–2026 (USD MILLION)
           TABLE 136 ASIA PACIFIC: LABORATORY FILTRATION MARKET, BY PRODUCT,  2019–2026 (USD MILLION)
           TABLE 137 ASIA PACIFIC: LABORATORY FILTRATION MEDIA MARKET, BY TYPE,  2019–2026 (USD MILLION)
           TABLE 138 ASIA PACIFIC: LABORATORY FILTRATION ASSEMBLIES MARKET, BY TYPE,  2019–2026 (USD MILLION)
           TABLE 139 ASIA PACIFIC: LABORATORY FILTRATION ACCESSORIES MARKET, BY TYPE,  2019–2026 (USD MILLION)
           TABLE 140 ASIA PACIFIC: LABORATORY FILTRATION MARKET, BY TECHNIQUE,  2019–2026 (USD MILLION)
           TABLE 141 ASIA PACIFIC: LABORATORY FILTRATION MARKET, BY END USER,  2019–2026 (USD MILLION)
           9.4.1 CHINA
                    9.4.1.1 International healthcare players’ foray into China to provide growth opportunities for the laboratory filtration market
                               TABLE 142 CHINA: LABORATORY FILTRATION MARKET, BY PRODUCT, 2019–2026 (USD MILLION)
                               TABLE 143 CHINA: LABORATORY FILTRATION MEDIA MARKET, BY TYPE, 2019–2026 (USD MILLION)
                               TABLE 144 CHINA: LABORATORY FILTRATION ASSEMBLIES MARKET, BY TYPE,  2019–2026 (USD MILLION)
                               TABLE 145 CHINA: LABORATORY FILTRATION ACCESSORIES MARKET, BY TYPE,  2019–2026 (USD MILLION)
                               TABLE 146 CHINA: LABORATORY FILTRATION MARKET, BY TECHNIQUE, 2019–2026 (USD MILLION)
                               TABLE 147 CHINA: LABORATORY FILTRATION MARKET, BY END USER, 2019–2026 (USD MILLION)
           9.4.2 JAPAN
                    9.4.2.1 Rising adoption of filtration techniques to aid market growth in Japan
                               TABLE 148 JAPAN: LABORATORY FILTRATION MARKET, BY PRODUCT, 2019–2026 (USD MILLION)
                               TABLE 149 JAPAN: LABORATORY FILTRATION MEDIA MARKET, BY TYPE, 2019–2026 (USD MILLION)
                               TABLE 150 JAPAN: LABORATORY FILTRATION ASSEMBLIES MARKET, BY TYPE,  2019–2026 (USD MILLION)
                               TABLE 151 JAPAN: LABORATORY FILTRATION ACCESSORIES MARKET, BY TYPE,  2019–2026 (USD MILLION)
                               TABLE 152 JAPAN: LABORATORY FILTRATION MARKET, BY TECHNIQUE, 2019–2026 (USD MILLION)
                               TABLE 153 JAPAN: LABORATORY FILTRATION MARKET, BY END USER, 2019–2026 (USD MILLION)
           9.4.3 INDIA
                    9.4.3.1 The Indian healthcare industry is expected to offer lucrative growth opportunities for players in the laboratory filtration market
                               TABLE 154 INDIA: LABORATORY FILTRATION MARKET, BY PRODUCT, 2019–2026 (USD MILLION)
                               TABLE 155 INDIA: LABORATORY FILTRATION MEDIA MARKET, BY TYPE, 2019–2026 (USD MILLION)
                               TABLE 156 INDIA: LABORATORY FILTRATION ASSEMBLIES MARKET, BY TYPE,  2019–2026 (USD MILLION)
                               TABLE 157 INDIA: LABORATORY FILTRATION ACCESSORIES MARKET, BY TYPE,  2019–2026 (USD MILLION)
                               TABLE 158 INDIA: LABORATORY FILTRATION MARKET, BY TECHNIQUE, 2019–2026 (USD MILLION)
                               TABLE 159 INDIA: LABORATORY FILTRATION MARKET, BY END USER, 2019–2026 (USD MILLION)
           9.4.4 REST OF ASIA PACIFIC
                    TABLE 160 ROAPAC: LABORATORY FILTRATION MARKET, BY PRODUCT, 2019–2026 (USD MILLION)
                    TABLE 161 ROAPAC: LABORATORY FILTRATION MEDIA MARKET, BY TYPE, 2019–2026 (USD MILLION)
                    TABLE 162 ROAPAC: LABORATORY FILTRATION ASSEMBLIES MARKET, BY TYPE,  2019–2026 (USD MILLION)
                    TABLE 163 ROAPAC: LABORATORY FILTRATION ACCESSORIES MARKET, BY TYPE,  2019–2026 (USD MILLION)
                    TABLE 164 ROAPAC: LABORATORY FILTRATION MARKET, BY TECHNIQUE, 2019–2026 (USD MILLION)
                    TABLE 165 ROAPAC: LABORATORY FILTRATION MARKET, BY END USER, 2019–2026 (USD MILLION)
    9.5 LATIN AMERICA
           9.5.1 THE SURGE IN PHARMACEUTICAL MANUFACTURING IN LATAM COUNTRIES WILL SUPPORT MARKET GROWTH
                    TABLE 166 LATIN AMERICA: LABORATORY FILTRATION MARKET, BY PRODUCT,  2019–2026 (USD MILLION)
                    TABLE 167 LATIN AMERICA: LABORATORY FILTRATION MEDIA MARKET, BY TYPE,  2019–2026 (USD MILLION)
                    TABLE 168 LATIN AMERICA: LABORATORY FILTRATION ASSEMBLIES MARKET, BY TYPE,  2019–2026 (USD MILLION)
                    TABLE 169 LATIN AMERICA: LABORATORY FILTRATION ACCESSORIES MARKET, BY TYPE,  2019–2026 (USD MILLION)
                    TABLE 170 LATIN AMERICA: LABORATORY FILTRATION MARKET, BY TECHNIQUE,  2019–2026 (USD MILLION)
                    TABLE 171 LATIN AMERICA: LABORATORY FILTRATION MARKET, BY END USER,  2019–2026 (USD MILLION)
    9.6 MIDDLE EAST & AFRICA
           9.6.1 THE GROWING PHARMACEUTICALS INDUSTRY IS SUPPORTING THE GROWTH OF THE LABORATORY FILTRATION MARKET IN THE MEA
                    TABLE 172 MEA: LABORATORY FILTRATION MARKET, BY PRODUCT, 2019–2026 (USD MILLION)
                    TABLE 173 MEA: LABORATORY FILTRATION MEDIA MARKET, BY TYPE, 2019–2026 (USD MILLION)
                    TABLE 174 MEA: LABORATORY FILTRATION ASSEMBLIES MARKET, BY TYPE,  2019–2026 (USD MILLION)
                    TABLE 175 MEA: LABORATORY FILTRATION ACCESSORIES MARKET, BY TYPE,  2019–2026 (USD MILLION)
                    TABLE 176 MEA: LABORATORY FILTRATION MARKET, BY TECHNIQUE, 2019–2026 (USD MILLION)
                    TABLE 177 MEA: LABORATORY FILTRATION MARKET, BY END USER, 2019–2026 (USD MILLION)

10 COMPETITIVE LANDSCAPE (Page No. - 177)
     10.1 INTRODUCTION
     10.2 RIGHT-TO-WIN APPROACHES ADOPTED BY KEY PLAYERS
               FIGURE 33 LABORATORY FILTRATION MARKET: STRATEGIES ADOPTED
     10.3 REVENUE ANALYSIS
               FIGURE 34 REVENUE ANALYSIS FOR KEY COMPANIES OVER THE PAST THREE YEARS
     10.4 MARKET SHARE ANALYSIS
               FIGURE 35 LABORATORY FILTRATION MARKET SHARE, BY KEY PLAYER (2020)
     10.5 COMPANY EVALUATION QUADRANT
               FIGURE 36 LABORATORY FILTRATION MARKET: COMPETITIVE LEADERSHIP MAPPING
             10.5.1 STARS
             10.5.2 EMERGING LEADERS
             10.5.3 PERVASIVE PLAYERS
             10.5.4 PARTICIPANTS
     10.6 COMPANY EVALUATION QUADRANT: SME/START-UP MATRIX
               FIGURE 37 LABORATORY FILTRATION MARKET: COMPANY EVALUATION MATRIX FOR SMES, 2020
             10.6.1 PROGRESSIVE COMPANIES
             10.6.2 STARTING BLOCKS
             10.6.3 RESPONSIVE COMPANIES
             10.6.4 DYNAMIC COMPANIES
     10.7 COMPETITIVE BENCHMARKING
             10.7.1 COMPANY FOOTPRINT
                       FIGURE 38 FOOTPRINT ANALYSIS OF KEY PLAYERS IN THE LABORATORY FILTRATION MARKET
             10.7.2 COMPANY PRODUCT FOOTPRINT
                       TABLE 178 PRODUCT FOOTPRINT ANALYSIS OF KEY PLAYERS IN THE LABORATORY  FILTRATION MARKET
             10.7.3 COMPANY TECHNIQUE FOOTPRINT
                       TABLE 179 TECHNIQUE FOOTPRINT ANALYSIS OF KEY PLAYERS IN THE LABORATORY  FILTRATION MARKET
             10.7.4 COMPANY REGIONAL FOOTPRINT
                       TABLE 180 REGIONAL FOOTPRINT ANALYSIS OF KEY PLAYERS IN THE LABORATORY  FILTRATION MARKET
     10.8 COMPETITIVE SCENARIO AND TRENDS
             10.8.1 PRODUCT LAUNCHES
                       TABLE 181 LABORATORY FILTRATION MARKET: PRODUCT LAUNCHES, JANUARY 2018–JULY 2021
             10.8.2 DEALS
                       TABLE 182 LABORATORY FILTRATION MARKET: DEALS, JANUARY 2018–JULY 2021
             10.8.3 OTHER DEVELOPMENTS
                       TABLE 183 LABORATORY FILTRATION MARKET: OTHER DEVELOPMENTS, JANUARY 2018–JULY 2021

11 COMPANY PROFILES (Page No. - 191)
     11.1 KEY PLAYERS
(Business Overview, Products Offered, Recent Developments, and MnM View (Key strengths/Right to Win, Strategic Choices Made, and Weaknesses and Competitive Threats))*
             11.1.1 MERCK MILLIPORE
                       TABLE 184 MERCK MILLIPORE: BUSINESS OVERVIEW
                       FIGURE 39 MERCK KGAA: COMPANY SNAPSHOT (2020)
             11.1.2 DANAHER CORPORATION
                       TABLE 185 DANAHER CORPORATION: BUSINESS OVERVIEW
                       FIGURE 40 DANAHER CORPORATION: COMPANY SNAPSHOT (2020)
             11.1.3 SARTORIUS AG
                       TABLE 186 SARTORIUS AG: BUSINESS OVERVIEW
                       FIGURE 41 SARTORIUS AG: COMPANY SNAPSHOT (2020)
             11.1.4 3M COMPANY
                       TABLE 187 3M COMPANY: BUSINESS OVERVIEW
                       FIGURE 42 3M COMPANY: COMPANY SNAPSHOT (2020)
             11.1.5 GEA GROUP AKTIENGESELLSCHAFT
                       TABLE 188 GEA GROUP AKTIENGESELLSCHAFT: BUSINESS OVERVIEW
                       FIGURE 43 GEA GROUP AKTIENGESELLSCHAFT: COMPANY SNAPSHOT (2020)
             11.1.6 STERIS PLC
                       TABLE 189 STERIS PLC: BUSINESS OVERVIEW
                       FIGURE 44 STERIS PLC: COMPANY SNAPSHOT (2020)
             11.1.7 THERMO FISHER SCIENTIFIC, INC.
                       TABLE 190 THERMO FISHER SCIENTIFIC, INC.: BUSINESS OVERVIEW
                       FIGURE 45 THERMO FISHER SCIENTIFIC, INC.: COMPANY SNAPSHOT (2020)
             11.1.8 VEOLIA WATER TECHNOLOGIES (A PART OF VEOLIA ENVIRONMENT S.A.)
                       TABLE 191 VEOLIA WATER TECHNOLOGIES: BUSINESS OVERVIEW
                       FIGURE 46 VEOLIA WATER TECHNOLOGIES: COMPANY SNAPSHOT (2020)
             11.1.9 AVANTOR, INC.
                       TABLE 192 AVANTOR, INC.: BUSINESS OVERVIEW
                       FIGURE 47 AVANTOR, INC.: COMPANY SNAPSHOT (2020)
             11.1.10 GVS S.P.A.
                       TABLE 193 GVS S.P.A.: BUSINESS OVERVIEW
                       FIGURE 48 GVS S.P.A.: COMPANY SNAPSHOT (2020)
             11.1.11 MANN+HUMMEL
                       TABLE 194 MANN+HUMMEL: BUSINESS OVERVIEW
                       FIGURE 49 MANN+HUMMEL: COMPANY SNAPSHOT (2020)
             11.1.12 AGILENT TECHNOLOGIES, INC.
                       TABLE 195 AGILENT TECHNOLOGIES, INC.: BUSINESS OVERVIEW
                       FIGURE 50 AGILENT TECHNOLOGIES, INC.: COMPANY SNAPSHOT
             11.1.13 AHLSTROM-MUNKSJÖ
                       TABLE 196 AHLSTROM-MUNKSJÖ: BUSINESS OVERVIEW
                       FIGURE 51 AHLSTROM-MUNKSJÖ: COMPANY SNAPSHOT (2020)
     11.2 OTHER PLAYERS
             11.2.1 MACHEREY-NAGEL GMBH & CO. KG
             11.2.2 AMD MANUFACTURING INC.
             11.2.3 KOCH SEPARATION SOLUTIONS, INC.
             11.2.4 COLE-PARMER INSTRUMENT COMPANY, LLC.
             11.2.5 ADVANTEC TOYO ROSHI KAISHA, LTD.
             11.2.6 STERLITECH CORPORATION
             11.2.7 NS FILTRATION APS
             11.2.8 SYNDER FILTRATION
             11.2.9 PROSPERITY BIOTECH (SHANDONG) CO., LTD.
             11.2.10 MEMBRACON
             11.2.11 HAWACH SCIENTIFIC CO., LTD.
             11.2.12 FILTROS ANOIA

*Details on Business Overview, Products Offered, Recent Developments, and MnM View (Key strengths/Right to Win, Strategic Choices Made, and Weaknesses and Competitive Threats) might not be captured in case of unlisted companies.

12 APPENDIX (Page No. - 246)
     12.1 DISCUSSION GUIDE
     12.2 KNOWLEDGE STORE: MARKETSANDMARKETS’ SUBSCRIPTION PORTAL
     12.3 AVAILABLE CUSTOMIZATIONS
     12.4 RELATED REPORTS
     12.5 AUTHOR DETAILS

This study involved four major activities in estimating the current size of the laboratory filtration market. Exhaustive secondary research was carried out to collect information on the market and its peer markets. The next step was to validate these findings, assumptions, and sizing with industry experts across the value chain through primary research. Approaches were employed to estimate the complete market size. After that, market breakdown and data triangulation procedures were used to estimate the market size of segments and subsegments.

Secondary Research

Secondary research was used mainly to identify and collect information for the extensive, technical, market-oriented, and commercial study of the laboratory filtration market. Some of the key secondary sources referred to for this study include publications from government sources World Health Organization (WHO), International Association of Laboratory Schools (IALS), International Federation of Pharmaceutical Manufacturers & Associations (IFPMA), National Science Foundation (NSF), American Society for Clinical Laboratory Science (ASCLS), American Filtration and Separations Society (AFS), European Federation of Clinical Chemistry and Laboratory Medicine (EFLM), Canadian Association for Laboratory Accreditation (CALA), Canadian Society for Medical Laboratory Science (CSMLS). These sources were also used to obtain key information about major players, market classification, and segmentation according to industry trends, regional/country-level markets, market developments, and technology perspectives.

Primary Research

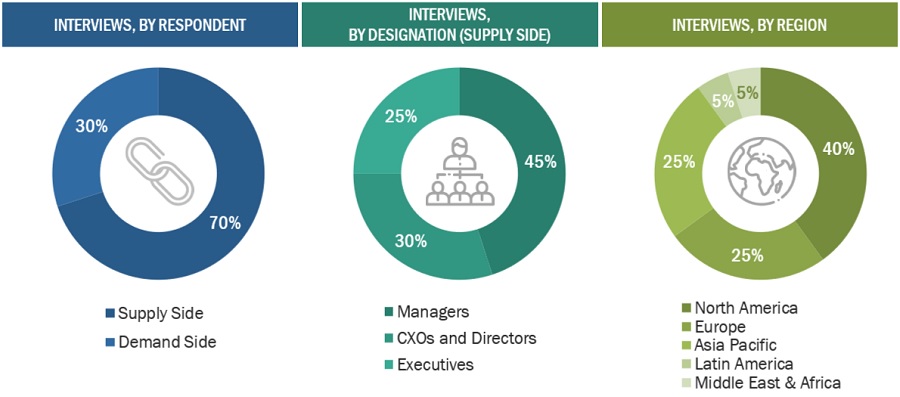
In-depth interviews were conducted with various primary respondents, including key industry participants, subject-matter experts (SMEs), C-level executives of key market players, and industry consultants, among other experts, to obtain and verify the critical qualitative and quantitative information as well as assess future prospects of the market. Various primary sources from both the supply and demand sides of the market were interviewed to obtain qualitative and quantitative information. The following is a breakdown of the primary respondents:
Laboratory Filtration Market  Size, and Share

To know about the assumptions considered for the study, download the pdf brochure

Market Size Estimation

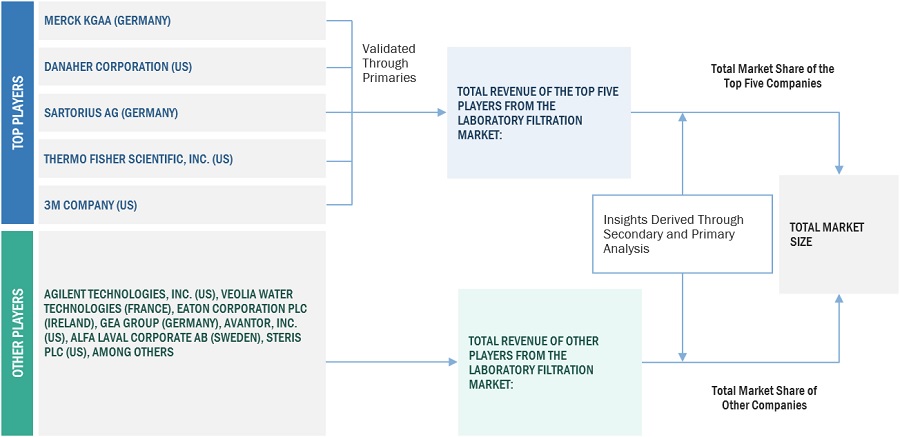
Supply-side analysis approach was used to estimate and validate the total size of the laboratory filtration market. These methods were also used extensively to estimate the size of various subsegments in the market. The research methodology used to estimate the market size includes the following:

  • The key players in the industry and market have been identified through extensive secondary research
  • The revenues generated from the laboratory filtration business of leading players have been determined through primary and secondary research
  • All percentage shares, splits, and breakdowns have been determined using secondary sources and verified through primary sources.

Data Triangulation

After arriving at the overall market size from the market size estimation process, the total market was split into several segments and subsegments. To complete the overall market engineering process and arrive at the exact statistics for all segments and subsegments, data triangulation and market breakdown procedures were employed, wherever applicable. The data was triangulated by studying various factors and trends from both the demand and supply sides.

Report Objectives

  • To define, describe, and forecast the laboratory filtration market based on cell type, product, technique, application, end users and region
  • To provide detailed information regarding the major factors influencing the growth of the market (such as drivers, challenges & opportunities)
  • To strategically analyze micromarkets with respect to individual growth trends, future prospects, and contributions to the overall laboratory filtration market
  • To analyze opportunities in the market for stakeholders and provide details of the competitive landscape for market leaders
  • To forecast the size of the market segments with respect to five main regions, namely, North America, Europe, Asia Pacific, Latin America, Middle East & Africa
  • To strategically profile the key players and comprehensively analyze their product portfolios, market positions, and core competencies
  • To track and analyze competitive developments such as acquisitions, product launches, expansions, agreements, partnerships, and R&D activities in the laboratory filtration market.

Available Customizations

With the given market data, MarketsandMarkets offers customizations as per the company’s specific needs. The following customization options are available for this report:

Company Information

  • An additional five company profiles
Custom Market Research Services

We will customize the research for you, in case the report listed above does not meet with your exact requirements. Our custom research will comprehensively cover the business information you require to help you arrive at strategic and profitable business decisions.

Request Customization

Instant Answers with GPT - Ask Now!

Ask real questions. Get complete answers !
Report Code
BT 2761
Published ON
Nov, 2021
Choose License Type
BUY NOW
  • SHARE
X
Request Customization
Speak to Analyst
Speak to Analyst
OR FACE-TO-FACE MEETING
PERSONALIZE THIS RESEARCH
  • Triangulate with your Own Data
  • Get Data as per your Format and Definition
  • Gain a Deeper Dive on a Specific Application, Geography, Customer or Competitor
  • Any level of Personalization
REQUEST A FREE CUSTOMIZATION
LET US HELP YOU!
  • What are the Known and Unknown Adjacencies Impacting the Laboratory Filtration Market
  • What will your New Revenue Sources be?
  • Who will be your Top Customer; what will make them switch?
  • Defend your Market Share or Win Competitors
  • Get a Scorecard for Target Partners
CUSTOMIZED WORKSHOP REQUEST
+1-888-600-6441
  • Call Us
  • +1-888-600-6441 (Corporate office hours)
  • +1-888-600-6441 (US/Can toll free)
  • +44-800-368-9399 (UK office hours)
CONNECT WITH US
ABOUT TRUST ONLINE
©2024 MarketsandMarkets Research Private Ltd. All rights reserved
DMCA.com Protection Status Website Feedback