Live Entertainment Market Size, Share & Trends

Live Entertainment Market Size, Share & Trends by music concerts, sports events, e-sports, theaters & musicals, Al & automation, motion tracking, real-time streaming, pre-recorded/recorded streaming, distribution & streaming - Global Forecast to 2030




Live Entertainment Market OVERVIEW
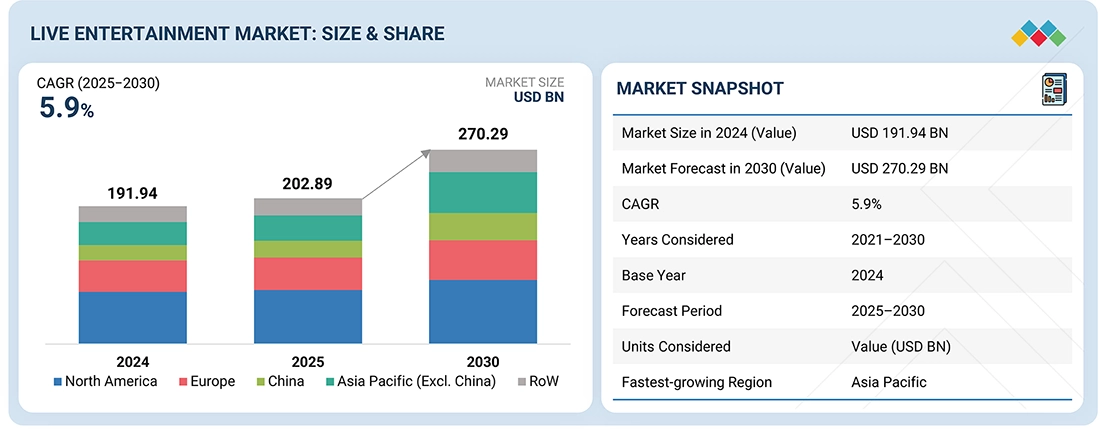
According to Marketsandmarkets, the global live entertainment market size is projected to reach USD 202.89 billion in 2025 and USD 270.29 billion by 2030, growing at a CAGR of 5.9%. Growth is driven by rising demand for immersive experiences across music concerts, sports events, e-sports, and theaters & musicals. Advancements in AR/VR, 5G, and AI, along with expanding real-time and recorded streaming platforms, are transforming audience engagement. North America and Europe dominate the market, while Asia Pacific, Latin America, and the Middle East & Africa (MEA) are emerging as high-growth regions supported by increasing digital adoption.
REPORT SCOPE
| REPORT METRIC | DETAILS |
|---|---|
| Market Size in 2025 (Value) | USD 202.89 BN |
| Market Forecast in 2030 (Value) | USD 270.29 BN |
| Growth Rate | CAGR of 5.9% from 2025-2030 |
| Years Considered | 2021-2030 |
| Base Year | 2024 |
| Forecast Period | 2025-2030 |
| Units Considered | Value (USD Billion) |
| Report Coverage | Revenue forecast, company ranking, competitive landscape, growth factors, and trends |
| Top Companies |
|
| Growth Driver |
|
| Segments Covered |
|
| Regions Covered | North America, Europe, China, Asia Pacific (Excl. China), Rest of the World |
KEY TAKEAWAYS
-
BY STREAMING TYPEThe live entertainment market by streaming type includes real-time and pre-recorded/recorded streaming. Real-time streaming dominates, driven by audience demand for immersive and interactive experiences during concerts, e-sports, and sports events. It enhances real-time engagement and community participation. Pre-recorded streaming supports content accessibility and flexibility, catering to global audiences through on-demand performances and extended event visibility.
-
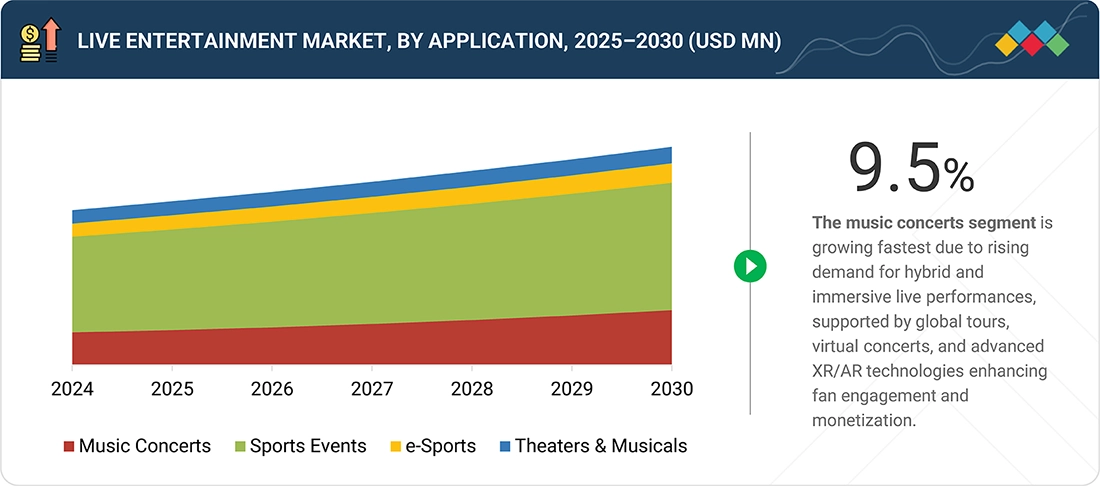
BY APPLICATIONThe market by application covers music concerts, sports events, e-sports, and theaters & musicals. Music concerts lead growth, supported by strong fan engagement and technological integration. Sports events remain a major revenue source with broad global audiences and sponsorship appeal. E-sports is rapidly expanding through digital platforms, while theaters and musicals are adopting hybrid formats to sustain reach and audience interaction.
-
BY REGIONThe live entertainment market spans North America, Europe, Asia Pacific, China, and the Rest of the World (Latin America and MEA). North America and Europe dominate due to mature event ecosystems and strong digital infrastructure. Asia Pacific shows the fastest growth, driven by rising disposable incomes and youth-centric entertainment trends. Meanwhile, Latin America and MEA are emerging with expanding digital access and growing cultural engagement.
-
COMPETITIVE LANDSCAPEThe live entertainment market features a mix of global organizers, streaming platforms, and content creators competing through innovation and audience engagement. Leading players focus on hybrid event models, AR/VR integration, and strategic collaborations to enhance user experience. Continuous investment in digital platforms, event production quality, and localized content strategies is reshaping competition and driving sustained market expansion.
The live entertainment market share is witnessing steady expansion, supported by the growing popularity of large-scale music concerts, sports tournaments, e-sports competitions, and theatrical performances. The adoption of advanced technologies such as AR/VR, 5G, and AI is enhancing audience interaction and event experiences. Industry participants are investing in hybrid and digital event formats, strategic partnerships, and content innovation to expand their global footprint. Rising consumer spending on live experiences and digital engagement platforms continues to drive market growth.
Source: Secondary Research, Interviews with Experts, MarketsandMarkets Analysis
TRENDS & DISRUPTIONS IMPACTING CUSTOMERS' CUSTOMERS
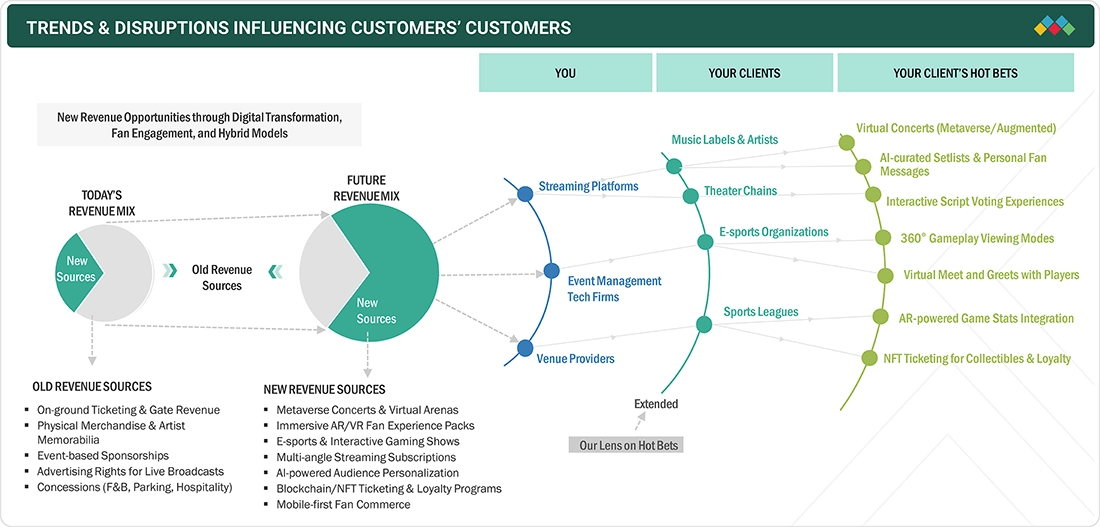
The live entertainment market trends is being reshaped by digital transformation, fan engagement innovations, and hybrid revenue models. Traditional revenue streams like ticketing and sponsorships are being complemented by new sources such as metaverse concerts, immersive AR/VR fan experiences, and e-sports-driven interactions. Advancements in AI personalization, blockchain-based ticketing, and mobile-first fan commerce are enabling deeper audience connections and diversified monetization. These disruptions are empowering clients’ customers—artists, venues, and leagues—to deliver interactive, data-driven, and loyalty-focused entertainment experiences.
Source: Secondary Research, Interviews with Experts, MarketsandMarkets Analysis
MARKET DYNAMICS

Level
-
High preference for immersive and experiential live entertainment

-
Rapid expansion of digital streaming platforms


Level
-
Revenue leakage due to unauthorized streaming

-
Audience fragmentation and platform saturation


Level
-
Development of sustainable and eco-friendly event models

-
Expansion of the live entertainment industry into untapped regional markets


Level
-
High complexity and expenses associated with hybrid models

-
Technology gaps and infrastructure limitations in emerging markets

Source: Secondary Research, Interviews with Experts, MarketsandMarkets Analysis
Driver: High preference for immersive and experiential live entertainment
Consumers are increasingly seeking immersive and experiential entertainment, driving strong demand for live events integrated with AR/VR, holographic visuals, and interactive fan engagement tools. This shift toward experience-driven consumption is encouraging event organizers, artists, and platforms to create multisensory formats that blend physical and digital elements, enhancing audience participation and emotional connection while unlocking new monetization channels through hybrid and virtual experiences.
Restraint: Revenue leakage due to unauthorized streaming
Unauthorized or pirated streaming remains a key restraint for the live entertainment market, causing significant revenue losses for event organizers and artists. The proliferation of unlicensed platforms and illegal broadcasts undermines content ownership and deters investment in premium live events. Addressing this issue requires stronger digital rights management, blockchain-based authentication, and partnerships with legitimate streaming services to ensure secure, traceable, and monetizable content distribution.
Opportunity: Development of sustainable and eco-friendly event models
Growing environmental awareness is pushing the industry toward sustainable and eco-friendly event models. Organizers are adopting green practices such as energy-efficient lighting, waste reduction, carbon offset programs, and digital ticketing to minimize environmental impact. The integration of virtual and hybrid formats also reduces travel-related emissions, creating opportunities for brands to position themselves as responsible and future-ready while appealing to eco-conscious audiences and sponsors.
Challenge: High complexity and expenses associated with hybrid models
Hybrid event models, while expanding audience reach, introduce significant complexity and cost. Coordinating both on-site and virtual components requires advanced technology infrastructure, seamless content delivery, and skilled technical teams. These added logistics, combined with platform licensing fees and cybersecurity measures, can strain event budgets. Achieving balance between scalability, engagement quality, and cost efficiency remains a key challenge for organizers navigating this evolving event landscape.
LIVE ENTERTAINMENT MARKET SIZE, SHARE, TRENDS AND GROWTH: COMMERCIAL USE CASES ACROSS INDUSTRIES
| COMPANY | USE CASE DESCRIPTION | BENEFITS |
|---|---|---|
 |
Leveraged XR and virtual avatar technology to recreate ABBA’s live concert experience using digital avatars performing alongside a live band in a purpose-built venue. | Delivered a groundbreaking fusion of nostalgia and technology, redefining the concert model for legacy artists and enabling long-term digital performances. |
 |
Replaced traditional fireworks with drone-based light shows, creating large-scale synchronized aerial displays using thousands of LED drones. | Reduced carbon emissions and noise pollution while enhancing visual storytelling and brand promotion at global events. |
 |
Introduced a wrap-around 16K LED screen and immersive sound system for concerts and live events, enabling multi-sensory engagement. | Elevated audience immersion with 360° visuals and spatial audio, setting new standards for live venue design and performance technology. |
 |
Deployed AI-powered crowd analytics and real-time monitoring systems to optimize venue safety, staffing, and service placement. | Improved crowd flow, reduced congestion, and enhanced event management efficiency through data-driven operational insights. |
 |
Implemented NFT and blockchain-based ticketing to prevent counterfeiting, duplication, and resale fraud for festival passes. | Increased ticket security, improved transparency in resale markets, and enhanced fan engagement via NFT-linked digital perks. |
Logos and trademarks shown above are the property of their respective owners. Their use here is for informational and illustrative purposes only.
MARKET ECOSYSTEM
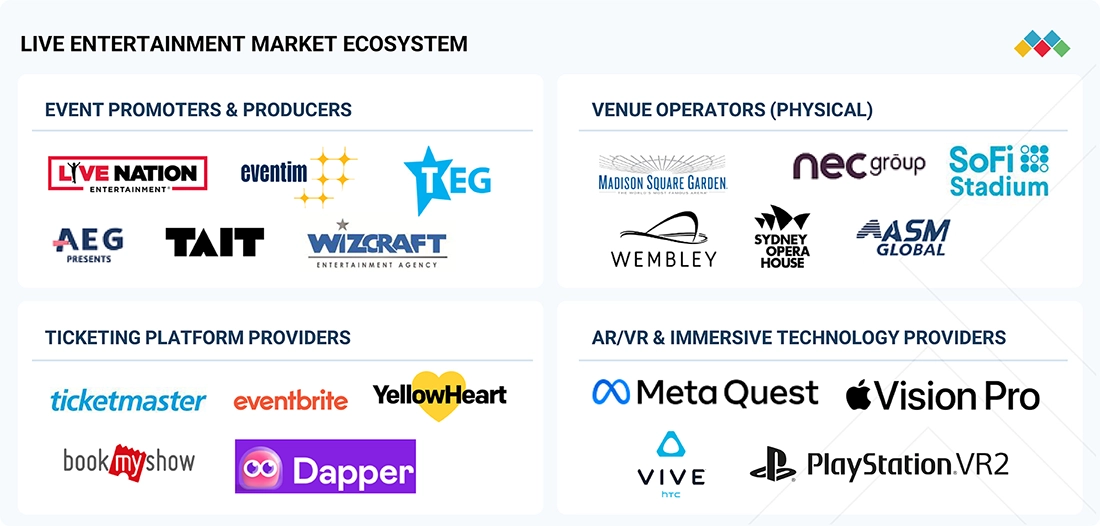
The live entertainment market ecosystem is a complex and collaborative network involving multiple stakeholders that collectively shape audience experiences and industry growth. Event promoters and producers drive content creation and large-scale event management, while venue operators provide physical infrastructure and logistics. Virtual event platforms and streaming service providers enable global digital access, supported by AR/VR technology companies that enhance immersive engagement. Additionally, ticketing platforms facilitate seamless audience participation, marketing agencies amplify reach, and brand sponsors strengthen monetization and visibility. Together, these participants form an integrated value chain that blends physical and digital entertainment experiences.
Logos and trademarks shown above are the property of their respective owners. Their use here is for informational and illustrative purposes only.
MARKET SEGMENTS
Source: Secondary Research, Interviews with Experts, MarketsandMarkets Analysis
Live Entertainment Market, By Streaming Type
Real-time streaming dominates the segment, driven by the growing preference for interactive and immersive experiences that replicate the excitement of in-person events. The integration of live chat, fan engagement tools, and AR/VR-enabled features enhances audience participation and engagement. Its growth is further supported by advancements in low-latency broadcasting technologies and immersive content formats, making it the most dynamic segment in the digital entertainment landscape.
Live Entertainment Market, By Application
Sports events hold the largest market share, supported by global fan bases, major sponsorships, and large-scale international tournaments. Music concerts, however, are emerging as the fastest-growing segment, fueled by hybrid event formats, virtual concerts, and high levels of fan interaction. The segment’s rise is further bolstered by digital fan engagement tools and metaverse-based performances, which are transforming traditional concert experiences into interactive, global entertainment platforms.
REGION
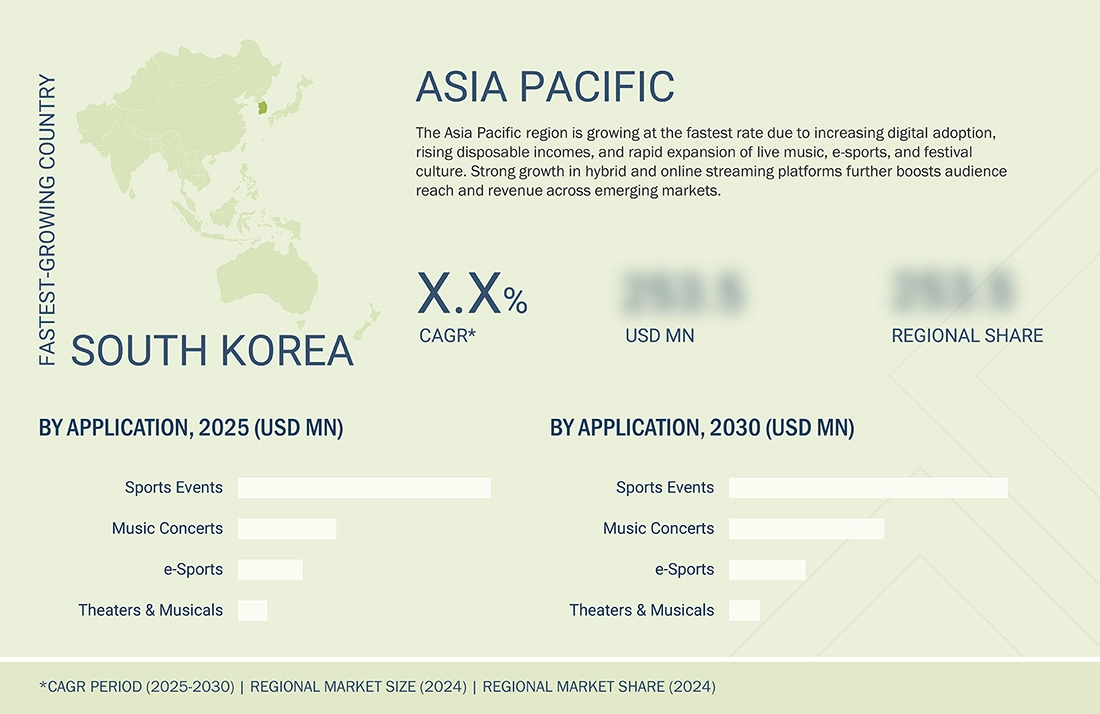
Asia Pacific to be the fastest-growing region in the global live entertainment market during the forecast period
The Asia Pacific region, including China, is witnessing the fastest growth in the global live entertainment industry. This expansion is fueled by rapid digital adoption, rising disposable incomes, and the growing popularity of live music, e-sports, and large-scale festivals across key countries such as South Korea, Japan, India, and China. The increasing penetration of online streaming and hybrid event platforms is enabling broader audience access and monetization opportunities. Furthermore, government support for cultural events and strong fan engagement ecosystems are reinforcing Asia Pacific’s position as the most dynamic and high-growth regional market.
LIVE ENTERTAINMENT MARKET SIZE, SHARE, TRENDS AND GROWTH: COMPANY EVALUATION MATRIX
Source: Secondary Research, Interviews with Experts, MarketsandMarkets Analysis
KEY MARKET PLAYERS
- Live Nation Entertainment (US)
- AEG (Anschutz Entertainment Group) (US)
- HYBE Corporation (South Korea)
- MSG Entertainment (US)
- CTS Eventim AG & Co. KGaA (Germany)
- Disney (US)
- Shubert Organization (US)
- World Wrestling Entertainment (WWE) (US)
- Savvy Games Group (Saudi Arabia)
- SM Entertainment (South Korea)
- Yoshimoto Kogyo (Japan)
- TBS Holdings, Inc. (Japan)
- TOHO Co., Ltd. (Japan)
- Feld Entertainmentv (US)
- Clash Royale Esports (Finland)
WHAT IS IN IT FOR YOU: LIVE ENTERTAINMENT MARKET SIZE, SHARE, TRENDS AND GROWTH REPORT CONTENT GUIDE
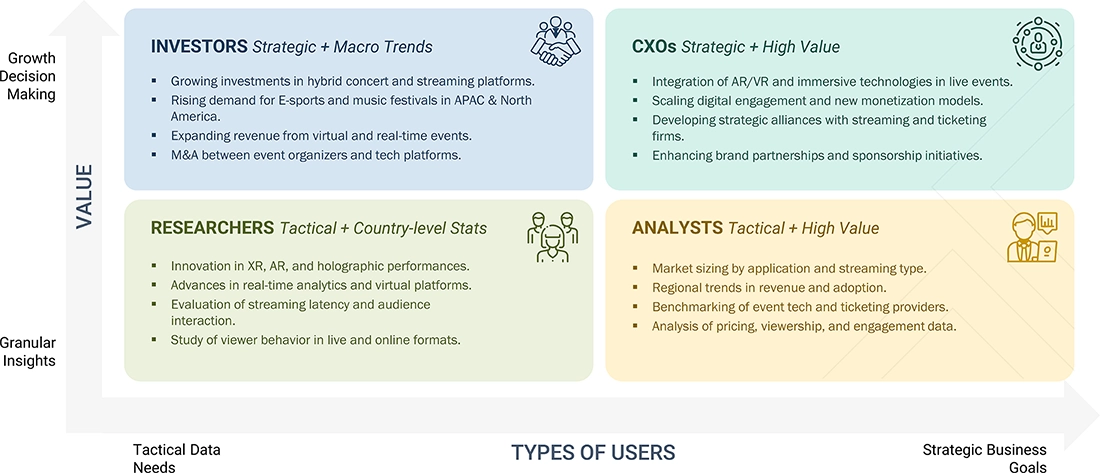
DELIVERED CUSTOMIZATIONS
We have successfully delivered the following deep-dive customizations:
| CLIENT REQUEST | CUSTOMIZATION DELIVERED | VALUE ADDS |
|---|---|---|
| Live Event Promoter / Producer |
|
|
| Streaming & Distribution Service Provider |
|
|
| Brand Sponsor / Partner |
|
|
RECENT DEVELOPMENTS
- April 2025 : AEG Presents announced a collaboration with Activision around the release of Tony Hawk's Pro Skater 3 + 4. As part of this collaboration, iconic venues owned and operated by AEG Presents, such as The El Rey Theatre and The Roxy, will be featured in the game.
- April 2025 : Live Nation acquired Hayashi International Promotions (HIP), one of Japan's largest concert promoters focused on both domestic and international artists. This acquisition marks Live Nation's expansion in the world's second-largest recorded music market, with HIP's CEO, Kaori Hayashi, continuing to lead the business.
- February 2025 : HYBE launched "Face Pass," a facial recognition entry system for K-Pop concerts and fan events. Developed in partnership with Toss and InterPark Triple, this system integrates facial recognition with Toss's digital wallet application and InterPark Triple's ticketing platform, allowing fans to enter events by scanning their biometric data. The system was set to debut at the "42:CLUB" fan event for boy band TWS.
- December 2024 : CTS Eventim acquired a 17% stake in France Billets from Fnac Darty. This is part of their strategy to expand their ticketing services.
- February 2024 : Disney and Epic Games announced a collaboration to create an expansive and open games and entertainment universe connected to Fortnite. Disney also committed to a USD 1.5 billion equity investment in Epic Games as part of this multiyear project.
Table of Contents
 Exclusive indicates content/data unique to MarketsandMarkets and not available with any competitors.
Methodology
The study involved major activities in estimating the current size of the live entertainment market. Exhaustive secondary research has been done to collect information on the market, peer market, and parent market. To validate these findings, assumptions, and sizing with industry experts across the supply chain through primary research has been the next step. Both top-down and bottom-up approaches have been employed to estimate the complete market size. After that, market breakdown and data triangulation methods have been used to estimate the market size of segments and subsegments. Secondary and primary sources have been used to identify and collect information for an extensive technical and commercial study of the live entertainment market.
Secondary Research
Various secondary sources have been referred to in the secondary research process to identify and collect information important for this study. The secondary sources include annual reports, press releases, and investor presentations of companies; white papers; journals and certified publications; and articles from recognized authors, websites, directories, and databases. Secondary research has been conducted to obtain key information about the industry’s supply chain, the market’s value chain, the total pool of key players, market segmentation according to the industry trends (to the bottom-most level), regional markets, and key developments from market- and technology-oriented perspectives. The secondary data has been collected and analyzed to determine the overall market size, further validated by primary research.
Primary Research
Extensive primary research was conducted after gaining knowledge about the current scenario of the live entertainment market through secondary research. Several primary interviews were conducted with experts from the demand and supply sides across four major regions—North America, Europe, Asia Pacific and RoW. This primary data was collected through questionnaires, emails, and telephonic interviews.
After successful interaction with industry experts, brief sessions were conducted with highly experienced independent consultants to reinforce the findings of our primary research. This, along with the in-house subject matter experts’ opinions, has led us to the findings as described in the report.
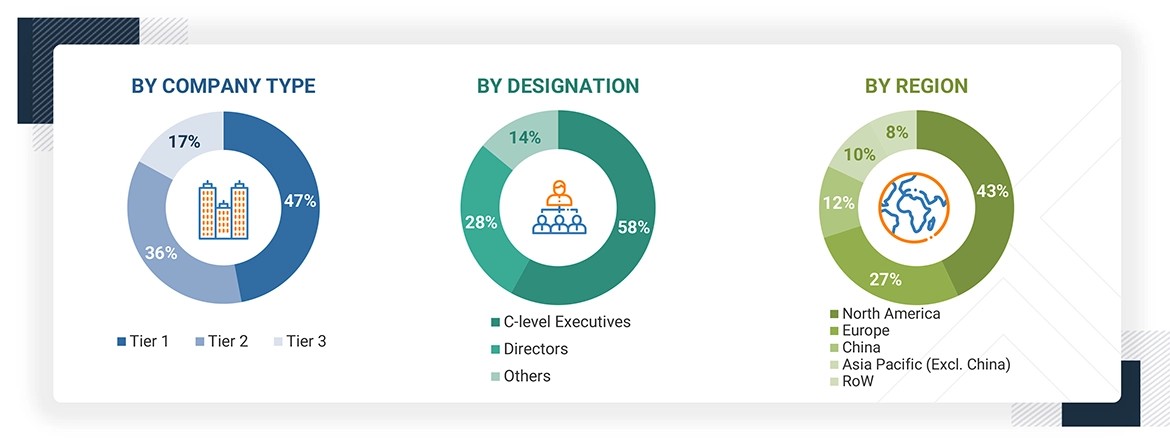
Note: RoW mainly comprises the Middle East & Africa, and Latin America.
Other designations include product managers, sales managers, and marketing managers.
Three tiers of companies have been defined based on their total revenue as of 2024; tier 3: revenue lesser than USD 500 million; tier 2: revenue between USD 500 million and 1 billion; and tier 1: revenue more than USD 1 billion. .
To know about the assumptions considered for the study, download the pdf brochure
Market Size Estimation
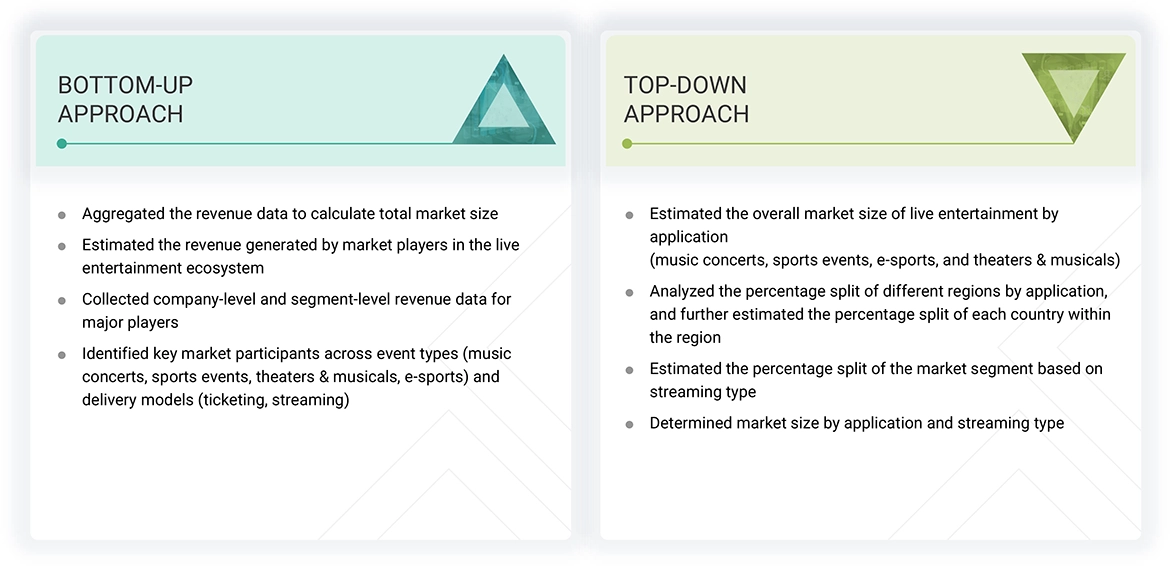
The bottom-up procedure has been employed to arrive at the overall size of the live entertainment market.
- Identified major global players delivering live entertainment services and assessed their market presence
- Analyzed revenues across different segments within the live entertainment market to identify growth drivers
- Estimated revenue contributions from key market players providing live entertainment services
- Obtained the global market size for live entertainment, offering a baseline for evaluating market potential
The top-down approach has been used to estimate and validate the total size of the live entertainment market.
- Estimated the total market size for live entertainment, outlining the overall scope and growth potential of the market
- Analyzed the regional market distribution, with further estimation of individual country shares within each region to identify localized trends and differences
- Estimated the market segmentation based on application (music concets, sports events, e-sports, and theaters & musicals, offering insights at both regional and national levels
- Calculated market size across various applications and streaming type
- Estimated the application-wise market distribution at the regional level, highlighting how different applications influence market dynamics across regions
Live Entertainment Market : Top-Down and Bottom-Up Approach
Data Triangulation
After arriving at the overall market size—using the market size estimation processes as explained above—the market has been split into several segments and subsegments. To complete the entire market engineering process and arrive at the exact statistics of each market segment and subsegment, data triangulation and market breakdown procedures have been employed, wherever applicable. The data has been triangulated by studying various factors and trends from the demand and supply sides in the live entertainment market.
Market Definition
The live entertainment market refers to the sector of the entertainment industry where audiences engage with content in real-time or near-real-time, typically within a shared space—either physical or virtual. This market includes a wide range of experiences such as live music concerts, sports events, theatre and musicals, movies, and e-sports, while excluding theme parks. Venues span from large-scale stadiums and arenas to medium and small-scale settings like cinemas, pubs, and karaoke rooms, as well as digital platforms such as the metaverse. Live entertainment is categorized into three main formats: real live, where performers and audiences are physically co-present; satellite live, where audiences share a physical space but view content via live broadcast without performers present; and virtual live, where audiences participate alone in a virtual environment. Content delivery can be real-time (online streaming) or non-real-time (recorded or pre-recorded), reflecting the evolving modes of audience engagement in the digital age.
Key Stakeholders
- Event organizers and promoters
- Artists, performers, and talent agencies
- Venue owners and operators
- Streaming platforms and digital media partners
- Ticketing service providers and distributors
- Sponsorship and advertising partners
- Technology solution providers (AR/VR, sound, lighting, event tech)
- Merchandise vendors and brand licensors
- Government and regulatory authorities (for permits, safety, crowd control)
- Fans and audience members (in-person and virtual)
Report Objectives
- To define, describe, and forecast the size of the live entertainment market by application and streaming type, in terms of value
- To provide information about technologies, value chain, and viewing experience associated with live entertainment
- To describe and forecast the market size for various segments concerning key regions, namely, North America, Europe, China, Asia Pacific (excl. China), and RoW, in terms of value
- To provide detailed information regarding the key factors such as drivers, restraints, opportunities, and challenges influencing the growth of the market
- To understand and analyze the impact of evolving technologies on the overall supply chain of the live entertainment market and upcoming trends in the ecosystem
- To provide macroeconomic outlooks with respect to the main geographies, namely, North America, Europe, China, Asia Pacific (excl. China), and RoW
- To provide a detailed overview of the live entertainment market industry trends and use cases.
- To strategically analyze micromarkets for individual growth trends, prospects, and contributions to the total market
- To provide ecosystem analysis, trends/disruptions impacting customer business, case study analysis, ecosystem analysis, and Gen AI/ AI impact related to the live entertainment market
- To analyze the opportunities in the market for stakeholders by identifying high-growth segments and detailing the competitive landscape for market players
- To analyze the competitive developments, such as acquisitions, service/solution launches, expansions, agreements, partnerships, and collaborations carried out by market players
Available customizations:
With the given market data, MarketsandMarkets offers customizations according to the company‘s specific needs. The following customization options are available for the report.
Company Information:
- Detailed analysis and profiling of additional market players (up to five)
Key Questions Addressed by the Report
What is the current size of the Live Entertainment Market?
The global Live Entertainment Market was valued at USD 202.90 billion in 2025 and is estimated to reach USD 270.29 billion by 2030.
What is the projected market size of the Live Entertainment Market by 2030?
The market is projected to reach USD 270.29 billion by 2030, driven by increasing demand for concerts, sports events, festivals, and immersive entertainment experiences.
What is the CAGR of the Live Entertainment Market during the forecast period?
The market is expected to grow at a CAGR of 5.9% from 2025 to 2030.
What are the major growth drivers of the Live Entertainment Market?
Key growth drivers include rising consumer spending on leisure activities, growing demand for immersive live experiences, advancements in AR/VR technologies, and increased sponsorship and ticketing revenues.
Which application segment is expected to grow the fastest?
Music concerts are projected to be the fastest-growing segment due to the resurgence of large-scale festivals, international tours, and hybrid concert experiences.
Which application segment holds the largest market share?
Sports events account for the largest share of the market, supported by strong global fan engagement, broadcasting rights, sponsorship deals, and international sporting events.
Which region dominates the Live Entertainment Market?
North America holds a significant share of the market due to its well-established entertainment industry, large-scale event infrastructure, and high consumer spending.
Which region is expected to witness the highest growth during the forecast period?
Asia Pacific is expected to register the fastest growth, driven by increasing disposable incomes, urbanization, growing youth populations, and expanding entertainment infrastructure.
Who are the leading companies operating in the Live Entertainment Market?
Major market participants include Live Nation Entertainment, AEG, HYBE Corporation, MSG Entertainment, CTS Eventim AG & Co. KGaA, and SM Entertainment.
What opportunities are highlighted in the Live Entertainment Market report?
Significant opportunities include expansion of hybrid events, adoption of immersive technologies such as AR and VR, growth in emerging markets, and increasing investments in premium live entertainment experiences.


Personalize This Research
- Triangulate with your Own Data
- Get Data as per your Format and Definition
- Gain a Deeper Dive on a Specific Application, Geography, Customer or Competitor
- Any level of Personalization
Let Us Help You
- What are the Known and Unknown Adjacencies Impacting the Live Entertainment Market
- What will your New Revenue Sources be?
- Who will be your Top Customer; what will make them switch?
- Defend your Market Share or Win Competitors
- Get a Scorecard for Target Partners

Custom Market Research Services
We Will Customise The Research For You, In Case The Report Listed Above Does Not Meet With Your Requirements
Get 10% Free CustomisationTESTIMONIALS

Tetsuya Ohhira
Business Development Manager-Technology Business
Nikon Corporation,
Leading Japanese MNC specializing in optics and imaging productswww.nikon.com
MarketsandMarkets™ response
is quick. Their attitude is flexible and positive. Analyst Insights are globally considered and
significant. Client Services quickly respond to our inquiry and demand. Their wide range of global
surveys help us make our strategic plan.
We hope Knowledge Store will be easier to search
for a report.
VP - Marketing & Business Development
Leading Provider of Process Control Solutions
We engaged with MarketsandMarkets on a study to perform an analysis and recommend a Go-To-Market strategy for metrology and process control in the semiconductor market. The study was tailored to our targets and needs with well-defined milestones. Our overall experience with the MarketsandMarkets team was very good throughout the project in all aspects including the analysis methodologies used, the quality and depth of primary and secondary data sets, the professionalism and flexibility of the team and the ability to meet the target schedule and milestones. We want to thank MarketsandMarkets team for a job well done.
- Italy Live Entertainment Market
- Japan Live Entertainment Market
- South Korea Live Entertainment Market
- India Live Entertainment Market
- Rest Of Europe Live Entertainment Market
- Rest Of Asia Pacific Live Entertainment Market
- US Live Entertainment Market
- Canada Live Entertainment Market
- Mexico Live Entertainment Market
- Germany Live Entertainment Market
- UK Live Entertainment Market
Growth opportunities and latent adjacency in Live Entertainment Market






Cameron
Apr, 2026
Are emerging segments like e-sports, virtual concerts, and immersive experiences included?.
Jason
Apr, 2026
How are technologies like AI, AR/VR, blockchain, and 5G transforming the industry?.