Meat Products Market

Meat Products Market by Animal (Beef, Pork, Poultry), Type (Processed, Frozen, Canned/Preserved, Chilled, Fresh), Distribution Channel (Retail, Food Service, E-Commerce), Nature, Packaging, and Region - Global Forecast to 2028

Report Code: FB 8867 Nov, 2023, by marketsandmarkets.com

The meat products market is estimated at USD 44.3 billion in 2023 and is projected to reach USD 68.9 billion by 2028, at a CAGR of 9.2% from 2023 to 2028. The global market for meat products is a dynamic and diverse sector within the food industry, covering a range of items such as beef, poultry, pork, lamb, and processed meats. In recent times, there has been a consistent uptrend in the demand for meat products, spurred by various factors, and there are no indications of this trend slowing down.

A primary catalyst for this surge in demand is the continuous growth of the world's population, particularly in emerging markets. The expanding population, coupled with increasing disposable incomes, has led to a rise in the consumption of meat as a primary source of protein. Urbanization is another influential factor, transforming dietary patterns as more individuals migrate to urban areas, resulting in a preference for processed and convenient meat products to align with busy lifestyles.

Global rises in income levels have prompted consumers to seek higher-quality meat products, driving the demand for premium and specialty options, such as organic and grass-fed meat. Shifting consumer preferences towards healthier, protein-rich diets have spurred interest in lean meats and alternatives, including plant-based options such as tofu and plant-based burgers.

Moreover, ethical concerns regarding animal welfare and environmental impact have influenced preferences towards meat products sourced from humanely and sustainably raised animals. A noteworthy example is Cargill, Incorporated (US), which, in collaboration with the China Animal Health and Food Safety Alliance (CAFA), expanded its product range in China by introducing new Sun Valley Raised Without Antibiotics (RWA) chicken products in March 2021. Additionally, the expansion of the foodservice industry, globalization, and advancements in meat processing and packaging have all contributed to the escalating demand for meat products.

The evolving landscape of this market is marked by a broad array of choices, and the industry's future appears promising, with ongoing innovations and increasing consumer awareness of health and environmental concerns expected to play pivotal roles in shaping its trajectory.

The demand for protein, particularly sourced from animals, has consistently been high due to global meat consumption. This demand for protein from animal meat and products is anticipated to persist in the coming years, showing continued growth. According to the OECD FAO Agricultural Outlook 2021-2030, the global consumption of meat proteins is projected to increase by 14% by 2030. Consequently, the demand for meat and meat products is robust and displays no indications of slowing down in the immediate future.

Meat Products Market Overview

To know about the assumptions considered for the study, Request for Free Sample Report

Meat Products Market Opportunities

To know about the assumptions considered for the study, download the pdf brochure

Market Dynamics

Drivers: Rising Demand for Meat-based Convenience Foods

The trend of urbanization, marked by the increasing migration of individuals from rural to urban areas, has significantly impacted the meat products market. Notably, the convenience associated with processed and pre-packaged meat items plays a crucial role in driving market growth. Urban lifestyles, characterized by fast-paced routines and limited time for traditional food preparation, make these products appealing due to features like pre-cutting, marination, and cooking convenience. Moreover, the compact living spaces and on-the-go lifestyles in urban settings enhance the attractiveness of these products, requiring minimal kitchen equipment and aligning with fast and portable food preferences. The diverse culinary landscape in cities, reflecting various cultures and cuisines, contributes to the demand for processed meats that accommodate multicultural tastes. Additionally, the assurance of food safety and quality addresses concerns of urban consumers who may lack access to fresh and locally sourced meats. In summary, the convenience offered by processed and pre-packaged meat products is a key driver of market growth in urban areas, meeting the diverse needs and preferences of the urban population.

Restraints: Growing Trend of Veganism.

The surging popularity of veganism is exerting a constraining impact on the meat products market, driven by a confluence of factors such as evolving consumer preferences, heightened concerns for health and the environment, and an increasing focus on ethical and animal welfare considerations. Consumers, motivated by the perceived health benefits, environmental sustainability, and ethical apprehensions about animal treatment, are progressively choosing plant-based alternatives over conventional meat products. Government regulations and subsidies that endorse plant-based foods, coupled with advancements in high-quality meat substitutes, further contribute to this transformative trend. Market competition, media influences, and the escalating healthcare costs associated with meat-centric diets also play pivotal roles in steering consumers away from traditional meat consumption. While veganism may not entirely eliminate meat consumption, it is anticipated to result in a substantial decline in the demand for meat products, prompting the meat industry to adapt by offering more sustainable and ethically sourced options.

The shift towards veganism reflects a broader societal consciousness about the impact of dietary choices on personal health, the environment, and animal welfare. This trend is not only driven by individual choices but also by systemic changes, including government policies and advancements in food technology. As consumers become more informed and conscientious, the meat industry is compelled to reevaluate its practices and offerings to align with the growing demand for sustainable and ethical food options. This shift underscores a significant transformation in the way we perceive and consume food, emphasizing a more holistic and mindful approach to our dietary habits.

Opportunities: Technological Advancement in Meat Processing Industry

Technological progress is playing a pivotal role in transforming and advancing the meat industry, driving its growth and evolution. These innovations are significantly improving product quality, extending shelf life, and minimizing waste. The use of modern meat processing equipment allows for precise and controlled methods, ensuring consistent cuts that meet high standards of taste and quality. This not only reflects the industry's commitment to safety and regulatory standards but also contributes to consumer satisfaction.

In terms of packaging, advancements such as Modified Atmosphere Packaging and vacuum sealing create controlled environments that enhance the shelf life of meat products, addressing concerns about food waste and promoting sustainability. Additionally, waste reduction efforts are being supported by advanced processing equipment, which maximizes meat utilization and minimizes trimmings and byproducts that would otherwise be discarded. Innovations in packaging materials also contribute to eco-friendly practices by minimizing excessive packaging.

Operational efficiency is a notable outcome of integrating technology into the meat industry. Automation and robotics are becoming increasingly prevalent in meat processing facilities, streamlining operations, increasing productivity, and reducing labor costs. Automated systems for cutting, trimming, and portioning not only improve efficiency but also ensure product consistency and reduce the risk of human error. Moreover, technological innovations enable traceability and quality control through the use of data, barcoding, and RFID systems, allowing real-time monitoring and tracking of products throughout the supply chain, thereby enhancing safety measures and regulatory compliance. Sustainability is a central focus in the integration of technological advancements within the meat industry. The emphasis on waste reduction, quality improvement, and the adoption of energy-efficient equipment contributes to minimizing the industry's environmental footprint. In conclusion, the meat industry's embrace of new technologies positions it well to meet changing consumer demands, reduce environmental impact, and maintain a competitive edge in the market.

Challenges: Fluctuation in Feed Prices and Labour Costs  

Volatility in feed prices and labor costs presents substantial challenges to the meat products market, as evidenced by recent developments in Kazakhstan's poultry industry. The escalation of feed costs, influenced by global dynamics in the grain market, has had a profound effect on domestic poultry and egg production. Nearly 70% of the production costs for poultry and eggs are attributed to feed expenses, and these costs have surged significantly over time. For instance, data from Poultry World in 2019 indicated that the price of wheat was USD 109 per tonne, whereas the current price has surged to USD 237 per tonne. Similarly, corn prices have increased by 50%, and soybean meal has experienced a threefold price hike, rising from USD 213 to USD 639 per tonne in Kazakhstan.

These fluctuations have created difficulties for poultry farmers in maintaining reasonable price levels for national consumption. The industry's heavy dependence on imports for various resources, including live birds, veterinary drugs, and production equipment, exacerbates the challenge. The weakened exchange rate of the Kazakh tenge has further increased the cost of these imports. Consequently, poultry farmers are grappling with heightened production costs, necessitating government consideration of state support and subsidies to alleviate the impact of expensive feed on the industry's sustainability. This situation underscores the meat products market's susceptibility to feed price fluctuations and emphasizes the importance of implementing strategic measures to stabilize the sector and ensure the affordability of meat products for consumers.

Market Ecosystem

Meat Products Market Ecosystem

Processed is one of the types that Accounted for the Highest Market Share in 2022.

The surging demand for processed meat products, encompassing cured, dried, roasted, smoked, and fermented varieties, can be attributed to a confluence of factors reshaping consumer behavior. In today's fast-paced lifestyles, characterized by time constraints and hectic schedules, the convenience offered by processed meats has become increasingly appealing. These products require minimal preparation, aligning seamlessly with the preferences of busy individuals and professionals seeking quick and easy meal solutions. Moreover, the diverse flavors and textures achieved through curing, smoking, and fermentation processes cater to the evolving culinary tastes of a more adventurous and discerning consumer base.

The globalization of food culture has also played a pivotal role, exposing consumers to a broader array of culinary traditions and fostering a demand for unique and exotic flavors. As disposable incomes rise globally, consumers are more inclined to opt for convenience foods, with processed meats fitting the bill as a ready-to-eat or easy-to-prepare option. Despite health considerations, the indulgent and savory qualities of processed meats continue to attract consumers, prompting manufacturers to adapt by introducing healthier formulations. In essence, the burgeoning demand for processed meat products reflects a dynamic interplay of convenience, culinary diversity, economic trends, and evolving consumer preferences in the contemporary food landscape.

Europe is the Fastest-Growing Market for Meat Products Among the Regions.

The European market offers significant business prospects for meat product manufacturers, driven by the increasing emphasis on health awareness in the region. This heightened awareness has led to a surge in demand for meat products, supported by a growing number of manufacturers entering the market and introducing new products. Factors such as sustainability concerns and a heightened focus on health practices are key drivers of this shift.

The rising trend of embracing new dietary preferences and health-conscious choices is propelling the meat products market in Europe. The region hosts a substantial number of major players in the meat industry, and these companies are actively seeking opportunities to strengthen their market positions. Strategies employed by these manufacturers include product launches, expanding production capacities, and engaging in partnerships and acquisitions with other industry players to enhance their geographical presence and establish dominance in the European meat products sector. For example, in August 2022, Vion Group from the Netherlands is making significant investments to expand its operations in eastern Germany, specifically in Thuringia and Brandenburg. The company is committed to fostering regionalism in food retail by focusing on delivering fresh beef and pork products to meet the growing demand for local and regional options, including organic choices. This approach aims to minimize carbon footprint and enhance animal welfare by reducing transport times.

Meat Products Market by Region

Key Market Players

The key players in this market include Cargill, Incorporated (US), JBS SA (Brazil), Tyson Foods, Inc. (Arkansans), Hormel Foods Corporation (US), Vion Group (Netherlands).

Get online access to the report on the World's First Market Intelligence Cloud

  • Easy to Download Historical Data & Forecast Numbers
  • Company Analysis Dashboard for high growth potential opportunities
  • Research Analyst Access for customization & queries
  • Competitor Analysis with Interactive dashboard
  • Latest News, Updates & Trend analysis
Request Sample

Scope of the Report

Report Metric

Details

Market size value in 2023

USD 44.3 billion

Revenue forecast in 2028

USD 68.9 billion

Growth Rate

CAGR of 9.2% from 2023 to 2028

Market size estimation

2023–2028

Base year considered

2022

Forecast period considered

2023–2028

Units considered

Value (USD)

Segments covered

By Animal Type, Type, Distribution Channel, Nature, Packaging(qualitative), End User (qualitative), and Region

Regions covered

North America, Europe, Asia Pacific, South America, and RoW

Key Companies Profiled

  • Cargill (US)
  • Tyson Foods, Inc. (Arkansans)
  • Hormel Foods Corporation (US)
  • Maple Leaf Foods (Canada)
  • JBS SA (Brazil)
  • Marfrig Global Foods S.A.  (Brazil)
  • Associated British Foods plc (UK)
  • Danish Crown Vej (Denmark)
  • Minerva Foods SA (Brazil)
  • Vion Group (Netherlands)
  • Cremonini S.p.A (Italy)
  • VOUDOURIS – KONSTAS SA (Greece)
  • Resource Agribusiness Group (Russia)
  • Plukon Food Group (Netherlands)
  • Baiada (Australia)

This research report categorizes the meat products market, based on animal type, type, distribution channel, nature, packaging, end user, and region.

Meat Products Market Segmentation:

By Animal Type
  • Beef
  • Pork
  • Poultry
  • Other Animal Type
By Type
  • Processed
    • Cured
    • Dried
    • Fermented
    • Other Processed Type
  • Frozen
  • Canned/preserved
  • Chilled
  • Fresh
By Distribution Channel
  • Retail
    • Supermarkets/Hypermarkets
    • Convenience stores
    • Other retail channels
  • Food Services
  • E-Commerce
By Nature
  • Conventional
  • Organic
By Packaging (qualitative)
  • Fresh Meat Packaging
  • Vaccum Packaging
  • Modified Atmosphere packaging
By End Use (qualitative)
  • Commercial/Institutional
  • Household/Consumers
By Region:
  • North America
  • Europe
  • Asia Pacific
  • South America
  • Rest of the World (RoW)

Target Audience

  • Processed food products manufacturers
  • Restaurants, Food services
  • Meat Products Consumers
  • Meat products traders

Meat Products Market Recent Developments

  • In September 2023, Minerva Foods SA (Brazil) has completed its acquisition of Breeders and Packers Uruguay SA (BPU Meat), a subsidiary of NH Foods, with a total investment of USD 40 million. With this acquisition, Minerva Foods significantly enhanced its total slaughter capacity, which now reaches 3,700 heads per day, distributed across four refrigeration units, including the newly acquired BPU Meat.
  • In August 2023, Minerva Foods SA (Brazil) has acquired the majority of Marfrig's cattle and sheep slaughtering and deboning operations in South America. The deal cost USD 1.45 billion. The transaction is expected to deepen Minerva's geographical diversification
  • In July 2023, Vion Zucht- und Nutzvieh (Netherlands) and Danish Crown have entered a contract for cattle slaughtering services in Schleswig-Holstein. Commencing from August 1, 2023, Danish Crown will undertake the slaughter of up to 1,000 young bulls, cows, and heifers per week on behalf of Vion Food Group. This helps them to produce a large quantity of meat to meet the demand of consumers.
  • In May 2023, The Danish Crown (Denmark) acquired the SELO Verpakking and SELO Belgium, (Benlux). With the acquisition of the majority stake in the SELO companies gives them a perfect platform to grow their business in Benelux.
  • In March 2023, Hormel Foods (US), the maker of HORMEL BLACK LABEL Bacon, has introduced a unique product called "Hardcourt Smoked HORMEL BLACK LABEL Bacon." This bacon is smoked using actual northern cherry maple wood that is used to make the basketball courts for the 2023 college basketball tournament.

Frequently Asked Questions (FAQ):

To speak to our analyst for a discussion on the above findings, click Speak to Analyst

TABLE OF CONTENTS
 
1 INTRODUCTION (Page No. - 28)
    1.1 STUDY OBJECTIVES 
    1.2 MARKET DEFINITION 
    1.3 STUDY SCOPE 
           1.3.1 MARKET SEGMENTATION
                    FIGURE 1 MEAT PRODUCTS MARKET: MARKET SEGMENTATION
           1.3.2 INCLUSIONS AND EXCLUSIONS
           1.3.3 REGIONS COVERED
           1.3.4 YEARS CONSIDERED
    1.4 UNIT CONSIDERED 
           1.4.1 CURRENCY/VALUE UNIT
                    TABLE 1 USD EXCHANGE RATES CONSIDERED, 2018–2022
           1.4.2 VOLUME UNIT
    1.5 STAKEHOLDERS 
    1.6 IMPACT OF RECESSION 
 
2 RESEARCH METHODOLOGY (Page No. - 33)
    2.1 RESEARCH DATA 
           FIGURE 2 MEAT PRODUCTS MARKET: RESEARCH DESIGN
           2.1.1 SECONDARY DATA
                    2.1.1.1 Key data from secondary sources
           2.1.2 PRIMARY DATA
                    2.1.2.1 Key data from primary sources
                    2.1.2.2 Breakdown of primary profiles
                               FIGURE 3 BREAKDOWN OF PRIMARY INTERVIEWS, BY COMPANY TYPE, DESIGNATION, AND REGION
                    2.1.2.3 Key insights from industry experts
    2.2 MARKET SIZE ESTIMATION 
           2.2.1 BOTTOM-UP APPROACH
                    FIGURE 4 MARKET SIZE ESTIMATION METHODOLOGY: BOTTOM-UP APPROACH
           2.2.2 TOP-DOWN APPROACH
                    FIGURE 5 MARKET SIZE ESTIMATION METHODOLOGY: TOP-DOWN APPROACH
                    2.2.2.1 Supply side
                               FIGURE 6 SUPPLY SIDE ANALYSIS: SOURCES OF INFORMATION AT EVERY STEP
                               FIGURE 7 MARKET SIZE ESTIMATION: SUPPLY-SIDE ANALYSIS
    2.3 DATA TRIANGULATION 
           FIGURE 8 DATA TRIANGULATION METHODOLOGY
    2.4 ASSUMPTIONS 
    2.5 LIMITATIONS 
    2.6 RECESSION IMPACT ANALYSIS 
           2.6.1 MACRO INDICATORS OF RECESSION
                    FIGURE 9 INDICATORS OF RECESSION
                    FIGURE 10 GLOBAL INFLATION RATE, 2011–2022
                    FIGURE 11 GLOBAL GDP, 2011–2022 (USD TRILLION)
                    FIGURE 12 RECESSION INDICATORS AND THEIR IMPACT ON MEAT PRODUCTS MARKET
                    FIGURE 13 GLOBAL MEAT PRODUCTS MARKET: EARLIER FORECAST VS. RECESSION FORECAST
 
3 EXECUTIVE SUMMARY (Page No. - 49)
    TABLE 2 MEAT PRODUCTS MARKET SNAPSHOT, 2023 VS. 2028 
    FIGURE 14 MEAT PRODUCTS MARKET SNAPSHOT, BY ANIMAL TYPE, 2023 VS. 2028 
    FIGURE 15 MARKET, BY TYPE, 2023 VS. 2028 (USD MILLION) 
    FIGURE 16 MARKET, BY DISTRIBUTION CHANNEL, 2023 VS. 2028 (USD MILLION) 
    FIGURE 17 MARKET, BY NATURE, 2023 VS. 2028 (USD MILLION) 
    FIGURE 18 MARKET: REGIONAL SNAPSHOT 
 
4 PREMIUM INSIGHTS (Page No. - 54)
    4.1 ATTRACTIVE OPPORTUNITIES FOR MEAT PRODUCTS MARKET PLAYERS 
           FIGURE 19 INCREASE IN HEALTH AWARENESS AND DEMAND FOR NUTRITIVE FOOD TO DRIVE MARKET
    4.2 ASIA PACIFIC: MEAT PRODUCTS MARKET, BY NATURE & COUNTRY 
           FIGURE 20 CONVENTIONAL MEAT PRODUCTS TO DOMINATE IN ASIA PACIFIC IN 2023; CHINA TO LEAD AMONG COUNTRIES
    4.3 MEAT PRODUCTS MARKET, BY ANIMAL TYPE & REGION 
           FIGURE 21 POULTRY TO DOMINATE ACROSS MOST REGIONS DURING FORECAST PERIOD
           FIGURE 22 MEAT PRODUCTS MARKET, BY TYPE, 2023 VS. 2028 (USD MILLION)
           FIGURE 23 MEAT PRODUCTS MARKET, BY DISTRIBUTION CHANNEL, 2023 VS. 2028 (USD MILLION)
    4.4 MEAT PRODUCTS MARKET: KEY COUNTRIES 
           FIGURE 24 CHINA DOMINATED MEAT PRODUCTS MARKET IN 2022
 
5 MARKET OVERVIEW (Page No. - 59)
    5.1 INTRODUCTION 
    5.2 MACROECONOMIC INDICATORS 
           5.2.1 RISE IN GLOBAL APPETITE FOR MEAT
                    FIGURE 25 POPULATION PROJECTED TO REACH MORE THAN 9.5 BILLION BY 2050
           5.2.2 INCREASE IN MEAT PRODUCTION DUE TO EXPORT OPPORTUNITIES
                    FIGURE 26 MEAT PRODUCTION, BY KEY REGION, 2000–2020 (THOUSAND TONS)
                    FIGURE 27 IMPORT AND EXPORT OF MEAT PRODUCTS, 2020–2022 (USD MILLION)
    5.3 MARKET DYNAMICS 
           FIGURE 28 DRIVERS, RESTRAINTS, OPPORTUNITIES, AND CHALLENGES: MEAT PRODUCTS MARKET
           5.3.1 DRIVERS
                    5.3.1.1 Growth in awareness of nutritional value of meat
                    5.3.1.2 Rise in demand for meat-based convenience foods
           5.3.2 RESTRAINTS
                    5.3.2.1 Rise in environmental and animal concerns
                               FIGURE 29 CO2 EMISSION FROM DIFFERENT FOOD TYPES
                    5.3.2.2 Multiple incidences of disease outbreaks
                    5.3.2.3 Growh in trend of veganism
                               FIGURE 30 US: PLANT-BASED MEAT SALES, 2019–2022 (USD BILLION)
                               FIGURE 31 EUROPE: PLANT-BASED MEAT SALES, 2020–2022 (USD BILLION)
           5.3.3 OPPORTUNITIES
                    5.3.3.1 Growth in eCommerce
                    5.3.3.2 Technological advancements in meat processing industries
           5.3.4 CHALLENGES
                    5.3.4.1 Disruptions in supply chain
                    5.3.4.2 Fluctuations in feed prices and labor costs
 
6 INDUSTRY TRENDS (Page No. - 69)
    6.1 INTRODUCTION 
    6.2 SUPPLY CHAIN ANALYSIS 
           FIGURE 32 MEAT PRODUCTS MARKET: SUPPLY CHAIN ANALYSIS
    6.3 VALUE CHAIN ANALYSIS 
           6.3.1 INBOUND LOGISTIC
           6.3.2 PRODUCTION
           6.3.3 PROCESSING & PACKAGING
           6.3.4 DISTRIBUTION
           6.3.5 MARKETING & SALES
           6.3.6 END USERS
                    FIGURE 33 MEAT PRODUCTS MARKET: VALUE CHAIN ANALYSIS
    6.4 END-USER ANALYSIS 
           6.4.1 COMMERCIAL/INSTITUTION
           6.4.2 HOUSEHOLD/CONSUMERS
    6.5 TRADE ANALYSIS 
           6.5.1 MEAT OF BOVINE ANIMALS, FRESH OR CHILLED
                    TABLE 3 TOP TEN IMPORTERS AND EXPORTERS OF MEAT OF BOVINE ANIMALS, FRESH OR CHILLED, 2022 (USD THOUSAND)
           6.5.2 MEAT OF BOVINE ANIMALS, FROZEN
                    TABLE 4 TOP 10 IMPORTERS AND EXPORTERS OF MEAT OF BOVINE ANIMALS, FROZEN, 2022 (USD THOUSAND)
           6.5.3 MEAT OF SHEEP OR GOATS, FRESH, CHILLED, OR FROZEN
                    TABLE 5 TOP TEN IMPORTERS AND EXPORTERS OF MEAT OF SHEEP OR GOATS, FRESH, CHILLED, OR FROZEN, 2022 (USD THOUSAND)
           6.5.4 MEAT OF SWINE, FRESH, CHILLED, OR FROZEN
                    TABLE 6 TOP TEN IMPORTERS AND EXPORTERS OF MEAT OF SWINE, FRESH, CHILLED, OR FROZEN, 2022 (USD THOUSAND)
    6.6 TECHNOLOGY ANALYSIS 
           6.6.1 HIGH-PRESSURE PROCESSING (HPP)
           6.6.2 PULSED ELECTRIC FIELD
    6.7 PRICING ANALYSIS 
           6.7.1 AVERAGE SELLING PRICE TREND OF KEY PLAYERS, BY ANIMAL TYPE
                    FIGURE 34 AVERAGE SELLING PRICE TREND OF KEY PLAYERS, BY ANIMAL TYPE (USD/KG)
                    TABLE 7 MEAT PRODUCTS MARKET: AVERAGE SELLING PRICE TREND OF KEY PLAYERS, BY ANIMAL TYPE, 2021–2028 (USD/KG)
           6.7.2 AVERAGE SELLING PRICE TREND, BY REGION
                    TABLE 8 MEAT PRODUCTS MARKET: AVERAGE SELLING PRICE TREND, BY REGION, 2021–2028 (USD/TONNES)
           6.7.3 AVERAGE SELLING PRICE TREND, BY ANIMAL TYPE
                    FIGURE 35 AVERAGE SELLING PRICE TREND, BY ANIMAL TYPE, 2029–2022 (USD/TONNE)
    6.8 ECOSYSTEM/MARKET MAP 
           6.8.1 DEMAND SIDE
           6.8.2 SUPPLY SIDE
                    FIGURE 36 KEY PLAYERS IN MEAT PRODUCTS ECOSYSTEM
                    TABLE 9 MEAT PRODUCTS MARKET: ECOSYSTEM
    6.9 TRENDS/DISRUPTIONS IMPACTING CUSTOMER’S BUSINESS 
           FIGURE 37 TRENDS/DISRUPTIONS IMPACTING CUSTOMER’S BUSINESS
    6.10 PATENT ANALYSIS 
           TABLE 10 LIST OF MAJOR PATENTS PERTAINING TO MARKET, 2013–2023
    6.11 KEY CONFERENCES & EVENTS 
                    TABLE 11 DETAILED LIST OF KEY CONFERENCES & EVENTS, 2023–2024
    6.12 TARIFF AND REGULATORY LANDSCAPE 
           6.12.1 REGULATORY LANDSCAPE
                    6.12.1.1 North America
                               6.12.1.1.1 Federal Meat Inspection Act
                               6.12.1.1.2 Poultry Products Inspection Act
                    6.12.1.2 Europe
                               6.12.1.2.1 European Commission
                               6.12.1.2.2 Legislation.gov.uk
                    6.12.1.3 Asia Pacific
                               6.12.1.3.1 India
                                             6.12.1.3.1.1 FSSAI
           6.12.2 REGULATORY BODIES, GOVERNMENT AGENCIES, AND OTHER ORGANIZATIONS
                    TABLE 12 LIST OF REGULATORY BODIES, GOVERNMENT AGENCIES, AND OTHER ORGANIZATIONS
    6.13 PORTER’S FIVE FORCES ANALYSIS 
                    TABLE 13 PORTER’S FIVE FORCES IMPACT ON MEAT PRODUCTS MARKET
           6.13.1 THREAT OF NEW ENTRANTS
           6.13.2 THREAT OF SUBSTITUTES
           6.13.3 BARGAINING POWER OF SUPPLIERS
           6.13.4 BARGAINING POWER OF BUYERS
           6.13.5 INTENSITY OF COMPETITIVE RIVALRY
    6.14 KEY STAKEHOLDERS AND BUYING CRITERIA 
           6.14.1 KEY STAKEHOLDERS IN BUYING PROCESS
                    FIGURE 38 INFLUENCE OF STAKEHOLDERS ON BUYING PROCESS FOR TOP THREE ANIMAL TYPES
                    TABLE 14 INFLUENCE OF STAKEHOLDERS IN BUYING PROCESS FOR TOP THREE ANIMAL TYPES
                    6.14.2 BUYING CRITERIA
                    TABLE 15 KEY BUYING CRITERIA FOR TOP THREE ANIMAL TYPES
                    FIGURE 39 KEY BUYING CRITERIA FOR TOP THREE ANIMAL TYPES
    6.15 CASE STUDY ANALYSIS 
           6.15.1 K&G MCATAMNEY COLLABORATED WITH VERSATILE PACKAGING TO ESTABLISH NETWORK IN UK
           6.15.2 CENTRAL FOOD SERVICES INCREASED THROUGHPUT BY 100% BY DEPLOYING REVOLUTION TRAY SEALER
 
7 MEAT PRODUCTS MARKET, BY ANIMAL TYPE (Page No. - 95)
    7.1 INTRODUCTION 
           FIGURE 40 MEAT PRODUCTS MARKET, BY ANIMAL TYPE, 2023 VS. 2028 (USD MILLION)
           TABLE 16 MEAT PRODUCTS MARKET, BY ANIMAL TYPE, 2018–2022 (USD MILLION)
           TABLE 17 MEAT PRODUCTS MARKET, BY ANIMAL TYPE, 2023–2028 (USD MILLION)
           TABLE 18 MEAT PRODUCTS MARKET, BY ANIMAL TYPE, 2018–2022 (MILLION TONNES)
           TABLE 19 MEAT PRODUCTS MARKET, BY ANIMAL TYPE, 2023–2028 (MILLION TONNES)
    7.2 BEEF 
           7.2.1 SURGE IN BEEF CONSUMPTION FUELED BY ECONOMIC GROWTH AND GLOBALIZATION OF CULINARY PREFERENCES
                    FIGURE 41 BEEF & VEAL MEAT PRODUCTION, 2021–2025 (TONNES)
                    TABLE 20 BEEF PRODUCTS MARKET, BY REGION, 2018–2022 (USD MILLION)
                    TABLE 21 BEEF PRODUCTS MARKET, BY REGION, 2023–2028 (USD MILLION)
    7.3 PORK 
           7.3.1 RISE IN GLOBAL AWARENESS OF IMPORTANCE OF BALANCED DIETS PROPELLED PORK MEAT CONSUMPTION
                    FIGURE 42 PORK MEAT PRODUCTION, 2020–2025 (TONNES)
                    TABLE 22 PORK MEAT PRODUCTS MARKET, BY REGION, 2018–2022 (USD MILLION)
                    TABLE 23 PORK MEAT PRODUCTS MARKET, BY REGION, 2023–2028 (USD MILLION)
    7.4 POULTRY 
           7.4.1 EASY AVAILABILITY AND AFFORDABILITY OF POULTRY MEAT
                    FIGURE 43 POULTRY MEAT PRODUCTION, 2020–2025 (TONNES)
                    TABLE 24 POULTRY MEAT PRODUCTS MARKET, BY REGION, 2018–2022 (USD MILLION)
                    TABLE 25 POULTRY MEAT PRODUCTS MARKET, BY REGION, 2023–2028 (USD MILLION)
    7.5 OTHER ANIMAL TYPES 
           FIGURE 44 SHEEP MEAT PRODUCTION, 2020–2025 (TONNES)
           TABLE 26 OTHER ANIMAL MEAT PRODUCTS MARKET, BY REGION, 2018–2022 (USD MILLION)
           TABLE 27 OTHER ANIMAL MEAT PRODUCTS MARKET, BY REGION, 2023–2028 (USD MILLION)
 
8 MEAT PRODUCTS MARKET, BY TYPE (Page No. - 105)
    8.1 INTRODUCTION 
           FIGURE 45 MEAT PRODUCTS MARKET, BY TYPE, 2023 VS. 2028 (USD MILLION)
           TABLE 28 MARKET, BY TYPE, 2018–2022 (USD MILLION)
           TABLE 29 MARKET, BY TYPE, 2023–2028 (USD MILLION)
    8.2 PROCESSED 
           8.2.1 INCREASE IN NEED FOR CONVENIENT AND READY-TO-EAT FOOD OPTIONS
                    TABLE 30 PROCESSED MEAT PRODUCTS MARKET, BY REGION, 2018–2022 (USD MILLION)
                    TABLE 31 PROCESSED MEAT PRODUCTS MARKET, BY REGION, 2023–2028 (USD MILLION)
                    TABLE 32 PROCESSED MEAT PRODUCTS MARKET, BY SUBTYPE, 2018–2022 (USD MILLION)
                    TABLE 33 PROCESSED MEAT PRODUCTS MARKET, BY SUBTYPE, 2023–2028 (USD MILLION)
           8.2.2 CURED
                    TABLE 34 CURED MEAT PRODUCTS MARKET, BY REGION, 2018–2022 (USD MILLION)
                    TABLE 35 CURED MEAT PRODUCTS MARKET, BY REGION, 2023–2028 (USD MILLION)
           8.2.3 DRIED
                    TABLE 36 DRIED MEAT PRODUCTS MARKET, BY REGION, 2018–2022 (USD MILLION)
                    TABLE 37 DRIED MEAT PRODUCTS MARKET, BY REGION, 2023–2028 (USD MILLION)
           8.2.4 FERMENTED
                    TABLE 38 FERMENTED MEAT PRODUCTS MARKET, BY REGION, 2018–2022 (USD MILLION)
                    TABLE 39 FERMENTED MEAT PRODUCTS MARKET, BY REGION, 2023–2028 (USD MILLION)
           8.2.5 OTHER PROCESSED MEAT SUBTYPES
                    TABLE 40 OTHER PROCESSED MEAT SUBTYPES MARKET, BY REGION, 2018–2022 (USD MILLION)
                    TABLE 41 OTHER PROCESSED MEAT SUBTYPES MARKET, BY REGION, 2023–2028 (USD MILLION)
    8.3 FROZEN 
           8.3.1 GROWTH IN DEMAND FOR PRESERVING FRESHNESS AND CONVENIENCE OF MINIMAL MEAL PREP
                    TABLE 42 FROZEN MEAT PRODUCTS MARKET, BY REGION, 2018–2022 (USD MILLION)
                    TABLE 43 FROZEN MEAT PRODUCTS MARKET, BY REGION, 2023–2028 (USD MILLION)
    8.4 CANNED 
           8.4.1 CONVENIENCE AND EXTENDED SHELF-LIFE TO FUEL DEMAND FOR CANNED MEAT PRODUCTS
                    TABLE 44 CANNED MEAT PRODUCTS MARKET, BY REGION, 2018–2022 (USD MILLION)
                    TABLE 45 CANNED MEAT PRODUCTS MARKET, BY REGION, 2023–2028 (USD MILLION)
    8.5 CHILLED 
           8.5.1 FRESHNESS, QUALITY, AND EASY AVAILABILITY OF CHILLED PRODUCTS
                    TABLE 46 CHILLED MEAT PRODUCTS MARKET, BY REGION, 2018–2022 (USD MILLION)
                    TABLE 47 CHILLED MEAT PRODUCTS MARKET, BY REGION, 2023–2028 (USD MILLION)
    8.6 FRESH 
           8.6.1 RISE IN HEALTH CONSCIOUSNESS AND DEMAND FOR QUALITY AND TRANSPARENCY
                    TABLE 48 FRESH MEAT PRODUCTS MARKET, BY REGION, 2018–2022 (USD MILLION)
                    TABLE 49 FRESH MEAT PRODUCTS MARKET, BY REGION, 2023–2028 (USD MILLION)
 
9 MEAT PRODUCTS MARKET, BY DISTRIBUTION CHANNEL (Page No. - 118)
    9.1 INTRODUCTION 
           FIGURE 46 MEAT PRODUCTS MARKET, BY DISTRIBUTION CHANNEL, 2023 VS. 2028 (USD MILLION)
           TABLE 50 MEAT PRODUCTS MARKET, BY DISTRIBUTION CHANNEL, 2018–2022 (USD MILLION)
           TABLE 51 MEAT PRODUCTS MARKET, BY DISTRIBUTION CHANNEL, 2023–2028 (USD MILLION)
    9.2 RETAIL (OFFLINE) 
           9.2.1 PREFERRED OWING TO MULTIPLE OPTIONS OFFERED TO CONSUMERS
                    TABLE 52 RETAIL (OFFLINE) DISTRIBUTION MARKET, BY SUBTYPE, 2018–2022 (USD MILLION)
                    TABLE 53 RETAIL (OFFLINE) DISTRIBUTION MARKET, BY SUBTYPE, 2023–2028 (USD MILLION)
                    TABLE 54 RETAIL (OFFLINE) DISTRIBUTION MARKET, BY REGION, 2018–2022 (USD MILLION)
                    TABLE 55 RETAIL (OFFLINE) DISTRIBUTION MARKET, BY REGION, 2023–2028 (USD MILLION)
           9.2.2 SUPERMARKETS/HYPERMARKETS
                    TABLE 56 SUPERMARKET/HYPERMARKET DISTRIBUTION MARKET, BY REGION, 2018–2022 (USD MILLION)
                    TABLE 57 SUPERMARKET/HYPERMARKET DISTRIBUTION MARKET, BY REGION, 2023–2028 (USD MILLION)
           9.2.3 CONVENIENCE STORES
                    TABLE 58 CONVENIENCE STORE DISTRIBUTION MARKET, BY REGION, 2018–2022 (USD MILLION)
                    TABLE 59 CONVENIENCE STORE DISTRIBUTION MARKET, BY REGION, 2023–2028 (USD MILLION)
           9.2.4 OTHER RETAIL CHANNELS
                    TABLE 60 OTHER RETAIL CHANNELS MARKET, BY REGION, 2018–2022 (USD MILLION)
                    TABLE 61 OTHER RETAIL CHANNELS MARKET, BY REGION, 2023–2028 (USD MILLION)
    9.3 FOOD SERVICE 
           9.3.1 CHANGING DIETARY LIFESTYLES AND NEED TO ACCOMMODATE DIETARY RESTRICTIONS
                    TABLE 62 FOOD SERVICE DISTRIBUTION MARKET, BY REGION, 2018–2022 (USD MILLION)
                    TABLE 63 FOOD SERVICE DISTRIBUTION MARKET, BY REGION, 2023–2028 (USD MILLION)
    9.4 ECOMMERCE 
           9.4.1 SALES THROUGH ONLINE STORES OFFER FASTER ACCESSIBILITY AND COST-EFFECTIVENESS
                    TABLE 64 ECOMMERCE DISTRIBUTION MARKET, BY REGION, 2018–2022 (USD MILLION)
                    TABLE 65 ECOMMERCE DISTRIBUTION MARKET, BY REGION, 2023–2028 (USD MILLION)
 
10 MEAT PRODUCTS MARKET, BY NATURE (Page No. - 128)
     10.1 INTRODUCTION 
               FIGURE 47 MEAT PRODUCTS MARKET, BY NATURE, 2023 VS. 2028 (USD MILLION)
               TABLE 66 MEAT PRODUCTS MARKET, BY NATURE, 2018–2022 (USD MILLION)
               TABLE 67 MEAT PRODUCTS MARKET, BY NATURE, 2023–2028 (USD MILLION)
     10.2 CONVENTIONAL 
             10.2.1 GROWTH IN GLOBAL DEMAND FOR PROTEIN SOURCES
                       TABLE 68 CONVENTIONAL MEAT PRODUCTS MARKET, BY REGION, 2018–2022 (USD MILLION)
                       TABLE 69 CONVENTIONAL MEAT PRODUCTS MARKET, BY REGION, 2023–2028 (USD MILLION)
     10.3 ORGANIC 
             10.3.1 RISE IN DEMAND FOR MEAT WITH CLEAN LABELS AND INCREASED TRANSPARENCY REGARDING ORIGIN OF MEAT
                       TABLE 70 ORGANIC MEAT PRODUCTS MARKET, BY REGION, 2018–2022 (USD MILLION)
                       TABLE 71 ORGANIC MEAT PRODUCTS MARKET, BY REGION, 2023–2028 (USD MILLION)
 
11 MEAT PRODUCTS MARKET, BY PACKAGING (Page No. - 133)
     11.1 INTRODUCTION 
     11.2 FRESH MEAT PACKAGING 
             11.2.1 REAL-TIME DATA ON FRESHNESS OF MEAT TO BE DRIVING FORCE
     11.3 VACUUM PACKAGING 
             11.3.1 EXTENDED PERISHABILITY AND PREVENTION OF FREEZER BURN
     11.4 MODIFIED ATMOSPHERE PACKAGING 
             11.4.1 RISE IN NEED TO CURTAIL MEAT OXIDATION AND IMPEDE PROLIFERATION OF MICROORGANISMS
 
12 MEAT PRODUCTS MARKET, BY REGION (Page No. - 135)
     12.1 INTRODUCTION 
               FIGURE 48 GERMANY TO RECORD HIGHEST GROWTH DURING FORECAST PERIOD
               TABLE 72 MEAT PRODUCTS MARKET, BY REGION, 2018–2022 (USD MILLION)
               TABLE 73 MARKET, BY REGION, 2023–2028 (USD MILLION)
               TABLE 74 MARKET, BY REGION, 2018–2022 (MILLION TONNES)
               TABLE 75 MARKET, BY REGION, 2023–2028 (MILLION TONNES)
     12.2 NORTH AMERICA 
             12.2.1 NORTH AMERICA: RECESSION IMPACT ANALYSIS
                       FIGURE 49 NORTH AMERICA: INFLATION RATE, BY KEY COUNTRY, 2017–2022
                       FIGURE 50 NORTH AMERICA: RECESSION IMPACT ANALYSIS SNAPSHOT
                       TABLE 76 NORTH AMERICA: MEAT PRODUCTS MARKET, BY COUNTRY, 2018–2022 (USD MILLION)
                       TABLE 77 NORTH AMERICA: MARKET, BY COUNTRY, 2023–2028 (USD MILLION)
                       TABLE 78 NORTH AMERICA: MARKET, BY COUNTRY, 2018–2022 (MILLION TONNES)
                       TABLE 79 NORTH AMERICA: MARKET, BY COUNTRY, 2023–2028 (MILLION TONNES)
                       TABLE 80 NORTH AMERICA: MARKET, BY ANIMAL TYPE, 2018–2022 (USD MILLION)
                       TABLE 81 NORTH AMERICA: MARKET, BY ANIMAL TYPE, 2023–2028 (USD MILLION)
                       TABLE 82 NORTH AMERICA: MARKET, BY ANIMAL TYPE, 2018–2022 (MILLION TONNES)
                       TABLE 83 NORTH AMERICA: MARKET, BY ANIMAL TYPE, 2023–2028 (MILLION TONNES)
                       TABLE 84 NORTH AMERICA: MARKET, BY TYPE, 2018–2022 (USD MILLION)
                       TABLE 85 NORTH AMERICA: MEAT PRODUCTS MARKET, BY TYPE, 2023–2028 (USD MILLION)
                       TABLE 86 NORTH AMERICA: PROCESSED MEAT PRODUCTS MARKET, BY SUBTYPE, 2018–2022 (USD MILLION)
                       TABLE 87 NORTH AMERICA: PROCESSED MEAT PRODUCTS MARKET, BY SUBTYPE, 2023–2028 (USD MILLION)
                       TABLE 88 NORTH AMERICA: MARKET, BY NATURE, 2018–2022 (USD MILLION)
                       TABLE 89 NORTH AMERICA: MARKET, BY NATURE, 2023–2028 (USD MILLION)
                       TABLE 90 NORTH AMERICA: MARKET, BY DISTRIBUTION CHANNEL, 2018–2022 (USD MILLION)
                       TABLE 91 NORTH AMERICA: MARKET, BY DISTRIBUTION CHANNEL, 2023–2028 (USD MILLION)
                       TABLE 92 NORTH AMERICA: RETAIL (OFFLINE) DISTRIBUTION MARKET, BY SUBTYPE, 2018–2022 (USD MILLION)
                       TABLE 93 NORTH AMERICA: RETAIL (OFFLINE) DISTRIBUTION MARKET, BY SUBTYPE, 2023–2028 (USD MILLION)
             12.2.2 US
                       12.2.2.1 Strategies of prominent companies in poultry market and rise in demand for pork meat
                                   TABLE 94 US: MEAT PRODUCTS MARKET, BY ANIMAL TYPE, 2018–2022 (USD MILLION)
                                   TABLE 95 US: MARKET, BY ANIMAL TYPE, 2023–2028 (USD MILLION)
                                   TABLE 96 US: MARKET, BY ANIMAL TYPE, 2018–2022 (MILLION TONNES)
                                   TABLE 97 US: MARKET, BY ANIMAL TYPE, 2023–2028 (MILLION TONNES)
             12.2.3 CANADA
                       12.2.3.1 Surge in demand for poultry products
                                   TABLE 98 CANADA: MEAT PRODUCTS MARKET, BY ANIMAL TYPE, 2018–2022 (USD MILLION)
                                   TABLE 99 CANADA: MARKET, BY ANIMAL TYPE, 2023–2028 (USD MILLION)
                                   TABLE 100 CANADA: MARKET, BY ANIMAL TYPE, 2018–2022 (MILLION TONNES)
                                   TABLE 101 CANADA: MARKET, BY ANIMAL TYPE, 2023–2028 (MILLION TONNES)
             12.2.4 MEXICO
                       12.2.4.1 Evolving consumer preferences and increasing demand for nutritious meat products
                                   TABLE 102 MEXICO: MEAT PRODUCTS MARKET, BY ANIMAL TYPE, 2018–2022 (USD MILLION)
                                   TABLE 103 MEXICO: MARKET, BY ANIMAL TYPE, 2023–2028 (USD MILLION)
                                   TABLE 104 MEXICO: MARKET, BY ANIMAL TYPE, 2018–2022 (MILLION TONNES)
                                   TABLE 105 MEXICO: MARKET, BY ANIMAL TYPE, 2023–2028 (MILLION TONNES)
     12.3 EUROPE 
               FIGURE 51 EUROPE: REGIONAL SNAPSHOT
             12.3.1 EUROPE: RECESSION IMPACT ANALYSIS
                       FIGURE 52 EUROPE: INFLATION RATE, BY KEY COUNTRY, 2017–2022
                       FIGURE 53 EUROPE: RECESSION IMPACT ANALYSIS SNAPSHOT
                       TABLE 106 EUROPE: MEAT PRODUCTS MARKET, BY COUNTRY, 2018–2022 (USD MILLION)
                       TABLE 107 EUROPE: MARKET, BY COUNTRY, 2023–2028 (USD MILLION)
                       TABLE 108 EUROPE: MARKET, BY COUNTRY, 2018–2022 (MILLION TONNES)
                       TABLE 109 EUROPE: MARKET, BY COUNTRY, 2023–2028 (MILLION TONNES)
                       TABLE 110 EUROPE: MARKET, BY ANIMAL TYPE, 2018–2022 (USD MILLION)
                       TABLE 111 EUROPE: MARKET, BY ANIMAL TYPE, 2023–2028 (USD MILLION)
                       TABLE 112 EUROPE: MARKET, BY ANIMAL TYPE, 2018–2022 (MILLION TONNES)
                       TABLE 113 EUROPE: MARKET, BY ANIMAL TYPE, 2023–2028 (MILLION TONNES)
                       TABLE 114 EUROPE: MARKET, BY TYPE, 2018–2022 (USD MILLION)
                       TABLE 115 EUROPE: MARKET, BY TYPE, 2023–2028 (USD MILLION)
                       TABLE 116 EUROPE: PROCESSED MEAT PRODUCTS MARKET, BY SUBTYPE, 2018–2022 (USD MILLION)
                       TABLE 117 EUROPE: PROCESSED MEAT PRODUCTS MARKET, BY SUBTYPE, 2023–2028 (USD MILLION)
                       TABLE 118 EUROPE: MEAT PRODUCTS MARKET, BY NATURE, 2018–2022 (USD MILLION)
                       TABLE 119 EUROPE: MARKET, BY NATURE, 2023–2028 (USD MILLION)
                       TABLE 120 EUROPE: MARKET, BY DISTRIBUTION CHANNEL, 2018–2022 (USD MILLION)
                       TABLE 121 EUROPE: MARKET, BY DISTRIBUTION CHANNEL, 2023–2028 (USD MILLION)
                       TABLE 122 EUROPE: RETAIL (OFFLINE) DISTRIBUTION MARKET, BY SUBTYPE, 2018–2022 (USD MILLION)
                       TABLE 123 EUROPE: RETAIL (OFFLINE) DISTRIBUTION MARKET, BY SUBTYPE, 2023–2028 (USD MILLION)
             12.3.2 UK
                       12.3.2.1 Increase in number of health-conscious customers
                                   TABLE 124 UK: MEAT PRODUCTS MARKET, BY ANIMAL TYPE, 2018–2022 (USD MILLION)
                                   TABLE 125 UK: MARKET, BY ANIMAL TYPE, 2023–2028 (USD MILLION)
                                   TABLE 126 UK: MARKET, BY ANIMAL TYPE, 2018–2022 (MILLION TONNES)
                                   TABLE 127 UK: MARKET, BY ANIMAL TYPE, 2023–2028 (MILLION TONNES)
             12.3.3 GERMANY
                       12.3.3.1 Surging import values to reflect growing appetite for meat consumption
                                   TABLE 128 GERMANY: MEAT PRODUCTS MARKET, BY ANIMAL TYPE, 2018–2022 (USD MILLION)
                                   TABLE 129 GERMANY: MARKET, BY ANIMAL TYPE, 2023–2028 (USD MILLION)
                                   TABLE 130 GERMANY: MARKET, BY ANIMAL TYPE, 2018–2022 (MILLION TONNES)
                                   TABLE 131 GERMANY: MARKET, BY ANIMAL TYPE, 2023–2028 (MILLION TONNES)
             12.3.4 ITALY
                       12.3.4.1 Rapidly changing consumer preferences toward nutrition and sustenance
                                   TABLE 132 ITALY: MEAT PRODUCTS MARKET, BY ANIMAL TYPE, 2018–2022 (USD MILLION)
                                   TABLE 133 ITALY: MARKET, BY ANIMAL TYPE, 2023–2028 (USD MILLION)
                                   TABLE 134 ITALY: MARKET, BY ANIMAL TYPE, 2018–2022 (MILLION TONNES)
                                   TABLE 135 ITALY: MARKET, BY ANIMAL TYPE, 2023–2028 (MILLION TONNES)
             12.3.5 FRANCE
                       12.3.5.1 Meat-centric cultural traditions and disposable income levels
                                   TABLE 136 FRANCE: MEAT PRODUCTS MARKET, BY ANIMAL TYPE, 2018–2022 (USD MILLION)
                                   TABLE 137 FRANCE: MARKET, BY ANIMAL TYPE, 2023–2028 (USD MILLION)
                                   TABLE 138 FRANCE: MARKET, BY ANIMAL TYPE, 2018–2022 (MILLION TONNES)
                                   TABLE 139 FRANCE: MARKET, BY ANIMAL TYPE, 2023–2028 (MILLION TONNES)
             12.3.6 NETHERLANDS
                       12.3.6.1 Increase in popularity of meat products due to health benefits
                                   TABLE 140 NETHERLANDS: MEAT PRODUCTS MARKET, BY ANIMAL TYPE, 2018–2022 (USD MILLION)
                                   TABLE 141 NETHERLANDS: MARKET, BY ANIMAL TYPE, 2023–2028 (USD MILLION)
                                   TABLE 142 NETHERLANDS: MARKET, BY ANIMAL TYPE, 2018–2022 (MILLION TONNES)
                                   TABLE 143 NETHERLANDS: MARKET, BY ANIMAL TYPE, 2023–2028 (MILLION TONNES)
             12.3.7 SPAIN
                       12.3.7.1 Product innovation and increased consumption of meat-based convenience foods
                                   TABLE 144 SPAIN: MEAT PRODUCTS MARKET, BY ANIMAL TYPE, 2018–2022 (USD MILLION)
                                   TABLE 145 SPAIN: MARKET, BY ANIMAL TYPE, 2023–2028 (USD MILLION)
                                   TABLE 146 SPAIN: MARKET, BY ANIMAL TYPE, 2018–2022 (MILLION TONNES)
                                   TABLE 147 SPAIN: MARKET, BY ANIMAL TYPE, 2023–2028 (MILLION TONNES)
             12.3.8 REST OF EUROPE
                       TABLE 148 REST OF EUROPE: MEAT PRODUCTS MARKET, BY ANIMAL TYPE, 2018–2022 (USD MILLION)
                       TABLE 149 REST OF EUROPE: MARKET, BY ANIMAL TYPE, 2023–2028 (USD MILLION)
                       TABLE 150 REST OF EUROPE: MARKET, BY ANIMAL TYPE, 2018–2022 (MILLION TONNES)
                       TABLE 151 REST OF EUROPE: MARKET, BY ANIMAL TYPE, 2023–2028 (MILLION TONNES)
     12.4 ASIA PACIFIC 
               FIGURE 54 ASIA PACIFIC: REGIONAL SNAPSHOT
             12.4.1 ASIA PACIFIC: RECESSION IMPACT ANALYSIS
                       FIGURE 55 ASIA PACIFIC: INFLATION RATE, BY KEY COUNTRY, 2017–2022
                       FIGURE 56 ASIA PACIFIC: RECESSION IMPACT ANALYSIS SNAPSHOT
                       TABLE 152 ASIA PACIFIC: MEAT PRODUCTS MARKET, BY COUNTRY, 2018–2022 (USD MILLION)
                       TABLE 153 ASIA PACIFIC: MARKET, BY COUNTRY, 2023–2028 (USD MILLION)
                       TABLE 154 ASIA PACIFIC: MARKET, BY COUNTRY, 2018–2022 (MILLION TONNES)
                       TABLE 155 ASIA PACIFIC: MARKET, BY COUNTRY, 2023–2028 (MILLION TONNES)
                       TABLE 156 ASIA PACIFIC: MARKET, BY ANIMAL TYPE, 2018–2022 (USD MILLION)
                       TABLE 157 ASIA PACIFIC: MARKET, BY ANIMAL TYPE, 2023–2028 (USD MILLION)
                       TABLE 158 ASIA PACIFIC: MARKET, BY ANIMAL TYPE, 2018–2022 (MILLION TONNES)
                       TABLE 159 ASIA PACIFIC: MARKET, BY ANIMAL TYPE, 2023–2028 (MILLION TONNES)
                       TABLE 160 ASIA PACIFIC: MARKET, BY TYPE, 2018–2022 (USD MILLION)
                       TABLE 161 ASIA PACIFIC: MARKET, BY TYPE, 2023–2028 (USD MILLION)
                       TABLE 162 ASIA PACIFIC: PROCESSED MEAT PRODUCTS MARKET, BY SUBTYPE, 2018–2022 (USD MILLION)
                       TABLE 163 ASIA PACIFIC: PROCESSED MEAT PRODUCTS MARKET, BY SUBTYPE, 2023–2028 (USD MILLION)
                       TABLE 164 ASIA PACIFIC: MEAT PRODUCTS MARKET, BY NATURE, 2018–2022 (USD MILLION)
                       TABLE 165 ASIA PACIFIC: MEAT PRODUCTS MARKET, BY NATURE, 2023–2028 (USD MILLION)
                       TABLE 166 ASIA PACIFIC: MARKET, BY DISTRIBUTION CHANNEL, 2018–2022 (USD MILLION)
                       TABLE 167 ASIA PACIFIC: MARKET, BY DISTRIBUTION CHANNEL, 2023–2028 (USD MILLION)
                       TABLE 168 ASIA PACIFIC: RETAIL (OFFLINE) DISTRIBUTION MARKET, BY SUBTYPE, 2018–2022 (USD MILLION)
                       TABLE 169 ASIA PACIFIC: RETAIL (OFFLINE) DISTRIBUTION MARKET, BY SUBTYPE, 2023–2028 (USD MILLION)
             12.4.2 CHINA
                       12.4.2.1 Significant increase in meat consumption among urban middle-class population
                                   TABLE 170 CHINA: MEAT PRODUCTS MARKET, BY ANIMAL TYPE, 2018–2022 (USD MILLION)
                                   TABLE 171 CHINA: MARKET, BY ANIMAL TYPE, 2023–2028 (USD MILLION)
                                   TABLE 172 CHINA: MARKET, BY ANIMAL TYPE, 2018–2022 (MILLION TONNES)
                                   TABLE 173 CHINA: MARKET, BY ANIMAL TYPE, 2023–2028 (MILLION TONNES)
             12.4.3 JAPAN
                       12.4.3.1 Gradual shift from seafood to meat and less traditional food among younger population
                                   TABLE 174 JAPAN: MEAT PRODUCTS MARKET, BY ANIMAL TYPE, 2018–2022 (USD MILLION)
                                   TABLE 175 JAPAN: MARKET, BY ANIMAL TYPE, 2023–2028 (USD MILLION)
                                   TABLE 176 JAPAN: MARKET, BY ANIMAL TYPE, 2018–2022 (MILLION TONNES)
                                   TABLE 177 JAPAN: MARKET, BY ANIMAL TYPE, 2023–2028 (MILLION TONNES)
             12.4.4 AUSTRALIA & NEW ZEALAND
                       12.4.4.1 Investments from key players with demand for high-quality meat
                                   TABLE 178 AUSTRALIA & NEW ZEALAND: MEAT PRODUCTS MARKET, BY ANIMAL TYPE, 2018–2022 (USD MILLION)
                                   TABLE 179 AUSTRALIA & NEW ZEALAND: MARKET, BY ANIMAL TYPE, 2023–2028 (USD MILLION)
                                   TABLE 180 AUSTRALIA & NEW ZEALAND: MARKET, BY ANIMAL TYPE, 2018–2022 (MILLION TONNES)
                                   TABLE 181 AUSTRALIA & NEW ZEALAND: MARKET, BY ANIMAL TYPE, 2023–2028 (MILLION TONNES)
             12.4.5 INDIA
                       12.4.5.1 Economic growth to bolster demand for processed meat products
                                   FIGURE 57 INDIA: MEAT PRODUCTION, 2011–2020 (MILLION TONNES)
                                   TABLE 182 INDIA: MEAT PRODUCTS MARKET, BY ANIMAL TYPE, 2018–2022 (USD MILLION)
                                   TABLE 183 INDIA: MARKET, BY ANIMAL TYPE, 2023–2028 (USD MILLION)
                                   TABLE 184 INDIA: MARKET, BY ANIMAL TYPE, 2018–2022 (MILLION TONNES)
                                   TABLE 185 INDIA: MARKET, BY ANIMAL TYPE, 2023–2028 (MILLION TONNES)
             12.4.6 REST OF ASIA PACIFIC
                       TABLE 186 REST OF ASIA PACIFIC: MEAT PRODUCTS MARKET, BY ANIMAL TYPE, 2018–2022 (USD MILLION)
                       TABLE 187 REST OF ASIA PACIFIC: MARKET, BY ANIMAL TYPE, 2023–2028 (USD MILLION)
                       TABLE 188 REST OF ASIA PACIFIC: MARKET, BY ANIMAL TYPE, 2018–2022 (MILLION TONNES)
                       TABLE 189 REST OF ASIA PACIFIC: MARKET, BY ANIMAL TYPE, 2023–2028 (MILLION TONNES)
     12.5 SOUTH AMERICA 
             12.5.1 SOUTH AMERICA: RECESSION IMPACT ANALYSIS
                       FIGURE 58 SOUTH AMERICA: INFLATION RATE, BY KEY COUNTRY, 2017–2022
                       FIGURE 59 SOUTH AMERICA: RECESSION IMPACT ANALYSIS SNAPSHOT
                       TABLE 190 SOUTH AMERICA: MEAT PRODUCTS MARKET, BY COUNTRY, 2018–2022 (USD MILLION)
                       TABLE 191 SOUTH AMERICA: MARKET, BY COUNTRY, 2023–2028 (USD MILLION)
                       TABLE 192 SOUTH AMERICA: MARKET, BY COUNTRY, 2018–2022 (MILLION TONNES)
                       TABLE 193 SOUTH AMERICA: MARKET, BY COUNTRY, 2023–2028 (MILLION TONNES)
                       TABLE 194 SOUTH AMERICA: MARKET, BY ANIMAL TYPE, 2018–2022 (USD MILLION)
                       TABLE 195 SOUTH AMERICA: MARKET, BY ANIMAL TYPE, 2023–2028 (USD MILLION)
                       TABLE 196 SOUTH AMERICA: MARKET, BY ANIMAL TYPE, 2018–2022 (MILLION TONNES)
                       TABLE 197 SOUTH AMERICA: MARKET, BY ANIMAL TYPE, 2023–2028 (MILLION TONNES)
                       TABLE 198 SOUTH AMERICA: MARKET, BY TYPE, 2018–2022 (USD MILLION)
                       TABLE 199 SOUTH AMERICA: MARKET, BY TYPE, 2023–2028 (USD MILLION)
                       TABLE 200 SOUTH AMERICA: PROCESSED MEAT PRODUCTS MARKET, BY SUBTYPE, 2018–2022 (USD MILLION)
                       TABLE 201 SOUTH AMERICA: PROCESSED MEAT PRODUCTS MARKET, BY SUBTYPE, 2023–2028 (USD MILLION)
                       TABLE 202 SOUTH AMERICA: MARKET, BY NATURE, 2018–2022 (USD MILLION)
                       TABLE 203 SOUTH AMERICA: MARKET, BY NATURE, 2023–2028 (USD MILLION)
                       TABLE 204 SOUTH AMERICA: MARKET, BY DISTRIBUTION CHANNEL, 2018–2022 (USD MILLION)
                       TABLE 205 SOUTH AMERICA: MARKET, BY DISTRIBUTION CHANNEL, 2023–2028 (USD MILLION)
                       TABLE 206 SOUTH AMERICA: RETAIL (OFFLINE) DISTRIBUTION MARKET, BY SUBTYPE, 2018–2022 (USD MILLION)
                       TABLE 207 SOUTH AMERICA: RETAIL (OFFLINE) DISTRIBUTION MARKET, BY SUBTYPE, 2023–2028 (USD MILLION)
             12.5.2 BRAZIL
                       12.5.2.1 High production, export, and adoption of meat food products
                                   TABLE 208 BRAZIL: ANIMAL TYPE MARKET, BY ANIMAL TYPE, 2018–2022 (USD MILLION)
                                   TABLE 209 BRAZIL: MEAT PRODUCTS MARKET, BY ANIMAL TYPE, 2023–2028 (USD MILLION)
                                   TABLE 210 BRAZIL: MARKET, BY ANIMAL TYPE, 2018–2022 (MILLION TONNES)
                                   TABLE 211 BRAZIL: MARKET, BY ANIMAL TYPE, 2023–2028 (MILLION TONNES)
             12.5.3 ARGENTINA
                       12.5.3.1 Economic prosperity, export opportunities, and shifting dietary preferences
                                   TABLE 212 ARGENTINA: MEAT PRODUCTS MARKET, BY ANIMAL TYPE, 2018–2022 (USD MILLION)
                                   TABLE 213 ARGENTINA: MARKET, BY ANIMAL TYPE, 2023–2028 (USD MILLION)
                                   TABLE 214 ARGENTINA: MARKET, BY ANIMAL TYPE, 2018–2022 (MILLION TONNES)
                                   TABLE 215 ARGENTINA: MARKET, BY ANIMAL TYPE, 2023–2028 (MILLION TONNES)
             12.5.4 REST OF SOUTH AMERICA
                       TABLE 216 REST OF SOUTH AMERICA: MEAT PRODUCTS MARKET, BY ANIMAL TYPE, 2018–2022 (USD MILLION)
                       TABLE 217 REST OF SOUTH AMERICA: MEAT PRODUCTS MARKET, BY ANIMAL TYPE, 2023–2028 (USD MILLION)
                       TABLE 218 REST OF SOUTH AMERICA: MARKET, BY ANIMAL TYPE, 2018–2022 (MILLION TONNES)
                       TABLE 219 REST OF SOUTH AMERICA: MARKET, BY ANIMAL TYPE, 2023–2028 (MILLION TONNES)
     12.6 REST OF THE WORLD (ROW) 
             12.6.1 ROW: RECESSION IMPACT ANALYSIS
                       FIGURE 60 ROW: INFLATION RATE, BY KEY REGION, 2017–2022
                       FIGURE 61 ROW: RECESSION IMPACT ANALYSIS SNAPSHOT
                       TABLE 220 ROW: MEAT PRODUCTS MARKET, BY REGION, 2018–2022 (USD MILLION)
                       TABLE 221 ROW: MARKET, BY REGION, 2023–2028 (USD MILLION)
                       TABLE 222 ROW: MARKET, BY REGION, 2018–2022 (MILLION TONNES)
                       TABLE 223 ROW: MARKET, BY REGION, 2023–2028 (MILLION TONNES)
                       TABLE 224 ROW: MARKET, BY ANIMAL TYPE, 2018–2022 (USD MILLION)
                       TABLE 225 ROW: MARKET, BY ANIMAL TYPE, 2023–2028 (USD MILLION)
                       TABLE 226 ROW: MARKET, BY ANIMAL TYPE, 2018–2022 (MILLION TONNES)
                       TABLE 227 ROW: MARKET, BY ANIMAL TYPE, 2023–2028 (MILLION TONNES)
                       TABLE 228 ROW: MARKET, BY TYPE, 2018–2022 (USD MILLION)
                       TABLE 229 ROW: MARKET, BY TYPE, 2023–2028 (USD MILLION)
                       TABLE 230 ROW: PROCESSED MEAT PRODUCTS MARKET, BY SUBTYPE, 2018–2022 (USD MILLION)
                       TABLE 231 ROW: PROCESSED MEAT PRODUCTS MARKET, BY SUBTYPE, 2023–2028 (USD MILLION)
                       TABLE 232 ROW: MARKET, BY NATURE, 2018–2022 (USD MILLION)
                       TABLE 233 ROW: MEAT PRODUCTS MARKET, BY NATURE, 2023–2028 (USD MILLION)
                       TABLE 234 ROW: MARKET, BY DISTRIBUTION CHANNEL, 2018–2022 (USD MILLION)
                       TABLE 235 ROW: MARKET, BY DISTRIBUTION CHANNEL, 2023–2028 (USD MILLION)
                       TABLE 236 ROW: RETAIL (OFFLINE) DISTRIBUTION MARKET, BY SUBTYPE, 2018–2022 (USD MILLION)
                       TABLE 237 ROW: RETAIL (OFFLINE) DISTRIBUTION MARKET, BY SUBTYPE, 2023–2028 (USD MILLION)
             12.6.2 AFRICA
                       12.6.2.1 Rise in consumer awareness regarding health benefits of meat products
                                   TABLE 238 AFRICA: MEAT PRODUCTS MARKET, BY ANIMAL TYPE, 2018–2022 (USD MILLION)
                                   TABLE 239 AFRICA: MARKET, BY ANIMAL TYPE, 2023–2028 (USD MILLION)
                                   TABLE 240 AFRICA: MARKET, BY ANIMAL TYPE, 2018–2022 (MILLION TONNES)
                                   TABLE 241 AFRICA: MARKET, BY ANIMAL TYPE, 2023–2028 (MILLION TONNES)
             12.6.3 MIDDLE EAST
                       12.6.3.1 Rise in demand for fresh meat products
                                   TABLE 242 MIDDLE EAST: MEAT PRODUCTS MARKET, BY ANIMAL TYPE, 2018–2022 (USD MILLION)
                                   TABLE 243 MIDDLE EAST: MARKET, BY ANIMAL TYPE, 2023–2028 (USD MILLION)
                                   TABLE 244 MIDDLE EAST: MARKET, BY ANIMAL TYPE, 2018–2022 (MILLION TONNES)
                                   TABLE 245 MIDDLE EAST: MARKET, BY ANIMAL TYPE, 2023–2028 (MILLION TONNES)
 
13 COMPETITIVE LANDSCAPE (Page No. - 212)
     13.1 OVERVIEW 
     13.2 MARKET SHARE ANALYSIS 
               TABLE 246 MEAT PRODUCTS MARKET: DEGREE OF COMPETITION, 2022
     13.3 KEY PLAYER STRATEGIES/RIGHT TO WIN 
               TABLE 247 STRATEGIES ADOPTED BY KEY PLAYERS
     13.4 REVENUE ANALYSIS 
               FIGURE 62 HISTORICAL REVENUE ANALYSIS OF KEY PLAYERS, 2018–2022 (USD BILLION)
     13.5 KEY PLAYER ANNUAL REVENUE VS. GROWTH 
               FIGURE 63 ANNUAL REVENUE, 2022 (USD BILLION) VS. REVENUE GROWTH, 2020–2022
     13.6 KEY PLAYERS EBIT/EBITDA 
               FIGURE 64 EBITDA, 2022 (USD BILLION)
     13.7 GLOBAL SNAPSHOT OF KEY MARKET PARTICIPANTS 
               FIGURE 65 GLOBAL SNAPSHOT OF KEY MARKET PARTICIPANTS, 2022
     13.8 COMPANY EVALUATION MATRIX (KEY PLAYERS) 
             13.8.1 STARS
             13.8.2 EMERGING LEADERS
             13.8.3 PERVASIVE PLAYERS
             13.8.4 PARTICIPANTS
                       FIGURE 66 COMPANY EVALUATION MATRIX (KEY PLAYERS), 2022
             13.8.5 COMPANY FOOTPRINT
                       TABLE 248 COMPANY FOOTPRINT, BY SOURCE
                       TABLE 249 COMPANY FOOTPRINT, BY TYPE
                       TABLE 250 COMPANY FOOTPRINT, BY DISTRIBUTION CHANNEL
                       TABLE 251 COMPANY FOOTPRINT, BY REGION
                       TABLE 252 OVERALL COMPANY FOOTPRINT
     13.9 STARTUP/SME EVALUATION MATRIX 
             13.9.1 PROGRESSIVE COMPANIES
             13.9.2 RESPONSIVE COMPANIES
             13.9.3 DYNAMIC COMPANIES
             13.9.4 STARTING BLOCKS
                       FIGURE 67 STARTUP/SME EVALUATION MATRIX, 2022
             13.9.5 COMPETITIVE BENCHMARKING
                       TABLE 253 MEAT PRODUCTS MARKET: DETAILED LIST OF KEY STARTUPS/SMES
                       TABLE 254 MEAT PRODUCTS MARKET: COMPETITIVE BENCHMARKING OF STARTUPS/SMES SOURCE
     13.1 COMPETITIVE SCENARIO 
               13.10.1 NEW PRODUCT LAUNCHES
                       TABLE 255 MEAT PRODUCTS MARKET: NEW PRODUCT LAUNCHES, 2019–2023
               13.10.2 DEALS
                       TABLE 256 MEAT PRODUCTS MARKET: DEALS, 2019–2023
               13.10.3 OTHERS
                       TABLE 257 MEAT PRODUCTS MARKET: OTHERS, 2019–2023
 
14 COMPANY PROFILES (Page No. - 235)
(Business overview, Products/Services/Solutions offered, Recent developments & MnM View)*
     14.1 KEY PLAYERS 
             14.1.1 CARGILL, INCORPORATED
                       TABLE 258 CARGILL, INCORPORATED: BUSINESS OVERVIEW
                       FIGURE 68 CARGILL, INCORPORATED: COMPANY SNAPSHOT
                       TABLE 259 CARGILL, INCORPORATED: PRODUCTS/SOLUTIONS/SERVICES OFFERED
                       TABLE 260 CARGILL, INCORPORATED: NEW PRODUCT LAUNCHES
                       TABLE 261 CARGILL, INCORPORATED: DEALS
             14.1.2 JBS SA
                       TABLE 262 JBS SA: BUSINESS OVERVIEW
                       FIGURE 69 JBS SA: COMPANY SNAPSHOT
                       FIGURE 70 REVENUE OF BRANDS, 2022 (USD BILLION)
                       TABLE 263 JBS SA: PRODUCTS/SOLUTIONS/SERVICES OFFERED
                       TABLE 264 JBS SA: DEALS
             14.1.3 TYSON FOODS, INC.
                       TABLE 265 TYSON FOODS, INC.: BUSINESS OVERVIEW
                       FIGURE 71 TYSON FOODS, INC.: COMPANY SNAPSHOT
                       TABLE 266 TYSON FOODS INC.: PRODUCTS/SOLUTIONS/SERVICES OFFERED
                       TABLE 267 TYSON FOODS INC.: DEALS
             14.1.4 HORMEL FOODS CORPORATION
                       TABLE 268 HORMEL FOODS CORPORATION: BUSINESS OVERVIEW
                       FIGURE 72 HORMEL FOODS CORPORATION: COMPANY SNAPSHOT
                       TABLE 269 HORMEL FOODS CORPORATION: PRODUCTS/SOLUTIONS/SERVICES OFFERED
                       TABLE 270 HORMEL FOODS CORPORATION: NEW PRODUCT LAUNCHES
                       TABLE 271 HORMEL FOODS CORPORATION: DEALS
             14.1.5 VION GROUP
                       TABLE 272 VION GROUP: BUSINESS OVERVIEW
                       FIGURE 73 VION GROUP: COMPANY SNAPSHOT
                       TABLE 273 VION GROUP: PRODUCTS/SOLUTIONS/SERVICES OFFERED
                       TABLE 274 VION GROUP: DEALS
                       TABLE 275 VION GROUP: OTHERS
             14.1.6 MAPLE LEAF FOODS
                       TABLE 276 MAPLE LEAF FOODS.: BUSINESS OVERVIEW
                       FIGURE 74 MAPLE LEAF FOODS.: COMPANY SNAPSHOT
                       TABLE 277 MAPLE LEAF FOODS.: PRODUCTS/SOLUTIONS/SERVICES OFFERED
                       TABLE 278 MAPLE LEAF FOODS: OTHERS
             14.1.7 DANISH CROWN VEJ
                       TABLE 279 DANISH CROWN VEJ: BUSINESS OVERVIEW
                       FIGURE 75 DANISH CROWN VEJ: COMPANY SNAPSHOT
                       TABLE 280 DANISH CROWN VEJ: PRODUCTS/SOLUTIONS/SERVICES OFFERED
                       TABLE 281 DANISH CROWN VEJ: DEALS
                       TABLE 282 DANISH CROWN VEJ: OTHERS
             14.1.8 MARFRIG GLOBAL FOODS S.A.
                       TABLE 283 MARFRIG GLOBAL FOODS S.A.: BUSINESS OVERVIEW
                       FIGURE 76 MARFRIG GLOBAL FOODS S.A.: COMPANY SNAPSHOT
                       TABLE 284 MARFRIG GLOBAL FOODS S.A.: PRODUCTS/SOLUTIONS/SERVICES OFFERED
                       TABLE 285 MARFRIG GLOBAL FOODS S.A.: DEALS
             14.1.9 ASSOCIATED BRITISH FOODS PLC
                       TABLE 286 ASSOCIATED BRITISH FOODS PLC: BUSINESS OVERVIEW
                       FIGURE 77 ASSOCIATED BRITISH FOODS PLC: COMPANY SNAPSHOT
                       TABLE 287 ASSOCIATED BRITISH FOODS PLC: PRODUCTS/SOLUTIONS/SERVICES OFFERED
             14.1.10 CREMONINI S.P.A
                       TABLE 288 CREMONINI S.P.A.: BUSINESS OVERVIEW
                       FIGURE 78 CREMONINI S.P.A.: COMPANY SNAPSHOT
                       TABLE 289 CREMONINI S.P.A.: PRODUCTS/SOLUTIONS/SERVICES OFFERED
             14.1.11 MINERVA FOODS SA
                       TABLE 290 MINERVA FOODS SA: BUSINESS OVERVIEW
                       FIGURE 79 MINERVA FOODS SA: COMPANY SNAPSHOT
                       TABLE 291 MINERVA FOODS SA: PRODUCTS/SOLUTIONS/SERVICES OFFERED
                       TABLE 292 MINERVA FOODS SA: DEALS
             14.1.12 VOUDOURIS-KONSTAS SA
                       TABLE 293 VOUDOURIS-KONSTAS SA: BUSINESS OVERVIEW
                       TABLE 294 VOUDOURIS-KONSTAS SA: PRODUCTS/SOLUTIONS/SERVICES OFFERED
             14.1.13 RESOURCE AGRIBUSINESS GROUP
                       TABLE 295 RESOURCE AGRIBUSINESS GROUP: BUSINESS OVERVIEW
                       TABLE 296 RESOURCE AGRIBUSINESS GROUP: PRODUCTS/SOLUTIONS/SERVICES OFFERED
                       TABLE 297 RESOURCE AGRIBUSINESS GROUP: OTHERS
             14.1.14 PLUKON FOOD GROUP
                       TABLE 298 PLUKON FOOD GROUP: BUSINESS OVERVIEW
                       TABLE 299 PLUKON FOOD GROUP: PRODUCTS/SOLUTIONS/SERVICES OFFERED
                       TABLE 300 PLUKON FOOD GROUP: DEALS
             14.1.15 BAIADA
                       TABLE 301 BAIADA: BUSINESS OVERVIEW
                       TABLE 302 BAIADA: PRODUCTS/SOLUTIONS/SERVICES OFFERED
     14.2 OTHER PLAYERS 
             14.2.1 SLOGA PROM
                       TABLE 303 SLOGA PROM: BUSINESS OVERVIEW
                       TABLE 304 SLOGA PROM: PRODUCTS/SOLUTIONS/SERVICES OFFERED
             14.2.2 UW PROVISION COMPANY
                       TABLE 305 UW PROVISION COMPANY: BUSINESS OVERVIEW
                       TABLE 306 UW PROVISION COMPANY: PRODUCTS/SOLUTIONS/SERVICES OFFERED
             14.2.3 NOEL ALIMENTARIA, S.A.U.
                       TABLE 307 NOEL ALIMENTARIA, S.A.U: BUSINESS OVERVIEW
                       TABLE 308 NOEL ALIMENTARIA, S.A.U: PRODUCTS/SOLUTIONS/SERVICES OFFERED
             14.2.4 MB SPECIALTIES
                       TABLE 309 MB SPECIALTIES: BUSINESS OVERVIEW
                       TABLE 310 MB SPECIALTIES: PRODUCTS/SOLUTIONS/SERVICES OFFERED
             14.2.5 KREATA MAKEDONIAS
                       TABLE 311 KREATA MAKEDONIAS: BUSINESS OVERVIEW
                       TABLE 312 KREATA MAKEDONIAS: PRODUCTS/SOLUTIONS/SERVICES OFFERED
             14.2.6 VERDE FARMS
             14.2.7 YMF GLOBAL
             14.2.8 R. WHITTINGHAM & SONS MEAT CO.
             14.2.9 LOPEZ FOODS, INC
             14.2.10 ALLEN HARIM
*Details on Business overview, Products/Services/Solutions offered, Recent developments & MnM View might not be captured in case of unlisted companies.
 
15 ADJACENT AND RELATED MARKETS (Page No. - 294)
     15.1 INTRODUCTION 
               TABLE 313 ADJACENT MARKETS TO MEAT PRODUCTS MARKET
     15.2 LIMITATIONS 
     15.3 PLANT-BASED MEAT MARKET 
             15.3.1 MARKET DEFINITION
             15.3.2 MARKET OVERVIEW
             15.3.3 PLANT-BASED MEAT MARKET, BY SOURCE
                       TABLE 314 PLANT-BASED MEAT MARKET, BY SOURCE 2019–2021 (USD MILLION)
                       TABLE 315 PLANT-BASED MEAT MARKET, BY SOURCE, 2022–2027 (USD MILLION)
     15.4 CULTURED MEAT MARKET 
             15.4.1 MARKET DEFINITION
             15.4.2 MARKET OVERVIEW
             15.4.3 CULTURED MEAT MARKET, BY SOURCE
                       TABLE 316 CULTURED MEAT MARKET, BY SOURCE, 2023–2034 (USD MILLION)
 
16 APPENDIX (Page No. - 298)
     16.1 DISCUSSION GUIDE 
     16.2 KNOWLEDGESTORE: MARKETSANDMARKETS’ SUBSCRIPTION PORTAL 
     16.3 CUSTOMIZATION OPTIONS 
     16.4 RELATED REPORTS 
     16.5 AUTHOR DETAILS 

The study involved three major segments in estimating the current size of the meat products market. Exhaustive secondary research was done to collect information on the market, peer, and parent markets. The next step was to validate these findings, assumptions, and sizing with industry experts across the value chain through primary research. Both top-down and bottom-up approaches were employed to estimate the complete market size. After that, market breakdown and data triangulation were used to estimate the market size of segments and subsegments.

Secondary Research

This research study involved the extensive use of secondary sources—directories and databases such as Bloomberg Businessweek and Factiva—to identify and collect information useful for a technical, market-oriented, and commercial study of the meat products market.

In the secondary research process, various sources such as annual reports, press releases & investor presentations of companies, white papers, food journals, certified publications, articles from recognized authors, gold & silver standard websites, directories, and databases, were referred to identify and collect information. This research study involved the extensive use of secondary sources—directories and databases such as Bloomberg Businessweek and Factiva—to identify and collect information useful for a technical, market-oriented, and commercial study of the meat products market.

Secondary research was mainly used to obtain key information about the industry’s supply chain, the total pool of key players, and market classification and segmentation as per the industry trends to the bottom-most level, regional markets, and key developments from both market- and technology-oriented perspectives.

Primary Research

Extensive primary research was conducted after obtaining information regarding the meat products market scenario through secondary research. Several primary interviews were conducted with market experts from both the demand and supply sides across major countries of North America, Europe, Asia Pacific, South America, and the Rest of the World. Primary data was collected through questionnaires, emails, and telephonic interviews. The primary sources from the supply side included various industry experts, such as Chief X Officers (CXOs), Vice Presidents (VPs), Directors, from business development, marketing, research, and development teams, and related key executives from distributors, and key opinion leaders. Primary interviews were conducted to gather insights such as market statistics, data on revenue collected from the products and services, market breakdowns, market size estimations, market forecasting, and data triangulation. Primary research also helped in understanding the various trends related to meat products, animal type, type, distribution channel, nature, packaging and region. Stakeholders from the demand side, such as meat companies who manufacture the raw meat products were interviewed to understand the buyer’s perspective on the suppliers, products, and their current usage of meat products and the outlook of their business which will affect the overall market.
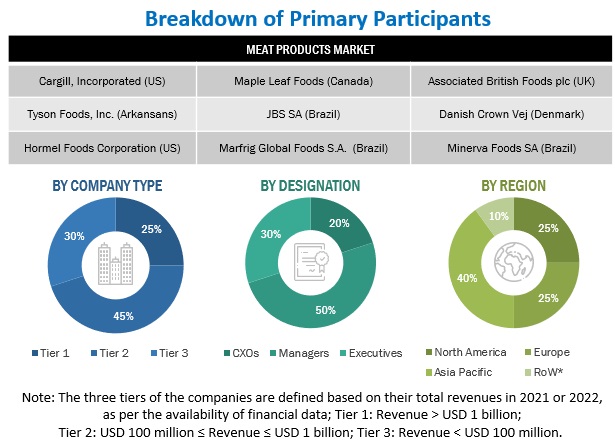
Meat Products Market Size, and Share

To know about the assumptions considered for the study, download the pdf brochure

COMPANY NAME

designation

Cargill (US)

General Manager

Tyson Foods, Inc. (Arkansans)

Sales Manager

Hormel Foods Corporation (US)

Manager

Maple Leaf Foods (Canada)

Head of processing department

JBS SA (Brazil)

Marketing Manager

Marfrig Global Foods S.A.  (Brazil)

Sales Executive

Associated British Foods plc (UK)

Head - Research & Development 

Danish Crown Vej (Denmark)

Senior Engineering Manager 

Minerva Foods SA (Brazil)

Manager

Vion Group (Netherlands)

R&D, QC and production  Expert

Meat Products Market Size Estimation

Both the top-down and bottom-up approaches were used to estimate and validate the total size of the meat products market. These approaches were also used extensively to determine the size of various subsegments in the market. The research methodology used to estimate the market size includes the following details:

  • The key players in the industry and the overall markets were identified through extensive secondary research.
  • All shares, splits, and breakdowns were determined using secondary sources and verified through primary sources.
  • All possible parameters that affect the market covered in this research study were accounted for, viewed in extensive detail, verified through primary research, and analyzed to obtain final quantitative and qualitative data.
  • The research included the study of reports, reviews, and newsletters of top market players, along with extensive interviews for opinions from leaders, such as CEOs, directors, and marketing executives.

Global Meat Products Market: Bottom-Up Approach
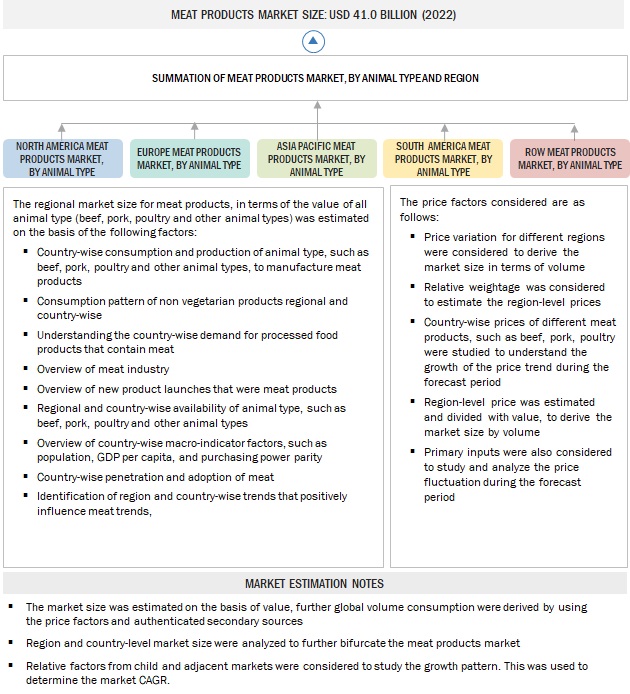
Meat Products Market Size, and Share

To know about the assumptions considered for the study, Request for Free Sample Report

Global Meat Products Market: Top-Down Approach
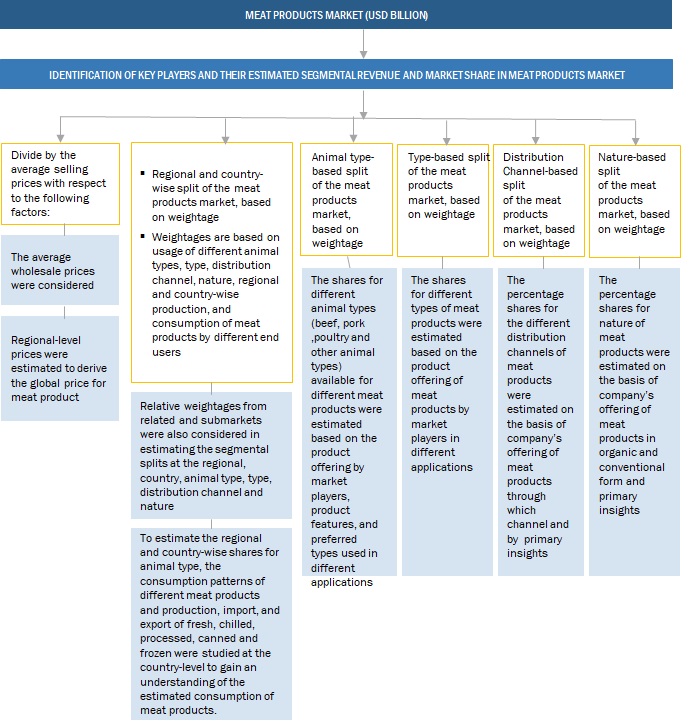
Meat Products Market Size, and Share

Data Triangulation

After arriving at the overall market size from the estimation process explained above, the total market was split into several segments and subsegments. Data triangulation and market breakdown procedures were employed to estimate the meat products market and arrive at the exact statistics for all segments and subsegments. The data was triangulated by studying numerous factors and trends from the demand and supply sides. The market size was also validated using both the top-down and bottom-up approaches.

Market Definition

  • According to the Food Safety and Standards Authority of India (FSSAI), “Meat Food Products’ means any article of food, or any article intended for, or capable of, being used as a food which is derived or prepared from meat by means of drying, curing, smoking, cooking, seasoning, flavouring.”
  • According to the American Meat Science Association, “meat is a skeletal muscle and associated tissues derived from mammals as well as avian and aquatic species.”
  • The meat products market is characterized by a diverse array of animal types, including beef, pork, poultry, lamb, and goat, each contributing distinct flavors to culinary offerings. Traditional staples like beef and pork remain popular, while poultry caters to the demand for leaner options. This dynamic landscape ensures that consumers can choose from a wide range of meat products, meeting traditional preferences and accommodating evolving dietary trends.

Key Stakeholders

  • Raw Meat Suppliers and Manufacturers
  • Meat Products Importers and Exporters
  • Meat Products Traders and Distributors
  • Government and Research Organizations
  • Meat Manufacturing Companies
  • Associations and Industrial Bodies
  • Manufacturers and suppliers related to meat and the meat products industry.
  • Concerned government authorities, commercial R&D institutions, and other regulatory bodies.
  • Regulatory bodies such as
    • US Food and Drug Administration (FDA)
    • European Commission (EC)
    • United States Department of Agriculture (USDA)
    • Commercial research & development (R&D) institutions and financial institutions
    • Food and Agriculture Organization (FAO)
    • Intermediary suppliers such as wholesalers and dealers

Report Objectives

  • To determine and project the size of the meat products market with respect to the animal type, type, distribution channel, nature, packaging (qualitative), end users (qualitative), and region in terms of value and volume over five years, ranging from 2023 to 2028.
  • To identify the attractive opportunities in the market by determining the largest and fastest-growing segments across regions
  • To provide detailed information about the key factors influencing market growth (drivers, restraints, opportunities, and challenges)
  • To analyze the opportunities in the market for stakeholders and provide details of the competitive landscape for market leaders.
  • To analyze the micro-markets with respect to individual growth trends, prospects, and their contribution to the total market.
  • To identify and profile the key players in the meat products market.
  • To understand the competitive landscape and identify the major growth strategies adopted by players across the key regions.
  • To provide insights on key product innovations and investments in the meat products market.

Available Customizations

With the given market data, MarketsandMarkets offers customizations according to company-specific scientific needs.

The following customization options are available for the report:

Product Analysis

  • Product Matrix, which gives a detailed comparison of the product portfolio of each company.

Geographic Analysis

With the given market data, MarketsandMarkets offers customizations according to company-specific scientific needs.

  • Further breakdown of the European region by Rest of the European countries.
  • Further breakdown of the Rest of Asia Pacific meat products market into Indonesia, Malaysia, Pakistan, Philippines, Thailand, Vietnam, and South Korea.

Company Information

    • Detailed analyses and profiling of additional market players (up to five)
Custom Market Research Services

We will customize the research for you, in case the report listed above does not meet with your exact requirements. Our custom research will comprehensively cover the business information you require to help you arrive at strategic and profitable business decisions.

Request Customization
Report Code
FB 8867
Published ON
Nov, 2023
Choose License Type
BUY NOW
  • SHARE
X
Request Customization
Speak to Analyst
Speak to Analyst
OR FACE-TO-FACE MEETING
PERSONALIZE THIS RESEARCH
  • Triangulate with your Own Data
  • Get Data as per your Format and Definition
  • Gain a Deeper Dive on a Specific Application, Geography, Customer or Competitor
  • Any level of Personalization
REQUEST A FREE CUSTOMIZATION
LET US HELP YOU!
  • What are the Known and Unknown Adjacencies Impacting the Meat Products Market
  • What will your New Revenue Sources be?
  • Who will be your Top Customer; what will make them switch?
  • Defend your Market Share or Win Competitors
  • Get a Scorecard for Target Partners
CUSTOMIZED WORKSHOP REQUEST
  • Call Us
  • +1-888-600-6441 (Corporate office hours)
  • +1-888-600-6441 (US/Can toll free)
  • +44-800-368-9399 (UK office hours)
CONNECT WITH US
ABOUT TRUST ONLINE
©2024 MarketsandMarkets Research Private Ltd. All rights reserved
DMCA.com Protection Status Website Feedback