Medical Foam Market

Medical Foam Market by Form (Flexible, Rigid, Spray), Material (Polymers, Latex, Metals), Application (Bedding & Cushioning, Packaging, Devices & Components, Prosthetics & Wound Care, Swabs, Filters, Wipes) and Region - Global Forecast to 2028

Report Code: CH 4777 Dec, 2023, by marketsandmarkets.com

The medical foam market is projected to grow from USD 33.0 billion in 2023 to USD 43.3 billion by 2028, at a CAGR of 5.6% from 2023 to 2028. The medical foam market has observed stable growth throughout the study period and is expected to continue with the same trend during the forecast period. The key factors driving the growth of this market are the increase in the aging population, a rise in global healthcare expenditure, growth of the implantable devices sector, and a shift from traditional to advanced wound care products.

Attractive Opportunities in the Medical Foam Market

Medical Foam Market

To know about the assumptions considered for the study, Request for Free Sample Report

Medical Foam Market

Market Dynamics:

Driver: Increase in aging population

As per the World Population Prospects of 2020, the population aged 65 and above is projected to surge by 16% by 2050, a significant increase from the 9% recorded in 2020. In regions like Europe and North America, it’s estimated that 1 in every 4 individuals will be 65 years or older. At the same time, the number of those aged 80 or above is forecasted to triple from 143 million in 2019 to 426 million by 2050. Individuals in these age brackets are more susceptible to pressure ulcers, often triggered by the continuous pressure from rigid surfaces like beds or wheelchairs, compounded by involuntary muscle movements like spasms. This prolonged pressure can lead to skin breakdown. Consequently, there’s a growing need for softer bedding, cushioning, and padding to offer essential support and comfort, thus propelling the demand for medical foam. Moreover, the aging population forms a significant consumer base for various medical devices, including aids for arthritis, hot and cold pads, powered wheelchairs, respiratory devices, and more. This substantial consumption of medical devices by older people is anticipated to drive the increasing market demand for medical foam.

Restraint: Fluctuations in raw material prices

The pricing of raw materials pivotal for medical foam production can be volatile due to shifts in oil prices (particularly for petroleum-based foam) and various factors influencing material sourcing and manufacturing. The cost structure of these products hinges on the pricing and accessibility of raw materials. Critical ingredients utilized in polymer foam fabrication, such as benzene, toluene, polyol, and phosgene, are crucial constituents. Benzene and toluene, derived from crude oil, directly impact the prices of methylene diphenyl diisocyanate (MDI) and toluene diisocyanate (TDI) when oil prices surge. The specialized nature of medical foam creation demands precision and adherence to stringent quality standards, often elevating production expenses. These heightened manufacturing costs can subsequently be reflected in the final pricing of foam-based medical items, increasing their cost.

Synthetic latex foam, essential in manufacturing bedding and cushioning products, also traces its origins to crude oil derivatives. Likewise, polyurethane foam, widely employed in medical foam production, relies on toluene diisocyanate, methyl di-p-phenylene, and polymeric isocyanate, all linked to petroleum-based sources, thereby being susceptible to price fluctuations. Healthcare providers and institutions, often keenly attuned to costs, face challenges in embracing advanced foam technologies, especially in regions or healthcare systems where cost-effectiveness significantly influences procurement decisions. This sensitivity to pricing poses a hurdle to the widespread adoption and market penetration of sophisticated foam technologies in the medical realm.

Opportunity: Rise in demand for sustainable packaging solutions in healthcare

The shifting landscape within the industry, notably driven by new regulatory mandates, has spurred medical foam manufacturers to innovate their packaging solutions. Stringent standards like those set by the FDA have propelled manufacturers to revamp their foam packaging designs. Heightened environmental concerns surrounding plastic usage in medical foam packaging have prompted a shift toward developing sustainable alternatives that prioritize safety and ecological impact. Manufacturers are exploring sustainable avenues that necessitate fewer resources and energy for medical foam packaging production to alleviate cost pressures while upholding packaging integrity. This approach aims to minimize transportation expenses and extend product shelf life. Consequently, the burgeoning demand for sustainable packaging solutions presents a significant opportunity for medical foam manufacturers.

Challenge: Stringent rules & regulations

The stringent regulatory landscape within the healthcare sector poses a significant hurdle to the growth of the medical foam market. Foam materials integral to medical devices and wound care must meet stringent safety, biocompatibility, and quality standards stipulated by regulatory bodies like the FDA in the US or the European Medicines Agency in Europe. Complying with these standards demands exhaustive testing, validation, and strict adherence to specific guidelines, resulting in increased production costs and extended time-to-market for new foam-based medical products. This complexity in compliance serves as a deterrent, particularly for smaller manufacturers or newcomers introducing innovative foam technologies, leading to delays in product launches and hindering market expansion. According to FDA records, packaging-related issues contributed to approximately 380 Class 2 medical device product recalls in the past decade, with packaging and labeling faults accounting for 13% of all medical device recalls. Obtaining approval and certifications for medical foam from regulatory bodies like the FDA entails a time-intensive process and substantial investment in research and development. Consequently, these stringent requirements command higher prices for patented and certified medical foam products. Therefore, navigating the rigorous regulatory demands while offering cost-effective solutions across various applications remains a significant challenge for medical foam manufacturers.

Medical Foam Market: Ecosystem

Medical Foam Market Ecosystem

The flexible foam segment is projected to be the largest segment during the forecast period in terms of volume.

Based on form, the flexible foam sector held the largest share in 2022, mainly driven by its extensive use in bedding, cushioning, packaging for medical devices, and wound care dressing applications. The increased consumption of flexible foam in these areas is due to its desirable traits, like softness, resistance to moisture, and excellent mechanical properties that ensure high impact resistance.

Polymers are expected to be the largest segment of the medical foam market by material during the forecast period.

By material, in 2022, the polymer segment held the most significant portion of the medical foam market, primarily due to its characteristics. These properties, including lightweight structure, heat retention, sound absorption, biocompatibility, and exceptional cushioning abilities, contributed significantly to this segment's dominance. The primary polymer foam types utilized in medical settings encompass polyurethane foam, polystyrene foam, polyolefin foam, among others. It's anticipated that the polymer sector will continue to lead the medical foam industry.

Bedding & cushioning are projected to be the most extensive applications of the medical foam market during the forecast period.

Anticipated growth in the elderly population and the emphasis on patient comfort are projected to propel the bedding and cushioning segment. The preference for flexible foams in bedding and upholstery is due to their excellent resilience. These materials find application in surgical beds, cushions, comfort and positioning pads, wheelchair seats, and orthopedic support, thereby fostering the increasing demand for medical foams in bedding and cushioning applications.

Asia Pacific is projected to grow at the highest CAGR during the forecast period.

Asia Pacific accounted for the most significant global medical foam market share in 2022, followed by Europe and North America. China is one of the major consumers of medical foam in the Asia Pacific region. The market here is witnessing growth due to demographic changes, increasing healthcare spending, industrial development, and improving economic conditions.

Medical Foam Market by Region

To know about the assumptions considered for the study, download the pdf brochure

Key Market Players

The Dow Chemical Company (US), Sekisui Chemical Co., Ltd. (Japan), Huntsman Corporation (US), Trelleborg AB (Sweden), BASF SE (Germany), Recticel NV (Belgium), INOAC Corporation (Japan), UFP Technologies, Inc. (US), FXI Holdings, Inc. (US), Armacell International SA (Germany), Rogers Corporation (US), Freudenberg Group (Germany) and Molnlycke Health Care (Sweden) are some of the major players in the global medical foam market.

These players have been focusing on expansion, acquisition, and agreement strategies that help them expand their businesses in untapped and potential markets. They have adopted various organic and inorganic growth strategies to enhance their position in the medical foam market.

Read More: Medical Foam Companies

Get online access to the report on the World's First Market Intelligence Cloud

  • Easy to Download Historical Data & Forecast Numbers
  • Company Analysis Dashboard for high growth potential opportunities
  • Research Analyst Access for customization & queries
  • Competitor Analysis with Interactive dashboard
  • Latest News, Updates & Trend analysis
Request Sample

Scope of the Report

:

Report Metric

Details

Market Size Available for Years

2018 to 2028

Base Year Considered

2022

Forecast Period

2023–2028

Forecast Units

Value (USD Million/Billion), Volume(Tons)

Segments Covered

Form, Material, Application, and Region

Geographies Covered

 North America, Europe, Asia Pacific, South America, and Middle East & Africa

Companies Covered

The Dow Chemical Company (US), SEKISUI CHEMICAL CO., LTD. (Japan), Huntsman Corporation (US), Trelleborg AB (Sweden), BASF SE (Germany), Recticel NV (Belgium), INOAC Corporation (Japan), UFP Technologies, Inc. (US), FXI Holdings, Inc. (US), Armacell International SA (Germany), Rogers Corporation (US), Freudenberg Group (Germany), Mölnlycke Health Care AB (Sweden), VPC Group Inc. (Canada), FoamPartner Group (Switzerland), The Woodbridge Group (Canada), General Plastics Manufacturing Company (US), and others.
A total of 25 significant players covered

This research report categorizes the medical market based on form, material, application, and region.

Based on the form, the medical foam market has been segmented as follows:
  • Flexible Foam
  • Rigid Foam
  • Spray Foam
Based on material, the medical foammarket has been segmented as follows:
  • Polymers
  • Latex
  • Metals
Based on application, the medical foammarket has been segmented as follows:
  • Bedding & Cushioning
  • Medical Packaging
  • Medical Devices & Components
  • Prosthetics & Wound Care
  • Others
Based on the region, the medical foammarket has been segmented as follows:
  • North America
    • US
    • Canada
    • Mexico
  • Europe
    • Germany
    • France
    • Italy
    • UK
    • Spain
    • Russia
    • Turkey
    • Rest of Europe
  • Asia Pacific
    • China
    • India
    • Japan
    • South Korea
    • Thailand
    • Rest of Asia Specific
  • South America
    • Brazil
    • Argentina
    • Rest of South America
  • Middle East & Africa
    • GCC Countries
      • UAE
      • Saudi Arabia
      • Rest of GCC
    • South Africa
    • Rest of Middle East & Africa

Recent Developments

  • In March 2019, FXI and Innocor, leading players in polyurethane foam products, agreed to merge their business. The company will function under the name of FXI and offer its products, such as bedding, furniture, healthcare, filtration, transportation, and acoustics, to markets. The company will continue to sell Innocor’s Novaform and Sleep Innovations mattress brands. The company has increased its customer base and product portfolio with this merger.
  • In April 2022, Sekisui Chemical’s raw material resin plant in the Netherlands, operated by its subsidiary SEKISUI S-LEC BV, transitioned to using 100% renewable energy sources for all its purchased electricity in 2022. This move is part of the company’s commitment to ESG (Environmental, Social, and Governance) management and its efforts to address climate change. The SEKISUI CHEMICAL Group has made climate change a key focus and aims to shift to 100% renewable energy for the electricity purchased by all its production sites by 2030.
  • In September 2023, Dow Chemical Company started a new MDI distillation and prepolymers facility in Freeport, Texas, replacing its capacity in La Porte, Texas. This investment improves operational flexibility, reliability, and sustainability, reducing greenhouse gas emissions, freshwater intake, and wastewater discharge. The facility will supply 30% more products to customers, supporting growth in automotive, construction, consumer, and industrial markets.

Frequently Asked Questions (FAQ):

To speak to our analyst for a discussion on the above findings, click Speak to Analyst

TABLE OF CONTENTS
 
1 INTRODUCTION (Page No. - 41)
    1.1 STUDY OBJECTIVES 
    1.2 MARKET DEFINITION 
    1.3 INCLUSIONS & EXCLUSIONS 
          TABLE 1 MEDICAL FOAM MARKET: INCLUSIONS & EXCLUSIONS, BY MATERIAL
          TABLE 2 MEDICAL FOAM MARKET: INCLUSIONS & EXCLUSIONS, BY APPLICATION
          TABLE 3 MEDICAL FOAM MARKET: INCLUSIONS & EXCLUSIONS, BY REGION
    1.4 MARKET SCOPE 
           1.4.1 MARKETS COVERED
           1.4.2 YEARS CONSIDERED
    1.5 CURRENCY CONSIDERED 
    1.6 UNITS CONSIDERED 
    1.7 STAKEHOLDERS 
    1.8 LIMITATIONS 
    1.9 SUMMARY OF CHANGES 
 
2 RESEARCH METHODOLOGY (Page No. - 46)
    2.1 RESEARCH DATA 
          FIGURE 1 MEDICAL FOAM MARKET: RESEARCH DESIGN
           2.1.1 SECONDARY DATA
                    2.1.1.1 Key data from secondary sources
           2.1.2 PRIMARY DATA
                    2.1.2.1 Key data from primary sources
                    2.1.2.2 Key industry insights
                    2.1.2.3 Breakdown of primary interviews
    2.2 MARKET SIZE ESTIMATION 
          FIGURE 2 MARKET SIZE ESTIMATION (DEMAND SIDE)
    2.3 BASE NUMBER CALCULATION 
           2.3.1 BASE NUMBER CALCULATION – APPROACH 1
           2.3.2 BASE NUMBER CALCULATION – APPROACH 2
           2.3.3 BASE NUMBER CALCULATION – APPROACH 3
                    FIGURE 3 MARKET SIZE ESTIMATION (SUPPLY SIDE)
    2.4 MARKET ENGINEERING PROCESS 
           2.4.1 BOTTOM-UP APPROACH
                    FIGURE 4 MARKET SIZE ESTIMATION: BOTTOM-UP APPROACH
           2.4.2 TOP-DOWN APPROACH
                    FIGURE 5 MARKET SIZE ESTIMATION: TOP-DOWN APPROACH
    2.5 MARKET BREAKDOWN AND DATA TRIANGULATION 
          FIGURE 6 DATA TRIANGULATION
    2.6 RESEARCH ASSUMPTIONS 
    2.7 RESEARCH LIMITATIONS 
    2.8 RECESSION IMPACT 
 
3 EXECUTIVE SUMMARY (Page No. - 56)
    TABLE 4 MEDICAL FOAM: MARKET SNAPSHOT, 2023 VS. 2028
    FIGURE 7 RIGID FOAM SEGMENT TO LEAD IN TERMS OF VALUE DURING FORECAST PERIOD
    FIGURE 8 BEDDING & CUSHIONING SEGMENT TO LEAD MEDICAL FOAM MARKET DURING FORECAST PERIOD
    FIGURE 9 METAL FOAM MATERIAL TO LEAD MEDICAL FOAM MARKET DURING FORECAST PERIOD
    FIGURE 10 ASIA PACIFIC TO WITNESS HIGHEST CAGR DURING FORECAST PERIOD
 
4 PREMIUM INSIGHTS (Page No. - 60)
    4.1 ATTRACTIVE OPPORTUNITIES FOR PLAYERS IN MEDICAL FOAM MARKET 
          FIGURE 11 RISE IN GLOBAL HEALTHCARE EXPENDITURE AND GROWTH OF IMPLANTABLE DEVICES SECTOR TO DRIVE GROWTH
    4.2 MEDICAL FOAM MARKET, BY REGION 
          FIGURE 12 ASIA PACIFIC TO BE LARGEST REGIONAL MARKET
    4.3 MEDICAL FOAM MARKET, BY FORM 
          FIGURE 13 FLEXIBLE FOAM TO REGISTER HIGHEST CAGR DURING FORECAST PERIOD
    4.4 MEDICAL FOAM MARKET, BY APPLICATION 
          FIGURE 14 BEDDING & CUSHIONING TO BE LARGEST APPLICATION OF MEDICAL FOAM
    4.5 MEDICAL FOAM MARKET, BY TYPE AND REGION 
          FIGURE 15 ASIA PACIFIC TO ACCOUNT FOR LARGEST SHARE OF MEDICAL  FOAM MARKET
 
5 MARKET OVERVIEW (Page No. - 63)
    5.1 INTRODUCTION 
    5.2 MARKET DYNAMICS 
          FIGURE 16 DRIVERS, RESTRAINTS, OPPORTUNITIES, AND CHALLENGES IN MEDICAL FOAM MARKET
           5.2.1 DRIVERS
                    5.2.1.1 Increase in aging population
                                TABLE 5 NUMBER AND DISTRIBUTION OF PERSONS AGED 60 YEARS OR OVER, BY REGION,  2017 VS. 2050
                    5.2.1.2 Rise in global healthcare expenditure
                                FIGURE 17 CURRENT EXPENDITURE ON HEALTH IN PERCENTAGE SHARE OF GDP
                    5.2.1.3 Growth of implantable devices sector
                    5.2.1.4 Shift from traditional to advanced wound care products
           5.2.2 RESTRAINTS
                    5.2.2.1 Fluctuations in raw material prices
                                FIGURE 18 PERCENTAGE FLUCTUATIONS IN CRUDE OIL PRICES, 2014–2023
                    5.2.2.2 Limited biocompatibility and compatibility concerns
           5.2.3 OPPORTUNITIES
                    5.2.3.1 Rise in demand for sustainable packaging solutions in healthcare
                    5.2.3.2 Emergence of new foam materials
           5.2.4 CHALLENGES
                    5.2.4.1 Stringent rules & regulations
                    5.2.4.2 Environmental and sustainability challenges
    5.3 PORTER’S FIVE FORCES ANALYSIS 
          FIGURE 19 PORTER’S FIVE FORCES ANALYSIS
          TABLE 6 IMPACT OF PORTER’S FIVE FORCES ON MEDICAL FOAM MARKET
           5.3.1 THREAT OF NEW ENTRANTS
           5.3.2 THREAT OF SUBSTITUTES
           5.3.3 BARGAINING POWER OF SUPPLIERS
           5.3.4 BARGAINING POWER OF BUYERS
           5.3.5 INTENSITY OF COMPETITIVE RIVALRY
    5.4 TRENDS/DISRUPTIONS IMPACTING CUSTOMER’S BUSINESS 
           5.4.1 REVENUE SHIFTS AND NEW REVENUE POCKETS FOR MEDICAL FOAM MANUFACTURERS/SUPPLIERS
                    FIGURE 20 REVENUE SHIFTS FOR MEDICAL FOAM MANUFACTURERS
    5.5 SUPPLY CHAIN ANALYSIS 
          FIGURE 21 SUPPLY CHAIN ANALYSIS OF MEDICAL FOAM MARKET
    5.6 ECOSYSTEM MAP 
          FIGURE 22 ECOSYSTEM MAPPING OF MEDICAL FOAM MARKET
          TABLE 7 ECOSYSTEM OF MEDICAL FOAM MARKET
    5.7 TECHNOLOGY ANALYSIS 
           5.7.1 DIGITAL FOAM TECHNOLOGY
           5.7.2 AUXETIC FOAM
    5.8 CASE STUDY ANALYSIS 
           5.8.1 USE OF POLYFORM MOLDED FOAM ENHANCES RESPIRATORY DEVICE PERFORMANCE
           5.8.2 MAXIMIZING MEDICAL PRODUCT EXCELLENCE WITH ENGINEERING STRUCTURAL FOAM (ESF) AT BRANDON MEDICAL
    5.9 PATENT ANALYSIS 
           5.9.1 METHODOLOGY
                    FIGURE 23 LIST OF MAJOR PATENTS FOR MEDICAL FOAM
           5.9.2 JURISDICTION ANALYSIS
                    FIGURE 24 US ACCOUNTED FOR HIGHEST PATENT COUNT
                    5.9.2.1 Major patents
                                TABLE 8 RECENT PATENTS BY 3M INNOVATIVE PROPERTIES CO
                                TABLE 9 RECENT PATENTS BY BASF SE
                                TABLE 10 RECENT PATENTS BY DOW GLOBAL TECHNOLOGIES LLC
    5.10 TRADE ANALYSIS 
           5.10.1 EXPORT SCENARIO
                     FIGURE 25 EXPORT DATA ON HS CODE 3909: AMINO-RESINS, PHENOLIC RESINS, AND POLYURETHANES, IN PRIMARY FORMS
           5.10.2 IMPORT SCENARIO
                     FIGURE 26 IMPORT DATA ON HS CODE 3909: AMINO-RESINS, PHENOLIC RESINS, AND POLYURETHANES, IN PRIMARY FORMS
    5.11 KEY CONFERENCES AND EVENTS (2023–2024) 
           TABLE 11 MEDICAL FOAM MARKET: KEY CONFERENCES AND EVENTS (2023–2024)
    5.12 TARIFF AND REGULATORY LANDSCAPE 
           5.12.1 REGULATORY BODIES, GOVERNMENT AGENCIES,  AND OTHER ORGANIZATIONS
                     TABLE 12 NORTH AMERICA: REGULATORY BODIES, GOVERNMENT AGENCIES,  AND OTHER ORGANIZATIONS
                     TABLE 13 EUROPE: REGULATORY BODIES, GOVERNMENT AGENCIES, AND OTHER ORGANIZATIONS
                     TABLE 14 ASIA PACIFIC: REGULATORY BODIES, GOVERNMENT AGENCIES,  AND OTHER ORGANIZATIONS
                     TABLE 15 REST OF THE WORLD: REGULATORY BODIES, GOVERNMENT AGENCIES,  AND OTHER ORGANIZATIONS
           5.12.2 MARKET REGULATIONS AND STANDARDS
                     TABLE 16 REGULATIONS AND STANDARDS FOR MEDICAL FOAM PRODUCTS
    5.13 KEY STAKEHOLDERS AND BUYING CRITERIA 
           5.13.1 KEY STAKEHOLDERS IN BUYING PROCESS
                     FIGURE 27 INFLUENCE OF STAKEHOLDERS ON BUYING PROCESS FOR TOP THREE END USES
                     TABLE 17 INFLUENCE OF STAKEHOLDERS ON BUYING PROCESS FOR TOP THREE END USES (%)
                     FIGURE 28 KEY BUYING CRITERIA FOR TOP THREE END USES
                     TABLE 18 KEY BUYING CRITERIA FOR TOP THREE END USES
 
6 MEDICAL FOAM MARKET, BY FORM (Page No. - 95)
    6.1 INTRODUCTION 
          FIGURE 29 SPRAY FOAM TO REGISTER HIGHEST CAGR DURING FORECAST PERIOD
          TABLE 19 MEDICAL FOAM MARKET, BY FORM, 2018–2022 (USD MILLION)
          TABLE 20 MEDICAL FOAM MARKET, BY FORM, 2023–2028 (USD MILLION)
          TABLE 21 MEDICAL FOAM MARKET, BY FORM, 2018–2022 (TON)
          TABLE 22 MEDICAL FOAM MARKET, BY FORM, 2023–2028 (TON)
    6.2 FLEXIBLE FOAM 
           6.2.1 SOFTNESS, MOISTURE RESISTANCE, HIGH IMPACT & MECHANICAL STRENGTH TO DRIVE MARKET
                    TABLE 23 FLEXIBLE MEDICAL FOAM MARKET, BY REGION, 2018–2022 (USD MILLION)
                    TABLE 24 FLEXIBLE MEDICAL FOAM MARKET, BY REGION, 2023–2028 (USD MILLION)
                    TABLE 25 FLEXIBLE MEDICAL FOAM MARKET, BY REGION, 2018–2022 (TON)
                    TABLE 26 FLEXIBLE MEDICAL FOAM MARKET, BY REGION, 2023–2028 (TON)
    6.3 RIGID FOAM 
           6.3.1 INCREASE IN SALES OF MEDICAL DEVICES TO FUEL  MARKET
                    TABLE 27 RIGID MEDICAL FOAM MARKET, BY REGION, 2018–2022 (USD MILLION)
                    TABLE 28 RIGID MEDICAL FOAM MARKET, BY REGION, 2023–2028 (USD MILLION)
                    TABLE 29 RIGID MEDICAL FOAM MARKET, BY REGION, 2018–2022 (TON)
                    TABLE 30 RIGID MEDICAL FOAM MARKET, BY REGION, 2023–2028 (TON)
    6.4 SPRAY FOAM 
           6.4.1 TECHNOLOGICAL ADVANCEMENTS IN WOUND CARE TECHNOLOGY TO DRIVE MARKET
                    TABLE 31 SPRAY MEDICAL FOAM MARKET, BY REGION, 2018–2022 (USD MILLION)
                    TABLE 32 SPRAY MEDICAL FOAM MARKET, BY REGION, 2023–2028 (USD MILLION)
                    TABLE 33 SPRAY MEDICAL FOAM MARKET, BY REGION, 2018–2022 (TON)
                    TABLE 34 SPRAY MEDICAL FOAM MARKET, BY REGION, 2023–2028 (TON)
 
7 MEDICAL FOAM MARKET, BY MATERIAL (Page No. - 103)
    7.1 INTRODUCTION 
          FIGURE 30 POLYMERS TO REGISTER HIGHEST CAGR DURING FORECAST PERIOD
          TABLE 35 MEDICAL FOAM MARKET, BY MATERIAL, 2018–2022 (USD MILLION)
          TABLE 36 MEDICAL FOAM MARKET, BY MATERIAL, 2023–2028 (USD MILLION)
          TABLE 37 MEDICAL FOAM MARKET, BY MATERIAL, 2018–2022 (TON)
          TABLE 38 MEDICAL FOAM MARKET, BY MATERIAL, 2023–2028 (TON)
    7.2 POLYMERS 
           7.2.1 ABUNDANT AVAILABILITY, EASE OF MANUFACTURING, AND LOW COST TO DRIVE MARKET
           7.2.2 POLYURETHANE
           7.2.3 POLYSTYRENE
           7.2.4 POLYOLEFINS
           7.2.5 OTHER POLYMERS
                    TABLE 39 POLYMER MEDICAL FOAM MARKET, BY REGION, 2018–2022 (USD MILLION)
                    TABLE 40 POLYMER MEDICAL FOAM MARKET, BY REGION, 2023–2028 (USD MILLION)
                    TABLE 41 POLYMER MEDICAL FOAM MARKET, BY REGION, 2018–2022 (TON)
                    TABLE 42 POLYMER MEDICAL FOAM MARKET, BY REGION, 2023–2028 (TON)
    7.3 LATEX 
           7.3.1 HIGH DURABILITY AND COMFORT OFFERED BY LATEX MATTRESSES TO FUEL MARKET
           7.3.2 SYNTHETIC LATEX
           7.3.3 BLENDED LATEX
           7.3.4 NATURAL LATEX
                    TABLE 43 LATEX MEDICAL FOAM MARKET, BY REGION, 2018–2022 (USD MILLION)
                    TABLE 44 LATEX MEDICAL FOAM MARKET, BY REGION, 2023–2028 (USD MILLION)
                    TABLE 45 LATEX MEDICAL FOAM MARKET, BY REGION, 2018–2022 (TON)
                    TABLE 46 LATEX MEDICAL FOAM MARKET, BY REGION, 2023–2028 (TON)
    7.4 METALS 
           7.4.1 MECHANICAL PROPERTIES AND BIOCOMPATIBILITY OF METAL FOAM TO DRIVE MARKET
           7.4.2 TITANIUM
           7.4.3 COPPER
           7.4.4 OTHER METALS
                    TABLE 47 METAL MEDICAL FOAM MARKET, BY REGION, 2018–2022 (USD MILLION)
                    TABLE 48 METAL MEDICAL FOAM MARKET, BY REGION, 2023–2028 (USD MILLION)
                    TABLE 49 METAL MEDICAL FOAM MARKET, BY REGION, 2018–2022 (TON)
                    TABLE 50 METAL MEDICAL FOAM MARKET, BY REGION, 2023–2028 (TON)
 
8 MEDICAL FOAM MARKET, BY APPLICATION (Page No. - 113)
    8.1 INTRODUCTION 
          FIGURE 31 BEDDING & CUSHIONING ACCOUNTED FOR LARGEST MARKET SHARE DURING FORECAST PERIOD
          TABLE 51 MEDICAL FOAM MARKET, BY APPLICATION, 2018–2022 (USD MILLION)
          TABLE 52 MEDICAL FOAM MARKET, BY APPLICATION 2023–2028 (USD MILLION)
          TABLE 53 MEDICAL FOAM MARKET, BY APPLICATION, 2018–2022 (TON)
          TABLE 54 MEDICAL FOAM MARKET, BY APPLICATION 2023–2028 (TON)
    8.2 BEDDING & CUSHIONING 
           8.2.1 INCREASE IN AGING POPULATION & NEED FOR PATIENT COMFORT TO DRIVE SEGMENT
                    TABLE 55 MEDICAL FOAM MARKET FOR BEDDING & CUSHIONING, BY REGION,  2018–2022 (USD MILLION)
                    TABLE 56 MEDICAL FOAM MARKET FOR BEDDING & CUSHIONING, BY REGION,  2023–2028 (USD MILLION)
                    TABLE 57 MEDICAL FOAM MARKET FOR BEDDING & CUSHIONING, BY REGION,  2018–2022 (TON)
                    TABLE 58 MEDICAL FOAM MARKET FOR BEDDING & CUSHIONING, BY REGION, 2023–2028 (TON)
    8.3 MEDICAL PACKAGING 
           8.3.1 RISE IN DEMAND FOR PROTECTIVE PACKAGING FOR MEDICAL DEVICES AND INSTRUMENTS TO FUEL MARKET
                    TABLE 59 MEDICAL FOAM MARKET FOR PACKAGING, BY REGION, 2018–2022 (USD MILLION)
                    TABLE 60 MEDICAL FOAM MARKET FOR PACKAGING, BY REGION, 2023–2028 (USD MILLION)
                    TABLE 61 MEDICAL FOAM MARKET FOR PACKAGING, BY REGION, 2018–2022 (TON)
                    TABLE 62 MEDICAL FOAM MARKET FOR PACKAGING, BY REGION, 2023–2028 (TON)
    8.4 MEDICAL DEVICES & COMPONENTS 
           8.4.1 RISE IN MEDICAL EXPENDITURE BY EMERGING NATIONS TO DRIVE SEGMENT
                    TABLE 63 MEDICAL FOAM MARKET FOR MEDICAL DEVICES & COMPONENTS, BY REGION,  2018–2022 (USD MILLION)
                    TABLE 64 MEDICAL FOAM MARKET FOR MEDICAL DEVICES & COMPONENTS, BY REGION,  2023–2028 (USD MILLION)
                    TABLE 65 MEDICAL FOAM MARKET FOR MEDICAL DEVICES & COMPONENTS, BY REGION,  2018–2022 (TON)
                    TABLE 66 MEDICAL FOAM MARKET FOR MEDICAL DEVICES & COMPONENTS, BY REGION,  2023–2028 (TON)
    8.5 PROSTHETICS & WOUND CARE 
           8.5.1 INCREASE IN ADVANCEMENTS IN WOUND CARE TECHNOLOGY TO DRIVE SEGMENT
                    TABLE 67 MEDICAL FOAM MARKET FOR PROSTHETICS & WOUND CARE, BY REGION,  2018–2022 (USD MILLION)
                    TABLE 68 MEDICAL FOAM MARKET FOR PROSTHETICS & WOUND CARE, BY REGION,  2023–2028 (USD MILLION)
                    TABLE 69 MEDICAL FOAM MARKET FOR PROSTHETICS & WOUND CARE, BY REGION,  2018–2022 (TON)
                    TABLE 70 MEDICAL FOAM MARKET FOR PROSTHETICS & WOUND CARE, BY REGION,  2023–2028 (TON)
    8.6 OTHER APPLICATIONS 
          TABLE 71 MEDICAL FOAM MARKET FOR OTHER APPLICATIONS, BY REGION,  2018–2022 (USD MILLION)
          TABLE 72 MEDICAL FOAM MARKET FOR OTHER APPLICATIONS, BY REGION,  2023–2028 (USD MILLION)
          TABLE 73 MEDICAL FOAM MARKET FOR OTHER APPLICATIONS, BY REGION,  2018–2022 (TON)
          TABLE 74 MEDICAL FOAM MARKET FOR OTHER APPLICATIONS, BY REGION, 2023–2028 (TON)
 
9 MEDICAL FOAM MARKET, BY REGION (Page No. - 126)
    9.1 INTRODUCTION 
          FIGURE 32 ASIA PACIFIC TO REGISTER HIGHEST CAGR DURING FORECAST PERIOD
          TABLE 75 MEDICAL FOAM MARKET, BY REGION, 2018–2022 (USD MILLION)
          TABLE 76 MEDICAL FOAM MARKET, BY REGION, 2023–2028 (USD MILLION)
          TABLE 77 MEDICAL FOAM MARKET, BY REGION, 2018–2022 (TON)
          TABLE 78 MEDICAL FOAM MARKET, BY REGION, 2023–2028 (TON)
    9.2 ASIA PACIFIC 
           9.2.1 IMPACT OF RECESSION
                    FIGURE 33 ASIA PACIFIC: MEDICAL FOAM MARKET SNAPSHOT
                    TABLE 79 ASIA PACIFIC: MEDICAL FOAM MARKET, BY COUNTRY, 2018–2022 (USD MILLION)
                    TABLE 80 ASIA PACIFIC: MEDICAL FOAM MARKET, BY COUNTRY, 2023–2028 (USD MILLION)
                    TABLE 81 ASIA PACIFIC: MEDICAL FOAM MARKET, BY COUNTRY, 2018–2022 (TON)
                    TABLE 82 ASIA PACIFIC: MEDICAL FOAM MARKET, BY COUNTRY, 2023–2028 (TON)
                    TABLE 83 ASIA PACIFIC: MEDICAL FOAM MARKET, BY FORM, 2018–2022 (USD MILLION)
                    TABLE 84 ASIA PACIFIC: MEDICAL FOAM MARKET, BY FORM, 2023–2028 (USD MILLION)
                    TABLE 85 ASIA PACIFIC: MEDICAL FOAM MARKET, BY FORM, 2018–2022 (TON)
                    TABLE 86 ASIA PACIFIC: MEDICAL FOAM MARKET, BY FORM, 2023–2028 (TON)
                    TABLE 87 ASIA PACIFIC: MEDICAL FOAM MARKET, BY MATERIAL, 2018–2022 (USD MILLION)
                    TABLE 88 ASIA PACIFIC: MEDICAL FOAM MARKET, BY MATERIAL, 2023–2028 (USD MILLION)
                    TABLE 89 ASIA PACIFIC: MEDICAL FOAM MARKET, BY MATERIAL, 2018–2022 (TON)
                    TABLE 90 ASIA PACIFIC: MEDICAL FOAM MARKET, BY MATERIAL, 2023–2028 (TON)
                    TABLE 91 ASIA PACIFIC: MEDICAL FOAM MARKET, BY POLYMER TYPE, 2018–2022 (USD MILLION)
                    TABLE 92 ASIA PACIFIC: MEDICAL FOAM MARKET, BY POLYMER TYPE, 2023–2028 (USD MILLION)
                    TABLE 93 ASIA PACIFIC: MEDICAL FOAM MARKET, BY POLYMER TYPE, 2018–2022 (TON)
                    TABLE 94 ASIA PACIFIC: MEDICAL FOAM MARKET, BY POLYMER TYPE, 2023–2028 (TON)
                    TABLE 95 ASIA PACIFIC: MEDICAL FOAM MARKET, BY LATEX TYPE, 2018–2022 (USD MILLION)
                    TABLE 96 ASIA PACIFIC: MEDICAL FOAM MARKET, BY LATEX TYPE, 2023–2028 (USD MILLION)
                    TABLE 97 ASIA PACIFIC: MEDICAL FOAM MARKET, BY LATEX TYPE, 2018–2022 (TON)
                    TABLE 98 ASIA PACIFIC: MEDICAL FOAM MARKET, BY LATEX TYPE, 2023–2028 (TON)
                    TABLE 99 ASIA PACIFIC: MEDICAL FOAM MARKET, BY METAL, 2018–2022 (USD MILLION)
                    TABLE 100 ASIA PACIFIC: MEDICAL FOAM MARKET, BY METAL, 2023–2028 (USD MILLION)
                    TABLE 101 ASIA PACIFIC: MEDICAL FOAM MARKET, BY METAL, 2018–2022 (TON)
                    TABLE 102 ASIA PACIFIC: MEDICAL FOAM MARKET, BY METAL, 2023–2028 (TON)
                    TABLE 103 ASIA PACIFIC: MEDICAL FOAM MARKET, BY APPLICATION, 2018–2022 (USD MILLION)
                    TABLE 104 ASIA PACIFIC: MEDICAL FOAM MARKET, BY APPLICATION, 2023–2028 (USD MILLION)
                    TABLE 105 ASIA PACIFIC: MEDICAL FOAM MARKET, BY APPLICATION, 2018–2022 (TON)
                    TABLE 106 ASIA PACIFIC: MEDICAL FOAM MARKET, BY APPLICATION, 2023–2028 (TON)
           9.2.2 CHINA
                    9.2.2.1 China to lead Asia Pacific market
                                TABLE 107 CHINA: MEDICAL FOAM MARKET, BY APPLICATION, 2018–2022 (USD MILLION)
                                TABLE 108 CHINA: MEDICAL FOAM MARKET, BY APPLICATION, 2023–2028 (USD MILLION)
                                TABLE 109 CHINA MEDICAL FOAM MARKET, BY APPLICATION, 2018–2022 (TON)
                                TABLE 110 CHINA MEDICAL FOAM MARKET, BY APPLICATION, 2023–2028 (TON)
           9.2.3 JAPAN
                    9.2.3.1 Aging population and increasing healthcare spending to drive market
                                TABLE 111 JAPAN: MEDICAL FOAM MARKET, BY APPLICATION, 2018–2022 (USD MILLION)
                                TABLE 112 JAPAN: MEDICAL FOAM MARKET, BY APPLICATION, 2023–2028 (USD MILLION)
                                TABLE 113 JAPAN: MEDICAL FOAM MARKET, BY APPLICATION, 2018–2022 (TON)
                                TABLE 114 JAPAN: MEDICAL FOAM MARKET, BY APPLICATION, 2023–2028 (TON)
           9.2.4 INDIA
                    9.2.4.1 Government initiatives and plans to increase healthcare expenditure to drive market
                                TABLE 115 INDIA: MEDICAL FOAM MARKET, BY APPLICATION, 2018–2022 (USD MILLION)
                                TABLE 116 INDIA: MEDICAL FOAM MARKET, BY APPLICATION, 2023–2028 (USD MILLION)
                                TABLE 117 INDIA: MEDICAL FOAM MARKET, BY APPLICATION, 2018–2022 (TON)
                                TABLE 118 INDIA: MEDICAL FOAM MARKET, BY APPLICATION, 2023–2028 (TON)
           9.2.5 INDONESIA
                    9.2.5.1 Increase in aging population and government healthcare expenditure to drive market
                                TABLE 119 INDONESIA: MEDICAL FOAM MARKET, BY APPLICATION, 2018–2022 (USD MILLION)
                                TABLE 120 INDONESIA: MEDICAL FOAM MARKET, BY APPLICATION, 2023–2028 (USD MILLION)
                                TABLE 121 INDONESIA MEDICAL FOAM MARKET, BY APPLICATION, 2018–2022 (TON)
                                TABLE 122 INDONESIA MEDICAL FOAM MARKET, BY APPLICATION, 2023–2028 (TON)
           9.2.6 REST OF ASIA PACIFIC
                    TABLE 123 REST OF ASIA PACIFIC: MEDICAL FOAM MARKET, BY APPLICATION,  2018–2022 (USD MILLION)
                    TABLE 124 REST OF ASIA PACIFIC: MEDICAL FOAM MARKET, BY APPLICATION,  2023–2028 (USD MILLION)
                    TABLE 125 REST OF ASIA PACIFIC: MEDICAL FOAM MARKET, BY APPLICATION, 2018–2022 (TON)
                    TABLE 126 REST OF ASIA PACIFIC: MEDICAL FOAM MARKET, BY APPLICATION, 2023–2028 (TON)
    9.3 EUROPE 
           9.3.1 IMPACT OF RECESSION
                    FIGURE 34 EUROPE: MEDICAL FOAM MARKET SNAPSHOT
                    TABLE 127 EUROPE: MEDICAL FOAM MARKET, BY COUNTRY, 2018–2022 (USD MILLION)
                    TABLE 128 EUROPE: MEDICAL FOAM MARKET, BY COUNTRY, 2023–2028 (USD MILLION)
                    TABLE 129 EUROPE: MEDICAL FOAM MARKET, BY COUNTRY, 2018–2022 (TON)
                    TABLE 130 EUROPE: MEDICAL FOAM MARKET, BY COUNTRY, 2023–2028 (TON)
                    TABLE 131 EUROPE: MEDICAL FOAM MARKET, BY FORM, 2018–2022 (USD MILLION)
                    TABLE 132 EUROPE: MEDICAL FOAM MARKET, BY FORM, 2023–2028 (USD MILLION)
                    TABLE 133 EUROPE: MEDICAL FOAM MARKET, BY FORM, 2018–2022 (TON)
                    TABLE 134 EUROPE: MEDICAL FOAM MARKET, BY FORM, 2023–2028 (TON)
                    TABLE 135 EUROPE: MEDICAL FOAM MARKET, BY MATERIAL, 2018–2022 (USD MILLION)
                    TABLE 136 EUROPE: MEDICAL FOAM MARKET, BY MATERIAL, 2023–2028 (USD MILLION)
                    TABLE 137 EUROPE: MEDICAL FOAM MARKET, BY MATERIAL, 2018–2022 (TON)
                    TABLE 138 EUROPE: MEDICAL FOAM MARKET, BY MATERIAL, 2023–2028 (TON)
                    TABLE 139 EUROPE: MEDICAL FOAM MARKET, BY POLYMER TYPE, 2018–2022 (USD MILLION)
                    TABLE 140 EUROPE: MEDICAL FOAM MARKET, BY POLYMER TYPE, 2023–2028 (USD MILLION)
                    TABLE 141 EUROPE: MEDICAL FOAM MARKET, BY POLYMER TYPE, 2018–2022 (TON)
                    TABLE 142 EUROPE: MEDICAL FOAM MARKET, BY POLYMER TYPE, 2023–2028 (TON)
                    TABLE 143 EUROPE: MEDICAL FOAM MARKET, BY LATEX TYPE, 2018–2022 (USD MILLION)
                    TABLE 144 EUROPE: MEDICAL FOAM MARKET, BY LATEX TYPE, 2023–2028 (USD MILLION)
                    TABLE 145 EUROPE: MEDICAL FOAM MARKET, BY LATEX TYPE, 2018–2022 (TON)
                    TABLE 146 EUROPE: MEDICAL FOAM MARKET, BY LATEX TYPE, 2023–2028 (TON)
                    TABLE 147 EUROPE: MEDICAL FOAM MARKET, BY METAL, 2018–2022 (USD MILLION)
                    TABLE 148 EUROPE: MEDICAL FOAM MARKET, BY METAL, 2023–2028 (USD MILLION)
                    TABLE 149 EUROPE: MEDICAL FOAM MARKET, BY METAL, 2018–2022 (TON)
                    TABLE 150 EUROPE: MEDICAL FOAM MARKET, BY METAL, 2023–2028 (TON)
                    TABLE 151 EUROPE: MEDICAL FOAM MARKET, BY APPLICATION, 2018–2022 (USD MILLION)
                    TABLE 152 EUROPE: MEDICAL FOAM MARKET, BY APPLICATION, 2023–2028 (USD MILLION)
                    TABLE 153 EUROPE: MEDICAL FOAM MARKET, BY APPLICATION, 2018–2022 (TON)
                    TABLE 154 EUROPE: MEDICAL FOAM MARKET, BY APPLICATION, 2023–2028 (TON)
           9.3.2 GERMANY
                    9.3.2.1 Germany to lead market in Europe
                                TABLE 155 GERMANY: MEDICAL FOAM MARKET, BY APPLICATION, 2018–2022 (USD MILLION)
                                TABLE 156 GERMANY: MEDICAL FOAM MARKET, BY APPLICATION, 2023–2028 (USD MILLION)
                                TABLE 157 GERMANY: MEDICAL FOAM MARKET, BY APPLICATION, 2018–2022 (TON)
                                TABLE 158 GERMANY: MEDICAL FOAM MARKET, BY APPLICATION, 2023–2028 (TON)
           9.3.3 UK
                    9.3.3.1 Increasing government spending on healthcare to drive demand
                                TABLE 159 UK: MEDICAL FOAM MARKET, BY APPLICATION, 2018–2022 (USD MILLION)
                                TABLE 160 UK: MEDICAL FOAM MARKET, BY APPLICATION, 2023–2028 (USD MILLION)
                                TABLE 161 UK: MEDICAL FOAM MARKET, BY APPLICATION, 2018–2022 (TON)
                                TABLE 162 UK: MEDICAL FOAM MARKET, BY APPLICATION, 2023–2028 (TON)
           9.3.4 FRANCE
                    9.3.4.1 Increasing healthcare expenditure and rising elderly population to drive market
                                TABLE 163 FRANCE: MEDICAL FOAM MARKET, BY APPLICATION, 2018–2022 (USD MILLION)
                                TABLE 164 FRANCE: MEDICAL FOAM MARKET, BY APPLICATION, 2023–2028 (USD MILLION)
                                TABLE 165 FRANCE: MEDICAL FOAM MARKET, BY APPLICATION, 2018–2022 (TON)
                                TABLE 166 FRANCE: MEDICAL FOAM MARKET, BY APPLICATION, 2023–2028 (TON)
           9.3.5 ITALY
                    9.3.5.1 Increasing investment in healthcare sector to drive market
                                TABLE 167 ITALY: MEDICAL FOAM MARKET, BY APPLICATION, 2018–2022 (USD MILLION)
                                TABLE 168 ITALY: MEDICAL FOAM MARKET, BY APPLICATION, 2023–2028 (USD MILLION)
                                TABLE 169 ITALY: MEDICAL FOAM MARKET, BY APPLICATION, 2018–2022 (TON)
                                TABLE 170 ITALY: MEDICAL FOAM MARKET, BY APPLICATION, 2023–2028 (TON)
           9.3.6 SPAIN
                    9.3.6.1 Increasing elderly population to drive  market
                                TABLE 171 SPAIN: MEDICAL FOAM MARKET, BY APPLICATION, 2018–2022 (USD MILLION)
                                TABLE 172 SPAIN: MEDICAL FOAM MARKET, BY APPLICATION, 2023–2028 (USD MILLION)
                                TABLE 173 SPAIN: MEDICAL FOAM MARKET, BY APPLICATION, 2018–2022 (TON)
                                TABLE 174 SPAIN: MEDICAL FOAM MARKET, BY APPLICATION, 2023–20285 (TON)
           9.3.7 RUSSIA
                    9.3.7.1 Increasing foreign investment to drive market
                                TABLE 175 RUSSIA: MEDICAL FOAM MARKET, BY APPLICATION, 2018–2022 (USD MILLION)
                                TABLE 176 RUSSIA: MEDICAL FOAM MARKET, BY APPLICATION, 2023–2028 (USD MILLION)
                                TABLE 177 RUSSIA: MEDICAL FOAM MARKET, BY APPLICATION, 2018–2022 (TON)
                                TABLE 178 RUSSIA: MEDICAL FOAM MARKET, BY APPLICATION, 2023–2028 (TON)
           9.3.8 TURKEY
                    9.3.8.1 Increasing elderly population and healthcare investment to drive market
                                TABLE 179 TURKEY: MEDICAL FOAM MARKET, BY APPLICATION, 2018–2022 (USD MILLION)
                                TABLE 180 TURKEY: MEDICAL FOAM MARKET, BY APPLICATION, 2023–2028 (USD MILLION)
                                TABLE 181 TURKEY: MEDICAL FOAM MARKET, BY APPLICATION, 2018–2022 (TON)
                                TABLE 182 TURKEY: MEDICAL FOAM MARKET, BY APPLICATION, 2023–2028 (TON)
           9.3.9 REST OF EUROPE
                    TABLE 183 REST OF EUROPE: MEDICAL FOAM MARKET, BY APPLICATION,  2018–2022 (USD MILLION)
                    TABLE 184 REST OF EUROPE: MEDICAL FOAM MARKET, BY APPLICATION,  2023–2028 (USD MILLION)
                    TABLE 185 REST OF EUROPE: MEDICAL FOAM MARKET, BY APPLICATION, 2018–2022 (TON)
                    TABLE 186 REST OF EUROPE: MEDICAL FOAM MARKET, BY APPLICATION, 2023–2028 (TON)
    9.4 NORTH AMERICA 
           9.4.1 IMPACT OF RECESSION
                    FIGURE 35 NORTH AMERICA: MEDICAL FOAM MARKET SNAPSHOT
                    TABLE 187 NORTH AMERICA: MEDICAL FOAM MARKET, BY COUNTRY, 2018–2022 (USD MILLION)
                    TABLE 188 NORTH AMERICA: MEDICAL FOAM MARKET, BY COUNTRY, 2023–2028 (USD MILLION)
                    TABLE 189 NORTH AMERICA: MEDICAL FOAM MARKET, BY COUNTRY, 2018–2022 (TON)
                    TABLE 190 NORTH AMERICA: MEDICAL FOAM MARKET, BY COUNTRY, 2023–2028 (TON)
                    TABLE 191 NORTH AMERICA: MEDICAL FOAM MARKET, BY FORM, 2018–2022 (USD MILLION)
                    TABLE 192 NORTH AMERICA: MEDICAL FOAM MARKET, BY FORM, 2023–2028 (USD MILLION)
                    TABLE 193 NORTH AMERICA: MEDICAL FOAM MARKET, BY FORM, 2018–2022 (TON)
                    TABLE 194 NORTH AMERICA: MEDICAL FOAM MARKET, BY FORM, 2023–2028 (TON)
                    TABLE 195 NORTH AMERICA: MEDICAL FOAM MARKET, BY MATERIAL, 2018–2022 (USD MILLION)
                    TABLE 196 NORTH AMERICA: MEDICAL FOAM MARKET, BY MATERIAL, 2023–2028 (USD MILLION)
                    TABLE 197 NORTH AMERICA: MEDICAL FOAM MARKET, BY MATERIAL, 2018–2022 (TON)
                    TABLE 198 NORTH AMERICA: MEDICAL FOAM MARKET, BY MATERIAL, 2023–2028 (TON)
                    TABLE 199 NORTH AMERICA: MEDICAL FOAM MARKET, BY POLYMER TYPE,  2018–2022 (USD MILLION)
                    TABLE 200 NORTH AMERICA: MEDICAL FOAM MARKET, BY POLYMER TYPE,  2023–2028 (USD MILLION)
                    TABLE 201 NORTH AMERICA: MEDICAL FOAM MARKET, BY POLYMER TYPE, 2018–2022 (TON)
                    TABLE 202 NORTH AMERICA: MEDICAL FOAM MARKET, BY POLYMER TYPE, 2023–2028 (TON)
                    TABLE 203 NORTH AMERICA: MEDICAL FOAM MARKET, BY LATEX TYPE, 2018–2022 (USD MILLION)
                    TABLE 204 NORTH AMERICA: MEDICAL FOAM MARKET, BY LATEX TYPE, 2023–2028 (USD MILLION)
                    TABLE 205 NORTH AMERICA: MEDICAL FOAM MARKET, BY LATEX TYPE, 2018–2022 (TON)
                    TABLE 206 NORTH AMERICA: MEDICAL FOAM MARKET, BY LATEX TYPE, 2023–2028 (TON)
                    TABLE 207 NORTH AMERICA: MEDICAL FOAM MARKET, BY METAL, 2018–2022 (USD MILLION)
                    TABLE 208 NORTH AMERICA: MEDICAL FOAM MARKET, BY METAL, 2023–2028 (USD MILLION)
                    TABLE 209 NORTH AMERICA: MEDICAL FOAM MARKET, BY METAL, 2018–2022 (TON)
                    TABLE 210 NORTH AMERICA: MEDICAL FOAM MARKET, BY METAL, 2023–2028 (TON)
                    TABLE 211 NORTH AMERICA: MEDICAL FOAM MARKET, BY APPLICATION,  2018–2022 (USD MILLION)
                    TABLE 212 NORTH AMERICA: MEDICAL FOAM MARKET, BY APPLICATION,  2023–2028 (USD MILLION)
                    TABLE 213 NORTH AMERICA: MEDICAL FOAM MARKET, BY APPLICATION, 2018–2022 (TON)
                    TABLE 214 NORTH AMERICA: MEDICAL FOAM MARKET, BY APPLICATION, 2023–2028 (TON)
           9.4.2 US
                    9.4.2.1 US to lead medical foam market in North America
                                TABLE 215 US: MEDICAL FOAM MARKET, BY APPLICATION, 2018–2022 (USD MILLION)
                                TABLE 216 US: MEDICAL FOAM MARKET, BY APPLICATION, 2023–2028 (USD MILLION)
                                TABLE 217 US: MEDICAL FOAM MARKET, BY APPLICATION, 2018–2022 (TON)
                                TABLE 218 US: MEDICAL FOAM MARKET, BY APPLICATION, 2023–2028 (TON)
           9.4.3 CANADA
                    9.4.3.1 Rising disposable income and new product development in medical equipment industry to drive market
                                TABLE 219 CANADA: MEDICAL FOAM MARKET, BY APPLICATION, 2018–2022 (USD MILLION)
                                TABLE 220 CANADA: MEDICAL FOAM MARKET, BY APPLICATION, 2023–2028 (USD MILLION)
                                TABLE 221 CANADA: MEDICAL FOAM MARKET, BY APPLICATION, 2018–2022 (TON)
                                TABLE 222 CANADA: MEDICAL FOAM MARKET, BY APPLICATION, 2023–2028 (TON)
           9.4.4 MEXICO
                    9.4.4.1 Initiatives to promote development of medical devices to drive market
                                TABLE 223 MEXICO: MEDICAL FOAM MARKET, BY APPLICATION, 2018–2022 (USD MILLION)
                                TABLE 224 MEXICO: MEDICAL FOAM MARKET, BY APPLICATION, 2023–2028 (USD MILLION)
                                TABLE 225 MEXICO: MEDICAL FOAM MARKET, BY APPLICATION, 2018–2022 (TON)
                                TABLE 226 MEXICO: MEDICAL FOAM MARKET, BY APPLICATION, 2023–2028 (TON)
    9.5 MIDDLE EAST & AFRICA 
           9.5.1 IMPACT OF RECESSION
                    TABLE 227 MIDDLE EAST & AFRICA: MEDICAL FOAM MARKET, BY COUNTRY,  2018–2022 (USD MILLION)
                    TABLE 228 MIDDLE EAST & AFRICA: MEDICAL FOAM MARKET, BY COUNTRY,  2023–2028 (USD MILLION)
                    TABLE 229 MIDDLE EAST & AFRICA: MEDICAL FOAM MARKET, BY COUNTRY, 2018–2022 (TON)
                    TABLE 230 MIDDLE EAST & AFRICA: MEDICAL FOAM MARKET, BY COUNTRY, 2023–2028 (TON)
                    TABLE 231 MIDDLE EAST & AFRICA: MEDICAL FOAM MARKET, BY FORM, 2018–2022 (USD MILLION)
                    TABLE 232 MIDDLE EAST & AFRICA: MEDICAL FOAM MARKET, BY FORM, 2023–2028 (USD MILLION)
                    TABLE 233 MIDDLE EAST & AFRICA: MEDICAL FOAM MARKET, BY FORM, 2018–2022 (TON)
                    TABLE 234 MIDDLE EAST & AFRICA: MEDICAL FOAM MARKET, BY FORM, 2023–2028 (TON)
                    TABLE 235 MIDDLE EAST & AFRICA: MEDICAL FOAM MARKET, BY MATERIAL,  2018–2022 (USD MILLION)
                    TABLE 236 MIDDLE EAST & AFRICA: MEDICAL FOAM MARKET, BY MATERIAL,  2023–2028 (USD MILLION)
                    TABLE 237 MIDDLE EAST & AFRICA: MEDICAL FOAM MARKET, BY MATERIAL, 2018–2022 (TON)
                    TABLE 238 MIDDLE EAST & AFRICA: MEDICAL FOAM MARKET, BY MATERIAL, 2023–2028 (TON)
                    TABLE 239 MIDDLE EAST & AFRICA: MEDICAL FOAM MARKET, BY POLYMER TYPE,  2018–2022 (USD MILLION)
                    TABLE 240 MIDDLE EAST & AFRICA: MEDICAL FOAM MARKET, BY POLYMER TYPE,  2023–2028 (USD MILLION)
                    TABLE 241 MIDDLE EAST & AFRICA: MEDICAL FOAM MARKET, BY POLYMER TYPE,  2018–2022 (TON)
                    TABLE 242 MIDDLE EAST & AFRICA: MEDICAL FOAM MARKET, BY POLYMER TYPE,  2023–2028 (TON)
                    TABLE 243 MIDDLE EAST & AFRICA: MEDICAL FOAM MARKET, BY LATEX TYPE,  2018–2022 (USD MILLION)
                    TABLE 244 MIDDLE EAST & AFRICA: MEDICAL FOAM MARKET, BY LATEX TYPE,  2023–2028 (USD MILLION)
                    TABLE 245 MIDDLE EAST & AFRICA: MEDICAL FOAM MARKET, BY LATEX TYPE, 2018–2022 (TON)
                    TABLE 246 MIDDLE EAST & AFRICA: MEDICAL FOAM MARKET, BY LATEX TYPE, 2023–2028 (TON)
                    TABLE 247 MIDDLE EAST & AFRICA: MEDICAL FOAM MARKET, BY METAL,  2018–2022 (USD MILLION)
                    TABLE 248 MIDDLE EAST & AFRICA: MEDICAL FOAM MARKET, BY METAL,  2023–2028 (USD MILLION)
                    TABLE 249 MIDDLE EAST & AFRICA: MEDICAL FOAM MARKET, BY METAL, 2018–2022 (TON)
                    TABLE 250 MIDDLE EAST & AFRICA: MEDICAL FOAM MARKET, BY METAL, 2023–2028 (TON)
                    TABLE 251 MIDDLE EAST & AFRICA: MEDICAL FOAM MARKET, BY APPLICATION,  2018–2022 (USD MILLION)
                    TABLE 252 MIDDLE EAST & AFRICA: MEDICAL FOAM MARKET, BY APPLICATION,  2023–2028 (USD MILLION)
                    TABLE 253 MIDDLE EAST & AFRICA: MEDICAL FOAM MARKET, BY APPLICATION, 2018–2022 (TON)
                    TABLE 254 MIDDLE EAST & AFRICA: MEDICAL FOAM MARKET, BY APPLICATION, 2023–2028 (TON)
           9.5.2 GCC COUNTRIES
                    9.5.2.1 Saudi Arabia
                               9.5.2.1.1 Increase in construction of hospitals and healthcare facilities to propel market
                                               TABLE 255 SAUDI ARABIA: MEDICAL FOAM MARKET, BY APPLICATION, 2018–2022 (USD MILLION)
                                               TABLE 256 SAUDI ARABIA: MEDICAL FOAM MARKET, BY APPLICATION, 2023–2028 (USD MILLION)
                                               TABLE 257 SAUDI ARABIA: MEDICAL FOAM MARKET, BY APPLICATION, 2018–2022 (TON)
                                               TABLE 258 SAUDI ARABIA: MEDICAL FOAM MARKET, BY APPLICATION, 2023–2028 (TON)
                    9.5.2.2 UAE
                               9.5.2.2.1 Increase in government initiatives and investments to drive market
                                               TABLE 259 UAE: MEDICAL FOAM MARKET, BY APPLICATION, 2018–2022 (USD MILLION)
                                               TABLE 260 UAE: MEDICAL FOAM MARKET, BY APPLICATION, 2023–2028 (USD MILLION)
                                               TABLE 261 UAE: MEDICAL FOAM MARKET, BY APPLICATION, 2018–2022 (TON)
                                               TABLE 262 UAE: MEDICAL FOAM MARKET, BY APPLICATION, 2023–2028 (TON)
                    9.5.2.3 Rest of GCC countries
           9.5.3 SOUTH AFRICA
                    9.5.3.1 Aging population and growth in health awareness to drive market
                                TABLE 263 SOUTH AFRICA: MEDICAL FOAM MARKET, BY APPLICATION, 2018–2022 (USD MILLION)
                                TABLE 264 SOUTH AFRICA: MEDICAL FOAM MARKET, BY APPLICATION, 2023–2028 (USD MILLION)
                                TABLE 265 SOUTH AFRICA: MEDICAL FOAM MARKET, BY APPLICATION, 2018–2022 (TON)
                                TABLE 266 SOUTH AFRICA: MEDICAL FOAM MARKET, BY APPLICATION, 2023–2028 (TON)
           9.5.4 REST OF MIDDLE EAST & AFRICA
                    TABLE 267 REST OF MIDDLE EAST & AFRICA: MEDICAL FOAM MARKET, BY APPLICATION,  2018–2022 (USD MILLION)
                    TABLE 268 REST OF MIDDLE EAST & AFRICA: MEDICAL FOAM MARKET, BY APPLICATION,  2023–2028 (USD MILLION)
                    TABLE 269 REST OF MIDDLE EAST & AFRICA: MEDICAL FOAM MARKET, BY APPLICATION,  2018–2022 (TON)
                    TABLE 270 REST OF MIDDLE EAST & AFRICA: MEDICAL FOAM MARKET, BY APPLICATION,  2023–2028 (TON)
    9.6 SOUTH AMERICA 
           9.6.1 IMPACT OF RECESSION
                    TABLE 271 SOUTH AMERICA: MEDICAL FOAM MARKET, BY COUNTRY, 2018–2022 (USD MILLION)
                    TABLE 272 SOUTH AMERICA: MEDICAL FOAM MARKET, BY COUNTRY, 2023–2028 (USD MILLION)
                    TABLE 273 SOUTH AMERICA: MEDICAL FOAM MARKET, BY COUNTRY, 2018–2022 (TON)
                    TABLE 274 SOUTH AMERICA: MEDICAL FOAM MARKET, BY COUNTRY, 2023–2028 (TON)
                    TABLE 275 SOUTH AMERICA: MEDICAL FOAM MARKET, BY FORM, 2018–2022 (USD MILLION)
                    TABLE 276 SOUTH AMERICA: MEDICAL FOAM MARKET, BY FORM, 2023–2028 (USD MILLION)
                    TABLE 277 SOUTH AMERICA: MEDICAL FOAM MARKET, BY FORM, 2018–2022 (TON)
                    TABLE 278 SOUTH AMERICA: MEDICAL FOAM MARKET, BY FORM, 2023–2028 (TON)
                    TABLE 279 SOUTH AMERICA: MEDICAL FOAM MARKET, BY MATERIAL, 2018–2022 (USD MILLION)
                    TABLE 280 SOUTH AMERICA: MEDICAL FOAM MARKET, BY MATERIAL, 2023–2028 (USD MILLION)
                    TABLE 281 SOUTH AMERICA: MEDICAL FOAM MARKET, BY MATERIAL, 2018–2022 (TON)
                    TABLE 282 SOUTH AMERICA: MEDICAL FOAM MARKET, BY MATERIAL, 2023–2028 (TON)
                    TABLE 283 SOUTH AMERICA: MEDICAL FOAM MARKET, BY POLYMER TYPE,  2018–2022 (USD MILLION)
                    TABLE 284 SOUTH AMERICA: MEDICAL FOAM MARKET, BY POLYMER TYPE,  2023–2028 (USD MILLION)
                    TABLE 285 SOUTH AMERICA: MEDICAL FOAM MARKET, BY POLYMER TYPE, 2018–2022 (TON)
                    TABLE 286 SOUTH AMERICA: MEDICAL FOAM MARKET, BY POLYMER TYPE, 2023–2028 (TON)
                    TABLE 287 SOUTH AMERICA: MEDICAL FOAM MARKET, BY LATEX TYPE, 2018–2022 (USD MILLION)
                    TABLE 288 SOUTH AMERICA: MEDICAL FOAM MARKET, BY LATEX TYPE, 2023–2028 (USD MILLION)
                    TABLE 289 SOUTH AMERICA: MEDICAL FOAM MARKET, BY LATEX TYPE, 2018–2022 (TON)
                    TABLE 290 SOUTH AMERICA: MEDICAL FOAM MARKET, BY LATEX TYPE, 2023–2028 (TON)
                    TABLE 291 SOUTH AMERICA: MEDICAL FOAM MARKET, BY METAL, 2018–2022 (USD MILLION)
                    TABLE 292 SOUTH AMERICA: MEDICAL FOAM MARKET, BY METAL, 2023–2028 (USD MILLION)
                    TABLE 293 SOUTH AMERICA: MEDICAL FOAM MARKET, BY METAL, 2018–2022 (TON)
                    TABLE 294 SOUTH AMERICA: MEDICAL FOAM MARKET, BY METAL, 2023–2028 (TON)
                    TABLE 295 SOUTH AMERICA: MEDICAL FOAM MARKET, BY APPLICATION, 2018–2022 (USD MILLION)
                    TABLE 296 SOUTH AMERICA: MEDICAL FOAM MARKET, BY APPLICATION, 2023–2028 (USD MILLION)
                    TABLE 297 SOUTH AMERICA: MEDICAL FOAM MARKET, BY APPLICATION, 2018–2022 (TON)
                    TABLE 298 SOUTH AMERICA: MEDICAL FOAM MARKET, BY APPLICATION, 2023–2028 (TON)
           9.6.2 BRAZIL
                    9.6.2.1 Brazil to lead medical foam market in  South America
                                TABLE 299 BRAZIL: MEDICAL FOAM MARKET, BY APPLICATION, 2018–2022 (USD MILLION)
                                TABLE 300 BRAZIL: MEDICAL FOAM MARKET, BY APPLICATION, 2023–2028 (USD MILLION)
                                TABLE 301 BRAZIL: MEDICAL FOAM MARKET, BY APPLICATION, 2018–2022 (TON)
                                TABLE 302 BRAZIL: MEDICAL FOAM MARKET, BY APPLICATION, 2023–2028 (TON)
           9.6.3 ARGENTINA
                    9.6.3.1 Increase in healthcare expenditure to drive market
                                TABLE 303 ARGENTINA: MEDICAL FOAM MARKET, BY APPLICATION, 2018–2022 (USD MILLION)
                                TABLE 304 ARGENTINA: MEDICAL FOAM MARKET, BY APPLICATION, 2023–2028 (USD MILLION)
                                TABLE 305 ARGENTINA: MEDICAL FOAM MARKET, BY APPLICATION, 2018–2022 (TON)
                                TABLE 306 ARGENTINA: MEDICAL FOAM MARKET, BY APPLICATION, 2023–2028 (TON)
           9.6.4 REST OF SOUTH AMERICA
                    TABLE 307 REST OF SOUTH AMERICA: MEDICAL FOAM MARKET, BY APPLICATION,  2018–2022 (USD MILLION)
                    TABLE 308 REST OF SOUTH AMERICA: MEDICAL FOAM MARKET, BY APPLICATION,  2023–2028 (USD MILLION)
                    TABLE 309 REST OF SOUTH AMERICA: MEDICAL FOAM MARKET, BY APPLICATION,  2018–2022 (TON)
                    TABLE 310 REST OF SOUTH AMERICA: MEDICAL FOAM MARKET, BY APPLICATION,  2023–2028 (TON) 
 
10 COMPETITIVE LANDSCAPE (Page No. - 214)
     10.1 INTRODUCTION 
     10.2 STRATEGIES ADOPTED BY KEY PLAYERS 
             10.2.1 OVERVIEW OF STRATEGIES ADOPTED BY KEY MANUFACTURERS
     10.3 REVENUE ANALYSIS 
             FIGURE 36 REVENUE ANALYSIS OF KEY COMPANIES (2018–2022)
     10.4 MARKET SHARE ANALYSIS 
             10.4.1 RANKING OF KEY MARKET PLAYERS, 2022
                         FIGURE 37 RANKING OF TOP FIVE PLAYERS IN MEDICAL FOAM MARKET, 2022
             10.4.2 MARKET SHARE OF KEY PLAYERS
                         FIGURE 38 MEDICAL FOAM MARKET SHARE ANALYSIS
                         TABLE 311 MEDICAL FOAM MARKET: DEGREE OF COMPETITION
                        10.4.2.1 The Dow Chemical Company
                        10.4.2.2 Sekisui Chemical Co., Ltd.
                        10.4.2.3 Huntsman Corporation
                        10.4.2.4 Trelleborg AB
                        10.4.2.5 BASF SE
     10.5 COMPANY EVALUATION MATRIX 
             10.5.1 STARS
             10.5.2 EMERGING LEADERS
             10.5.3 PERVASIVE PLAYERS
             10.5.4 PARTICIPANTS
             FIGURE 39 COMPANY EVALUATION MATRIX: MEDICAL FOAM MARKET
             10.5.5 COMPANY FOOTPRINT
             FIGURE 40 MEDICAL FOAM MARKET: COMPANY FOOTPRINT
                         TABLE 312 MEDICAL FOAM MARKET: APPLICATION FOOTPRINT
                         TABLE 313 MEDICAL FOAM MARKET: MATERIAL FOOTPRINT
                         TABLE 314 MEDICAL FOAM MARKET: COMPANY REGION FOOTPRINT
     10.6 START-UP/SME EVALUATION MATRIX 
             10.6.1 PROGRESSIVE COMPANIES
             10.6.2 RESPONSIVE COMPANIES
             10.6.3 DYNAMIC COMPANIES
             10.6.4 STARTING BLOCKS
                        FIGURE 41 START-UP/SME EVALUATION MATRIX: MEDICAL FOAM MARKET
             10.6.5 COMPETITIVE BENCHMARKING
                         TABLE 315 MEDICAL FOAM MARKET: DETAILED LIST OF KEY START-UPS/SMES
                         TABLE 316 MEDICAL FOAM MARKET: COMPETITIVE BENCHMARKING OF KEY START-UPS/SMES
     10.7 COMPETITIVE SCENARIO 
             TABLE 317 MEDICAL FOAM MARKET: DEALS, 2019–2023
             TABLE 318 MEDICAL FOAM MARKET: OTHERS, 2019–2023
 
11 COMPANY PROFILES (Page No. - 230)
(Business Overview, Products/Solutions/Services Offered, Recent Developments, and MnM View (Key strengths/Right to Win, Strategic Choices Made, and Weaknesses and Competitive Threats))*
     11.1 KEY PLAYERS 
             11.1.1 THE DOW CHEMICAL COMPANY
                         TABLE 319 THE DOW CHEMICAL COMPANY: COMPANY OVERVIEW
                         FIGURE 42 THE DOW CHEMICAL COMPANY: COMPANY SNAPSHOT
                         TABLE 320 THE DOW CHEMICAL COMPANY: PRODUCTS OFFERED
                         TABLE 321 THE DOW CHEMICAL COMPANY: DEALS
                         TABLE 322 THE DOW CHEMICAL COMPANY: OTHERS
             11.1.2 SEKISUI CHEMICAL CO., LTD
                         TABLE 323 SEKISUI CHEMICAL CO., LTD: COMPANY OVERVIEW
                         FIGURE 43 SEKISUI CHEMICAL CO., LTD: COMPANY SNAPSHOT
                         TABLE 324 SEKISUI CHEMICAL CO., LTD: PRODUCTS OFFERED
                         TABLE 325 SEKISUI CHEMICAL CO., LTD: DEALS
                         TABLE 326 SEKISUI CHEMICAL CO., LTD: OTHERS
             11.1.3 HUNTSMAN CORPORATION
                         TABLE 327 HUNTSMAN CORPORATION: COMPANY OVERVIEW
                         FIGURE 44 HUNTSMAN CORPORATION: COMPANY SNAPSHOT
                         TABLE 328 HUNTSMAN CORPORATION: PRODUCTS OFFERED
                         TABLE 329 HUNTSMAN CORPORATION: DEALS
                         TABLE 330 HUNTSMAN CORPORATION: OTHERS
             11.1.4 TRELLEBORG AB
                         TABLE 331 TRELLEBORG AB: COMPANY OVERVIEW
                         FIGURE 45 TRELLEBORG AB: COMPANY SNAPSHOT
                         TABLE 332 TRELLEBORG AB: PRODUCTS OFFERED
                         TABLE 333 TRELLEBORG AB: DEALS
                         TABLE 334 TRELLEBORG AB: OTHERS
             11.1.5 BASF SE
                         TABLE 335 BASF SE: COMPANY OVERVIEW
                         FIGURE 46 BASF SE: COMPANY SNAPSHOT
                         TABLE 336 BASF SE: PRODUCTS OFFERED
                         TABLE 337 BASF SE: DEALS
                         TABLE 338 BASF: OTHERS
             11.1.6 RECTICEL NV/SA
                         TABLE 339 RECTICEL NV/SA: COMPANY OVERVIEW
                         FIGURE 47 RECTICEL NV/SA: COMPANY SNAPSHOT
                         TABLE 340 RECTICEL NV/SA: PRODUCTS OFFERED
                         TABLE 341 RECTICEL NV/SA: DEALS
                         TABLE 342 RECTICEL NV/SA: OTHERS
             11.1.7 UFP TECHNOLOGIES, INC.
                         TABLE 343 UFP TECHNOLOGIES, INC.: COMPANY OVERVIEW
                         FIGURE 48 UFP TECHNOLOGIES, INC.: COMPANY SNAPSHOT
                         TABLE 344 UFP TECHNOLOGIES, INC.: PRODUCTS OFFERED
                         TABLE 345 UFP TECHNOLOGIES: DEALS
                         TABLE 346 UFP TECHNOLOGIES: OTHERS
             11.1.8 ARMACELL
                         TABLE 347 ARMACELL: COMPANY OVERVIEW
                         FIGURE 49 ARMACELL: COMPANY SNAPSHOT
                         TABLE 348 ARMACELL: PRODUCTS OFFERED
                         TABLE 349 ARMACELL: OTHERS
             11.1.9 ROGERS CORPORATION
                         TABLE 350 ROGERS CORPORATION: COMPANY OVERVIEW
                         FIGURE 50 ROGERS CORPORATION: COMPANY SNAPSHOT
                         TABLE 351 ROGERS CORPORATION: PRODUCTS OFFERED
                         TABLE 352 ROGERS CORPORATION: DEALS
                         TABLE 353 ROGERS CORPORATION: OTHERS
             11.1.10 FREUDENBERG GROUP
                         TABLE 354 FREUDENBERG GROUP: COMPANY OVERVIEW
                         FIGURE 51 FREUDENBERG GROUP: COMPANY SNAPSHOT
                         TABLE 355 FREUDENBERG GROUP: PRODUCTS OFFERED
                         TABLE 356 FREUDENBERG GROUP: DEALS
                         TABLE 357 FREUDENBERG GROUP: OTHERS
             11.1.11 INOAC CORPORATION
                         TABLE 358 INOAC CORPORATION: COMPANY OVERVIEW
                         TABLE 359 INOAC CORPORATION: PRODUCTS OFFERED
             11.1.12 FXI HOLDINGS, INC.
                         TABLE 360 FXI HOLDINGS, INC.: COMPANY OVERVIEW
                         TABLE 361 FXI HOLDINGS, INC.: PRODUCTS OFFERED
             11.1.13 MOLNLYCKE HEALTH CARE
                         TABLE 362 MOLNLYCKE HEALTH CARE: COMPANY OVERVIEW
                         TABLE 363 MOLNLYCKE HEALTH CARE: PRODUCTS OFFERED
             11.1.14 VPC GROUP INC.
                         TABLE 364 VPC GROUP INC.: COMPANY OVERVIEW
                         TABLE 365 VPC GROUP INC.: PRODUCTS OFFERED
             11.1.15 THE WOODBRIDGE GROUP
                         TABLE 366 THE WOODBRIDGE GROUP: COMPANY OVERVIEW
                         TABLE 367 THE WOODBRIDGE GROUP: PRODUCTS OFFERED
             11.1.16 GENERAL PLASTICS MANUFACTURING COMPANY
                         TABLE 368 GENERAL PLASTICS MANUFACTURING COMPANY: COMPANY OVERVIEW
                         TABLE 369 GENERAL PLASTICS MANUFACTURING COMPANY: PRODUCTS OFFERED
             11.1.17 POLYTAG (BELA TAGRA)
                         TABLE 370 POLYTAG (BELA TAGRA): COMPANY OVERVIEW
                         TABLE 371 POLYTAG (BELA TAGRA): PRODUCTS OFFERED
             11.1.18 POREX CORPORATION
                         TABLE 372 POREX CORPORATION: COMPANY OVERVIEW
                         TABLE 373 POREX CORPORATION: PRODUCTS OFFERED
     11.2 OTHER PLAYERS 
             11.2.1 FUTURE FOAM, INC.
             11.2.2 VIM TECHNOLOGY LTD
             11.2.3 FOAM TECHNIQUES LTD
             11.2.4 WISCONSIN FOAM PRODUCTS
             11.2.5 RYNEL, INC.
             11.2.6 SHANGHAI ZHONGWEI NEW MATERIALS CO., LTD
             11.2.7 JANCO INC.
             11.2.8 CUSTOM FOAM SYSTEMS LTD
 
*Details on Business Overview, Products/Solutions/Services Offered, Recent Developments, and MnM View (Key strengths/Right to Win, Strategic Choices Made, and Weaknesses and Competitive Threats) might not be captured in case of unlisted companies.
 
12 ADJACENT AND RELATED MARKETS (Page No. - 294)
     12.1 INTRODUCTION 
     12.2 LIMITATIONS 
     12.3 MEDICAL FOAM: INTERCONNECTED MARKETS 
             12.3.1 POLYURETHANE FOAM MARKET
                        12.3.1.1 Market definition
                        12.3.1.2 Market overview
     12.4 POLYURETHANE FOAM MARKET, BY TYPE 
             12.4.1 FLEXIBLE FOAM
                        12.4.1.1 Increasing population leading to growth of flexible foam segment
                        12.4.1.2 Key applications of flexible foams
                                     12.4.1.2.1 Cushioning
                                     12.4.1.2.2 Apparel padding
                                     12.4.1.2.3 Filtration
                                     12.4.1.2.4 Other applications
             12.4.2 RIGID FOAM
                        12.4.2.1 Surging demand for insulation in residential and commercial buildings fueling growth
                        12.4.2.2 Key applications of rigid foams
                                     12.4.2.2.1 Building and transport insulation
                                     12.4.2.2.2 Appliances insulation (refrigerators and freezers)
                                     12.4.2.2.3 Buoyancy and in-fill
             12.4.3 SPRAY FOAMS
                        12.4.3.1 Excellent heat, sound, and water insulation properties  of spray foams to drive consumption
                        12.4.3.2 Key applications of spray foams
                                     12.4.3.2.1 Building insulation
                                     12.4.3.2.2 Attics
                                     12.4.3.2.3 Roofing
                                     12.4.3.2.4 Interior wall cavities
                                     12.4.3.2.5 Industrial cool stores
                                     12.4.3.2.6 Marine
                                                     TABLE 374 POLYURETHANE FOAM MARKET, BY TYPE, 2018–2022 (KILOTON)
                                                     TABLE 375 POLYURETHANE FOAM MARKET, BY TYPE, 2023–2028 (KILOTON)
                                                     TABLE 376 POLYURETHANE FOAM MARKET, BY TYPE, 2018–2022 (USD MILLION)
                                                     TABLE 377 POLYURETHANE FOAM MARKET, BY TYPE, 2023–2028 (USD MILLION)
 
13 APPENDIX (Page No. - 300)
     13.1 DISCUSSION GUIDE 
     13.2 KNOWLEDGESTORE: MARKETSANDMARKETS’  SUBSCRIPTION PORTAL 
     13.3 CUSTOMIZATION OPTIONS 
     13.4 RELATED REPORTS 
     13.5 AUTHOR DETAILS

The study involved four major activities in estimating the current medical foam market size—exhaustive secondary research collected information on the market, peer, and parent markets. The next step was to validate these findings, assumptions, and measures with industry experts across the value chain of medical foam through primary research. Both top-down and bottom-up approaches were employed to estimate the total market size. After that, market breakdown and data triangulation were used to estimate the size of the segments and sub-segments of the market.

Secondary Research

The research methodology used to estimate and forecast the access control market begins with capturing data on the revenues of key vendors in the market through secondary research. In the secondary research process, various secondary sources, such as Hoovers, Bloomberg BusinessWeek, Factiva, World Bank, and Industry Journals, were referred to to identify and collect information for this study. These secondary sources included annual reports, press releases & investor presentations of companies, white papers, certified publications, articles by recognized authors, notifications by regulatory bodies, trade directories, and databases. Vendor offerings have also been taken into consideration to determine market segmentation.

Primary Research

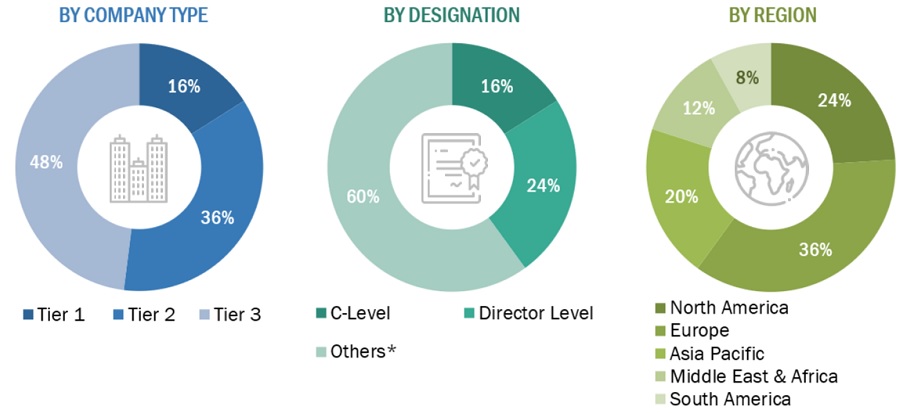
The medical foam market comprises several stakeholders in the supply chain, such as manufacturers, equipment manufacturers, traders, associations, and regulatory organizations. The development of various end-use industries characterizes the demand side of this market. Various primary sources from the supply and demand sides of the market were interviewed to obtain qualitative and quantitative information. Following is the breakdown of the primary respondents:
Medical Foam Market Size, and Share

To know about the assumptions considered for the study, download the pdf brochure

Market Size Estimation

The top-down and bottom-up approaches were used to estimate and validate the total size of the medical foam market. These methods were also used extensively to determine the market size of various segments. The research methodology used to estimate the market size included the following:

  • The key players were identified through extensive primary and secondary research.
  • The value chain and market size of the medical foam market, in terms of value and volume, were determined through primary and secondary research.
  • All percentage shares, splits, and breakdowns were determined using secondary sources and verified through primary sources.
  • All possible parameters that affect the market covered in this research study were accounted for, viewed in extensive detail, verified through primary research, and analyzed to obtain the final quantitative and qualitative data.
  • The research included the study of reports, reviews, and newsletters of top market players, along with extensive interviews for opinions from key leaders, such as CEOs, directors, and marketing executives.

Global Medical Foam Market Size: Bottom-Up Approach

Medical Foam Market Size, and Share

To know about the assumptions considered for the study, Request for Free Sample Report

Global Medical Foam Market Size: Top-Down Approach

Medical Foam Market Size, and Share

Data Triangulation

After arriving at the overall market size using the market size estimation processes as explained above, the market was split into several segments and sub-segments. Data triangulation and market breakdown procedures were employed to complete the overall market engineering process and determine each market segment’s and subsegment’s exact statistics. The market size was calculated globally by summing up the country-level and regional-level data.

Market Definition

The global medical foam market refers to the collective commercial landscape involving producing, distributing, and consuming foam-based materials specifically designed and utilized within the healthcare and medical industry. This market encapsulates various foam types—both open and closed-cell structures—engineered to meet stringent medical standards, offering biocompatibility, non-toxicity, sterilization capabilities, resistance to microbial growth, and tolerance to mild chemicals.

These foams find extensive application across diverse segments within the medical field, including but not limited to bedding and cushioning, packaging for medical supplies, components for medical devices, and specialized uses in prosthetics and wound care. Materials utilized in the manufacturing of medical foams span a range of polymers, latex, and metals, each tailored to meet specific medical requirements and standards.

Key Stakeholder

  • Manufacturers of medical foam
  • Traders, distributors, and suppliers of medical foam
  • Government and research organizations
  • Associations and industrial bodies
  • Research and consulting firms
  • R&D institutions
  • Environment support agencies
  • Investment banks and private equity firms

Report Objectives:

  • To define, describe, and forecast the size of the global medical foam market in terms of value and volume
  • To provide detailed information regarding the key factors, such as drivers, restraints, opportunities, and industry-specific challenges, influencing the growth of the medical foam market
  • To analyze and forecast the size of various segments (type & nature) of the medical foam market based on five major regions—North America, Europe, Asia Pacific, South America, Middle East & Africa—along with key countries in each of these regions
  • To analyze recent developments and competitive strategies, such as expansions, new product developments, partnerships, and acquisitions, product launches to draw the competitive landscape of the market
  • To strategically profile the key players in the market and comprehensively analyze their core competencies

Available Customizations:

With the given market data, MarketsandMarkets offers customizations according to client-specific needs.

The following customization options are available for the report:

  • Additional country-level analysis of the medical foam market
  • Profiling of additional market players (up to 5)

Product Analysis

  • Product matrix, which gives a detailed comparison of the product portfolio of each company.
Custom Market Research Services

We will customize the research for you, in case the report listed above does not meet with your exact requirements. Our custom research will comprehensively cover the business information you require to help you arrive at strategic and profitable business decisions.

Request Customization
Report Code
CH 4777
Published ON
Dec, 2023
Choose License Type
BUY NOW
  • SHARE
X
Request Customization
Speak to Analyst
Speak to Analyst
OR FACE-TO-FACE MEETING
PERSONALIZE THIS RESEARCH
  • Triangulate with your Own Data
  • Get Data as per your Format and Definition
  • Gain a Deeper Dive on a Specific Application, Geography, Customer or Competitor
  • Any level of Personalization
REQUEST A FREE CUSTOMIZATION
LET US HELP YOU!
  • What are the Known and Unknown Adjacencies Impacting the Medical Foam Market
  • What will your New Revenue Sources be?
  • Who will be your Top Customer; what will make them switch?
  • Defend your Market Share or Win Competitors
  • Get a Scorecard for Target Partners
CUSTOMIZED WORKSHOP REQUEST
  • Call Us
  • +1-888-600-6441 (Corporate office hours)
  • +1-888-600-6441 (US/Can toll free)
  • +44-800-368-9399 (UK office hours)
CONNECT WITH US
ABOUT TRUST ONLINE
©2024 MarketsandMarkets Research Private Ltd. All rights reserved
DMCA.com Protection Status
Website Feedback