Medical Nitrous Oxide Market

Medical Nitrous Oxide Market by Product (Gas, Liquid), Application (Anaesthesia, Pain, Cryosurgery, Surgical Insufflation), End User (Hospital, Home healthcare, Academic, Research Institution), Key Stakeholder & Buying Criteria - Global Forecast to 2029

Report Code: MD 8935 Feb, 2024, by marketsandmarkets.com

The global medical nitrous oxide market in terms of revenue was estimated to be worth $1.8 Billion in 2023 and is poised to reach $2.8 Billion by 2029, growing at a CAGR of 6.6% from 2023 to 2029. The new research study consists of an industry trend analysis of the market. The new research study consists of industry trends, pricing analysis, patent analysis, conference and webinar materials, key stakeholders, and buying behaviour in the market. The primary impetus behind the medical nitrous oxide market stems from various factors, including the expanding elderly population, improvements in healthcare infrastructure, the desire for non-invasive pain relief methods, and the presence of supportive regulations and standards governing the utilization of medical gases. Furthermore, the escalating volume of surgical procedures, observed in both developed and developing nations, creates a favorable prospect for the heightened adoption of medical nitrous oxide in anesthesia and analgesia, presenting additional avenues for industry expansion.

Global Medical Nitrous Oxide Market Trend

Nitrous Oxide Market

To know about the assumptions considered for the study, Request for Free Sample Report

Nitrous Oxide Market

Brain Monitoring Market Dynamics

Driver: Improvements in healthcare infrastructure

Enhancements in healthcare infrastructure serve as a catalyst for the growth of the medical nitrous oxide market. The continuous improvement and development of healthcare facilities contribute significantly to the increased demand for medical nitrous oxide. This is attributed to the heightened capability of upgraded healthcare infrastructure to support advanced medical procedures, including surgeries and pain management, wherein nitrous oxide plays a crucial role. As healthcare systems evolve and modernize, the demand for medical nitrous oxide is expected to rise proportionately, aligning with the evolving needs and standards of sophisticated healthcare delivery.

Restraint: Availability of alternatives

The presence of alternative solutions poses a restraint to the medical nitrous oxide market. The availability of other options for anesthesia and pain management in healthcare settings creates a competitive environment for medical nitrous oxide. Healthcare providers may opt for alternative methods based on factors such as patient preferences or specific medical requirements, impacting the market demand for nitrous oxide. This competition from alternative solutions represents a challenge for the widespread adoption of medical nitrous oxide in certain medical procedures.

Opportunity: Growing demand for pain management

The increasing demand for pain management presents a significant opportunity for the medical nitrous oxide market. As the need for effective and non-invasive pain relief methods continues to grow, medical nitrous oxide stands poised to capitalize on this trend. The unique analgesic properties of nitrous oxide make it a valuable asset in pain management within healthcare settings. This rising demand positions medical nitrous oxide as a preferred choice for healthcare professionals seeking efficient solutions for pain relief, thereby contributing to the expansion and opportunities within the market.

Challenge: Limited awareness

Limited awareness poses a challenge to the medical nitrous oxide market. The insufficient understanding and awareness among healthcare professionals and patients regarding the benefits and safety of nitrous oxide hinder its widespread adoption for medical and dental procedures. Overcoming this challenge requires targeted educational initiatives to enhance awareness and promote the advantages of using nitrous oxide in various healthcare settings. Increasing knowledge within the medical community and among patients is crucial for fostering greater acceptance and utilization of nitrous oxide, addressing the challenge of limited awareness in the market.

Ecosystem of Medical Nitrous Oxide Industry:

Nitrous Oxide Market Ecosystem

The gasesous segment of medical nitrous oxide industry is expected to account for the largest market share in 2023

In 2023, the medical nitrous oxide market experienced segmentation into gaseous and liquid states based on products, with the gaseous segment taking the lead. The prominence of the gaseous state within the medical nitrous oxide market can be credited to its adaptability in various applications, notably for anesthesia and analgesia in surgical procedures. The inclination towards the gaseous form in medical settings is influenced by its easy administration, accurate dosage control, and rapid onset of action.

The anesthesia and pain relief segment of medical nitrous oxide industry to register the highest growth rate in the forecast period.

In 2023, the medical nitrous oxide market was classified into segments including anesthesia and pain relief, cryosurgery, and surgical insufflation. The anesthesia and pain relief segment emerged as the dominant category, holding the largest market share. The supremacy of anesthesia and pain relief applications within the medical nitrous oxide market is ascribed to their pivotal roles in both surgical and medical procedures. Nitrous oxide, well-regarded for its anesthetic and analgesic properties, finds widespread adoption in healthcare settings due to its effectiveness in inducing conscious sedation and alleviating pain during various medical interventions. This dominance is evident in the extensive use of nitrous oxide by healthcare professionals, leveraging its ability to provide rapid and controllable sedation, thus significantly enhancing patient comfort and procedural success.

The home healthcare segment of medical nitrous oxide industry is expected to register the highest growth during the forecast period

The medical nitrous oxide market is classified by end user into hospitals, home healthcare, and academic and research institutions. As of 2023, the home healthcare segment is expected to register the highest growth during the forecast period . This is primarily due to evolving healthcare trends and an increasing preference for healthcare services delivered in the comfort of patients' homes. The demand for medical nitrous oxide in home healthcare settings is rising as it becomes a viable option for pain management and certain medical procedures outside traditional healthcare facilities. The convenience, flexibility, and personalized nature of home healthcare contribute to the substantial growth of the medical nitrous oxide market within this particular segment.

North America to be the largest regional segment in the medical nitrous oxide industry during the forecast period.

Based on the region, the global medical nitrous oxide market is divided into North America, Europe, Asia Pacific, Latin America, and Middle East & Africa. North America is expected to hold the largest share of the market in 2023. The Asia Pacific region is anticipated to experience the most rapid growth during the forecast period. The significant expansion of the market in the Asia Pacific can be attributed to the a rise in surgical procedures, dynamic growth in healthcare infrastructure, and an increasing awareness of the advantages of nitrous oxide. These factors collectively contribute to an increased demand for medical nitrous oxide in the APAC region.

Nitrous Oxide Market by Region

To know about the assumptions considered for the study, download the pdf brochure

The medical nitrous oxide market is dominated by a few globally established players such as Southern Gas Limited (India), Jiangsu Huazhong Gas Co., Ltd. (China), American Welding & Gas (US), Carbide and Chemicals (India), nexAir (US), Air Liquide (Paris), Linde plc (Ireland), Messer SE & CO. KGAA (Germany), SOL SpA (Italy), Chengdu Taiyu Industrial Gases Co., Ltd. (China),Oxygen & Argon Works Ltd (Israel), Matheson Tri-Gas Inc. (US), CalOx (US), Steelman Gases Pvt. Ltd. (India), Earlbeck Gases & Technology (US), Ellenbarrie Industrial Gases (India), Norco Inc. (US), and Gulf Cryo (UAE).

Scope of the Medical Nitrous Oxide Industry

Report Metric

Details

Market Revenue in 2023

$1.8 Billion

Projected Revenue by 2029

$2.8 Billion

Revenue Rate

Poised to Grow at a CAGR of 6.6%

Market Driver

Improvements in healthcare infrastructure

Market Opportunity

Growing demand for pain management

The study categorizes the medical nitrous oxide market to forecast revenue and analyze trends in each of the following submarkets:

By Product

  • Gaseous State
  • Liquid State

By Application

  • Anesthesia and Pain Relief
  • Cryosurgery
  • Surgical Insufflation

By End User

  • Hospitals
  • Home Healthcare
  • Academic & Research Institutions

By Region

  • North America
    • US
    • Canada
  • Europe
    • Germany
    • UK
    • France
    • Italy
    • Spain
    • Rest of Europe
  • Asia Pacific
    • China
    • Japan
    • India
    • Rest of Asia Pacific
  • Latin America
  • Middle East & Africa

Recent Developments of Medical Nitrous Oxide Industry:

  • In December 2023, Linde Healthcare has partnered with the Air Force Materiel Command to supply liquid oxygen and nitrogen to healthcare, manufacturing, metals, and mining.
  • In July 2023, Air liquid started a project to transform the Home Healthcare activity in France to align it with the needs and expectations of patients and healthcare professionals and adapt its business model to meet the challenges of the country's healthcare system.

Frequently Asked Questions (FAQ):

To speak to our analyst for a discussion on the above findings, click Speak to Analyst

TABLE OF CONTENTS
 
1 INTRODUCTION (Page No. - 29)
    1.1 STUDY OBJECTIVES 
    1.2 MARKET DEFINITION 
           1.2.1 INCLUSIONS AND EXCLUSIONS
    1.3 MARKETS COVERED 
          FIGURE 1 MEDICAL NITROUS OXIDE MARKET SEGMENTATION
           1.3.1 REGIONAL SEGMENTATION
           1.3.2 YEARS CONSIDERED
           1.3.3 CURRENCY CONSIDERED
    1.4 STAKEHOLDERS 
    1.5 RECESSION IMPACT 
 
2 RESEARCH METHODOLOGY (Page No. - 33)
    2.1 RESEARCH DATA 
          FIGURE 2 RESEARCH DESIGN
           2.1.1 SECONDARY DATA
                    2.1.1.1 Key data from secondary sources
           2.1.2 PRIMARY RESEARCH
                    2.1.2.1 Primary sources
                    2.1.2.2 Key data from primary sources
                    2.1.2.3 Key industry insights
                    2.1.2.4 Breakdown of primary interviews: by company type, designation, and region
    2.2 MARKET SIZE ESTIMATION METHODOLOGY 
          FIGURE 3 RESEARCH METHODOLOGY: HYPOTHESIS BUILDING
    2.3 MARKET ESTIMATION 
          FIGURE 4 MARKET SIZE ESTIMATION: REVENUE SHARE ANALYSIS
          FIGURE 5 MEDICAL NITROUS OXIDE MARKET: REVENUE SHARE ANALYSIS ILLUSTRATION FOR AIR LIQUIDE S.A.
          FIGURE 6 MEDICAL NITROUS OXIDE MARKET: DEMAND-SIDE MODELING
          FIGURE 7 CAGR PROJECTIONS FROM ANALYSIS OF DRIVERS, RESTRAINTS, OPPORTUNITIES, AND CHALLENGES IN MEDICAL NITROUS OXIDE MARKET (2023–2029)
          FIGURE 8 CAGR PROJECTIONS: SUPPLY-SIDE ANALYSIS
    2.4 MARKET DATA ESTIMATION AND TRIANGULATION 
          FIGURE 9 DATA TRIANGULATION METHODOLOGY
    2.5 STUDY ASSUMPTIONS 
    2.6 LIMITATIONS 
           2.6.1 SCOPE-RELATED LIMITATIONS
           2.6.2 METHODOLOGY-RELATED LIMITATIONS
    2.7 RISK ASSESSMENT 
          TABLE 1 RISK ASSESSMENT: MEDICAL NITROUS OXIDE MARKET
    2.8 MEDICAL NITROUS OXIDE MARKET: RECESSION IMPACT 
 
3 EXECUTIVE SUMMARY (Page No. - 47)
    FIGURE 10 MEDICAL NITROUS OXIDE MARKET, BY TYPE, 2023 VS. 2029 (USD MILLION)
    FIGURE 11 MEDICAL NITROUS OXIDE MARKET, BY APPLICATION, 2023 VS. 2029 (USD MILLION)
    FIGURE 12 MEDICAL NITROUS OXIDE MARKET, BY END USER, 2023 VS. 2029 (USD MILLION)
    FIGURE 13 GEOGRAPHICAL SNAPSHOT OF MEDICAL NITROUS OXIDE MARKET
 
4 PREMIUM INSIGHTS (Page No. - 50)
    4.1 MEDICAL NITROUS OXIDE MARKET OVERVIEW 
          FIGURE 14 INCREASING NUMBER OF SURGERIES AND DENTAL PROCEDURES TO DRIVE MARKET GROWTH
    4.2 NORTH AMERICA: MEDICAL NITROUS OXIDE MARKET, BY TYPE AND COUNTRY (2022) 
          FIGURE 15 LIQUID NITROUS OXIDE SEGMENT ACCOUNTED FOR LARGEST SHARE OF NORTH AMERICAN MARKET IN 2022
    4.3 MEDICAL NITROUS OXIDE MARKET: GEOGRAPHIC GROWTH OPPORTUNITIES 
          FIGURE 16 ASIA PACIFIC REGION TO REGISTER HIGHEST GROWTH RATE DURING FORECAST PERIOD
    4.4 MEDICAL NITROUS OXIDE MARKET: REGIONAL MIX 
          FIGURE 17 ASIA PACIFIC MARKET TO GROW AT HIGHEST CAGR DURING FORECAST PERIOD
    4.5 MEDICAL NITROUS OXIDE MARKET: DEVELOPED VS. EMERGING ECONOMIES 
          FIGURE 18 EMERGING ECONOMIES TO REGISTER HIGHER GROWTH RATES DURING FORECAST PERIOD
 
5 MARKET OVERVIEW (Page No. - 53)
    5.1 INTRODUCTION 
    5.2 MARKET DYNAMICS 
          FIGURE 19 MEDICAL NITROUS OXIDE MARKET: DRIVERS, RESTRAINTS, OPPORTUNITIES, AND CHALLENGES
          TABLE 2 MARKET DYNAMICS: IMPACT ANALYSIS
           5.2.1 DRIVERS
                    5.2.1.1 Increasing number of surgeries and dental procedures
                    5.2.1.2 Growing adoption of nitrous oxide across various medical specialties
                    5.2.1.3 Rising geriatric population and subsequent increase in prevalence of chronic diseases
                                FIGURE 20 GLOBAL GERIATRIC POPULATION, BY REGION, 2010–2030 (% OF TOTAL POPULATION)
                    5.2.1.4 Growing demand for home healthcare
           5.2.2 RESTRAINTS
                    5.2.2.1 Potential risks associated with nitrous oxide misuse
                    5.2.2.2 Availability of alternatives
           5.2.3 OPPORTUNITIES
                    5.2.3.1 Rising demand for pain management
                                FIGURE 21 PREVALENCE OF CHRONIC PAIN AND HIGH-IMPACT CHRONIC PAIN AMONG ADULTS IN US, 2019–2021
                    5.2.3.2 Technological advancements
           5.2.4 CHALLENGES
                    5.2.4.1 Changes in calibration standards
                    5.2.4.2 Lack of awareness
    5.3 INDUSTRY TRENDS 
           5.3.1 ADVANCEMENTS IN NITROUS OXIDE DELIVERY SYSTEMS
           5.3.2 GROWING DEMAND FOR MINIMALLY INVASIVE PROCEDURES
    5.4 TECHNOLOGY ANALYSIS 
           5.4.1 KEY TECHNOLOGIES
                    5.4.1.1 Nitrous oxide delivery systems
                    5.4.1.2 Monitoring and control systems
                    5.4.1.3 Technological integration in anesthesia machines
           5.4.2 COMPLEMENTARY TECHNOLOGIES
                    5.4.2.1 Patient monitoring devices
                    5.4.2.2 Smart devices and connectivity
           5.4.3 ADJACENT TECHNOLOGIES
                    5.4.3.1 Advanced anesthetic agents
                    5.4.3.2 Surgical robotics
    5.5 PRICING ANALYSIS 
           5.5.1 AVERAGE SELLING PRICE TREND OF MEDICAL NITROUS OXIDE, BY PRODUCT
                    TABLE 3 AVERAGE SELLING PRICE OF MEDICAL NITROUS OXIDE, BY PRODUCT TYPE (USD)
           5.5.2 AVERAGE SELLING PRICE TREND, BY REGION
    5.6 PORTER’S FIVE FORCES ANALYSIS 
          TABLE 4 PORTER’S FIVE FORCES ANALYSIS
           5.6.1 INTENSITY OF COMPETITIVE RIVALRY
           5.6.2 BARGAINING POWER OF SUPPLIERS
           5.6.3 BARGAINING POWER OF BUYERS
           5.6.4 THREAT OF SUBSTITUTES
           5.6.5 THREAT OF NEW ENTRANTS
    5.7 TARIFF & REGULATORY ANALYSIS 
           5.7.1 TARIFF FOR MEDICAL NITROUS OXIDE
           5.7.2 REGULATORY BODIES, GOVERNMENT AGENCIES, AND OTHER ORGANIZATIONS
           5.7.3 NORTH AMERICA
                    5.7.3.1 US
                                TABLE 5 US: REGULATORY BODIES, GOVERNMENT AGENCIES, AND OTHER ORGANIZATIONS
                    5.7.3.2 Canada
                                TABLE 6 CANADA: REGULATORY BODIES, GOVERNMENT AGENCIES, AND OTHER ORGANIZATIONS
           5.7.4 EUROPE
                    TABLE 7 EUROPE: REGULATORY BODIES, GOVERNMENT AGENCIES AND OTHER ORGANIZATIONS
           5.7.5 ASIA PACIFIC
                    5.7.5.1 Japan
                                TABLE 8 JAPAN: REGULATORY BODIES, GOVERNMENT AGENCIES, AND OTHER ORGANIZATIONS
                    5.7.5.2 China
                                TABLE 9 CHINA: STANDARDS FOR MEDICAL GAS EQUIPMENT
                                TABLE 10 CHINA: REGULATORY BODIES, GOVERNMENT AGENCIES, AND OTHER ORGANIZATIONS
                    5.7.5.3 India
                                TABLE 11 INDIA: STANDARDS FOR MEDICAL GAS EQUIPMENT
                                TABLE 12 INDIA: REGULATORY BODIES, GOVERNMENT AGENCIES, AND OTHER ORGANIZATIONS
           5.7.6 LATIN AMERICA AND MIDDLE EAST & AFRICA
                    TABLE 13 LATIN AMERICA AND MIDDLE EAST & AFRICA: REGULATORY BODIES, GOVERNMENT AGENCIES, AND OTHER ORGANIZATIONS
    5.8 VALUE CHAIN ANALYSIS 
          FIGURE 22 VALUE CHAIN ANALYSIS
    5.9 ECOSYSTEM ANALYSIS 
          TABLE 14 MEDICAL NITROUS OXIDE MARKET: ECOSYSTEM MAPPING
          FIGURE 23 MEDICAL NITROUS OXIDE MARKET: ECOSYSTEM
    5.10 CASE STUDY ANALYSIS 
           5.10.1 CASE STUDY: EAST LANCASHIRE TEACHING HOSPITAL NHS FOUNDATION TRUST (ELHT)
    5.11 PATENT ANALYSIS 
           5.11.1 PATENT PUBLICATION TRENDS
                     FIGURE 24 PATENT PUBLICATION TRENDS, 2014–2024
           5.11.2 JURISDICTION ANALYSIS: TOP APPLICANTS (COUNTRIES) FOR MEDICAL NITROUS OXIDE PATENTS (2014–2024)
                     TABLE 15 JURISDICTION ANALYSIS: TOP APPLICANT COUNTRIES FOR MEDICAL NITROUS OXIDE PATENTS
           5.11.3 MEDICAL NITROUS OXIDE MARKET: TOP APPLICANTS
                     FIGURE 25 TOP APPLICANTS FOR MEDICAL NITROUS OXIDE PATENTS (2014–2024)
    5.12 KEY STAKEHOLDERS & BUYING CRITERIA 
           5.12.1 KEY STAKEHOLDERS IN BUYING PROCESS
                     TABLE 16 INFLUENCE OF STAKEHOLDERS ON BUYING PROCESS FOR MEDICAL NITROUS OXIDE PRODUCTS
                     FIGURE 26 INFLUENCE OF STAKEHOLDERS ON BUYING PROCESS FOR END USERS
                     TABLE 17 INFLUENCE OF STAKEHOLDERS ON BUYING PROCESS FOR MEDICAL NITROUS OXIDE END USERS
           5.12.2 BUYING CRITERIA
                     FIGURE 27 KEY BUYING CRITERIA FOR END USERS IN MEDICAL NITROUS OXIDE MARKET
                     TABLE 18 KEY BUYING CRITERIA FOR MEDICAL NITROUS OXIDE MARKET
    5.13 KEY CONFERENCES & EVENTS IN 2024 
           TABLE 19 MEDICAL NITROUS OXIDE MARKET: DETAILED LIST OF CONFERENCES & EVENTS
    5.14 TRADE ANALYSIS 
           5.14.1 TRADE ANALYSIS FOR MEDICAL NITROUS OXIDE
                     FIGURE 28 PRODUCT IMPORTS UNDER HSN CODE 281129, BY COUNTRY, 2022 (USD THOUSAND)
                     FIGURE 29 PRODUCT EXPORTS UNDER HSN CODE 281129, BY COUNTRY, 2022 (USD THOUSAND)
    5.15 TRENDS/DISRUPTIONS IMPACTING CUSTOMERS’ BUSINESSES 
           FIGURE 30 REVENUE SHIFT IN MEDICAL NITROUS OXIDE MARKET
    5.16 UNMET NEEDS ANALYSIS 
           TABLE 20 UNMET NEEDS IN MEDICAL NITROUS OXIDE MARKET
           5.16.1 END-USER EXPECTATIONS
                     TABLE 21 END-USER EXPECTATIONS IN MEDICAL NITROUS OXIDE MARKET
 
6 MEDICAL NITROUS OXIDE MARKET, BY TYPE (Page No. - 83)
    6.1 INTRODUCTION 
          TABLE 22 MEDICAL NITROUS OXIDE MARKET, BY TYPE, 2018–2021 (USD MILLION)
          TABLE 23 MEDICAL NITROUS OXIDE MARKET, BY TYPE, 2022–2029 (USD MILLION)
    6.2 LIQUID NITROUS OXIDE 
           6.2.1 RISING CRYOTHERAPY APPLICATIONS TO DRIVE MARKET
                    TABLE 24 LIQUID MEDICAL NITROUS OXIDE MARKET, BY COUNTRY, 2018–2021 (USD MILLION)
                    TABLE 25 LIQUID MEDICAL NITROUS OXIDE MARKET, BY COUNTRY, 2022–2029 (USD MILLION)
    6.3 GASEOUS NITROUS OXIDE 
           6.3.1 PRECISE DOSAGE CONTROL AND PORTABILITY TO DRIVE MARKET GROWTH
                    TABLE 26 GASEOUS MEDICAL NITROUS OXIDE MARKET, BY COUNTRY, 2018–2021 (USD MILLION)
                    TABLE 27 GASEOUS MEDICAL NITROUS OXIDE MARKET, BY COUNTRY, 2022–2029 (USD MILLION)
 
7 MEDICAL NITROUS OXIDE MARKET, BY APPLICATION (Page No. - 89)
    7.1 INTRODUCTION 
          TABLE 28 MEDICAL NITROUS OXIDE MARKET, BY APPLICATION, 2018–2021 (USD MILLION)
          TABLE 29 MEDICAL NITROUS OXIDE MARKET, BY APPLICATION, 2022–2029 (USD MILLION)
    7.2 ANESTHESIA & PAIN RELIEF 
           7.2.1 WIDE USAGE AS CARRIER FOR OTHER ANESTHETIC GASES TO DRIVE MARKET
                    TABLE 30 MEDICAL NITROUS OXIDE MARKET FOR ANESTHESIA & PAIN RELIEF, BY COUNTRY, 2018–2021 (USD MILLION)
                    TABLE 31 MEDICAL NITROUS OXIDE MARKET FOR ANESTHESIA & PAIN RELIEF, BY COUNTRY, 2022–2029 (USD MILLION)
    7.3 CRYOSURGERY 
           7.3.1 PAINLESSNESS OF CRYOSURGICAL PROCEDURES TO SUPPORT ADOPTION
                    TABLE 32 MEDICAL NITROUS OXIDE MARKET FOR CRYOSURGERY, BY COUNTRY, 2018–2021 (USD MILLION)
                    TABLE 33 MEDICAL NITROUS OXIDE MARKET FOR CRYOSURGERY, BY COUNTRY, 2022–2029 (USD MILLION)
    7.4 SURGICAL INSUFFLATION 
           7.4.1 USE OF NITROUS OXIDE AS INSUFFLATION GAS IN LAPAROSCOPIC AND ENDOSCOPIC SURGERIES TO DRIVE MARKET
                    TABLE 34 MEDICAL NITROUS OXIDE MARKET FOR SURGICAL INSUFFLATION, BY COUNTRY, 2018–2021 (USD MILLION)
                    TABLE 35 MEDICAL NITROUS OXIDE MARKET FOR SURGICAL INSUFFLATION, BY COUNTRY, 2022–2029 (USD MILLION)
 
8 MEDICAL NITROUS OXIDE MARKET, BY END USER (Page No. - 97)
    8.1 INTRODUCTION 
          TABLE 36 MEDICAL NITROUS OXIDE MARKET, BY END USER, 2018–2021 (USD MILLION)
          TABLE 37 MEDICAL NITROUS OXIDE MARKET, BY END USER, 2022–2029 (USD MILLION)
    8.2 HOSPITALS 
           8.2.1 EXTENSIVE USAGE OF MEDICAL NITROUS OXIDE TO DRIVE MARKET
                    TABLE 38 MEDICAL NITROUS OXIDE MARKET FOR HOSPITALS, BY COUNTRY, 2018–2021 (USD MILLION)
                    TABLE 39 MEDICAL NITROUS OXIDE MARKET FOR HOSPITALS, BY COUNTRY, 2022–2029 (USD MILLION)
    8.3 HOME CARE SETTINGS 
           8.3.1 HOME CARE SETTINGS TO WITNESS HIGHEST GROWTH DUE TO RISING PREVALENCE OF CHRONIC DISEASES
                    TABLE 40 MEDICAL NITROUS OXIDE MARKET FOR HOME CARE SETTINGS, BY COUNTRY, 2018–2021 (USD MILLION)
                    TABLE 41 MEDICAL NITROUS OXIDE MARKET FOR HOME CARE SETTINGS, BY COUNTRY, 2022–2029 (USD MILLION)
    8.4 ACADEMIC & RESEARCH INSTITUTES 
           8.4.1 COLLABORATION WITH INDUSTRY PARTNERS FOR TECHNOLOGICAL ADVANCES TO SUPPORT GROWTH
                    TABLE 42 MEDICAL NITROUS OXIDE MARKET FOR ACADEMIC & RESEARCH INSTITUTES, BY COUNTRY, 2018–2021 (USD MILLION)
                    TABLE 43 MEDICAL NITROUS OXIDE MARKET FOR ACADEMIC & RESEARCH INSTITUTES, BY COUNTRY, 2022–2029 (USD MILLION)
 
9 MEDICAL NITROUS OXIDE MARKET, BY REGION (Page No. - 105)
    9.1 INTRODUCTION 
          TABLE 44 MEDICAL NITROUS OXIDE MARKET, BY REGION, 2018–2021 (USD MILLION)
          TABLE 45 MEDICAL NITROUS OXIDE MARKET, BY REGION, 2022–2029 (USD MILLION)
    9.2 NORTH AMERICA 
           9.2.1 NORTH AMERICA: RECESSION IMPACT
                    FIGURE 31 NORTH AMERICA: MEDICAL NITROUS OXIDE MARKET SNAPSHOT
                    TABLE 46 NORTH AMERICA: MEDICAL NITROUS OXIDE MARKET, BY COUNTRY, 2018–2021 (USD MILLION)
                    TABLE 47 NORTH AMERICA: MEDICAL NITROUS OXIDE MARKET, BY COUNTRY, 2022–2029 (USD MILLION)
                    TABLE 48 NORTH AMERICA: MEDICAL NITROUS OXIDE MARKET, BY TYPE, 2018–2021 (USD MILLION)
                    TABLE 49 NORTH AMERICA: MEDICAL NITROUS OXIDE MARKET, BY TYPE, 2022–2029 (USD MILLION)
                    TABLE 50 NORTH AMERICA: MEDICAL NITROUS OXIDE MARKET, BY APPLICATION, 2018–2021 (USD MILLION)
                    TABLE 51 NORTH AMERICA: MEDICAL NITROUS OXIDE MARKET, BY APPLICATION, 2022–2029 (USD MILLION)
                    TABLE 52 NORTH AMERICA: MEDICAL NITROUS OXIDE MARKET, BY END USER, 2018–2021 (USD MILLION)
                    TABLE 53 NORTH AMERICA: MEDICAL NITROUS OXIDE MARKET, BY END USER, 2022–2029 (USD MILLION)
           9.2.2 US
                    9.2.2.1 US to dominate North American medical nitrous oxide market
                                TABLE 54 US: MEDICAL NITROUS OXIDE MARKET, BY TYPE, 2018–2021 (USD MILLION)
                                TABLE 55 US: MEDICAL NITROUS OXIDE MARKET, BY TYPE, 2022–2029 (USD MILLION)
                                TABLE 56 US: MEDICAL NITROUS OXIDE MARKET, BY APPLICATION, 2018–2021 (USD MILLION)
                                TABLE 57 US: MEDICAL NITROUS OXIDE MARKET, BY APPLICATION, 2022–2029 (USD MILLION)
                                TABLE 58 US: MEDICAL NITROUS OXIDE MARKET, BY END USER, 2018–2021 (USD MILLION)
                                TABLE 59 US: MEDICAL NITROUS OXIDE MARKET, BY END USER, 2022–2029 (USD MILLION)
           9.2.3 CANADA
                    9.2.3.1 Stringent regulatory compliance to support market growth in Canada
                                TABLE 60 CANADA: MEDICAL NITROUS OXIDE MARKET, BY TYPE, 2018–2021 (USD MILLION)
                                TABLE 61 CANADA: MEDICAL NITROUS OXIDE MARKET, BY TYPE, 2022–2029 (USD MILLION)
                                TABLE 62 CANADA: MEDICAL NITROUS OXIDE MARKET, BY APPLICATION, 2018–2021 (USD MILLION)
                                TABLE 63 CANADA: MEDICAL NITROUS OXIDE MARKET, BY APPLICATION, 2022–2029 (USD MILLION)
                                TABLE 64 CANADA: MEDICAL NITROUS OXIDE MARKET, BY END USER, 2018–2021 (USD MILLION)
                                TABLE 65 CANADA: MEDICAL NITROUS OXIDE MARKET, BY END USER, 2022–2029 (USD MILLION)
    9.3 EUROPE 
           9.3.1 EUROPE: RECESSION IMPACT
                    TABLE 66 EUROPE: MEDICAL NITROUS OXIDE MARKET, BY COUNTRY, 2018–2021 (USD MILLION)
                    TABLE 67 EUROPE: MEDICAL NITROUS OXIDE MARKET, BY COUNTRY, 2022–2029 (USD MILLION)
                    TABLE 68 EUROPE: MEDICAL NITROUS OXIDE MARKET, BY TYPE, 2018–2021 (USD MILLION)
                    TABLE 69 EUROPE: MEDICAL NITROUS OXIDE MARKET, BY TYPE, 2022–2029 (USD MILLION)
                    TABLE 70 EUROPE: MEDICAL NITROUS OXIDE MARKET, BY APPLICATION, 2018–2021 (USD MILLION)
                    TABLE 71 EUROPE: MEDICAL NITROUS OXIDE MARKET, BY APPLICATION, 2022–2029 (USD MILLION)
                    TABLE 72 EUROPE: MEDICAL NITROUS OXIDE MARKET, BY END USER, 2018–2021 (USD MILLION)
                    TABLE 73 EUROPE: MEDICAL NITROUS OXIDE MARKET, BY END USER, 2022–2029 (USD MILLION)
           9.3.2 GERMANY
                    9.3.2.1 Increasing healthcare spending to drive market
                                TABLE 74 GERMANY: MEDICAL NITROUS OXIDE MARKET, BY TYPE, 2018–2021 (USD MILLION)
                                TABLE 75 GERMANY: MEDICAL NITROUS OXIDE MARKET, BY TYPE, 2022–2029 (USD MILLION)
                                TABLE 76 GERMANY: MEDICAL NITROUS OXIDE MARKET, BY APPLICATION, 2018–2021 (USD MILLION)
                                TABLE 77 GERMANY: MEDICAL NITROUS OXIDE MARKET, BY APPLICATION, 2022–2029 (USD MILLION)
                                TABLE 78 GERMANY: MEDICAL NITROUS OXIDE MARKET, BY END USER, 2018–2021 (USD MILLION)
                                TABLE 79 GERMANY: MEDICAL NITROUS OXIDE MARKET, BY END USER, 2022–2029 (USD MILLION)
           9.3.3 UK
                    9.3.3.1 Increasing surgeries & dental procedures to drive market
                                TABLE 80 UK: MEDICAL NITROUS OXIDE MARKET, BY TYPE, 2018–2021 (USD MILLION)
                                TABLE 81 UK: MEDICAL NITROUS OXIDE MARKET, BY TYPE, 2022–2029 (USD MILLION)
                                TABLE 82 UK: MEDICAL NITROUS OXIDE MARKET, BY APPLICATION, 2018–2021 (USD MILLION)
                                TABLE 83 UK: MEDICAL NITROUS OXIDE MARKET, BY APPLICATION, 2022–2029 (USD MILLION)
                                TABLE 84 UK: MEDICAL NITROUS OXIDE MARKET, BY END USER, 2018–2021 (USD MILLION)
                                TABLE 85 UK: MEDICAL NITROUS OXIDE MARKET, BY END USER, 2022–2029 (USD MILLION)
           9.3.4 FRANCE
                    9.3.4.1 Well-established healthcare system to drive market
                                TABLE 86 FRANCE: MEDICAL NITROUS OXIDE MARKET, BY TYPE, 2018–2021 (USD MILLION)
                                TABLE 87 FRANCE: MEDICAL NITROUS OXIDE MARKET, BY TYPE, 2022–2029 (USD MILLION)
                                TABLE 88 FRANCE: MEDICAL NITROUS OXIDE MARKET, BY APPLICATION, 2018–2021 (USD MILLION)
                                TABLE 89 FRANCE: MEDICAL NITROUS OXIDE MARKET, BY APPLICATION, 2022–2029 (USD MILLION)
                                TABLE 90 FRANCE: MEDICAL NITROUS OXIDE MARKET, BY END USER, 2018–2021 (USD MILLION)
                                TABLE 91 FRANCE: MEDICAL NITROUS OXIDE MARKET, BY END USER, 2022–2029 (USD MILLION)
           9.3.5 ITALY
                    9.3.5.1 Rapid growth in geriatric population and rising life expectancy to favor market growth
                                TABLE 92 ITALY: MEDICAL NITROUS OXIDE MARKET, BY TYPE, 2018–2021 (USD MILLION)
                                TABLE 93 ITALY: MEDICAL NITROUS OXIDE MARKET, BY TYPE, 2022–2029 (USD MILLION)
                                TABLE 94 ITALY: MEDICAL NITROUS OXIDE MARKET, BY APPLICATION, 2018–2021 (USD MILLION)
                                TABLE 95 ITALY: MEDICAL NITROUS OXIDE MARKET, BY APPLICATION, 2022–2029 (USD MILLION)
                                TABLE 96 ITALY: MEDICAL NITROUS OXIDE MARKET, BY END USER, 2018–2021 (USD MILLION)
                                TABLE 97 ITALY: MEDICAL NITROUS OXIDE MARKET, BY END USER, 2022–2029 (USD MILLION)
           9.3.6 SPAIN
                    9.3.6.1 Increasing prevalence of cancer to support market growth
                                TABLE 98 SPAIN: MEDICAL NITROUS OXIDE MARKET, BY TYPE, 2018–2021 (USD MILLION)
                                TABLE 99 SPAIN: MEDICAL NITROUS OXIDE MARKET, BY TYPE, 2022–2029 (USD MILLION)
                                TABLE 100 SPAIN: MEDICAL NITROUS OXIDE MARKET, BY APPLICATION, 2018–2021 (USD MILLION)
                                TABLE 101 SPAIN: MEDICAL NITROUS OXIDE MARKET, BY APPLICATION, 2022–2029 (USD MILLION)
                                TABLE 102 SPAIN: MEDICAL NITROUS OXIDE MARKET, BY END USER, 2018–2021 (USD MILLION)
                                TABLE 103 SPAIN: MEDICAL NITROUS OXIDE MARKET, BY END USER, 2022–2029 (USD MILLION)
           9.3.7 REST OF EUROPE
                    TABLE 104 REST OF EUROPE: MEDICAL NITROUS OXIDE MARKET, BY TYPE, 2018–2021 (USD MILLION)
                    TABLE 105 REST OF EUROPE: MEDICAL NITROUS OXIDE MARKET, BY TYPE, 2022–2029 (USD MILLION)
                    TABLE 106 REST OF EUROPE: MEDICAL NITROUS OXIDE MARKET, BY APPLICATION, 2018–2021 (USD MILLION)
                    TABLE 107 REST OF EUROPE: MEDICAL NITROUS OXIDE MARKET, BY APPLICATION, 2022–2029 (USD MILLION)
                    TABLE 108 REST OF EUROPE: MEDICAL NITROUS OXIDE MARKET, BY END USER, 2018–2021 (USD MILLION)
                    TABLE 109 REST OF EUROPE: MEDICAL NITROUS OXIDE MARKET, BY END USER, 2022–2029 (USD MILLION)
    9.4 ASIA PACIFIC 
           9.4.1 ASIA PACIFIC: RECESSION IMPACT
                    FIGURE 32 ASIA PACIFIC: MEDICAL NITROUS OXIDE MARKET SNAPSHOT
                    TABLE 110 ASIA PACIFIC: MEDICAL NITROUS OXIDE MARKET, BY COUNTRY, 2018–2021 (USD MILLION)
                    TABLE 111 ASIA PACIFIC: MEDICAL NITROUS OXIDE MARKET, BY COUNTRY, 2022–2029 (USD MILLION)
                    TABLE 112 ASIA PACIFIC: MEDICAL NITROUS OXIDE MARKET, BY TYPE, 2018–2021 (USD MILLION)
                    TABLE 113 ASIA PACIFIC: MEDICAL NITROUS OXIDE MARKET, BY TYPE, 2022–2029 (USD MILLION)
                    TABLE 114 ASIA PACIFIC: MEDICAL NITROUS OXIDE MARKET, BY APPLICATION, 2018–2021 (USD MILLION)
                    TABLE 115 ASIA PACIFIC: MEDICAL NITROUS OXIDE MARKET, BY APPLICATION, 2022–2029 (USD MILLION)
                    TABLE 116 ASIA PACIFIC: MEDICAL NITROUS OXIDE MARKET, BY END USER, 2018–2021 (USD MILLION)
                    TABLE 117 ASIA PACIFIC: MEDICAL NITROUS OXIDE MARKET, BY END USER, 2022–2029 (USD MILLION)
           9.4.2 JAPAN
                    9.4.2.1 Japan to hold largest share of APAC market
                                TABLE 118 JAPAN: MEDICAL NITROUS OXIDE MARKET, BY TYPE, 2018–2021 (USD MILLION)
                                TABLE 119 JAPAN: MEDICAL NITROUS OXIDE MARKET, BY TYPE, 2022–2029 (USD MILLION)
                                TABLE 120 JAPAN: MEDICAL NITROUS OXIDE MARKET, BY APPLICATION, 2018–2021 (USD MILLION)
                                TABLE 121 JAPAN: MEDICAL NITROUS OXIDE MARKET, BY APPLICATION, 2022–2029 (USD MILLION)
                                TABLE 122 JAPAN: MEDICAL NITROUS OXIDE MARKET, BY END USER, 2018–2021 (USD MILLION)
                                TABLE 123 JAPAN: MEDICAL NITROUS OXIDE MARKET, BY END USER, 2022–2029 (USD MILLION)
           9.4.3 CHINA
                    9.4.3.1 Strong investments in infrastructural development to offer opportunities for market growth
                                TABLE 124 CHINA: MEDICAL NITROUS OXIDE MARKET, BY TYPE, 2018–2021 (USD MILLION)
                                TABLE 125 CHINA: MEDICAL NITROUS OXIDE MARKET, BY TYPE, 2022–2029 (USD MILLION)
                                TABLE 126 CHINA: MEDICAL NITROUS OXIDE MARKET, BY APPLICATION, 2018–2021 (USD MILLION)
                                TABLE 127 CHINA: MEDICAL NITROUS OXIDE MARKET, BY APPLICATION, 2022–2029 (USD MILLION)
                                TABLE 128 CHINA: MEDICAL NITROUS OXIDE MARKET, BY END USER, 2018–2021 (USD MILLION)
                                TABLE 129 CHINA: MEDICAL NITROUS OXIDE MARKET, BY END USER, 2022–2029 (USD MILLION)
           9.4.4 INDIA
                    9.4.4.1 Rising procedural volume to ensure sustained demand for medical gases
                                TABLE 130 INDIA: MEDICAL NITROUS OXIDE MARKET, BY TYPE, 2018–2021 (USD MILLION)
                                TABLE 131 INDIA: MEDICAL NITROUS OXIDE MARKET, BY TYPE, 2022–2029 (USD MILLION)
                                TABLE 132 INDIA: MEDICAL NITROUS OXIDE MARKET, BY APPLICATION, 2018–2021 (USD MILLION)
                                TABLE 133 INDIA: MEDICAL NITROUS OXIDE MARKET, BY APPLICATION, 2022–2029 (USD MILLION)
                                TABLE 134 INDIA: MEDICAL NITROUS OXIDE MARKET, BY END USER, 2018–2021 (USD MILLION)
                                TABLE 135 INDIA: MEDICAL NITROUS OXIDE MARKET, BY END USER, 2022–2029 (USD MILLION)
           9.4.5 REST OF ASIA PACIFIC
                    TABLE 136 REST OF ASIA PACIFIC: MEDICAL NITROUS OXIDE MARKET, BY TYPE, 2018–2021 (USD MILLION)
                    TABLE 137 REST OF ASIA PACIFIC: MEDICAL NITROUS OXIDE MARKET, BY TYPE, 2022–2029 (USD MILLION)
                    TABLE 138 REST OF ASIA PACIFIC: MEDICAL NITROUS OXIDE MARKET, BY APPLICATION, 2018–2021 (USD MILLION)
                    TABLE 139 REST OF ASIA PACIFIC: MEDICAL NITROUS OXIDE MARKET, BY APPLICATION, 2022–2029 (USD MILLION)
                    TABLE 140 REST OF ASIA PACIFIC: MEDICAL NITROUS OXIDE MARKET, BY END USER, 2018–2021 (USD MILLION)
                    TABLE 141 REST OF ASIA PACIFIC: MEDICAL NITROUS OXIDE MARKET, BY END USER, 2022–2029 (USD MILLION)
    9.5 LATIN AMERICA 
           9.5.1 RISING PUBLIC-PRIVATE PARTNERSHIPS FOR HEALTHCARE DEVELOPMENT TO PROMOTE ADOPTION OF MEDICAL NITROUS OXIDE
           9.5.2 LATIN AMERICA: RECESSION IMPACT
                    TABLE 142 LATIN AMERICA: MEDICAL NITROUS OXIDE MARKET, BY TYPE, 2018–2021 (USD MILLION)
                    TABLE 143 LATIN AMERICA: MEDICAL NITROUS OXIDE MARKET, BY TYPE, 2022–2029 (USD MILLION)
                    TABLE 144 LATIN AMERICA: MEDICAL NITROUS OXIDE MARKET, BY APPLICATION, 2018–2021 (USD MILLION)
                    TABLE 145 LATIN AMERICA: MEDICAL NITROUS OXIDE MARKET, BY APPLICATION, 2022–2029 (USD MILLION)
                    TABLE 146 LATIN AMERICA: MEDICAL NITROUS OXIDE MARKET, BY END USER, 2018–2021 (USD MILLION)
                    TABLE 147 LATIN AMERICA: MEDICAL NITROUS OXIDE MARKET, BY END USER, 2022–2029 (USD MILLION)
    9.6 MIDDLE EAST & AFRICA 
           9.6.1 GOVERNMENT INITIATIVES FOR INFRASTRUCTURAL DEVELOPMENT TO SUPPORT MARKET GROWTH
           9.6.2 MIDDLE EAST & AFRICA: RECESSION IMPACT
                    TABLE 148 MIDDLE EAST & AFRICA: MEDICAL NITROUS OXIDE MARKET, BY TYPE, 2018–2021 (USD MILLION)
                    TABLE 149 MIDDLE EAST & AFRICA: MEDICAL NITROUS OXIDE MARKET, BY TYPE, 2022–2029 (USD MILLION)
                    TABLE 150 MIDDLE EAST & AFRICA: MEDICAL NITROUS OXIDE MARKET, BY APPLICATION, 2018–2021 (USD MILLION)
                    TABLE 151 MIDDLE EAST & AFRICA: MEDICAL NITROUS OXIDE MARKET, BY APPLICATION, 2022–2029 (USD MILLION)
                    TABLE 152 MIDDLE EAST & AFRICA: MEDICAL NITROUS OXIDE MARKET, BY END USER, 2018–2021 (USD MILLION)
                    TABLE 153 MIDDLE EAST & AFRICA: MEDICAL NITROUS OXIDE MARKET, BY END USER, 2022–2029 (USD MILLION)
 
10 COMPETITIVE LANDSCAPE (Page No. - 152)
     10.1 OVERVIEW 
     10.2 KEY PLAYER STRATEGIES/RIGHT TO WIN 
             TABLE 154 OVERVIEW OF STRATEGIES ADOPTED BY PLAYERS IN MEDICAL NITROUS OXIDE MARKET
     10.3 REVENUE ANALYSIS 
             FIGURE 33 REVENUE ANALYSIS OF KEY PLAYERS IN MEDICAL NITROUS OXIDE MARKET, 2018–2022 (USD MILLION)
     10.4 MARKET SHARE ANALYSIS 
             FIGURE 34 MEDICAL NITROUS OXIDE MARKET SHARE ANALYSIS (2022)
             TABLE 155 MEDICAL NITROUS OXIDE MARKET: DEGREE OF COMPETITION
     10.5 MARKET RANKING ANALYSIS 
             FIGURE 35 MEDICAL NITROUS OXIDE MARKET RANKING, BY KEY PLAYER, 2022
     10.6 COMPANY EVALUATION MATRIX: KEY PLAYERS 
             10.6.1 STARS
             10.6.2 EMERGING LEADERS
             10.6.3 PERVASIVE PLAYERS
             10.6.4 PARTICIPANTS
                        FIGURE 36 MEDICAL NITROUS OXIDE MARKET: COMPANY EVALUATION MATRIX (KEY PLAYERS), 2023
             10.6.5 COMPANY FOOTPRINT
                        FIGURE 37 MEDICAL NITROUS OXIDE MARKET: COMPANY FOOTPRINT
                        TABLE 156 MEDICAL NITROUS OXIDE MARKET: TYPE FOOTPRINT
                        TABLE 157 MEDICAL NITROUS OXIDE MARKET: APPLICATION FOOTPRINT
                        TABLE 158 MEDICAL NITROUS OXIDE MARKET: END-USER FOOTPRINT
                        TABLE 159 MEDICAL NITROUS OXIDE MARKET: REGIONAL FOOTPRINT
     10.7 COMPANY EVALUATION MATRIX: STARTUPS/SMES 
             10.7.1 PROGRESSIVE COMPANIES
             10.7.2 RESPONSIVE COMPANIES
             10.7.3 DYNAMIC COMPANIES
             10.7.4 STARTING BLOCKS
                        FIGURE 38 MEDICAL NITROUS OXIDE MARKET: COMPANY EVALUATION MATRIX (STARTUPS/SMES), 2023
             10.7.5 COMPETITIVE BENCHMARKING
                        10.7.5.1 Detailed list of key startups/SMEs
                                      TABLE 160 MEDICAL NITROUS OXIDE: DETAILED LIST OF KEY STARTUPS/SMES
                        10.7.5.2 Competitive benchmarking of key startups/SMEs
                                      TABLE 161 MEDICAL NITROUS OXIDE: COMPETITIVE BENCHMARKING OF KEY STARTUPS/SMES
     10.8 BRAND/PRODUCT COMPARISON 
     10.9 COMPANY EVALUATION AND FINANCIAL METRICS 
             FIGURE 39 EV/EBITDA OF KEY VENDORS
             FIGURE 40 YEAR-TO-DATE (YTD) PRICE TOTAL RETURN AND 5-YEAR STOCK BETA OF MEDICAL NITROUS OXIDE VENDORS
     10.1 COMPETITIVE SCENARIO 
             10.10.1 DEALS
                        TABLE 162 MEDICAL NITROUS OXIDE MARKET: DEALS, JANUARY 2020– JANUARY 2024
             10.10.2 EXPANSIONS
                        TABLE 163 MEDICAL NITROUS OXIDE MARKET: EXPANSIONS, JANUARY 2020–JANUARY 2024
 
11 COMPANY PROFILES (Page No. - 172)
     11.1 KEY PLAYERS 
(Business Overview, Products/Services/Solutions Offered, MnM View, Key Strengths and Right to Win, Strategic Choices Made, Weaknesses and Competitive Threats, Recent Developments)*
             11.1.1 AIR LIQUIDE
                        TABLE 164 AIR LIQUIDE: COMPANY OVERVIEW
                        FIGURE 41 AIR LIQUIDE: COMPANY SNAPSHOT (2022)
             11.1.2 LINDE PLC
                        TABLE 165 LINDE PLC: COMPANY OVERVIEW
                        FIGURE 42 LINDE PLC: COMPANY SNAPSHOT (2022)
             11.1.3 SOL SPA
                        TABLE 166 SOL SPA: COMPANY OVERVIEW
                        FIGURE 43 SOL SPA: COMPANY SNAPSHOT (2022)
             11.1.4 TAIYO NIPPON SANSO CORPORATION
                        TABLE 167 TAIYO NIPPON SANSO CORPORATION: COMPANY OVERVIEW
                        FIGURE 44 TAIYO NIPPON SANSO CORPORATION: COMPANY SNAPSHOT (2023)
             11.1.5 NORCO INC.
                        TABLE 168 NORCO INC.: COMPANY OVERVIEW
             11.1.6 SOUTHERN GAS LIMITED
                        TABLE 169 SOUTHERN GAS LIMITED: COMPANY OVERVIEW
                        FIGURE 45 SOUTHERN GAS LIMITED: COMPANY SNAPSHOT (2022)
             11.1.7 ELLENBARRIE INDUSTRIAL GASES
                        TABLE 170 ELLENBARRIE INDUSTRIAL GASES: COMPANY OVERVIEW
                        FIGURE 46 ELLENBARRIE INDUSTRIAL GASES: COMPANY SNAPSHOT (2020)
             11.1.8 CALOX INC.
                        TABLE 171 CALOX INC.: COMPANY OVERVIEW
             11.1.9 STEELMAN GASES PVT. LTD.
                        TABLE 172 STEELMAN GASES PVT. LTD.: COMPANY OVERVIEW
             11.1.10 NEXAIR
                        TABLE 173 NEXAIR: COMPANY OVERVIEW
             11.1.11 OXYGEN & ARGON WORKS LTD.
                        TABLE 174 OXYGEN & ARGON WORKS LTD.: COMPANY OVERVIEW
             11.1.12 GULFCRYO
                        TABLE 175 GULFCRYO: COMPANY OVERVIEW
             11.1.13 CHENGDU TAIYO INDUSTRIAL GASES CO., LTD.
                        TABLE 176 CHENGDU TAIYO INDUSTRIAL GASES CO. LTD.: COMPANY OVERVIEW
             11.1.14 JIANGSU HUAZHONG GAS CO., LTD.
                        TABLE 177 JIANGSU HAUZHONG GAS CO., LTD.: COMPANY OVERVIEW
             11.1.15 CARBIDE AND CHEMICALS
                        TABLE 178 CARBIDE AND CHEMICALS: COMPANY OVERVIEW
             11.1.16 AMERICAN WELDING & GAS
                        TABLE 179 AMERICAN WELDING & GAS: COMPANY OVERVIEW
             11.1.17 ASIA INDUSTRIAL GASES PTE. LTD.
                        TABLE 180 ASIA INDUSTRIAL GASES PTE. LTD.: COMPANY OVERVIEW
             11.1.18 MIDDLESEX GASES & TECHNOLOGY INC.
                        TABLE 181 MIDDLESEX GASES & TECHNOLOGIES INC.: COMPANY OVERVIEW
             11.1.19 AMERITANX CYLINDERS
                        TABLE 182 AMERITANX CYLINDERS: COMPANY OVERVIEW
             11.1.20 CRYOCARB
                        TABLE 183 CRYOCARB: COMPANY OVERVIEW
*Business Overview, Products/Services/Solutions Offered, MnM View, Key Strengths and Right to Win, Strategic Choices Made, Weaknesses and Competitive Threats, Recent Developments might not be captured in case of unlisted companies.
     11.2 OTHER PLAYERS 
             11.2.1 HOLSTON GASES
             11.2.2 AOPL
             11.2.3 BUTLER GAS PRODUCTS COMPANY
             11.2.4 GRUPPO SIAD
             11.2.5 ANDY OXY CO., INC.
 
12 APPENDIX (Page No. - 204)
     12.1 DISCUSSION GUIDE 
     12.2 KNOWLEDGESTORE: MARKETSANDMARKETS’ SUBSCRIPTION PORTAL 
     12.3 CUSTOMIZATION OPTIONS 
     12.4 RELATED REPORTS 
     12.5 AUTHOR DETAILS 

The study involved four major activities in estimating the current size of the medical nitrous oxide market. Exhaustive secondary research was done to collect information on the market and its different sub-segments. The next step was to validate these findings, assumptions, and market sizing with industry experts across the value chain through primary research. Both top-down and bottom-up approaches were employed to estimate the complete market size. After that, market breakdown and data triangulation procedures were used to estimate the market size of the segments and sub-segments.

Secondary Research

This research study involved the extensive usage of secondary sources; directories; databases such as Bloomberg Business, Factiva, and Wall Street Journal; white papers and annual reports; company house documents; investor presentations; and SEC filings of companies. Secondary research was used to identify and collect information useful for the extensive, technical, market-oriented, and commercial study of the brain monitoring market. It was also used to obtain important information about the key market players, market classification & segmentation according to industry trends to the bottom-most level, and key developments related to market and technology perspectives. A database of the key industry leaders was also prepared using secondary research.

Primary Research

In the primary research process, various primary sources from both the supply and demand sides were interviewed to obtain qualitative and quantitative information important for this report. Primary sources from the supply side include industry experts such as CEOs, vice presidents, marketing directors, technology and innovation directors, and related executives from various key companies and organizations operating in the medical nitrous oxide market. After the complete market engineering process (which includes calculations for market statistics, market breakdown, market size estimations, market forecasting, and data triangulation), extensive primary research was conducted to gather information and verify and validate the critical numbers arrived at.

Some of the major objectives of primary research are:

  • To validate market segmentation defined through an assessment of the product portfolios of leading players
  • To understand the key industry trends and technologies defining the strategic growth objectives of market players
  • To gather both demand- and supply-side validation of the key factors affecting the market growth
  • To validate assumptions for the market sizing and forecasting model used for this study
  • To understand the market position of leading players in the medical nitrous oxide market and their market share/ranking

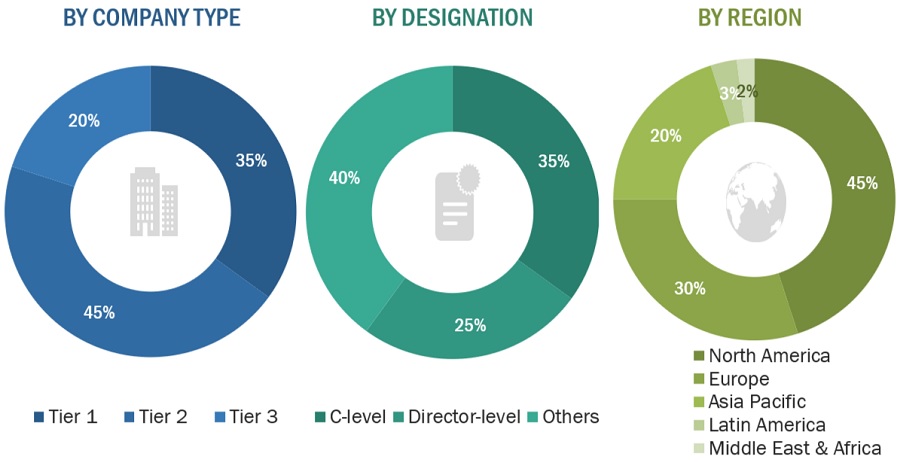
Breakdown Of Primary Participants
Nitrous Oxide Market Size, and Share

*Others include sales managers, marketing managers, and product managers.

Note: Tiers are defined based on a company’s total revenue. As of 2023, Tier 1 = >USD 1 billion, Tier 2 = USD 500 million to USD 1 billion, and Tier 3 = <USD 500 million.

To know about the assumptions considered for the study, download the pdf brochure

Market Size Estimation

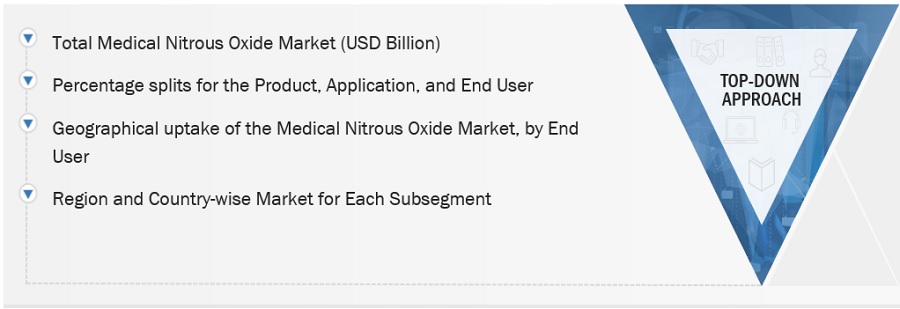
Top-down approach used to estimate and validate the total size of the Medical nitrous oxide market. This methods were also used extensively to estimate the size of various subsegments in the market.

Top-down approach

The overall medical nitrous oxide market size was used in the top-down approach to estimate the sizes of other individual markets (mentioned in the market segmentation by product, application, end user, and region) through percentage splits from secondary and primary research.

For the calculation of each type of specific market segment, the most appropriate immediate-parent market size was used for implementing the top-down approach. The bottom-up approach was also implemented (wherever applicable) for data extracted from secondary research to validate the market segment revenues obtained. Market shares were then estimated for top companies to verify the total market revenue arrived earlier in the bottom-up approach.
Nitrous Oxide Market Size, and Share

To know about the assumptions considered for the study, Request for Free Sample Report

Data Triangulation

After arriving at the overall market size, from the market size estimation process explained above, the medical nitrous oxide market was split into segments and subsegments. To complete the overall market engineering process and to arrive at the exact statistics for all segments and subsegments, the data triangulation and market breakdown procedures were employed, wherever applicable. The data was triangulated by studying various factors and trends from both the demand and supply sides in the medical nitrous oxide industry.

Market Definition

Medical nitrous oxide is a pharmaceutical-grade, colorless, and odorless gas widely employed in healthcare settings for its anesthetic and analgesic properties. It is utilized as a medical gas in controlled environments, primarily in hospitals and dental clinics, to induce conscious sedation and alleviate pain during various medical procedures. Medical nitrous oxide is administered through specialized delivery systems to ensure precise dosage control, providing healthcare professionals with a reliable means of managing patient comfort and facilitating effective anesthesia.

Key Stakeholders

  • World Health Organization (WHO)
  • National Center for Biotechnology Information (NCBI)
  • Centers for Disease Control and Prevention (CDC)
  • US Food and Drug Administration (FDA)
  • Drug Enforcement Administration (DEA)
  • European Medicines Agency (EMA)
  • Compressed Gas Association (CGA)
  • American Society of Anesthesiologists (ASA)

Report Objectives

  • To define, describe, and forecast the medical nitrous oxide market based on the product, application, end user, and region
  • To provide detailed information regarding the major factors influencing the growth of the market (such as drivers, restraints, opportunities, and challenges)
  • To strategically analyze micromarkets1 with respect to individual growth trends, prospects, and contributions to the overall medical nitrous oxide market
  • To analyze the opportunities in the market for stakeholders and provide details of the competitive landscape for market leaders
  • To profile the key players in the market and comprehensively analyze their market shares and core competencies2
  • To forecast the size of the market segments with respect to four main regions, namely, North America, Asia Pacific, Europe, Latin America, and Middle East & Africa.
  • To track and analyze competitive developments such as new product launches, agreements, collaborations, and expansions.

Available Customizations:

MarketsandMarkets offers the following customizations for this market report:

Company Information

  • Profiling of additional market players (up to 3)
Custom Market Research Services

We will customize the research for you, in case the report listed above does not meet with your exact requirements. Our custom research will comprehensively cover the business information you require to help you arrive at strategic and profitable business decisions.

Request Customization
Report Code
MD 8935
Published ON
Feb, 2024
Choose License Type
BUY NOW
  • SHARE
X
Request Customization
Speak to Analyst
Speak to Analyst
OR FACE-TO-FACE MEETING
PERSONALIZE THIS RESEARCH
  • Triangulate with your Own Data
  • Get Data as per your Format and Definition
  • Gain a Deeper Dive on a Specific Application, Geography, Customer or Competitor
  • Any level of Personalization
REQUEST A FREE CUSTOMIZATION
LET US HELP YOU!
  • What are the Known and Unknown Adjacencies Impacting the Medical Nitrous Oxide Market
  • What will your New Revenue Sources be?
  • Who will be your Top Customer; what will make them switch?
  • Defend your Market Share or Win Competitors
  • Get a Scorecard for Target Partners
CUSTOMIZED WORKSHOP REQUEST
+1-888-600-6441
  • Call Us
  • +1-888-600-6441 (Corporate office hours)
  • +1-888-600-6441 (US/Can toll free)
  • +44-800-368-9399 (UK office hours)
CONNECT WITH US
ABOUT TRUST ONLINE
©2024 MarketsandMarkets Research Private Ltd. All rights reserved
DMCA.com Protection Status Website Feedback