Microbiome Diagnostics Market: Growth, Size, Share, and Trends

Microbiome Diagnostics Market by Product (Kits & Reagents, Instruments), Technology (16s rRNA Sequencing, Shot Gun Metagenomics, Metatranscriptomics), Sample (Fecal, Saliva, Skin), Application (GI, Metabolic Disorders) - Global Forecast to 2028

Report Code: MD 8949 Feb, 2024, by marketsandmarkets.com

Market Growth Outlook Summary

The global microbiome diagnostics market growth forecasted to transform from $146 million in 2023 to $300 million by 2028, driven by a CAGR of 15.5%. Market growth is driven by the rising incidence of chronic diseases, collaborative efforts between microbiome industry and academic institutes, and growing demand of personalized medicine.

Attractive Opportunities in the Microbiome Diagnostics Market

Microbiome Diagnostics Market

To know about the assumptions considered for the study, Request for Free Sample Report

Microbiome Diagnostics Market

Microbiome Diagnostics Market Dynamics

DRIVER: Collaborative efforts between the microbiome industry and academia for microbiome research

The human microbiome is a rapidly growing field of research, and there has been a significant surge in industry-academia collaborations centered around microbiome research. These collaborations unite academic researchers and industry partners to develop novel microbiome-based diagnostic products, as well as to enhance our understanding of the microbiome’s role in health and disease.

Overall, the increasing number of industry-academia collaborations focused on microbiome research propels the development of the field. These provide opportunities for the development of new microbiome-based diagnostic products and facilitate the translation of basic research findings into clinical applications. These collaborations also help bridge the gap between academia and the microbiome industry, bringing together different areas of expertise and resources to enhance our understanding of the human microbiome.

RESTRAINTS: End-user budget constraints in developing countries

In developing countries, academic R&D is mostly dependent on external funding. NGS technology is mostly used for microbiome analysis. Despite continuous efforts by governments and private bodies to provide funds for research across the globe, various research and academic institutes face budget constraints regarding the purchase and use of advanced and premium-priced equipment and technologies. Although the price of NGS sequencing has declined, NGS sequencers continue to be costly.

OPPORTUNITY: Increased collaboration of key players and small innovative companies to work on new microbiome technologies

With several small innovative players operating in the market, there are various high-growth opportunities for key stakeholders to buy out companies to study microbiomes in the hope of identifying various microbiome diagnostic kits, biomarkers targets for various indications, such as obesity, liver disorders, diabetes, and metabolic disorders. Many market leaders focus on strategic collaborations and partnerships to increase their product pipelines with well-organized research and development techniques. In the last two years, there have been several collaborations and partnerships involving major companies.

CHALLENGE: Adverse impact of complex regulatory policies on commercialization of microbiome

The commercialization of microbiomes is a complex process impacted by a range of regulatory policies and guidelines. These policies are implemented to ensure the safety and efficacy of microbiome-based products and services, but they can also create significant barriers to commercialization and growth in the microbiome-based diagnostics market.

Microbiome Diagnostics Market Ecosystem/Market Map

Microbiome Diagnostics Market Ecosystem

In 2022, kits and reagents accounted for the largest share in the microbiome diagnostics industry, by product.

The microbiome diagnostics market is segmented into kits & reagents, and instruments. Kits & reagents accounted for the largest share of the microbiome-based diagnostics market in 2022 by product. The repeat purchases and consumption of kits and reagents for diagnostic procedures as compared to the instruments, which have a longer shelf time and can be used for multiple procedures, is expected to contribute to the significant share of the technology segment.

In 2022, fecal segment accounted for the largest share in the microbiome diagnostics industry, by sample.

Based on sample, the microbiome diagnostics market is segmented into fecal, saliva, skin and other samples. In 2022, fecal accounted for the largest share of the microbiome diagnostics market, by sample. The increasing incidences of diseases, and increasing demand for personalized medicine will drive the market growth.

In 2022, hospitals accounted for the largest share in the microbiome diagnostics industry, by end user.

The microbiome diagnostics market is segmented into academic and research institutes, hospitals, pharmaceutical and biotechnology companies and other end users. Hospitals accounted for the largest share of the microbiome-based diagnostics market by end user. The share of the end-user segment is owing to the rising incidence of diseases such as metabolic disorders, gastrointestinal diseases etc.

In 2022, North America accounted for the largest share of the microbiome diagnostics industry.

The global microbiome diagnostics market is segmented into five major regions: North America, Europe, the Asia Pacific, Rest of the World. North America accounted for the largest share of the microbiome-based diagnostics market in 2022. The increasing incidences of diseases, the collaboration between microbiome research and academic institutes for microbiome research, growing demand for personalized medicine in the region contribute to this regional segment’s large share.

Microbiome Diagnostics Market by Region

To know about the assumptions considered for the study, download the pdf brochure

The major players in microbiome diagnostics market are DNA Genotek (Canada), Genetic Analysis AS (Norway), and Microba Life Sciences (US). These players’ market leadership is due to their broad product portfolios and vast global footprint. These dominant market players have advantages, including strong research and development budgets, better marketing and distribution networks, and established brand recognition.

Scope of the Microbiome Diagnostics Industry

Report Metric

Details

Market Revenue in 2023

$146 million

Projected Revenue by 2028

$300 million

Revenue Rate

Poised to Grow at a CAGR of 15.5%

Market Driver

Collaborative efforts between the microbiome industry and academia for microbiome research

Market Opportunity

Increased collaboration of key players and small innovative companies to work on new microbiome technologies

This report categorizes the microbiome diagnostics market to forecast revenue and analyze trends in each of the following submarkets:

By Product

  • Reagents & Kits
  • Instruments

By Technology

  • 16S rRNA Sequencing
  • Shot Gun Metagenomics
  • Metatranscriptomics
  • Other Technology

By Sample

  • Feces
  • Saliva
  • Skin
  • Other Sample

By Application

  • Disease Diagnostics Application
    • Gastrointestinal Disorders
    • Metabolic Diseases
    • Other Application
  • Research Application

By End User

  • Hospitals
  • Academic and Research Institutes
  • Biotechnology and Pharmaceutical Companies

By Region

  • North America
    • US
    • Canada
  • Europe
    • Germany
    • UK
    • France
    • Rest of Europe
  • Asia Pacific
    • China
    • Japan
    • India
    • Rest of Asia Pacific
  • Rest of the World

Recent Developments of Microbiome Diagnostics Industry:

  • In 2023, The Genetic Analysis (Norway) entered into an agreement with Eagle Biosciences Inc. (US) through its distributors with an undisclosed partner. A high-volume lab company providing laboratory diagnostics to clinics, public health departments and research universities in the US.
  • In 2022, DNA Genotek (Canada) Launched OMNIgene GUT OMR-205. This product allows for the stabilization, self-collection, storage and transportation of both microbial DNA and RNA at ambient temperature for gut microbiome profiling.
  • In 2022, Genetic Analysis (Norway) company entered into an agreement with Microbiome Research Pvt. Ltd. to launch GA-map technology in India.

Frequently Asked Questions (FAQ):

To speak to our analyst for a discussion on the above findings, click Speak to Analyst

Exclusive indicates content/data unique to MarketsandMarkets and not available with any competitors.

TABLE OF CONTENTS
 
1 INTRODUCTION (Page No. - 26)
    1.1 STUDY OBJECTIVES 
    1.2 MARKET DEFINITION 
          TABLE 1 INCLUSIONS & EXCLUSIONS
    1.3 STUDY SCOPE 
          FIGURE 1 MICROBIOME DIAGNOSTICS MARKET SCOPE
           1.3.1 YEARS CONSIDERED
    1.4 CURRENCY CONSIDERED 
    1.5 STAKEHOLDERS 
 
2 RESEARCH METHODOLOGY (Page No. - 29)
    2.1 RESEARCH DATA 
          FIGURE 2 MICROBIOME-BASED DIAGNOSTICS MARKET: RESEARCH DESIGN METHODOLOGY
           2.1.1 SECONDARY DATA
                    2.1.1.1 Key data from secondary sources
           2.1.2 PRIMARY DATA
                    FIGURE 3 PRIMARY SOURCES
                    2.1.2.1 Key data from primary sources
                    2.1.2.2 Key industry insights
                                FIGURE 4 BREAKDOWN OF PRIMARY INTERVIEWS: SUPPLY- AND DEMAND-SIDE PARTICIPANTS
                    2.1.2.3 Breakdown of primary interviews
                                FIGURE 5 BREAKDOWN OF PRIMARY INTERVIEWS: BY COMPANY TYPE, DESIGNATION, AND REGION
    2.2 MARKET SIZE ESTIMATION 
           2.2.1 BOTTOM-UP APPROACH
                    2.2.1.1 Approach 1: Company revenue estimation approach
                                FIGURE 6 BOTTOM-UP APPROACH: COMPANY REVENUE ESTIMATION APPROACH
                    2.2.1.2 Approach 2: Presentations of companies and primary interviews
                    2.2.1.3 Approach 3: Primary research
                    2.2.1.4 Growth forecast
                    2.2.1.5 CAGR projections
                                FIGURE 7 CAGR PROJECTIONS: SUPPLY-SIDE ANALYSIS
           2.2.2 TOP-DOWN APPROACH
                    FIGURE 8 MICROBIOME-BASED DIAGNOSTICS MARKET: TOP-DOWN APPROACH
    2.3 DATA TRIANGULATION 
          FIGURE 9 DATA TRIANGULATION METHODOLOGY
    2.4 STUDY ASSUMPTIONS 
    2.5 RESEARCH LIMITATIONS AND RISK ASSESSMENT 
          TABLE 2 RISK ASSESSMENT: MICROBIOME-BASED DIAGNOSTICS MARKET
    2.6 IMPACT OF RECESSION ON MICROBIOME-BASED DIAGNOSTICS MARKET 
 
3 EXECUTIVE SUMMARY (Page No. - 43)
    FIGURE 10 MICROBIOME DIAGNOSTICS MARKET, BY PRODUCT, 2023 VS. 2028 (USD MILLION)
    FIGURE 11 MICROBIOME DIAGNOSTICS INDUSTRY, BY TECHNOLOGY, 2023 VS. 2028 (USD MILLION)
    FIGURE 12 MICROBIOME-BASED DIAGNOSTICS MARKET, BY SAMPLE, 2023 VS. 2028 (USD MILLION)
    FIGURE 13 MICROBIOME-BASED DIAGNOSTICS MARKET, BY APPLICATION, 2023 VS. 2028 (USD MILLION)
    FIGURE 14 MICROBIOME-BASED DIAGNOSTICS MARKET, BY END USER, 2023 VS. 2028 (USD MILLION)
    FIGURE 15 GEOGRAPHICAL SNAPSHOT OF MICROBIOME-BASED DIAGNOSTICS MARKET
 
4 PREMIUM INSIGHTS (Page No. - 48)
    4.1 MICROBIOME MARKET OVERVIEW 
          FIGURE 16 RISING DISEASE INCIDENCE AND TECHNOLOGICAL ADVANCEMENTS TO DRIVE MARKET GROWTH
    4.2 NORTH AMERICA: MICROBIOME-BASED DIAGNOSTICS MARKET, BY PRODUCT & COUNTRY (2022) 
          FIGURE 17 KITS & REAGENTS ACCOUNTED FOR LARGEST SHARE OF NORTH AMERICAN MARKET IN 2022
    4.3 MICROBIOME-BASED DIAGNOSTICS MARKET: GEOGRAPHICAL SNAPSHOT 
          FIGURE 18 CHINA AND INDIA TO WITNESS HIGHEST GROWTH RATES DURING FORECAST PERIOD
    4.4 MICROBIOME-BASED DIAGNOSTICS MARKET: GEOGRAPHIC MIX 
          FIGURE 19 APAC TO WITNESS HIGHEST GROWTH DURING FORECAST PERIOD
    4.5 MICROBIOME-BASED DIAGNOSTICS MARKET: DEVELOPED VS. EMERGING ECONOMIES 
          FIGURE 20 EMERGING ECONOMIES TO REGISTER HIGHER GROWTH DURING FORECAST PERIOD
 
5 MARKET OVERVIEW (Page No. - 52)
    5.1 INTRODUCTION 
    5.2 MARKET DYNAMICS 
          FIGURE 21 MICROBIOME DIAGNOSTICS MARKET: DRIVERS, RESTRAINTS, OPPORTUNITIES, AND CHALLENGES
           5.2.1 DRIVERS
                    5.2.1.1 Growing prevalence of chronic diseases
                                FIGURE 22 GLOBAL INCIDENCE OF DIABETES, 2021 VS. 2045
                    5.2.1.2 Collaborative efforts between microbiome industry and academia for microbiome research
                    5.2.1.3 Growing demand for personalized medicine
                    5.2.1.4 Rising awareness about importance of human microbiomes
                    5.2.1.5 Rising funding and investments in microbiome research
           5.2.2 RESTRAINTS
                    5.2.2.1 End-user budget constraints in developing countries
           5.2.3 OPPORTUNITIES
                    5.2.3.1 Increased collaboration between key players and small innovative companies to work on new microbiome technologies
                                TABLE 3 COLLABORATIONS IN MICROBIOME-BASED DIAGNOSTICS MARKET
           5.2.4 CHALLENGES
                    5.2.4.1 Adverse impact of complex regulatory policies on commercialization of microbiome
    5.3 VALUE CHAIN ANALYSIS 
          FIGURE 23 VALUE CHAIN ANALYSIS: MAJOR VALUE ADDED DURING MANUFACTURING AND ASSEMBLY PHASES
    5.4 SUPPLY CHAIN ANALYSIS 
          FIGURE 24 DIRECT DISTRIBUTION—PREFERRED STRATEGY FOR PROMINENT COMPANIES
    5.5 PORTER’S FIVE FORCES ANALYSIS 
           5.5.1 THREAT OF NEW ENTRANTS
           5.5.2 INTENSITY OF COMPETITIVE RIVALRY
           5.5.3 BARGAINING POWER OF BUYERS
           5.5.4 BARGAINING POWER OF SUPPLIERS
           5.5.5 THREAT OF SUBSTITUTES
    5.6 KEY STAKEHOLDERS & BUYING CRITERIA 
           5.6.1 KEY STAKEHOLDERS IN BUYING PROCESS
                    FIGURE 25 INFLUENCE OF STAKEHOLDERS ON BUYING PROCESS FOR TOP 2 END USERS
           5.6.2 BUYING CRITERIA
                    FIGURE 26 KEY BUYING CRITERIA FOR TOP 2 END USERS
    5.7 REGULATORY LANDSCAPE 
           5.7.1 NORTH AMERICA
                    TABLE 4 NORTH AMERICA: REGULATORY BODIES, GOVERNMENT AGENCIES, AND OTHER ORGANIZATIONS
           5.7.2 EUROPE
                    TABLE 5 EUROPE: REGULATORY BODIES, GOVERNMENT AGENCIES, AND OTHER ORGANIZATIONS
           5.7.3 ASIA PACIFIC
                    TABLE 6 ASIA PACIFIC: REGULATORY BODIES, GOVERNMENT AGENCIES, AND OTHER ORGANIZATIONS
           5.7.4 REST OF THE WORLD
                    TABLE 7 REST OF THE WORLD: REGULATORY BODIES, GOVERNMENT AGENCIES, AND OTHER ORGANIZATIONS
    5.8 ECOSYSTEM ANALYSIS 
          TABLE 8 ROLE IN ECOSYSTEM
          FIGURE 27 KEY PLAYERS OPERATING IN MICROBIOME-BASED DIAGNOSTICS MARKET
    5.9 PATENT ANALYSIS 
    5.10 KEY CONFERENCES & EVENTS 
           TABLE 9 LIST OF CONFERENCES & EVENTS IN 2023–2024
    5.11 PRICING ANALYSIS 
           5.11.1 AVERAGE SELLING PRICE TREND OF KEY PLAYERS, BY APPLICATION
                     TABLE 10 PRICE RANGE OF PRODUCTS OFFERED BY KEY PLAYERS FOR APPLICATIONS (USD)
    5.12 TRENDS/DISRUPTIONS IMPACTING CUSTOMERS’ BUSINESSES 
    5.13 TECHNOLOGY ANALYSIS 
           5.13.1 DEVELOPMENT OF NOVEL MICROBIOME SAMPLING DEVICES
    5.14 TRADE ANALYSIS 
           TABLE 11 IMPORT DATA FOR HS CODE 902780, BY COUNTRY, 2018–2021 (USD MILLION)
           TABLE 12 EXPORT DATA FOR HS CODE 902780, BY COUNTRY, 2018–2021 (USD MILLION)
 
6 MICROBIOME DIAGNOSTICS MARKET, BY PRODUCT (Page No. - 69)
    6.1 INTRODUCTION 
          TABLE 13 MICROBIOME DIAGNOSTICS INDUSTRY, BY PRODUCT, 2021–2028 (USD MILLION)
    6.2 KITS & REAGENTS 
           6.2.1 KITS & REAGENTS TO DOMINATE MICROBIOME-BASED DIAGNOSTICS MARKET DURING FORECAST PERIOD
                    TABLE 14 MICROBIOME-BASED DIAGNOSTIC KITS & REAGENTS MARKET, BY REGION, 2021–2028 (USD MILLION)
    6.3 INSTRUMENTS 
           6.3.1 INCREASING VOLUME OF BLOOD COLLECTION PROCEDURES TO DRIVE MARKET GROWTH
                    TABLE 15 MICROBIOME-BASED DIAGNOSTIC INSTRUMENTS MARKET, BY REGION, 2021–2028 (USD MILLION)
 
7 MICROBIOME DIAGNOSTICS MARKET, BY TECHNOLOGY (Page No. - 73)
    7.1 INTRODUCTION 
          TABLE 16 MICROBIOME DIAGNOSTICS INDUSTRY, BY TECHNOLOGY, 2021–2028 (USD MILLION)
    7.2 16S RRNA SEQUENCING 
           7.2.1 ABILITY TO COMBINE MANY SAMPLES IN SEQUENCING RUN TO DRIVE DEMAND FOR NGS-BASED 16S RRNA SEQUENCING
                    TABLE 17 MICROBIOME-BASED DIAGNOSTICS MARKET FOR 16S RRNA SEQUENCING, BY REGION, 2021–2028 (USD MILLION)
    7.3 SHOTGUN METAGENOMICS 
           7.3.1 ABILITY OF SHOTGUN METAGENOMICS TO PROVIDE DETAILED GENETIC INFORMATION TO BOOST DEMAND
                    TABLE 18 COMPARISON BETWEEN SHOTGUN METAGENOMICS AND 16S RRNA SEQUENCING
                    TABLE 19 MICROBIOME-BASED DIAGNOSTICS MARKET FOR SHOTGUN METAGENOMICS, BY REGION, 2021–2028 (USD MILLION)
    7.4 METATRANSCRIPTOMICS 
           7.4.1 ONGOING TECHNOLOGICAL ADVANCEMENTS IN SEQUENCING INSTRUMENTS TO DRIVE GROWTH
                    TABLE 20 MICROBIOME-BASED DIAGNOSTICS MARKET FOR METATRANSCRIPTOMICS, BY REGION, 2021–2028 (USD MILLION)
    7.5 OTHER TECHNOLOGIES 
          TABLE 21 MICROBIOME-BASED DIAGNOSTICS MARKET FOR OTHER TECHNOLOGIES, BY REGION, 2021–2028 (USD MILLION)
 
8 MICROBIOME DIAGNOSTICS MARKET, BY SAMPLE (Page No. - 78)
    8.1 INTRODUCTION 
          TABLE 22 MICROBIOME DIAGNOSTICS INDUSTRY, BY SAMPLE, 2021–2028 (USD MILLION)
    8.2 FECAL SAMPLES 
           8.2.1 FECAL SAMPLES TO DOMINATE MICROBIOME-BASED DIAGNOSTICS MARKET DURING FORECAST PERIOD
                    TABLE 23 LIST OF MICROBIOME-BASED DIAGNOSTIC KITS FOR FECAL SAMPLES
                    TABLE 24 MICROBIOME-BASED DIAGNOSTICS MARKET FOR FECAL SAMPLES, BY REGION, 2021–2028 (USD MILLION)
    8.3 SALIVA SAMPLES 
           8.3.1 ADVANCEMENTS IN ORAL DIAGNOSTICS TO DRIVE MARKET GROWTH
                    TABLE 25 LIST OF MICROBIOME-BASED DIAGNOSTIC KITS FOR SALIVA SAMPLES
                    TABLE 26 MICROBIOME-BASED DIAGNOSTICS MARKET FOR SALIVA SAMPLES, BY REGION, 2021–2028 (USD MILLION)
    8.4 SKIN SAMPLES 
           8.4.1 GROWING FOCUS ON MICROBIOME RESEARCH ACTIVITIES TO BOOST MARKET
                    TABLE 27 LIST OF MICROBIOME-BASED DIAGNOSTIC KITS FOR SKIN SAMPLES
                    TABLE 28 MICROBIOME-BASED DIAGNOSTICS MARKET FOR SKIN SAMPLES, BY REGION, 2021–2028 (USD MILLION)
    8.5 OTHER SAMPLES 
          TABLE 29 LIST OF MICROBIOME-BASED DIAGNOSTIC KITS FOR OTHER SAMPLES
          TABLE 30 MICROBIOME-BASED DIAGNOSTICS MARKET FOR OTHER SAMPLES, BY REGION, 2021–2028 (USD MILLION)
 
9 MICROBIOME DIAGNOSTICS MARKET, BY APPLICATION (Page No. - 83)
    9.1 INTRODUCTION 
          TABLE 31 MICROBIOME-BASED DIAGNOSTICS MARKET, BY APPLICATION, 2021–2028 (USD MILLION)
    9.2 DISEASE DIAGNOSTIC APPLICATIONS 
          TABLE 32 MICROBIOME-BASED DIAGNOSTICS MARKET FOR DISEASE DIAGNOSTIC APPLICATIONS, BY TYPE, 2021–2028 (USD MILLION)
          TABLE 33 MICROBIOME-BASED DIAGNOSTICS MARKET FOR DISEASE DIAGNOSTIC APPLICATIONS, BY REGION, 2021–2028 (USD MILLION)
           9.2.1 GASTROINTESTINAL DISORDERS
                    9.2.1.1 Growing incidence of gastrointestinal disorders to drive market growth
                                TABLE 34 MICROBIOME-BASED DIAGNOSTICS MARKET FOR GASTROINTESTINAL DISORDERS, BY REGION, 2021–2028 (USD MILLION)
           9.2.2 METABOLIC DISORDERS
                    9.2.2.1 High prevalence of metabolic disorders to drive demand for microbiome-based diagnostic products
                                TABLE 35 MICROBIOME-BASED DIAGNOSTICS MARKET FOR METABOLIC DISORDERS, BY REGION, 2021–2028 (USD MILLION)
           9.2.3 OTHER DISEASE DIAGNOSTIC APPLICATIONS
                    TABLE 36 MICROBIOME-BASED DIAGNOSTICS MARKET FOR OTHER DISEASE DIAGNOSTIC APPLICATIONS, BY REGION, 2021–2028 (USD MILLION)
    9.3 RESEARCH APPLICATIONS 
           9.3.1 GROWING RESEARCH ACTIVITIES TO BOOST MARKET
                    TABLE 37 MICROBIOME-BASED DIAGNOSTICS MARKET FOR RESEARCH APPLICATIONS, BY REGION, 2021–2028 (USD MILLION)
 
10 MICROBIOME DIAGNOSTICS MARKET, BY END USER (Page No. - 89)
     10.1 INTRODUCTION 
             TABLE 38 MICROBIOME DIAGNOSTICS INDUSTRY, BY END USER, 2021–2028 (USD MILLION)
     10.2 HOSPITALS 
             10.2.1 HOSPITALS ACCOUNTED FOR LARGEST SHARE OF MICROBIOME-BASED DIAGNOSTICS MARKET IN 2022
                        TABLE 39 MICROBIOME-BASED DIAGNOSTICS MARKET FOR HOSPITALS, BY REGION, 2021–2028 (USD MILLION)
     10.3 RESEARCH INSTITUTES 
             10.3.1 GROWING FUNDING FOR MICROBIOME RESEARCH TO SUPPORT MARKET GROWTH
                        TABLE 40 MICROBIOME-BASED DIAGNOSTICS MARKET FOR RESEARCH INSTITUTES, BY REGION, 2021–2028 (USD MILLION)
     10.4 PHARMACEUTICAL & BIOTECHNOLOGY COMPANIES 
             10.4.1 GROWING FOCUS ON PERSONALIZED MEDICINE TO DRIVE DEMAND FOR MICROBIOME-BASED PRODUCTS
                        TABLE 41 MICROBIOME-BASED DIAGNOSTICS MARKET FOR PHARMACEUTICAL & BIOTECHNOLOGY COMPANIES, BY REGION, 2021–2028 (USD MILLION)
 
11 MICROBIOME DIAGNOSTICS MARKET, BY REGION (Page No. - 93)
     11.1 INTRODUCTION 
             TABLE 42 NORTH AMERICA: MICROBIOME-BASED DIAGNOSTICS MARKET, BY REGION, 2021–2028 (USD MILLION)
     11.2 NORTH AMERICA 
             FIGURE 28 NORTH AMERICA: MICROBIOME DIAGNOSTICS MARKET SNAPSHOT
             TABLE 43 NORTH AMERICA: MICROBIOME-BASED DIAGNOSTICS MARKET, BY COUNTRY, 2021–2028 (USD MILLION)
             TABLE 44 NORTH AMERICA: MICROBIOME-BASED DIAGNOSTICS MARKET, BY PRODUCT, 2021–2028 (USD MILLION)
             TABLE 45 NORTH AMERICA: MICROBIOME-BASED DIAGNOSTICS MARKET, BY TECHNOLOGY, 2021–2028 (USD MILLION)
             TABLE 46 NORTH AMERICA: MICROBIOME-BASED DIAGNOSTICS MARKET, BY SAMPLE, 2021–2028 (USD MILLION)
             TABLE 47 NORTH AMERICA: MICROBIOME-BASED DIAGNOSTICS MARKET, BY APPLICATION, 2021–2028 (USD MILLION)
             TABLE 48 NORTH AMERICA: MICROBIOME-BASED DIAGNOSTICS MARKET FOR DISEASE DIAGNOSTIC APPLICATIONS, BY TYPE, 2021–2028 (USD MILLION)
             TABLE 49 NORTH AMERICA: MICROBIOME-BASED DIAGNOSTICS MARKET, BY END USER, 2021–2028 (USD MILLION)
             11.2.1 US
                        11.2.1.1 US to account for largest share of during forecast period
                                      TABLE 50 US: MICROBIOME DIAGNOSTICS MARKET, BY PRODUCT, 2021–2028 (USD MILLION)
                                      TABLE 51 US: MICROBIOME-BASED DIAGNOSTICS MARKET, BY TECHNOLOGY, 2021–2028 (USD MILLION)
                                      TABLE 52 US: MICROBIOME-BASED DIAGNOSTICS MARKET, BY SAMPLE, 2021–2028 (USD MILLION)
                                      TABLE 53 US: MICROBIOME-BASED DIAGNOSTICS MARKET, BY APPLICATION, 2021–2028 (USD MILLION)
                                      TABLE 54 US: MICROBIOME-BASED DIAGNOSTICS MARKET FOR DISEASE DIAGNOSTIC APPLICATIONS, BY TYPE, 2021–2028 (USD MILLION)
                                      TABLE 55 US: MICROBIOME-BASED DIAGNOSTICS MARKET, BY END USER, 2021–2028 (USD MILLION)
             11.2.2 CANADA
                        11.2.2.1 High prevalence of diseases in Canada to support market growth
                                      TABLE 56 CANADA: MICROBIOME DIAGNOSTICS MARKET, BY PRODUCT, 2021–2028 (USD MILLION)
                                      TABLE 57 CANADA: MICROBIOME-BASED DIAGNOSTICS MARKET, BY TECHNOLOGY, 2021–2028 (USD MILLION)
                                      TABLE 58 CANADA: MICROBIOME-BASED DIAGNOSTICS MARKET, BY SAMPLE, 2021–2028 (USD MILLION)
                                      TABLE 59 CANADA: MICROBIOME-BASED DIAGNOSTICS MARKET, BY APPLICATION, 2021–2028 (USD MILLION)
                                      TABLE 60 CANADA: MICROBIOME-BASED DIAGNOSTICS MARKET FOR DISEASE DIAGNOSTIC APPLICATIONS, BY TYPE, 2021–2028 (USD MILLION)
                                      TABLE 61 CANADA: MICROBIOME-BASED DIAGNOSTICS MARKET, BY END USER, 2021–2028 (USD MILLION)
             11.2.3 NORTH AMERICA: RECESSION IMPACT
     11.3 EUROPE 
             TABLE 62 EUROPE: MICROBIOME DIAGNOSTICS MARKET, BY COUNTRY, 2021–2028 (USD MILLION)
             TABLE 63 EUROPE: MICROBIOME-BASED DIAGNOSTICS MARKET, BY PRODUCT, 2021–2028 (USD MILLION)
             TABLE 64 EUROPE: MICROBIOME-BASED DIAGNOSTICS MARKET, BY TECHNOLOGY, 2021–2028 (USD MILLION)
             TABLE 65 EUROPE: MICROBIOME-BASED DIAGNOSTICS MARKET, BY SAMPLE, 2021–2028 (USD MILLION)
             TABLE 66 EUROPE: MICROBIOME-BASED DIAGNOSTICS MARKET, BY APPLICATION, 2021–2028 (USD MILLION)
             TABLE 67 EUROPE: MICROBIOME-BASED DIAGNOSTICS MARKET FOR DISEASE DIAGNOSTIC APPLICATIONS, BY TYPE, 2021–2028 (USD MILLION)
             TABLE 68 EUROPE: MICROBIOME DIAGNOSTICS INDUSTRY, BY END USER, 2021–2028 (USD MILLION)
             11.3.1 GERMANY
                        11.3.1.1 Germany to dominate European microbiome diagnostics market during forecast period
                                      TABLE 69 GERMANY: MICROBIOME-BASED DIAGNOSTICS MARKET, BY PRODUCT, 2021–2028 (USD MILLION)
                                      TABLE 70 GERMANY: MICROBIOME-BASED DIAGNOSTICS MARKET, BY TECHNOLOGY, 2021–2028 (USD MILLION)
                                      TABLE 71 GERMANY: MICROBIOME-BASED DIAGNOSTICS MARKET, BY SAMPLE, 2021–2028 (USD MILLION)
                                      TABLE 72 GERMANY: MICROBIOME-BASED DIAGNOSTICS MARKET, BY APPLICATION, 2021–2028 (USD MILLION)
                                      TABLE 73 GERMANY: MICROBIOME-BASED DIAGNOSTICS MARKET FOR DISEASE DIAGNOSTIC APPLICATIONS, BY TYPE, 2021–2028 (USD MILLION)
                                      TABLE 74 GERMANY: MICROBIOME-BASED DIAGNOSTICS MARKET, BY END USER, 2021–2028 (USD MILLION)
             11.3.2 FRANCE
                        11.3.2.1 Growing number of microbiome sequencing start-ups to boost market growth
                                      TABLE 75 FRANCE: MICROBIOME DIAGNOSTICS MARKET, BY PRODUCT, 2021–2028 (USD MILLION)
                                      TABLE 76 FRANCE: MICROBIOME-BASED DIAGNOSTICS MARKET, BY TECHNOLOGY, 2021–2028 (USD MILLION)
                                      TABLE 77 FRANCE: MICROBIOME-BASED DIAGNOSTICS MARKET, BY SAMPLE, 2021–2028 (USD MILLION)
                                      TABLE 78 FRANCE: MICROBIOME-BASED DIAGNOSTICS MARKET, BY APPLICATION, 2021–2028 (USD MILLION)
                                      TABLE 79 FRANCE: MICROBIOME-BASED DIAGNOSTICS MARKET FOR DISEASE DIAGNOSTIC APPLICATIONS, BY TYPE, 2021–2028 (USD MILLION)
                                      TABLE 80 FRANCE: MICROBIOME-BASED DIAGNOSTICS MARKET, BY END USER, 2021–2028 (USD MILLION)
             11.3.3 UK
                        11.3.3.1 Supportive environment for microbiome sequencing R&D to support growth
                                      TABLE 81 UK: MICROBIOME DIAGNOSTICS MARKET, BY PRODUCT, 2021–2028 (USD MILLION)
                                      TABLE 82 UK: MICROBIOME-BASED DIAGNOSTICS MARKET, BY TECHNOLOGY, 2021–2028 (USD MILLION)
                                      TABLE 83 UK: MICROBIOME-BASED DIAGNOSTICS MARKET, BY SAMPLE, 2021–2028 (USD MILLION)
                                      TABLE 84 UK: MICROBIOME-BASED DIAGNOSTICS MARKET, BY APPLICATION, 2021–2028 (USD MILLION)
                                      TABLE 85 UK: MICROBIOME-BASED DIAGNOSTICS MARKET FOR DISEASE DIAGNOSTIC APPLICATIONS, BY TYPE, 2021–2028 (USD MILLION)
                                      TABLE 86 UK: MICROBIOME-BASED DIAGNOSTICS MARKET, BY END USER, 2021–2028 (USD MILLION)
             11.3.4 REST OF EUROPE
                        TABLE 87 REST OF EUROPE: MICROBIOME DIAGNOSTICS MARKET, BY PRODUCT, 2021–2028 (USD MILLION)
                        TABLE 88 REST OF EUROPE: MICROBIOME-BASED DIAGNOSTICS MARKET, BY TECHNOLOGY, 2021–2028 (USD MILLION)
                        TABLE 89 REST OF EUROPE: MICROBIOME-BASED DIAGNOSTICS MARKET, BY SAMPLE, 2021–2028 (USD MILLION)
                        TABLE 90 REST OF EUROPE: MICROBIOME-BASED DIAGNOSTICS MARKET, BY APPLICATION, 2021–2028 (USD MILLION)
                        TABLE 91 REST OF EUROPE: MICROBIOME-BASED DIAGNOSTICS MARKET FOR DISEASE DIAGNOSTIC APPLICATIONS, BY TYPE, 2021–2028 (USD MILLION)
                        TABLE 92 REST OF EUROPE: MICROBIOME DIAGNOSTICS INDUSTRY, BY END USER, 2021–2028 (USD MILLION)
             11.3.5 EUROPE: RECESSION IMPACT
     11.4 ASIA PACIFIC 
             FIGURE 29 ASIA PACIFIC: MICROBIOME DIAGNOSTICS MARKET SNAPSHOT
             TABLE 93 ASIA PACIFIC: MICROBIOME-BASED DIAGNOSTICS MARKET, BY COUNTRY, 2021–2028 (USD MILLION)
             TABLE 94 ASIA PACIFIC: MICROBIOME-BASED DIAGNOSTICS MARKET, BY PRODUCT, 2021–2028 (USD MILLION)
             TABLE 95 ASIA PACIFIC: MICROBIOME-BASED DIAGNOSTICS MARKET, BY TECHNOLOGY, 2021–2028 (USD MILLION)
             TABLE 96 ASIA PACIFIC: MICROBIOME-BASED DIAGNOSTICS MARKET, BY SAMPLE, 2021–2028 (USD MILLION)
             TABLE 97 ASIA PACIFIC: MICROBIOME-BASED DIAGNOSTICS MARKET, BY APPLICATION, 2021–2028 (USD MILLION)
             TABLE 98 ASIA PACIFIC: MICROBIOME-BASED DIAGNOSTICS MARKET FOR DISEASE DIAGNOSTIC APPLICATIONS, BY TYPE, 2021–2028 (USD MILLION)
             TABLE 99 ASIA PACIFIC: MICROBIOME-BASED DIAGNOSTICS MARKET, BY END USER, 2021–2028 (USD MILLION)
             11.4.1 CHINA
                        11.4.1.1 Collaborations between academic institutes and private companies to drive growth
                                      TABLE 100 CHINA: MICROBIOME DIAGNOSTICS MARKET, BY PRODUCT, 2021–2028 (USD MILLION)
                                      TABLE 101 CHINA: MICROBIOME-BASED DIAGNOSTICS MARKET, BY TECHNOLOGY, 2021–2028 (USD MILLION)
                                      TABLE 102 CHINA: MICROBIOME-BASED DIAGNOSTICS MARKET, BY SAMPLE, 2021–2028 (USD MILLION)
                                      TABLE 103 CHINA: MICROBIOME-BASED DIAGNOSTICS MARKET, BY APPLICATION, 2021–2028 (USD MILLION)
                                      TABLE 104 CHINA: MICROBIOME-BASED DIAGNOSTICS MARKET FOR DISEASE DIAGNOSTIC APPLICATIONS, BY TYPE, 2021–2028 (USD MILLION)
                                      TABLE 105 CHINA: MICROBIOME-BASED DIAGNOSTICS MARKET, BY END USER, 2021–2028 (USD MILLION)
             11.4.2 JAPAN
                        11.4.2.1 Rising aging population to drive market growth
                                      TABLE 106 JAPAN: MICROBIOME DIAGNOSTICS MARKET, BY PRODUCT, 2021–2028 (USD MILLION)
                                      TABLE 107 JAPAN: MICROBIOME-BASED DIAGNOSTICS MARKET, BY TECHNOLOGY, 2021–2028 (USD MILLION)
                                      TABLE 108 JAPAN: MICROBIOME-BASED DIAGNOSTICS MARKET, BY SAMPLE, 2021–2028 (USD MILLION)
                                      TABLE 109 JAPAN: MICROBIOME-BASED DIAGNOSTICS MARKET, BY APPLICATION, 2021–2028 (USD MILLION)
                                      TABLE 110 JAPAN: MICROBIOME-BASED DIAGNOSTICS MARKET FOR DISEASE DIAGNOSTIC APPLICATIONS, BY TYPE, 2021–2028 (USD MILLION)
                                      TABLE 111 JAPAN: MICROBIOME-BASED DIAGNOSTICS MARKET, BY END USER, 2021–2028 (USD MILLION)
             11.4.3 INDIA
                        11.4.3.1 Increasing prevalence of diseases to drive market growth
                                      TABLE 112 INDIA: MICROBIOME DIAGNOSTICS MARKET, BY PRODUCT, 2021–2028 (USD MILLION)
                                      TABLE 113 INDIA: MICROBIOME-BASED DIAGNOSTICS MARKET, BY TECHNOLOGY, 2021–2028 (USD MILLION)
                                      TABLE 114 INDIA: MICROBIOME-BASED DIAGNOSTICS MARKET, BY SAMPLE, 2021–2028 (USD MILLION)
                                      TABLE 115 INDIA: MICROBIOME-BASED DIAGNOSTICS MARKET, BY APPLICATION, 2021–2028 (USD MILLION)
                                      TABLE 116 INDIA: MICROBIOME-BASED DIAGNOSTICS MARKET FOR DISEASE DIAGNOSTIC APPLICATIONS, BY TYPE, 2021–2028 (USD MILLION)
                                      TABLE 117 INDIA: MICROBIOME DIAGNOSTICS INDUSTRY, BY END USER, 2021–2028 (USD MILLION)
             11.4.4 REST OF ASIA PACIFIC
                        TABLE 118 REST OF ASIA PACIFIC: MICROBIOME DIAGNOSTICS MARKET, BY PRODUCT, 2021–2028 (USD MILLION)
                        TABLE 119 REST OF ASIA PACIFIC: MICROBIOME-BASED DIAGNOSTICS MARKET, BY TECHNOLOGY, 2021–2028 (USD MILLION)
                        TABLE 120 REST OF ASIA PACIFIC: MICROBIOME-BASED DIAGNOSTICS MARKET, BY SAMPLE, 2021–2028 (USD MILLION)
                        TABLE 121 REST OF ASIA PACIFIC: MICROBIOME-BASED DIAGNOSTICS MARKET, BY APPLICATION, 2021–2028 (USD MILLION)
                        TABLE 122 REST OF ASIA PACIFIC: MICROBIOME-BASED DIAGNOSTICS MARKET FOR DISEASE DIAGNOSTIC APPLICATIONS, BY TYPE, 2021–2028 (USD MILLION)
                        TABLE 123 REST OF ASIA PACIFIC: MICROBIOME-BASED DIAGNOSTICS MARKET, BY END USER, 2021–2028 (USD MILLION)
             11.4.5 ASIA PACIFIC: RECESSION IMPACT
     11.5 REST OF THE WORLD 
             TABLE 124 REST OF THE WORLD: MICROBIOME DIAGNOSTICS MARKET, BY PRODUCT, 2021–2028 (USD MILLION)
             TABLE 125 REST OF THE WORLD: MICROBIOME-BASED DIAGNOSTICS MARKET, BY TECHNOLOGY, 2021–2028 (USD MILLION)
             TABLE 126 REST OF THE WORLD: MICROBIOME-BASED DIAGNOSTICS MARKET, BY SAMPLE, 2021–2028 (USD MILLION)
             TABLE 127 REST OF THE WORLD: MICROBIOME-BASED DIAGNOSTICS MARKET, BY APPLICATION, 2021–2028 (USD MILLION)
             TABLE 128 REST OF THE WORLD: MICROBIOME-BASED DIAGNOSTICS MARKET FOR DISEASE DIAGNOSTIC APPLICATIONS, BY TYPE, 2021–2028 (USD MILLION)
             TABLE 129 REST OF THE WORLD: MICROBIOME-BASED DIAGNOSTICS MARKET, BY END USER, 2021–2028 (USD MILLION)
             11.5.1 REST OF THE WORLD: RECESSION IMPACT
 
12 COMPETITIVE LANDSCAPE (Page No. - 134)
     12.1 OVERVIEW 
     12.2 KEY PLAYER STRATEGIES/RIGHT TO WIN 
             TABLE 130 OVERVIEW OF STRATEGIES ADOPTED BY KEY MICROBIOME-BASED DIAGNOSTIC MANUFACTURERS
     12.3 REVENUE ANALYSIS 
             FIGURE 30 REVENUE ANALYSIS OF KEY PLAYERS
     12.4 MARKET SHARE ANALYSIS 
             TABLE 131 MICROBIOME DIAGNOSTICS MARKET: DEGREE OF COMPETITION
     12.5 COMPANY EVALUATION MATRIX 
             12.5.1 STARS
             12.5.2 EMERGING LEADERS
             12.5.3 PERVASIVE PLAYERS
             12.5.4 PARTICIPANTS
                        FIGURE 31 MICROBIOME DIAGNOSTICS INDUSTRY: COMPANY EVALUATION MATRIX
             12.5.5 COMPANY FOOTPRINT ANALYSIS
                        TABLE 132 COMPANY FOOTPRINT
                        TABLE 133 COMPANY PRODUCT FOOTPRINT
                        TABLE 134 COMPANY REGIONAL FOOTPRINT
     12.6 START-UP/SME EVALUATION MATRIX 
             12.6.1 PROGRESSIVE COMPANIES
             12.6.2 RESPONSIVE COMPANIES
             12.6.3 DYNAMIC COMPANIES
             12.6.4 STARTING BLOCKS
                        FIGURE 32 MICROBIOME DIAGNOSTICS INDUSTRY: START-UP/SME EVALUATION MATRIX, 2022
             12.6.5 COMPETITIVE BENCHMARKING
                        TABLE 135 MICROBIOME DIAGNOSTICS INDUSTRY: DETAILED LIST OF KEY START-UPS/SMES
     12.7 COMPETITIVE SCENARIO & TRENDS 
             12.7.1 PRODUCT LAUNCHES & APPROVALS
                        TABLE 136 MICROBIOME DIAGNOSTICS INDUSTRY: PRODUCT LAUNCHES & APPROVALS, 2020–2023
             12.7.2 DEALS
                        TABLE 137 MICROBIOME DIAGNOSTICS INDUSTRY: DEALS, 2020–2023
 
13 COMPANY PROFILES (Page No. - 147)
     13.1 KEY PLAYERS 
(Business Overview, Products/Services/Solutions Offered, MnM View, Key Strengths and Right to Win, Strategic Choices Made, Weaknesses and Competitive Threats, Recent Developments)*
             13.1.1 GENETIC ANALYSIS AS
                        TABLE 138 GENETIC ANALYSIS AS: COMPANY OVERVIEW
                        FIGURE 33 GENETIC ANALYSIS AS: COMPANY SNAPSHOT (2022)
             13.1.2 DNA GENOTEK (ORASURE TECHNOLOGIES, INC.)
                        TABLE 139 DNA GENOTEK: COMPANY OVERVIEW
                        FIGURE 34 ORASURE TECHNOLOGIES, INC.: COMPANY SNAPSHOT (2022)
             13.1.3 MICROBA LIFE SCIENCES
                        TABLE 140 MICROBA LIFE SCIENCES: COMPANY OVERVIEW
                        FIGURE 35 MICROBA LIFE SCIENCES: COMPANY SNAPSHOT (2023)
             13.1.4 ILLUMINA INC.
                        TABLE 141 ILLUMINA INC.: COMPANY OVERVIEW
                        FIGURE 36 ILLUMINA INC.: COMPANY SNAPSHOT (2022)
             13.1.5 OXFORD NANOPORE TECHNOLOGIES, PLC
                        TABLE 142 OXFORD NANOPORE TECHNOLOGIES, PLC: COMPANY OVERVIEW
                        FIGURE 37 OXFORD NANOPORE TECHNOLOGIES, PLC.: COMPANY SNAPSHOT (2022)
             13.1.6 BIOME OXFORD LTD.
                        TABLE 143 BIOME OXFORD LTD.: COMPANY OVERVIEW
             13.1.7 VIENNALAB DIAGNOSTICS GMBH
                        TABLE 144 VIENNALAB DIAGNOSTICS GMBH: COMPANY OVERVIEW
             13.1.8 METABIOMICS (A SUBSIDIARY OF PRESCIENT MEDICINE HOLDINGS, INC.)
                        TABLE 145 METABIOMICS: COMPANY OVERVIEW
             13.1.9 VIOME LIFE SCIENCES
                        TABLE 146 VIOME LIFE SCIENCES: COMPANY OVERVIEW
             13.1.10 LUXIA SCIENTIFIC
                        TABLE 147 LUXIA SCIENTIFIC: COMPANY OVERVIEW
             13.1.11 SUN GENOMICS
                        TABLE 148 SUN GENOMICS: COMPANY OVERVIEW
             13.1.12 ATLAS BIOMED
                        TABLE 149 ATLAS BIOMED: COMPANY OVERVIEW
             13.1.13 QUANTBIOME, INC. (DBA OMBRE)
                        TABLE 150 QUANTBIOME, INC.: COMPANY OVERVIEW
             13.1.14 BECTON, DICKINSON AND COMPANY
                        TABLE 151 BECTON, DICKINSON AND COMPANY: COMPANY OVERVIEW
                        FIGURE 38 BECTON, DICKINSON AND COMPANY: COMPANY SNAPSHOT (2022)
             13.1.15 DAYTWO
                        TABLE 152 DAYTWO: COMPANY OVERVIEW
*Business Overview, Products/Services/Solutions Offered, MnM View, Key Strengths and Right to Win, Strategic Choices Made, Weaknesses and Competitive Threats, Recent Developments might not be captured in case of unlisted companies.
     13.2 OTHER PLAYERS 
             13.2.1 MICRONOMA
             13.2.2 TERAOMICS S.L.
             13.2.3 FLIGHTPATH BIOSCIENCES
             13.2.4 MICROBIOME RESEARCH PVT. LTD.
             13.2.5 ORIGIN SCIENCES
             13.2.6 LEUCINE RICH BIO PRIVATE LIMITED
             13.2.7 DECODE AGE
             13.2.8 EVVY
             13.2.9 ALPHABIOMICS, LTD.
             13.2.10 GOODGUT
 
14 APPENDIX (Page No. - 178)
     14.1 DISCUSSION GUIDE 
     14.2 KNOWLEDGESTORE: MARKETSANDMARKETS’ SUBSCRIPTION PORTAL 
     14.3 CUSTOMIZATION OPTIONS 
     14.4 RELATED REPORTS 
     14.5 AUTHOR DETAILS 

The objective of the study is to analyze the key market dynamics such as drivers, opportunities, challenges, restraints, and key player strategies. To track companies’ developments such as product launches and approvals, expansions, and partnerships of the leading players, the competitive landscape of the microbiome diagnostic market to analyze market players on various parameters within the broad categories of business and product strategy. Top-down and bottom-up approaches were used to estimate the market size. To estimate the market size of segments and subsegments, the market breakdown and data triangulation were used.

The four steps involved in estimating the market size are

Collecting Secondary Data

The secondary research data collection process involves the usage of secondary sources, directories, databases (such as Bloomberg Businessweek, Factiva, and D&B), annual reports, investor presentations, and SEC filings of companies. Secondary research was used to identify and collect information useful for the extensive, technical, market-oriented, and commercial study of the microbiome-based diagnostics market. A database of the key industry leaders was also prepared using secondary research.

Collecting Primary Data

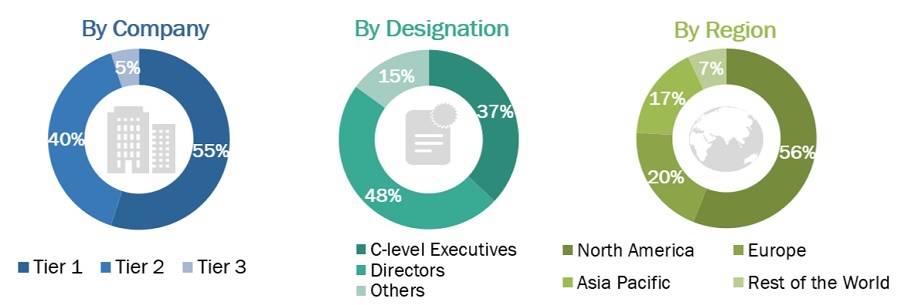
The primary research data was collected after acquiring knowledge about the microbiome diagnostics market scenario through secondary research. A significant number of primary interviews were conducted with stakeholders from both the demand side (such as doctors, nurses, and hospital purchase managers) and supply side (such as included various industry experts, such as Directors, Chief X Officers (CXOs), Vice Presidents (VPs) from business development, marketing and product development teams, product manufacturers, wholesalers, channel partners, and distributors) across major countries of North America, Europe, Asia Pacific, Rest of the World. Approximately 40% of the primary interviews were conducted with stakeholders from the demand side while those from the supply side accounted for the remaining 60%. Primary data for this report was collected through questionnaires, emails, and telephonic interviews.

A breakdown of the primary respondents is provided below:

Breakdown of Primary Participants:
Microbiome Diagnostics Market Size, and Share

Note 1: Others include sales managers, marketing managers, and product managers.

Note 2: Tiers are defined based on a company’s total revenue. As of 2022: Tier 1 = >USD 1 billion, Tier 2 = USD 500 million to USD 1 billion, and Tier 3 <USD 500 million.

To know about the assumptions considered for the study, download the pdf brochure

COMPANY NAME

DESIGNATION

DNA Genotek (US)

Manager

Viome Life Sciences (US)

VP Sales

Genetic Analysis AS (Norway)

Regional Sales Head

Becton, Dickinson and Company (US)

Sales Director

Market Size Estimation

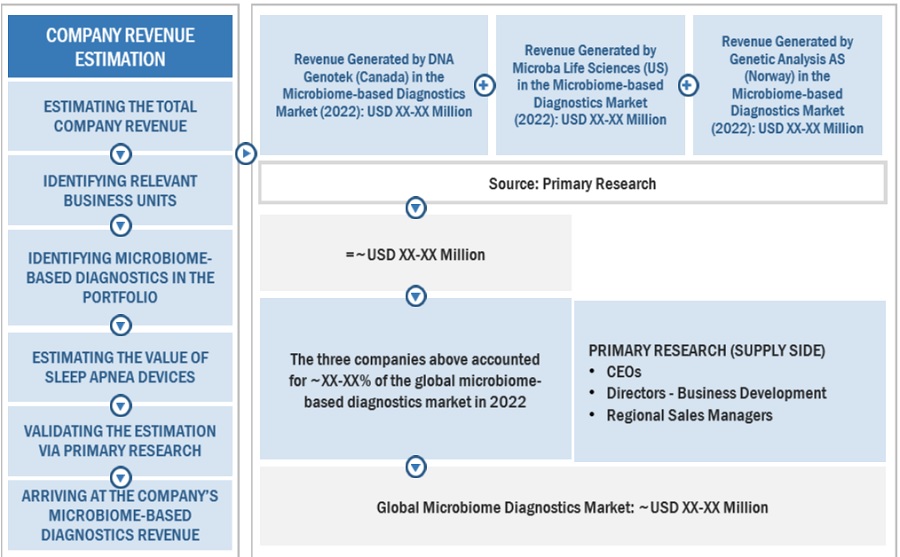
All major product manufacturers offering various microbiome diagnostics were identified at the global/regional level. Revenue mapping was done for the major players and was extrapolated to arrive at the global market value of each type of segment. The market value microbiome-based diagnostics market was also split into various segments and subsegments at the region and country level based on:

  • Product mapping of various manufacturers for each type of microbiome diagnostics products at the regional and country level
  • Relative adoption pattern of each product type among key application segments at the regional and/or country-level
  • Detailed primary research to gather qualitative and quantitative information related to segments and subsegments at the regional and/or country level.
  • Detailed secondary research to gauge the prevailing market trends at the regional and/or country-level

Global Microbiome Diagnostics Market Size: Bottom Up Approach
Microbiome Diagnostics Market Size, and Share

To know about the assumptions considered for the study, Request for Free Sample Report

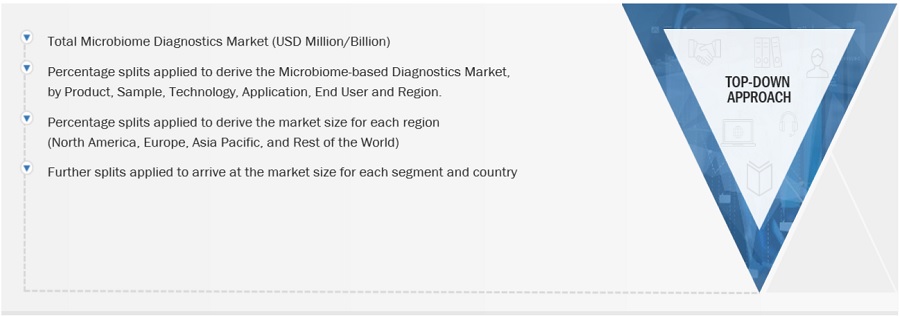
Global Microbiome Diagnostics Market Size: Top-Down Approach
Microbiome Diagnostics Market Size, and Share

Data Triangulation

After arriving at the overall market size—using the market size estimation processes—the market was split into several segments and subsegments. To complete the overall market engineering process and arrive at the exact statistics of each market segment and subsegment, the data triangulation, and market breakdown procedures were employed, wherever applicable. The data was triangulated by studying various factors and trends from both the demand and supply sides in the microbiome-based diagnostics industry.

Market Definition

Microbiom diagnostic products are used to investigate and understand the complex communities of microorganisms living in and on the human body. Microbiome diagnostics involves collecting samples from various body sites, such as the skin, gut, mouth, and other mucosal surfaces, and analyzing the genetic material such as DNA, RNA of the microorganisms within these samples.

Key Stakeholders

  • Manufacturers and distributors of microbiome-based diagnostics products
  • Pharmaceutical and Biotechnology Companies
  • R & D centers
  • Diagnostic laboratories
  • Hospitals and clinics
  • Academic institutes
  • Research institutes
  • Market research and consulting firms

Report Objectives

  • To define, describe, segment, and forecast the global microbiome diagnostics market by product, sample, application, end user and region.
  • To provide detailed information regarding the major factors influencing the market growth (such as drivers, restraints, opportunities, challenges, and trends)
  • To analyze the micromarkets1 with respect to individual growth trends, prospects, and contributions to the overall microbiome diagnostics market
  • To analyze market opportunities for stakeholders and provide details of the competitive landscape for key players
  • To forecast the size of the market segments with respect to four regions, namely, North America, Europe, the Asia Pacific, and the Rest of the World
  • To profile the key players and comprehensively analyze their product portfolios, market positions, and core competencies2
  • To benchmark players within the market using the proprietary Competitive Leadership Mapping framework, which analyzes market players on various parameters within the broad categories of business and product excellence

Available Customizations

With the given market data, MarketsandMarkets offers customizations as per the company’s specific needs. The following customization options are available for this report:

Geographic Analysis

  • Further breakdown of the microbiome-based diagnostics market into specific countries/regions in the Rest of Europe, Rest of Asia Pacific, and Rest of the World.

Company Information

  • Detailed analysis and profiling of additional market players (up to 3)
Custom Market Research Services

We will customize the research for you, in case the report listed above does not meet with your exact requirements. Our custom research will comprehensively cover the business information you require to help you arrive at strategic and profitable business decisions.

Request Customization
Report Code
MD 8949
Published ON
Feb, 2024
Choose License Type
BUY NOW
  • SHARE
X
Request Customization
Speak to Analyst
Speak to Analyst
OR FACE-TO-FACE MEETING
PERSONALIZE THIS RESEARCH
  • Triangulate with your Own Data
  • Get Data as per your Format and Definition
  • Gain a Deeper Dive on a Specific Application, Geography, Customer or Competitor
  • Any level of Personalization
REQUEST A FREE CUSTOMIZATION
LET US HELP YOU!
  • What are the Known and Unknown Adjacencies Impacting the Microbiome Diagnostics Market
  • What will your New Revenue Sources be?
  • Who will be your Top Customer; what will make them switch?
  • Defend your Market Share or Win Competitors
  • Get a Scorecard for Target Partners
CUSTOMIZED WORKSHOP REQUEST
knowledgestore logo

Want to explore hidden markets that can drive new revenue in Microbiome Diagnostics Market?

Find Hidden Markets
  • Call Us
  • +1-888-600-6441 (Corporate office hours)
  • +1-888-600-6441 (US/Can toll free)
  • +44-800-368-9399 (UK office hours)
CONNECT WITH US
ABOUT TRUST ONLINE
©2024 MarketsandMarkets Research Private Ltd. All rights reserved
DMCA.com Protection Status
Website Feedback