The study involved four major activities in estimating the current size of the model based enterprise market size . Exhaustive secondary research has been done to collect information on the market, peer, and parent markets. The next step has been to validate these findings, assumptions, and sizing with industry experts across the value chain through primary research. Both top-down and bottom-up approaches have been employed to estimate the total market size. After that, market breakdown and data triangulation methods were used to estimate the market size of segments and subsegments. Two sources of information-secondary and primary-have been used to identify and collect information for an extensive technical and commercial study of the model based enterprise market.
Secondary Research
Secondary sources include company websites, magazines, industry news, associations, and databases (Factiva and Bloomberg). These secondary sources include annual reports, press releases, investor presentations of companies, white papers, certified publications, articles by recognized authors, regulatory bodies, trade directories, and databases.
Primary Research
Primary sources mainly consist of several experts from the core and related industries, along with preferred model based enterprise software providers, distributors, alliances, standards, and certification organizations related to various segments of this industry’s value chain.
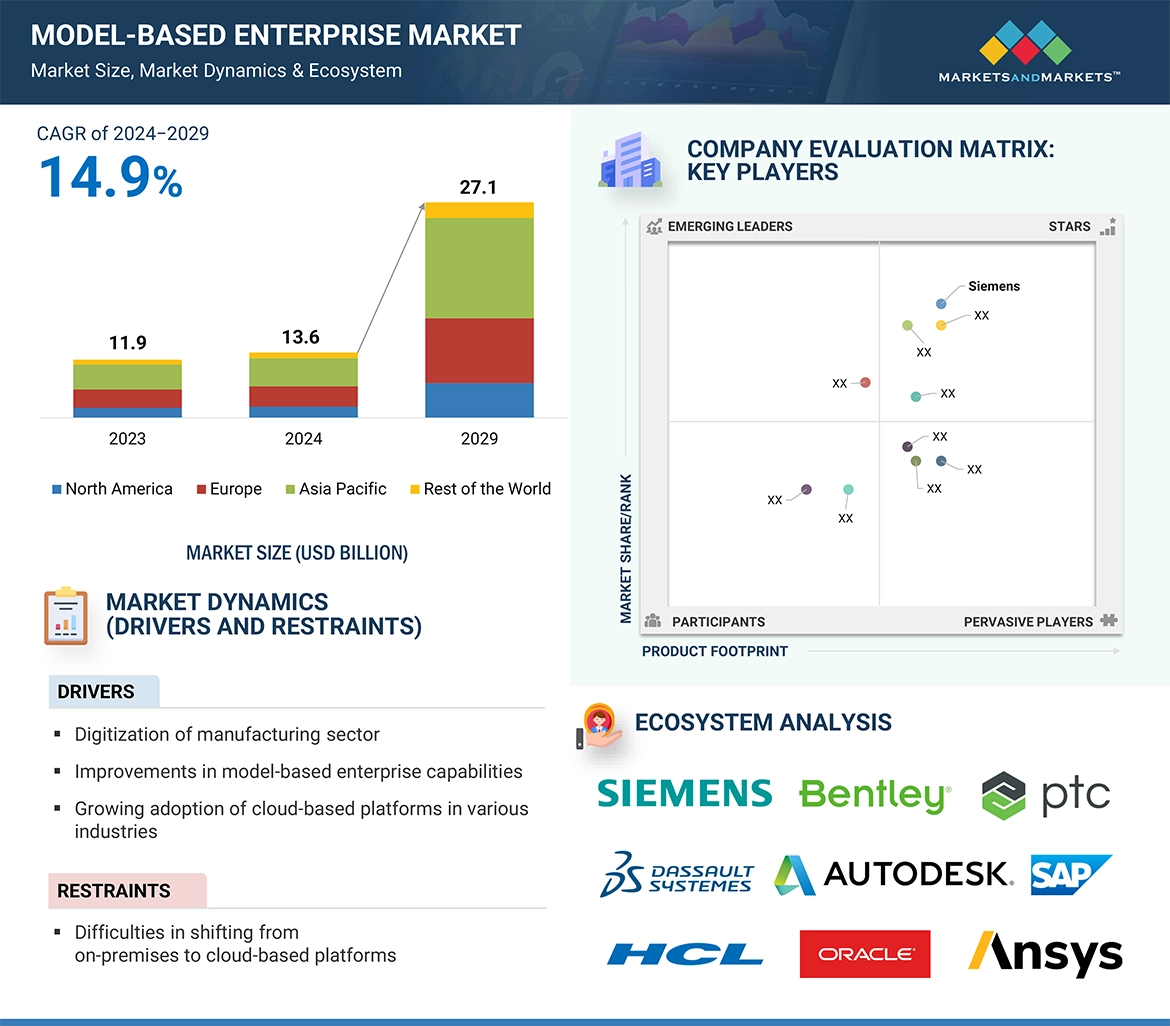
In the primary research process, various primary sources from both the supply and demand sides were interviewed to obtain qualitative and quantitative information on the market. The primary sources from the supply side included various industry experts such as Chief Experience Officers (CXOs), Vice Presidents (VPs), and Directors from business development, marketing, product development/innovation teams, and related key executives from model based enterprise software providers, such as Siemens (Germany), PTC (US), Dassault Systèmes (France), SAP (Germany), Autodesk Inc. (US), HCL Technologies Limited (India), and Oracle (US); research organizations, distributors, industry associations, and key opinion leaders. Following is the breakdown of primary respondents.

To know about the assumptions considered for the study, download the pdf brochure
Market Size Estimation
Both top-down and bottom-up approaches have been used to estimate and validate the total size of the model based enterprise market. These methods have also been used extensively to estimate the size of various subsegments in the market. The following research methodology has been used to estimate the market size:
-
Major players in the industry and markets have been identified through extensive secondary research.
-
The industry’s value chain and market size (in terms of value) have been determined through primary and secondary research processes.
-
All percentage shares, splits, and breakdowns have been determined using secondary sources and verified through primary sources.
Top-Down Approach
In the top-down approach, the overall market size has been used to estimate the size of the individual market segments (mentioned in market segmentation) through percentage splits from secondary and primary research. For specific market segments, the size of the most appropriate immediate parent market has been used to implement the top-down approach. The bottom-up approach has also been implemented for data obtained from secondary research to validate the market size of various segments.
Model Based Enterprise Market: Top-down Approach

Bottom-Up Approach
The bottom-up approach has been used to arrive at the overall size of the model based enterprise market from the revenues of the key players and their market shares. Calculations based on revenues of key companies identified in the market led to the estimation of their overall market size.
Model Based Enterprise Market: Bottom-up Approach

Data Triangulation
After arriving at the overall market size from the estimation process explained above, the overall market has been split into several segments and subsegments. The market breakdown and data triangulation procedures have been employed, wherever applicable, to complete the overall market engineering process and arrive at the exact statistics for all segments and subsegments. The data has been triangulated by studying various factors and trends from both the demand and supply sides. The market has also been validated using both top-down and bottom-up approaches.
Market Definition
Model based enterprise is a global initiative to augment 3D models with additional information to create new documentation deliverables beyond engineering. This Model Based Enterprise (MBE) initiatives are constructed on Model Based Definition (MBD) initiatives as a 3D model with embedded PMI (Product Manufacturing Information) to offer integrated and collaborative environment and to transform an enterprise’s engineering, manufacturing, and aftermarket services through product data reuse and derived context rather than interpreting inputs and recreating the models and drawings. MBE utilizes the standard CAD functionality of layers and saved views to provide the user access to just the information required.
Key Stakeholders
-
Industry associations
-
Associations and regulatory authorities related to 3D modeling
-
Government bodies, venture capitalists, and private equity firms
-
Manufacturers of model based enterprise solutions
-
Maintenance personnel, developers, and suppliers of model based enterprise offerings
-
Research institutes and organizations
Report Objectives
-
To define and forecast the model based enterprise market size regarding offering, deployment type, and industry.
-
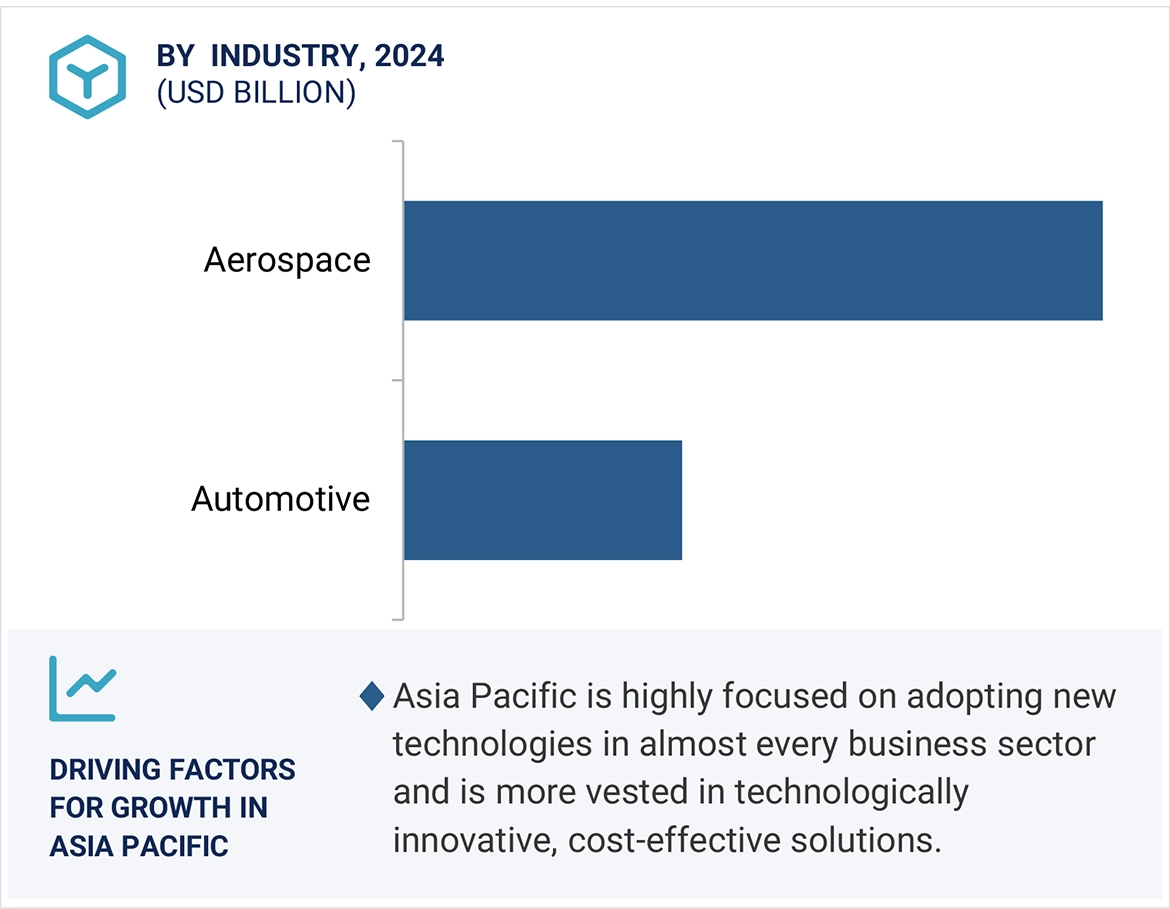
To describe and forecast the model based enterprise market share and its value segments for four regions—North America, Europe, Asia Pacific, and the Rest of the World (RoW), along with their respective countries.
-
To provide detailed information regarding the drivers, restraints, opportunities, and challenges influencing the growth of the market
-
To strategically analyze micro-markets concerning individual growth trends, prospects, and contributions to the overall market
-
To study the complete value chain of the model based enterprise market
-
To analyze opportunities in the market for stakeholders by identifying high-growth segments of the market
-
To strategically profile key players and comprehensively analyze their market position regarding ranking and core competencies, along with a detailed market competitive landscape.
-
To analyze strategic approaches such as agreements, collaborations, and partnerships in the model based enterprise market
-
To provide an analysis of the recession impact on the growth of the market and its segments
Available Customizations:
Based on the given market data, MarketsandMarkets offers customizations in the reports according to the client’s specific requirements. The available customization options are as follows:
Company Information
-
Detailed analysis and profiling of additional market players (up to 5)


Jack
Apr, 2026
How will the ongoing digitization of manufacturing and the shift toward model-based enterprise frameworks impact long-term revenue growth and valuation multiples for key players?.
Tyler
Apr, 2026
What is the ROI timeline for enterprises transitioning from traditional systems to model-based enterprise platforms, particularly when shifting from on-premises to cloud-based deployment?.