Mulch Films Market

Mulch Films Market Size, Share, Industry Growth, Trends Report by Type (Clear/Transparent, Black Mulch, Colored Mulch, Photo-selective Mulch, Degradable Mulch), Application (Agricultural and Horticulture), Element (LLDPE, LDPE, HDPE, EVA, PLA, PHA) and Region - Global Forecast to 2028

Report Code: AGI 4161 Nov, 2023, by marketsandmarkets.com

The global mulch films market is estimated at US$7.8 billion in the year 2023, is projected to reach a revised size of US$10.6 billion by 2028, growing at a CAGR of 6.5% over the analysis period 2023-2028 Mulch films are thin sheets of plastic or other materials that are placed on the surface of the soil to suppress weeds, retain moisture, and improve crop yields. They are available in a variety of colors, thicknesses, and materials, and can be used in a wide range of agricultural and horticultural applications.

Mulch films can be made from a variety of materials, including polyethylene, polypropylene, and biodegradable materials such as paper and cornstarch. Mulch films work by creating a barrier between the soil surface and the atmosphere. This barrier prevents sunlight from reaching weed seeds, which inhibits their germination and growth. It also helps to retain moisture in the soil, which can reduce the need for irrigation. Additionally, mulch films can help to improve soil temperature by trapping heat from the sun. This can be beneficial for crops that require warmer temperatures for optimal growth.

Mulch Films Market

To know about the assumptions considered for the study, Request for Free Sample Report

Mulch Films Market Dynamics

Drivers:Rising demand for greenhouse applications coupled with rising environmental concerns

The mulch film market is experiencing a significant surge in demand due to the growing interest in greenhouse applications, which is closely tied to rising environmental concerns. Greenhouses are increasingly used in agriculture to create controlled environments for cultivating various crops. They offer protection from adverse weather conditions, pests, and diseases, allowing for year-round cultivation. This rising demand for greenhouse applications is primarily driven by the need for increased food production to feed the growing global population and the desire to reduce the environmental impact of traditional open-field farming.

As the demand for greenhouse applications continues to rise in response to these environmental concerns and the need for efficient and sustainable agriculture, the mulch film market is set to expand further. This trend aligns with broader efforts to promote eco-friendly farming practices and reduce the ecological footprint of the agricultural industry, making mulch films an essential component of modern, environmentally conscious agriculture.

Restraints in the Mulch Films Market: Implementation of additional pest and disease management measures for farmers

Mulch films are widely used in agriculture to improve crop yields, conserve soil moisture, and control weed growth, but the requirement for farmers to adopt additional pest and disease management measures can hinder their adoption. For instance, in some regions, pests like nematodes can become a major problem for crops, and farmers need to implement strategies such as crop rotation, use of chemical pesticides, or biological control methods to combat these pests effectively. In such cases, the use of mulch films may be less appealing because they can create a conducive environment for pest proliferation, trapping heat and moisture beneath the film. This, in turn, may require farmers to invest more time and resources in monitoring and managing pest issues, potentially increasing their operational costs.

Opportunities: Increasing demand for environmentally friendly and biodegradable mulch films

The increasing demand for environmentally friendly and biodegradable mulch films presents a significant opportunity in the agricultural industry, particularly in developed regions like North America and Europe. As governments in these regions actively discourage traditional plastics due to environmental concerns, stringent regulations are being set to restrict their usage. For instance, according to the news release by Agriland Media Ltd., in July 2022, maize plastic was banned from the EU market under the EU directive. This shift towards sustainability and eco-conscious agriculture is driving the biodegradable mulch films market, which are poised for substantial growth during the forecast period.

Mulch Films Market

To know about the assumptions considered for the study, download the pdf brochure

Several key companies in the mulch films market, including industry leaders like BASF SE (Germany), Armando Alvarez Group (Spain), and Novamont S.p.A. (Italy), have recognized the importance of environmental considerations in the agricultural sector. For example, BAS SE (Germany) has recently revealed in April 2023, to establish compounding capacities of Ecovio, a biodegradable mulch film, in Asia-Pacific as of mid-2023. They are proactively manufacturing biodegradable films that align with these principles, along with expanding the market around the globe thereby fostering the growth of this innovative market segment.

Challenges: Installation and maintenance of mulch films

The challenges related to installation and maintenance have a significant impact on the mulch film market. Farmers may be discouraged from adopting mulch films due to the labor-intensive and technical nature of installation. Moreover, the ongoing maintenance requirements can add to the overall cost, affecting the cost-benefit analysis for farmers. In regions where skilled labor is scarce or expensive, these challenges can be a major deterrent to the adoption of mulch films, ultimately impacting their market growth.

The challenges in the installation and maintenance of mulch film in agricultural practices are often intertwined with the cost of labor considerations. Many farms face the decision of whether to use local labor or opt for H-2A labor, which consists of temporary agricultural workers. While some farms pay the same hourly rate to both machinery operators and manual laborers, others differentiate hourly rates by activity. The decision to employ H-2A workers can have significant cost implications. Even if the hourly wage rates are comparable between H-2A workers and local labor, additional expenses related to H-2A labor, such as housing, transportation, and agency fees, can substantially increase labor costs. When assessing the installation and maintenance of mulch films, it is essential to factor in all costs associated with H-2A workers to determine accurate hourly wage rates that encompass the complete spectrum of labor expenses.

Mulch Films Market Ecosystem

Mulch Films Market

Linear Low-Density Polyethylene (LLDPE) Is One Of The Mulch Film Elements That Is Dominated With The Highest Mulch Films Market Share In 2022.

LLDPE mulch films are a type of plastic film that is used to cover the soil around plants. They are made from linear low-density polyethylene (LLDPE), which is a type of plastic that is known for its strength, durability, and flexibility. LLDPE mulch films are typically black or silver, and they come in a variety of thicknesses and widths. Additionally, LLDPE mulch films are a versatile and sustainable product that can help farmers improve their yields and reduce their environmental impact. As the demand for food continues to grow, LLDPE mulch films are likely to play an increasingly important role in agriculture.

India Is One Of The Fastest Growing Markets For Mulch Films In Asia Pacific.

The demand for mulch films in India is increasing rapidly, driven by a number of factors, including Growing awareness of the benefits of mulch films, such as improved crop yields, reduced water consumption, and weed suppression, expanding area under cultivation of high-value crops, such as fruits and vegetables, which are more likely to be mulched, and Increasing government support for the use of mulch films, in the form of subsidies and other incentives.

A few government agencies that develop awareness of mulch films include The Ministry of Agriculture and Farmers Welfare is the nodal agency for the development and promotion of agriculture in India. The Ministry's website provides a wealth of information on mulch films, including the demand for mulch films in India, the benefits of mulch films, and government schemes for the promotion of mulch films. NHB is a statutory body under the Ministry of Agriculture and Farmers Welfare, Government of India. NHB is responsible for the development and promotion of horticulture in India. The NHB's website provides information on the demand for mulch films in India, the benefits of mulch films for horticultural crops, and NHB schemes for the promotion of mulch films.

The adoption of mulch films in India is increasing, as farmers become more aware of the benefits offered. However, there are still some challenges that need to be addressed. One challenge is the cost of mulch films. Mulch films can be expensive, especially for small-scale farmers. Another challenge is the availability of mulch films. Mulch films are not always readily available in rural areas. These are the challenges in the mulch films market.

Mulch Films Market by Region

Key Market Players in the Mulch Films Market

The key players in this market include Berry Global Inc. (US), BASF SE (Germany), Dow (US), Kuraray (Japan), Exxon Mobil Corporation (US), Plastika Kritis S.A. (Greece), RKW Group (Germany), Achilles Corporation (Japan), Armando Alvarez Group (Spain), and Novamont S.p.A (Italy).

Scope of the Mulch Films Market Report

Report Metric

Details

Market valuation in 2023

USD 7.8 billion

Revenue forecast in 2028

USD 10.6 billion

Progress rate

CAGR of 6.5% from 2023 - 2028

Market size estimation

2023–2028

Base year considered

2022

Segments Covered

By Type, Application, Element, and Region

Regions covered

North America, Europe, Asia Pacific, South America, and RoW

Companies studied

  • BASF SE (Germany)
  • Berry Global Inc (US)
  • Dow (US)
  • Kuraray (Japan)
  • Exxon Mobil Corporation (US)
  • RKW Group (Germany)
  • Intergro, Inc (US)
  • Plastika Kritis S.A. (Greece)
  • Kothari Group (India)
  • Captain Polyplast Ltd (India)
  • And more

Target Audience of the Mulch Films Market

  • Mulch films manufacturers, formulators, and blenders
  • Mulch films traders, suppliers, distributors, importers, and exporters
  • Government Agricultural Authorities
  • Chemical Intermediate and Technology Providers
  • Mulch films manufacturers
  • Commercial research & development (R&D) organizations and financial institutions
  • Government agricultural departments and regulatory bodies such as the US Environmental Protection Agency (EPA), US Department of Agriculture (USDA), Food and Agriculture Organization (FAO), The Organization for Economic Co-operation and Development (OECD), International Mulch Film Association (IMFA), National Agricultural Plastics Association (NAPA), Plastic Film Manufacturers Association (PFMA), and International Association for Agricultural, Environment, and Food Chemistry (IAAEFC).

Mulch Films Market Segmentation:

This research report categorizes the market, based on type, application, element, and region.

Aspect

Details

By Type

  • Clear/Transparent
  • Black Mulch
  • Colored Mulch
  • Photo-selective Mulch
  • Degradable Mulch
    • Biodegradable Mulch
    • Photodegradable Mulch
  • Other Types

By Application

  • Agricultural Farms
  • Horticulture

By Element

  • LLDPE
  • LDPE
  • HDPE
  • EVA
  • PLA
  • PHA
  • Other Elements

By Region

  • North America
  • Europe
  • Asia Pacific
  • South America
  • Rest of the World (RoW)

Recent Developments in Mulch Films Market

  • In April 2023, BASF SE plans to make commercial quantities of Ecovio available to customers throughout the Asia-Pacific region starting in mid-2023. These initial offerings will include film grades designed for various applications, such as certified compostable shopping and organic waste bags, soil-biodegradable agricultural mulch films, and packaging materials. This development underscores the company’s commitment to driving positive change in the plastics industry in various applications and contributing to a more sustainable future in the Asia-Pacific market.
  • In July 2022, Dow collaborated with Valoregen for the construction of the most extensive single hybrid recycling facility in Damazan, France. This facility is designed to have the capability to process a substantial 70 kilotons of plastic waste annually. Dow has been chosen as the primary recipient of post-consumer resins (PCR) from Valoregen's innovative new plant. In the future, this site is poised to offer a distinctive blend of advanced and mechanical recycling facilities, all within a single, integrated ecosystem.
  • In May 2022, Berry Global Inc joined forces with Cleanfarms and Poly-Ag Recycling to spearhead an innovative, closed-loop strategy aimed at enhancing Canada's circular economy. This collaborative recycling initiative, launched in early 2022, is focused on retrieving used agricultural films, processing reclaimed grain bag materials, and utilizing recycled content to create new products.
  • In January 2022, Exxon Mobil Corporation and SABIC have successfully commenced operations at the Gulf Coast Growth Ventures world-scale manufacturing facility in San Patricio County, Texas. The new facility is designed to meet the increasing demand for performance products and will produce materials utilized in various applications, including packaging, agricultural film, construction materials, clothing, and automotive coolants. The operation comprises a 1.8 million metric ton per year ethane steam cracker, two polyethylene units with a combined capacity of up to 1.3 million metric tons per year, and a monoethylene glycol unit capable of producing 1.1 million metric tons per year.
  • In September 2021, BASF SE and WPO POLYMERS entered into a strategic partnership to further its biopolymers business and extend its reach into the rapidly evolving Spanish and Portuguese markets. As part of this collaboration, WPO Polymers, a prominent plastics solutions provider, will take on the role of distributor for BASF's Ecovio film product range. This range includes certified compostable shopping bags, organic waste bags, and fruit and vegetable bags. By leveraging their respective strengths and expertise, BASF and WPO Polymers are strategically positioned to expedite their business activities within these crucial markets.
  • In August 2020, RKW Group is actively advancing its commitment to reducing plastic waste by incorporating recycled materials into its high-quality films. This progress includes the establishment of a new five-layer production line at RKW Group's facility in Pori, Finland, aimed at creating lawn and garden films with a substantial proportion of recycled content, including post-consumer recyclate (PCR). The company intends to further increase the use of recycled PCR material while maintaining the essential qualities of these films, such as exceptional printability, high opacity, and puncture resistance, among others. This expansion will allow the company to extend its sustainable practices to the production of films for food and beverage packaging, further aligning with its commitment to environmentally responsible manufacturing.

Frequently Asked Questions (FAQ):

To speak to our analyst for a discussion on the above findings, click Speak to Analyst

TABLE OF CONTENTS
 
1 INTRODUCTION (Page No. - 32)
    1.1 STUDY OBJECTIVES 
    1.2 MARKET DEFINITION 
           1.2.1 INCLUSIONS AND EXCLUSIONS
                    TABLE 1 INCLUSIONS & EXCLUSIONS
    1.3 STUDY SCOPE 
           FIGURE 1 MARKET SEGMENTATION
           1.3.1 REGIONS COVERED
           1.3.2 YEARS CONSIDERED
    1.4 CURRENCY CONSIDERED 
           TABLE 2 USD EXCHANGE RATES, 2018–2022
    1.5 UNITS CONSIDERED 
    1.6 STAKEHOLDERS 
    1.7 SUMMARY OF CHANGES 
           1.7.1 RECESSION IMPACT
 
2 RESEARCH METHODOLOGY (Page No. - 37)
    2.1 RESEARCH DATA 
           FIGURE 2 MULCH FILMS MARKET: RESEARCH DESIGN
           2.1.1 SECONDARY DATA
                    2.1.1.1 Key data from secondary sources
           2.1.2 PRIMARY DATA
                    2.1.2.1 Key data from primary sources
                    2.1.2.2 Key insights from industry experts
                    2.1.2.3 Breakdown of primary profiles
                               FIGURE 3 BREAKDOWN OF PRIMARY INTERVIEWS, BY COMPANY TYPE, DESIGNATION, AND REGION
    2.2 MARKET SIZE ESTIMATION 
           2.2.1 MARKET SIZE ESTIMATION: BOTTOM-UP APPROACH
                    FIGURE 4 MARKET SIZE ESTIMATION: BOTTOM-UP APPROACH
           2.2.2 MARKET SIZE ESTIMATION: TOP-DOWN APPROACH
                    FIGURE 5 MARKET SIZE ESTIMATION: TOP-DOWN APPROACH (BASED ON GLOBAL MARKET)
    2.3 DATA TRIANGULATION 
           FIGURE 6 DATA TRIANGULATION
    2.4 RESEARCH ASSUMPTIONS 
           FIGURE 7 RESEARCH ASSUMPTIONS
    2.5 RESEARCH LIMITATIONS & RISK ASSESSMENT 
           FIGURE 8 LIMITATIONS & RISK MANAGEMENT
    2.6 RECESSION IMPACT ANALYSIS 
           2.6.1 MACRO INDICATORS OF RECESSION
                    FIGURE 9 INDICATORS OF RECESSION
                    FIGURE 10 GLOBAL INFLATION RATE, 2012–2022
                    FIGURE 11 GLOBAL GROSS DOMESTIC PRODUCT, 2012–2022 (USD TRILLION)
                    FIGURE 12 RECESSION INDICATORS AND THEIR IMPACT ON THE MARKET
                    FIGURE 13 GLOBAL MARKET: CURRENT FORECAST VS. RECESSION IMPACT FORECAST
 
3 EXECUTIVE SUMMARY (Page No. - 50)
    TABLE 3 MULCH FILMS MARKET SNAPSHOT, 2023 VS. 2028 
    FIGURE 14 MARKET, BY TYPE, 2023 VS. 2028 (USD MILLION) 
    FIGURE 15 MARKET, BY ELEMENT, 2023 VS. 2028 (USD MILLION) 
    FIGURE 16 MARKET, BY APPLICATION, 2023 VS. 2028 (USD MILLION) 
    FIGURE 17 MARKET SHARE (VALUE), BY REGION, 2023 
 
4 PREMIUM INSIGHTS (Page No. - 55)
    4.1 ATTRACTIVE OPPORTUNITIES FOR PLAYERS IN THE MARKET 
           FIGURE 18 INCREASE IN AGRICULTURAL PRODUCTION TO DRIVE MARKET
    4.2 ASIA PACIFIC: MARKET, BY TYPE AND COUNTRY 
           FIGURE 19 BLACK MULCH SEGMENT AND CHINA TO ACCOUNT FOR MARKET SHARES IN 2023
    4.3 MARKET: REGIONAL SUBMARKETS 
           FIGURE 20 CHINA TO ACCOUNT FOR LARGEST MARKET SHARE IN 2023
    4.4 MARKET, BY TYPE 
           FIGURE 21 BLACK MULCH TO REMAIN LARGEST MARKET TYPE ACROSS REGIONS DURING FORECAST PERIOD
    4.5 MARKET, BY ELEMENT 
           FIGURE 22 LLDPE SEGMENT TO BE LARGEST ELEMENT IN MULCH FILMS DURING FORECAST PERIOD
    4.6 MARKET, BY APPLICATION 
           FIGURE 23 HORTICULTURE TO ACCOUNT FOR LARGER APPLICATION TO MULCH FILMS DURING FORECAST PERIOD
 
5 MARKET OVERVIEW (Page No. - 61)
    5.1 INTRODUCTION 
    5.2 MACROECONOMIC INDICATORS 
           5.2.1 RISE IN POPULATION AND SCARCITY OF ARABLE LAND
                    FIGURE 24 POPULATION GROWTH, 1950–2025 (BILLION)
                    FIGURE 25 PER CAPITA ARABLE LAND, 1960–2025 (HA)
           5.2.2 GROWTH OF AGRICULTURAL SECTOR
    5.3 MARKET DYNAMICS 
           FIGURE 26 MULCH FILMS MARKET: DRIVERS, RESTRAINTS, OPPORTUNITIES, AND CHALLENGES
           5.3.1 DRIVERS
                    5.3.1.1 Rise in demand for greenhouse applications coupled with growth in environmental concerns
                    5.3.1.2 Rapid urbanization and industrialization
                               FIGURE 27 NUMBER OF PEOPLE LIVING IN URBAN AND RURAL AREAS, 1960–2020 (BILLION)
                               FIGURE 28 URBAN POPULATION (PERCENTAGE OF TOTAL POPULATION), BY GROUP OF ECONOMIES, 2011 VS. 2021
                    5.3.1.3 Increase in demand for crop productivity
                    5.3.1.4 Advancements in farming techniques
           5.3.2 RESTRAINTS
                    5.3.2.1 Presence of sustainable competing farming techniques
                    5.3.2.2 Implementation of additional pest and disease management measures for farmers
           5.3.3 OPPORTUNITIES
                    5.3.3.1 Greater demand for environmentally friendly and biodegradable mulch films
                    5.3.3.2 Expanding horticulture and specialty crop production
                    5.3.3.3 Utilization of mulch films in high-tunnel and greenhouse farming
           5.3.4 CHALLENGES
                    5.3.4.1 Installation and maintenance of mulch films
                    5.3.4.2 Growth in environmental sustainability concerns
 
6 INDUSTRY TRENDS (Page No. - 71)
    6.1 INTRODUCTION 
    6.2 VALUE CHAIN ANALYSIS 
           FIGURE 29 VALUE CHAIN ANALYSIS OF MULCH FILMS MARKET
           6.2.1 RAW MATERIAL SUPPLIERS
           6.2.2 MANUFACTURING
           6.2.3 DISTRIBUTION
           6.2.4 MARKETING AND SALES
    6.3 TECHNOLOGY ANALYSIS 
           6.3.1 MULTI-LAYER PLASTIC FILMS
    6.4 PATENT ANALYSIS 
           FIGURE 30 PATENTS GRANTED FOR THE MARKET, 2013–2022
           TABLE 4 KEY PATENTS PERTAINING TO MARKET, 2020–2023
    6.5 ECOSYSTEM AND MARKET MAP 
           6.5.1 DEMAND SIDE
           6.5.2 SUPPLY SIDE
                    FIGURE 31 MARKET MAP
                    TABLE 5 MARKET: SUPPLY CHAIN (ECOSYSTEM)
    6.6 TRADE ANALYSIS 
           TABLE 6 TOP 10 EXPORTERS AND IMPORTERS OF MULCH FILMS, 2022 (USD THOUSAND)
           TABLE 7 TOP 10 EXPORTERS AND IMPORTERS OF MULCH FILMS, 2022 (TONS)
    6.7 TRENDS/DISRUPTIONS IMPACTING CUSTOMER’S BUSINESS 
           FIGURE 32 TRENDS/DISRUPTIONS IMPACTING CUSTOMER’S BUSINESS
    6.8 KEY CONFERENCES & EVENTS 
           TABLE 8 MULCH FILMS MARKET: CONFERENCES & EVENTS, 2023–2024
    6.9 TARIFF AND REGULATORY LANDSCAPE 
           6.9.1 REGULATORY BODIES, GOVERNMENT AGENCIES, AND OTHER ORGANIZATIONS
                    TABLE 9 NORTH AMERICA: LIST OF REGULATORY BODIES, GOVERNMENT AGENCIES, AND OTHER ORGANIZATIONS
                    TABLE 10 EUROPE: LIST OF REGULATORY BODIES, GOVERNMENT AGENCIES, AND OTHER ORGANIZATIONS
                    TABLE 11 ASIA PACIFIC: LIST OF REGULATORY BODIES, GOVERNMENT AGENCIES, AND OTHER ORGANIZATIONS
                    TABLE 12 SOUTH AMERICA: LIST OF REGULATORY BODIES, GOVERNMENT AGENCIES, AND OTHER ORGANIZATIONS
                    TABLE 13 ROW: LIST OF REGULATORY BODIES, GOVERNMENT AGENCIES, AND OTHER ORGANIZATIONS
           6.9.2 REGULATORY LANDSCAPE
                    6.9.2.1 North America
                               6.9.2.1.1 US
                               6.9.2.1.2 Canada
                    6.9.2.2 Europe
                               6.9.2.2.1 Germany
                               6.9.2.2.2 France
                    6.9.2.3 Asia Pacific
                               6.9.2.3.1 China
                    6.9.2.4 South America
                               6.9.2.4.1 Brazil
                               6.9.2.4.2 Rest of South America
                    6.9.2.5 RoW
                               6.9.2.5.1 Middle East
                               6.9.2.5.2 South Africa
    6.10 CASE STUDY ANALYSIS 
           6.10.1 SOIL-BIODEGRADABLE ECOVIO INTRODUCED Y BASF FOR SUSTAINABLE AGRICULTURE
    6.11 PORTER’S FIVE FORCES ANALYSIS 
                    FIGURE 33 PORTER’S FIVE FORCES ANALYSIS
                    TABLE 14 MULCH FILMS MARKET: PORTER’S FIVE FORCES ANALYSIS
           6.11.1 THREAT OF NEW ENTRANTS
           6.11.2 THREAT OF SUBSTITUTES
           6.11.3 BARGAINING POWER OF SUPPLIERS
           6.11.4 BARGAINING POWER OF BUYERS
           6.11.5 INTENSITY OF COMPETITIVE RIVALRY
    6.12 KEY STAKEHOLDERS AND BUYING CRITERIA 
           6.12.1 KEY STAKEHOLDERS IN BUYING PROCESS
                    FIGURE 34 INFLUENCE OF STAKEHOLDERS ON BUYING PROCESS FOR KEY TYPES
                    TABLE 15 INFLUENCE OF STAKEHOLDERS ON BUYING PROCESS FOR KEY TYPES
           6.12.2 BUYING CRITERIA
                    FIGURE 35 KEY BUYING CRITERIA FOR TOP TYPES
                    TABLE 16 KEY BUYING CRITERIA FOR MULCH FILM TYPES
 
7 MULCH FILMS MARKET, BY TYPE (Page No. - 91)
    7.1 INTRODUCTION 
           FIGURE 36 BLACK MULCH SEGMENT TO DOMINATE THE MARKET IN 2023 (USD MILLION)
           TABLE 17 MARKET, BY TYPE, 2018–2022 (USD MILLION)
           TABLE 18 MARKET, BY TYPE, 2023–2028 (USD MILLION)
           TABLE 19 MARKET, BY TYPE, 2018–2022 (KT)
           TABLE 20 MARKET, BY TYPE, 2023–2028 (KT)
    7.2 CLEAR/TRANSPARENT 
           7.2.1 USE OF CLEAR PLASTIC MULCHES IN COOLER REGIONS
                    TABLE 21 CLEAR/TRANSPARENT MULCH FILMS: MARKET, BY REGION, 2018–2022 (USD MILLION)
                    TABLE 22 CLEAR/TRANSPARENT MULCH FILMS: MARKET, BY REGION, 2023–2028 (USD MILLION)
                    TABLE 23 CLEAR/TRANSPARENT MULCH FILMS: MARKET, BY REGION, 2018–2022 (KT)
                    TABLE 24 CLEAR/TRANSPARENT MULCH FILMS: MARKET, BY REGION, 2023–2028 (KT)
    7.3 BLACK MULCH 
           7.3.1 INCREASED PRODUCTION OF LEAFY VEGETABLES THAT USE INEXPENSIVE BLACK MULCHES
                    TABLE 25 BLACK MULCH FILMS: MARKET, BY REGION, 2018–2022 (USD MILLION)
                    TABLE 26 BLACK MULCH FILMS: MARKET, BY REGION, 2023–2028 (USD MILLION)
                    TABLE 27 BLACK MULCH FILMS: MARKET, BY REGION, 2018–2022 (KT)
                    TABLE 28 BLACK MULCH FILMS: MARKET, BY REGION, 2023–2028 (KT)
    7.4 COLORED MULCH 
           7.4.1 COLORED MULCHES FOR IMPROVED CROP PRODUCTION
                    TABLE 29 COLORED MULCH FILMS MARKET, BY REGION, 2018–2022 (USD MILLION)
                    TABLE 30 MARKET, BY REGION, 2023–2028 (USD MILLION)
                    TABLE 31 MARKET, BY REGION, 2018–2022 (KT)
                    TABLE 32 MARKET, BY REGION, 2023–2028 (KT)
    7.5 PHOTO-SELECTIVE MULCH 
           7.5.1 ADOPTION OF PHOTO-SELECTIVE MULCH FILMS FOR SUSTAINABLE AGRICULTURE
                    TABLE 33 PHOTO-SELECTIVE MULCH FILMS: MARKET, BY REGION, 2018–2022 (USD MILLION)
                    TABLE 34 MARKET, BY REGION, 2023–2028 (USD MILLION)
                    TABLE 35 MARKET, BY REGION, 2018–2022 (KT)
                    TABLE 36 MARKET, BY REGION, 2023–2028 (KT)
    7.6 DEGRADABLE MULCH 
           7.6.1 INCREASE IN USE OF BIODEGRADABLE MULCH FILMS
                    TABLE 37 DEGRADABLE MULCH FILMS: MARKET, BY TYPE, 2018–2022 (USD MILLION)
                    TABLE 38 MARKET, BY TYPE, 2023–2028 (USD MILLION)
                    TABLE 39 MARKET, BY TYPE, 2018–2022 (KT)
                    TABLE 40 MARKET, BY TYPE, 2023–2028 (KT)
                    TABLE 41 MARKET, BY REGION, 2018–2022 (USD MILLION)
                    TABLE 42 MARKET, BY REGION, 2023–2028 (USD MILLION)
                    TABLE 43 MARKET, BY REGION, 2018–2022 (KT)
                    TABLE 44 DEGRADABLE MULCH FILMS: MARKET, BY REGION, 2023–2028 (KT)
                    7.6.1.1 Biodegradable Mulch
                               TABLE 45 BIODEGRADABLE MULCH FILMS: MARKET, BY REGION, 2018–2022 (USD MILLION)
                               TABLE 46 MARKET, BY REGION, 2023–2028 (USD MILLION)
                               TABLE 47 MARKET, BY REGION, 2018–2022 (KT)
                               TABLE 48 MARKET, BY REGION, 2023–2028 (KT)
                    7.6.1.2 Photodegradable Mulch
                               TABLE 49 PHOTODEGRADABLE MULCH FILMS: MARKET, BY REGION, 2018–2022 (USD MILLION)
                               TABLE 50 MARKET, BY REGION, 2023–2028 (USD MILLION)
                               TABLE 51 MARKET, BY REGION, 2018–2022 (KT)
                               TABLE 52 PHOTODEGRADABLE MULCH FILMS MARKET, BY REGION, 2023–2028 (KT)
    7.7 OTHER TYPES 
           TABLE 53 OTHER MULCH FILM TYPES MARKET, BY REGION, 2018–2022 (USD MILLION)
           TABLE 54 OTHER MULCH FILM TYPES MARKET, BY REGION, 2023–2028 (USD MILLION)
           TABLE 55 OTHER MULCH FILM TYPES MARKET, BY REGION, 2018–2022 (KT)
           TABLE 56 OTHER MULCH FILM TYPES MARKET, BY REGION, 2023–2028 (KT)
 
8 MULCH FILMS MARKET, BY ELEMENT (Page No. - 109)
    8.1 INTRODUCTION 
           FIGURE 37 LLDPE-BASED MULCH FILMS TO ACCOUNT FOR LARGEST MARKET BY 2028
           TABLE 57 MARKET, BY ELEMENT, 2018–2022 (USD MILLION)
           TABLE 58 MARKET, BY ELEMENT, 2023–2028 (USD MILLION)
    8.2 LLDPE 
           8.2.1 SOIL TEMPERATURE REGULATION TO IMPROVE CROP YIELDS
                    TABLE 59 LLDPE-BASED MULCH FILMS: MARKET, BY REGION, 2018–2022 (USD MILLION)
                    TABLE 60 LLDPE-BASED MULCH FILMS: MARKET, BY REGION, 2023–2028 (USD MILLION)
    8.3 LDPE 
           8.3.1 GROWTH IN AWARENESS AMONG FARMERS LED TO INCREASED USE OF LDPE MULCH FILMS
                    TABLE 61 LDPE-BASED MULCH FILMS: MARKET, BY REGION, 2018–2022 (USD MILLION)
                    TABLE 62 LDPE-BASED MULCH FILMS: MARKET, BY REGION, 2023–2028 (USD MILLION)
    8.4 HDPE 
           8.4.1 EXTENSIVE USE WITH VARIEGATED APPLICATIONS IN AGRICULTURE
                    TABLE 63 HDPE-BASED MULCH FILMS: MARKET, BY REGION, 2018–2022 (USD MILLION)
                    TABLE 64 HDPE-BASED MULCH FILMS: MARKET, BY REGION, 2023–2028 (USD MILLION)
    8.5 EVA 
           8.5.1 INCREASE IN AWARENESS OF ENVIRONMENTAL BENEFITS OF EVA MULCH FILMS
                    TABLE 65 EVA-BASED MULCH FILMS: MARKET, BY REGION, 2018–2022 (USD MILLION)
                    TABLE 66 EVA-BASED MULCH FILMS: MARKET, BY REGION, 2023–2028 (USD MILLION)
    8.6 PLA 
           8.6.1 TECHNOLOGICALLY ADVANCED PLA MULCH FILMS OFFER PERFORMANCE WITH SUSTAINABILITY
                    TABLE 67 PLA-BASED MULCH FILMS: MARKET, BY REGION, 2018–2022 (USD MILLION)
                    TABLE 68 PLA-BASED MULCH FILMS :MARKET, BY REGION, 2023–2028 (USD MILLION)
    8.7 PHA 
           8.7.1 RISE IN ADOPTION OF SUSTAINABLE AGRICULTURE AMONG FARMERS
                    TABLE 69 PHA-BASED MULCH FILMS: MARKET, BY REGION, 2018–2022 (USD MILLION)
                    TABLE 70 PHA-BASED MULCH FILMS: MARKET, BY REGION, 2023–2028 (USD MILLION)
    8.8 OTHER ELEMENTS 
                    TABLE 71 OTHER MULCH FILM ELEMENTS MARKET, BY REGION, 2018–2022 (USD MILLION)
                    TABLE 72 OTHER MULCH FILM ELEMENTS MARKET, BY REGION, 2023–2028 (USD MILLION)
 
9 MULCH FILMS MARKET, BY APPLICATION (Page No. - 120)
    9.1 INTRODUCTION 
           FIGURE 38 HORTICULTURAL APPLICATION SET TO DOMINATE THE MARKET, 2023 VS. 2028 (USD MILLION)
           TABLE 73 MARKET, BY APPLICATION, 2018–2022 (USD MILLION)
           TABLE 74 MARKET, BY APPLICATION, 2023–2028 (USD MILLION)
    9.2 AGRICULTURAL FARMS 
           9.2.1 DEMAND FOR IMPROVED YIELDS OF HIGH-VALUE CROPS
                    TABLE 75 MARKET IN AGRICULTURAL FARMS, BY REGION, 2018–2022 (USD MILLION)
                    TABLE 76 MARKET IN AGRICULTURAL FARMS, BY REGION, 2023–2028 (USD MILLION)
    9.3 HORTICULTURE 
           9.3.1 HIGH PREFERENCE FOR COLORED MULCH IN COMMERCIAL HORTICULTURE
                    TABLE 77 MARKET IN HORTICULTURE, BY REGION, 2018–2022 (USD MILLION)
                    TABLE 78 MARKET IN HORTICULTURE, BY REGION, 2023–2028 (USD MILLION)
 
10 MARKET, BY REGION (Page No. - 126)
     10.1 INTRODUCTION 
               FIGURE 39 INDIA TO BE FASTEST-GROWING MARKET DURING FORECAST PERIOD
               TABLE 79 MARKET, BY REGION, 2018–2022 (USD MILLION)
               TABLE 80 MARKET, BY REGION, 2023–2028 (USD MILLION)
               TABLE 81 MARKET, BY REGION, 2018–2022 (KT)
               TABLE 82 MARKET, BY REGION, 2023–2028 (KT)
     10.2 NORTH AMERICA 
               FIGURE 40 NORTH AMERICA: MARKET SNAPSHOT
               TABLE 83 NORTH AMERICA: MARKET, BY COUNTRY, 2018–2022 (USD MILLION)
               TABLE 84 NORTH AMERICA: MARKET, BY COUNTRY, 2023–2028 (USD MILLION)
               TABLE 85 NORTH AMERICA: MULCH FILMS MARKET, BY COUNTRY, 2018–2022 (KT)
               TABLE 86 NORTH AMERICA: MARKET, BY COUNTRY, 2023–2028 (KT)
               TABLE 87 NORTH AMERICA: MARKET, BY TYPE, 2018–2022 (USD MILLION)
               TABLE 88 NORTH AMERICA: MARKET, BY TYPE, 2023–2028 (USD MILLION)
               TABLE 89 NORTH AMERICA: MARKET, BY TYPE, 2018–2022 (KT)
               TABLE 90 NORTH AMERICA: MARKET, BY TYPE, 2023–2028 (KT)
               TABLE 91 NORTH AMERICA: MARKET, BY ELEMENT, 2018–2022 (USD MILLION)
               TABLE 92 NORTH AMERICA: MARKET, BY ELEMENT, 2023–2028 (USD MILLION)
               TABLE 93 NORTH AMERICA: MARKET, BY APPLICATION, 2018–2022 (USD MILLION)
               TABLE 94 NORTH AMERICA: MARKET, BY APPLICATION, 2023–2028 (USD MILLION)
             10.2.1 NORTH AMERICA: RECESSION IMPACT ANALYSIS
                       FIGURE 41 NORTH AMERICA: MARKET: RECESSION IMPACT ANALYSIS
             10.2.2 US
                       10.2.2.1 Rise in demand for mulch films from food and dairy industries
                                   TABLE 95 US: MARKET, BY TYPE, 2018–2022 (USD MILLION)
                                   TABLE 96 US: MARKET, BY TYPE, 2023–2028 (USD MILLION)
                                   TABLE 97 US: MARKET, BY TYPE, 2018–2022 (KT)
                                   TABLE 98 US: MARKET, BY TYPE, 2023–2028 (KT)
             10.2.3 CANADA
                       10.2.3.1 Need to reduce water usage, control weed growth, and improve soil quality
                                   TABLE 99 CANADA: MARKET, BY TYPE, 2018–2022 (USD MILLION)
                                   TABLE 100 CANADA: MARKET, BY TYPE, 2023–2028 (USD MILLION)
                                   TABLE 101 CANADA: MARKET, BY TYPE, 2018–2022 (KT)
                                   TABLE 102 CANADA: MARKET, BY TYPE, 2023–2028 (KT)
             10.2.4 MEXICO
                       10.2.4.1 Skilled and cost-effective labor force and free trade agreements
                                   TABLE 103 MEXICO: MULCH FILMS MARKET, BY TYPE, 2018–2022 (USD MILLION)
                                   TABLE 104 MEXICO: MARKET, BY TYPE, 2023–2028 (USD MILLION)
                                   TABLE 105 MEXICO: MARKET, BY TYPE, 2018–2022 (KT)
                                   TABLE 106 MEXICO: MARKET, BY TYPE, 2023–2028 (KT)
     10.3 ASIA PACIFIC 
               FIGURE 42 ASIA PACIFIC: MARKET SNAPSHOT
               TABLE 107 ASIA PACIFIC: MARKET, BY COUNTRY, 2018–2022 (USD MILLION)
               TABLE 108 ASIA PACIFIC: MARKET, BY COUNTRY, 2023–2028 (USD MILLION)
               TABLE 109 ASIA PACIFIC: MARKET, BY COUNTRY, 2018–2022 (KT)
               TABLE 110 ASIA PACIFIC: MARKET, BY COUNTRY, 2023–2028 (KT)
               TABLE 111 ASIA PACIFIC: MARKET, BY TYPE, 2018–2022 (USD MILLION)
               TABLE 112 ASIA PACIFIC: MARKET, BY TYPE, 2023–2028 (USD MILLION)
               TABLE 113 ASIA PACIFIC: MARKET, BY TYPE, 2018–2022 (KT)
               TABLE 114 ASIA PACIFIC: MARKET, BY TYPE, 2023–2028 (KT)
               TABLE 115 ASIA PACIFIC: MARKET, BY ELEMENT, 2018–2022 (USD MILLION)
               TABLE 116 ASIA PACIFIC: MARKET, BY ELEMENT, 2023–2028 (USD MILLION)
               TABLE 117 ASIA PACIFIC: MARKET, BY APPLICATION, 2018–2022 (USD MILLION)
               TABLE 118 ASIA PACIFIC: MARKET, BY APPLICATION, 2023–2028 (USD MILLION)
             10.3.1 ASIA PACIFIC: RECESSION IMPACT ANALYSIS
                       FIGURE 43 ASIA PACIFIC: MARKET: RECESSION IMPACT ANALYSIS
             10.3.2 CHINA
                       10.3.2.1 Massive industrial growth & urbanization and growth in focus on increasing agricultural output
                                   TABLE 119 CHINA: MULCH FILMS MARKET, BY TYPE, 2018–2022 (USD MILLION)
                                   TABLE 120 CHINA: MARKET, BY TYPE, 2023–2028 (USD MILLION)
                                   TABLE 121 CHINA: MARKET, BY TYPE, 2018–2022 (KT)
                                   TABLE 122 CHINA: MARKET, BY TYPE, 2023–2028 (KT)
             10.3.3 INDIA
                       10.3.3.1 Promotion of agro-textile sector by government and increase in food demand
                                   TABLE 123 INDIA: MARKET, BY TYPE, 2018–2022 (USD MILLION)
                                   TABLE 124 INDIA: MARKET, BY TYPE, 2023–2028 (USD MILLION)
                                   TABLE 125 INDIA: MARKET, BY TYPE, 2018–2022 (KT)
                                   TABLE 126 INDIA: MARKET, BY TYPE, 2023–2028 (KT)
             10.3.4 JAPAN
                       10.3.4.1 Advanced crop technologies and need to save labor and time
                                   TABLE 127 JAPAN: MARKET, BY TYPE, 2018–2022 (USD MILLION)
                                   TABLE 128 JAPAN: MARKET, BY TYPE, 2023–2028 (USD MILLION)
                                   TABLE 129 JAPAN: MARKET, BY TYPE, 2018–2022 (KT)
                                   TABLE 130 JAPAN: MARKET, BY TYPE, 2023–2028 (KT)
             10.3.5 AUSTRALIA & NEW ZEALAND
                       10.3.5.1 Effectiveness of mulch films in promoting growth of avocado trees
                                   TABLE 131 AUSTRALIA & NEW ZEALAND: MARKET, BY TYPE, 2018–2022 (USD MILLION)
                                   TABLE 132 AUSTRALIA & NEW ZEALAND: MARKET, BY TYPE, 2023–2028 (USD MILLION)
                                   TABLE 133 AUSTRALIA & NEW ZEALAND: MARKET, BY TYPE, 2018–2022 (KT)
                                   TABLE 134 AUSTRALIA & NEW ZEALAND: MARKET, BY TYPE, 2023–2028 (KT)
             10.3.6 REST OF ASIA PACIFIC
                       TABLE 135 REST OF ASIA PACIFIC: MULCH FILMS MARKET, BY TYPE, 2018–2022 (USD MILLION)
                       TABLE 136 REST OF ASIA PACIFIC: MARKET, BY TYPE, 2023–2028 (USD MILLION)
                       TABLE 137 REST OF ASIA PACIFIC: MARKET, BY TYPE, 2018–2022 (KT)
                       TABLE 138 REST OF ASIA PACIFIC: MARKET, BY TYPE, 2023–2028 (KT)
     10.4 EUROPE 
               TABLE 139 EUROPE: MULCH FILMS MARKET, BY COUNTRY, 2018–2022 (USD MILLION)
               TABLE 140 EUROPE: MARKET, BY COUNTRY, 2023–2028 (USD MILLION)
               TABLE 141 EUROPE: MARKET, BY COUNTRY, 2018–2022 (KT)
               TABLE 142 EUROPE: MARKET, BY COUNTRY, 2023–2028 (KT)
               TABLE 143 EUROPE: MARKET, BY TYPE, 2018–2022 (USD MILLION)
               TABLE 144 EUROPE: MARKET, BY TYPE, 2023–2028 (USD MILLION)
               TABLE 145 EUROPE: MARKET, BY TYPE, 2018–2022 (KT)
               TABLE 146 EUROPE: MARKET, BY TYPE, 2023–2028 (KT)
               TABLE 147 EUROPE: MARKET, BY ELEMENT, 2018–2022 (USD MILLION)
               TABLE 148 EUROPE: MARKET, BY ELEMENT, 2023–2028 (USD MILLION)
               TABLE 149 EUROPE: MARKET, BY APPLICATION, 2018–2022 (USD MILLION)
               TABLE 150 EUROPE: MARKET, BY APPLICATION, 2023–2028 (USD MILLION)
             10.4.1 EUROPE: RECESSION IMPACT ANALYSIS
                       FIGURE 44 EUROPE: MARKET: RECESSION IMPACT ANALYSIS
             10.4.2 GERMANY
                       10.4.2.1 Favorable EU regulations for select plastics and new recycling initiatives for mulch films
                                   TABLE 151 GERMANY: MARKET, BY TYPE, 2018–2022 (USD MILLION)
                                   TABLE 152 GERMANY: MARKET, BY TYPE, 2023–2028 (USD MILLION)
                                   TABLE 153 GERMANY: MARKET, BY TYPE, 2018–2022 (KT)
                                   TABLE 154 GERMANY: MARKET, BY TYPE, 2023–2028 (KT)
             10.4.3 FRANCE
                       10.4.3.1 Over 1 million hectares covered in mulch films, especially black
                                   TABLE 155 FRANCE: MARKET, BY TYPE, 2018–2022 (USD MILLION)
                                   TABLE 156 FRANCE: MARKET, BY TYPE, 2023–2028 (USD MILLION)
                                   TABLE 157 FRANCE: MARKET, BY TYPE, 2018–2022 (KT)
                                   TABLE 158 FRANCE: MARKET, BY TYPE, 2023–2028 (KT)
             10.4.4 UK
                       10.4.4.1 Need to enhance crop yields, improve crop quality, and reduce weed control costs
                                   TABLE 159 UK: MULCH FILMS MARKET, BY TYPE, 2018–2022 (USD MILLION)
                                   TABLE 160 UK: MARKET, BY TYPE, 2023–2028 (USD MILLION)
                                   TABLE 161 UK: MARKET, BY TYPE, 2018–2022 (KT)
                                   TABLE 162 UK: MARKET, BY TYPE, 2023–2028 (KT)
             10.4.5 ITALY
                       10.4.5.1 Adoption of eco-friendly films and various government initiatives to promote mulch films
                                   TABLE 163 ITALY: MARKET, BY TYPE, 2018–2022 (USD MILLION)
                                   TABLE 164 ITALY: MARKET, BY TYPE, 2023–2028 (USD MILLION)
                                   TABLE 165 ITALY: MARKET, BY TYPE, 2018–2022 (KT)
                                   TABLE 166 ITALY: MARKET, BY TYPE, 2023–2028 (KT)
             10.4.6 SPAIN
                       10.4.6.1 Implementation of plastic waste recycling, reduction of plastic usage, and landfilling in cooperation
                                   TABLE 167 SPAIN: MARKET, BY TYPE, 2018–2022 (USD MILLION)
                                   TABLE 168 SPAIN: MARKET, BY TYPE, 2023–2028 (USD MILLION)
                                   TABLE 169 SPAIN: MARKET, BY TYPE, 2018–2022 (KT)
                                   TABLE 170 SPAIN: MARKET, BY TYPE, 2023–2028 (KT)
             10.4.7 REST OF EUROPE
                       TABLE 171 REST OF EUROPE: MARKET, BY TYPE, 2018–2022 (USD MILLION)
                       TABLE 172 REST OF EUROPE: MARKET, BY TYPE, 2023–2028 (USD MILLION)
                       TABLE 173 REST OF EUROPE: MARKET, BY TYPE, 2018–2022 (KT)
                       TABLE 174 REST OF EUROPE: MARKET, BY TYPE, 2023–2028 (KT)
     10.5 SOUTH AMERICA 
               TABLE 175 SOUTH AMERICA: MARKET, BY COUNTRY, 2018–2022 (USD MILLION)
               TABLE 176 SOUTH AMERICA: MARKET, BY COUNTRY, 2023–2028 (USD MILLION)
               TABLE 177 SOUTH AMERICA: MARKET, BY COUNTRY, 2018–2022 (KT)
               TABLE 178 SOUTH AMERICA: MARKET, BY COUNTRY, 2023–2028 (KT)
               TABLE 179 SOUTH AMERICA: MULCH FILMS MARKET, BY TYPE, 2018–2022 (USD MILLION)
               TABLE 180 SOUTH AMERICA: MARKET, BY TYPE, 2023–2028 (USD MILLION)
               TABLE 181 SOUTH AMERICA: MARKET, BY TYPE, 2018–2022 (KT)
               TABLE 182 SOUTH AMERICA: MARKET, BY TYPE, 2023–2028 (KT)
               TABLE 183 SOUTH AMERICA: MARKET, BY ELEMENT, 2018–2022 (USD MILLION)
               TABLE 184 SOUTH AMERICA: MARKET, BY ELEMENT, 2023–2028 (USD MILLION)
               TABLE 185 SOUTH AMERICA: MARKET, BY APPLICATION, 2018–2022 (USD MILLION)
               TABLE 186 SOUTH AMERICA: MARKET, BY APPLICATION, 2023–2028 (USD MILLION)
             10.5.1 SOUTH AMERICA: RECESSION IMPACT ANALYSIS
                       FIGURE 45 SOUTH AMERICA: MARKET: RECESSION IMPACT ANALYSIS
             10.5.2 BRAZIL
                       10.5.2.1 High adoption of intensive agricultural practices, expansion of irrigated agriculture, and greater demand for high-quality fruits and vegetables
                                   TABLE 187 BRAZIL: MARKET, BY TYPE, 2018–2022 (USD MILLION)
                                   TABLE 188 BRAZIL: MARKET, BY TYPE, 2023–2028 (USD MILLION)
                                   TABLE 189 BRAZIL: MARKET, BY TYPE, 2018–2022 (KT)
                                   TABLE 190 BRAZIL: MARKET, BY TYPE, 2023–2028 (KT)
             10.5.3 REST OF SOUTH AMERICA
                       TABLE 191 REST OF SOUTH AMERICA: MARKET, BY TYPE, 2018–2022 (USD MILLION)
                       TABLE 192 REST OF SOUTH AMERICA: MARKET, BY TYPE, 2023–2028 (USD MILLION)
                       TABLE 193 REST OF SOUTH AMERICA: MARKET, BY TYPE, 2018–2022 (KT)
                       TABLE 194 REST OF SOUTH AMERICA: MARKET, BY TYPE, 2023–2028 (KT)
     10.6 REST OF THE WORLD (ROW) 
               TABLE 195 ROW: MARKET, BY REGION, 2018–2022 (USD MILLION)
               TABLE 196 ROW: MARKET, BY REGION, 2023–2028 (USD MILLION)
               TABLE 197 ROW: MULCH FILMS MARKET, BY REGION, 2018–2022 (KT)
               TABLE 198 ROW: MARKET, BY REGION, 2023–2028 (KT)
               TABLE 199 ROW: MARKET, BY TYPE, 2018–2022 (USD MILLION)
               TABLE 200 ROW: MARKET, BY TYPE, 2023–2028 (USD MILLION)
               TABLE 201 ROW: MARKET, BY TYPE, 2018–2022 (KT)
               TABLE 202 ROW: MARKET, BY TYPE, 2023–2028 (KT)
               TABLE 203 ROW: MARKET, BY ELEMENT, 2018–2022 (USD MILLION)
               TABLE 204 ROW: MARKET, BY ELEMENT, 2023–2028 (USD MILLION)
               TABLE 205 ROW: MARKET, BY APPLICATION, 2018–2022 (USD MILLION)
               TABLE 206 ROW: MARKET, BY APPLICATION, 2023–2028 (USD MILLION)
             10.6.1 ROW: RECESSION IMPACT ANALYSIS
                       FIGURE 46 ROW: MARKET: RECESSION IMPACT ANALYSIS
             10.6.2 AFRICA
                       10.6.2.1 Availability of affordable and versatile mulch films
                                   TABLE 207 AFRICA: MARKET, BY TYPE, 2018–2022 (USD MILLION)
                                   TABLE 208 AFRICA: MARKET, BY TYPE, 2023–2028 (USD MILLION)
                                   TABLE 209 AFRICA: MARKET, BY TYPE, 2018–2022 (KT)
                                   TABLE 210 AFRICA: MARKET, BY TYPE, 2023–2028 (KT)
             10.6.3 MIDDLE EAST
                       10.6.3.1 Need to conserve soil moisture, reduce weed growth, enhance soil fertility, and improve crop yields
                                   TABLE 211 MIDDLE EAST: MARKET, BY TYPE, 2018–2022 (USD MILLION)
                                   TABLE 212 MIDDLE EAST: MARKET SIZE, BY TYPE, 2023–2028 (USD MILLION)
                                   TABLE 213 MIDDLE EAST: MARKET, BY TYPE, 2018–2022 (KT)
                                   TABLE 214 MIDDLE EAST: MULCH FILMS MARKET SIZE, BY TYPE, 2023–2028 (KT)
 
11 COMPETITIVE LANDSCAPE (Page No. - 198)
     11.1 OVERVIEW 
     11.2 KEY PLAYER STRATEGIES/RIGHT TO WIN 
               TABLE 215 STRATEGIES ADOPTED BY KEY PLAYERS IN THE MARKET
     11.3 REVENUE ANALYSIS 
               FIGURE 47 REVENUE ANALYSIS OF KEY MARKET PLAYERS, 2018–2022 (USD BILLION)
     11.4 MARKET SHARE ANALYSIS 
               TABLE 216 MARKET: INTENSITY OF COMPETITIVE RIVALRY, 2022
     11.5 KEY PLAYERS’ ANNUAL REVENUE VS. GROWTH 
               FIGURE 48 ANNUAL REVENUE, 2022 (USD BILLION) VS. REVENUE GROWTH, 2020–2022
     11.6 KEY PLAYERS’ EBITDA 
               FIGURE 49 EBITDA, 2022 (USD BILLION)
     11.7 GLOBAL SNAPSHOT OF KEY MARKET PARTICIPANTS 
               FIGURE 50 GLOBAL SNAPSHOT OF KEY PARTICIPANTS IN THE MARKET, 2022
     11.8 COMPANY EVALUATION MATRIX 
             11.8.1 STARS
             11.8.2 EMERGING LEADERS
             11.8.3 PERVASIVE PLAYERS
             11.8.4 PARTICIPANTS
                       FIGURE 51 COMPANY EVALUATION MATRIX, 2022
             11.8.5 COMPANY FOOTPRINT
                       TABLE 217 COMPANY FOOTPRINT, BY TYPE
                       TABLE 218 COMPANY FOOTPRINT, BY APPLICATION
                       TABLE 219 COMPANY FOOTPRINT, BY ELEMENT
                       TABLE 220 COMPANY FOOTPRINT, BY REGION
                       TABLE 221 OVERALL COMPANY FOOTPRINT
     11.9 STARTUP/SME EVALUATION MATRIX 
             11.9.1 PROGRESSIVE COMPANIES
             11.9.2 RESPONSIVE COMPANIES
             11.9.3 DYNAMIC COMPANIES
             11.9.4 STARTING BLOCKS
                       FIGURE 52 STARTUP/SME EVALUATION MATRIX, 2022
             11.9.5 COMPETITIVE BENCHMARKING OF KEY STARTUPS/SMES
                       TABLE 222 DETAILED LIST OF KEY STARTUPS/SMES
     11.10 COMPETITIVE SCENARIO 
               11.10.1 DEALS
                       TABLE 223 MULCH FILMS MARKET: DEALS, 2018–2023
               11.10.2 OTHERS
                       TABLE 224 MARKET: OTHERS, 2018–2023
 
12 COMPANY PROFILES (Page No. - 218)
(Business Overview, Products/Solutions/Services Offered, Recent Developments, and MnM View (Key strengths/Right to Win, Strategic Choices Made, and Weaknesses and Competitive Threats))*
     12.1 KEY PLAYERS 
             12.1.1 BASF SE
                       TABLE 225 BASF SE: BUSINESS OVERVIEW
                       FIGURE 53 BASF SE: COMPANY SNAPSHOT
                       TABLE 226 BASF SE: PRODUCTS/SOLUTIONS/SERVICES OFFERED
                       TABLE 227 BASF SE: DEALS
                       TABLE 228 BASF SE: OTHERS
             12.1.2 BERRY GLOBAL INC.
                       TABLE 229 BERRY GLOBAL INC.: BUSINESS OVERVIEW
                       FIGURE 54 BERRY GLOBAL INC.: COMPANY SNAPSHOT
                       TABLE 230 BERRY GLOBAL INC.: PRODUCTS/SOLUTIONS/SERVICES OFFERED
                       TABLE 231 BERRY GLOBAL INC.: DEALS
             12.1.3 DOW
                       TABLE 232 DOW: BUSINESS OVERVIEW
                       FIGURE 55 DOW: COMPANY SNAPSHOT
                       TABLE 233 DOW: PRODUCTS/SOLUTIONS/SERVICES OFFERED
                       TABLE 234 DOW: DEALS
             12.1.4 KURARAY
                       TABLE 235 KURARAY: BUSINESS OVERVIEW
                       FIGURE 56 KURARAY: COMPANY SNAPSHOT
                       TABLE 236 KURARAY: PRODUCTS/SOLUTIONS/SERVICES OFFERED
             12.1.5 EXXON MOBIL CORPORATION
                       TABLE 237 EXXON MOBIL CORPORATION: BUSINESS OVERVIEW
                       FIGURE 57 EXXON MOBIL CORPORATION: COMPANY SNAPSHOT
                       TABLE 238 EXXON MOBIL CORPORATION: PRODUCTS/SOLUTIONS/SERVICES OFFERED
                       TABLE 239 EXXON MOBIL CORPORATION: OTHERS
             12.1.6 RKW GROUP
                       TABLE 240 RKW GROUP: MULCH FILMS MARKET: BUSINESS OVERVIEW
                       TABLE 241 RKW GROUP: PRODUCTS/SOLUTIONS/SERVICES OFFERED
                       TABLE 242 RKW GROUP: OTHERS
             12.1.7 INTERGRO, INC.
                       TABLE 243 INTERGRO, INC.: BUSINESS OVERVIEW
                       TABLE 244 INTERGRO, INC.: PRODUCTS/SOLUTIONS/SERVICES OFFERED
             12.1.8 PLASTIKA KRITIS S.A.
                       TABLE 245 PLASTIKA KRITIS S.A.: BUSINESS OVERVIEW
                       TABLE 246 PLASTIKA KRITIS S.A.: PRODUCTS/SOLUTIONS/SERVICES OFFERED
             12.1.9 EPI (EUROPE) LTD
                       TABLE 247 EPI (EUROPE) LTD: BUSINESS OVERVIEW
                       TABLE 248 EPI (EUROPE) LTD: PRODUCTS/SOLUTIONS/SERVICES OFFERED
             12.1.10 KOTHARI GROUP
                       TABLE 249 KOTHARI GROUP: BUSINESS OVERVIEW
                       TABLE 250 KOTHARI GROUP: PRODUCTS/SOLUTIONS/SERVICES OFFERED
             12.1.11 CAPTAIN POLYPLAST LTD.
                       TABLE 251 CAPTAIN POLYPLAST LTD.: BUSINESS OVERVIEW
                       TABLE 252 CAPTAIN POLYPLAST LTD.: PRODUCTS/SOLUTIONS/SERVICES OFFERED
             12.1.12 TILAK POLYPACK PVT. LTD
                       TABLE 253 TILAK POLYPACK PVT. LTD: BUSINESS OVERVIEW
                       TABLE 254 TILAK POLYPACK PVT. LTD: PRODUCTS/SOLUTIONS/SERVICES OFFERED
             12.1.13 IRIS POLYMERS
                       TABLE 255 IRIS POLYMERS: BUSINESS OVERVIEW
                       TABLE 256 IRIS POLYMERS: PRODUCTS/SOLUTIONS/SERVICES OFFERED
     12.2 BIODEGRADABLE MULCH FILM MANUFACTURERS 
             12.2.1 NOVAMONT S.P.A.
                       TABLE 257 NOVAMONT S.P.A.: BUSINESS OVERVIEW
                       TABLE 258 NOVAMONT S.P.A.: PRODUCTS/SOLUTIONS/SERVICES OFFERED
                       TABLE 259 NOVAMONT S.P.A.: DEALS
             12.2.2 ARMANDO ALVAREZ GROUP
                       TABLE 260 ARMANDO ALVAREZ GROUP: BUSINESS OVERVIEW
                       TABLE 261 ARMANDO ALVAREZ GROUP: PRODUCTS/SOLUTIONS/SERVICES OFFERED
             12.2.3 ACHILLES CORPORATION
                       TABLE 262 ACHILLES CORPORATION: MULCH FILMS MARKET: BUSINESS OVERVIEW
                       TABLE 263 ACHILLES CORPORATION: PRODUCTS/SOLUTIONS/SERVICES OFFERED
             12.2.4 COVERFIELDS
                       TABLE 264 COVERFIELDS: BUSINESS OVERVIEW
                       TABLE 265 COVERFIELDS: PRODUCTS/SOLUTIONS/SERVICES OFFERED
             12.2.5 FKUR
                       TABLE 266 FKUR: BUSINESS OVERVIEW
                       TABLE 267 FKUR: PRODUCTS/SOLUTIONS/SERVICES OFFERED
                       TABLE 268 FKUR: DEALS
             12.2.6 WALKI GROUP OY
             12.2.7 TURFQUICK AB SWEDEN
             12.2.8 FILMORGANIC
             12.2.9 KINGFA SCIENCE & TECHNOLOGY (INDIA) LIMITED
             12.2.10 GROWIT INDIA PRIVATE LIMITED
*Details on Business Overview, Products/Solutions/Services Offered, Recent Developments, and MnM View (Key strengths/Right to Win, Strategic Choices Made, and Weaknesses and Competitive Threats) might not be captured in case of unlisted companies.
 
13 ADJACENT AND RELATED MARKETS (Page No. - 263)
     13.1 INTRODUCTION 
               TABLE 269 ADJACENT MARKET
     13.2 LIMITATIONS 
     13.3 AGRICULTURAL FILMS MARKET 
             13.3.1 MARKET DEFINITION
             13.3.2 MARKET OVERVIEW
                       TABLE 270 AGRICULTURAL FILMS MARKET, BY TYPE, 2017–2022 (USD MILLION)
                       TABLE 271 AGRICULTURAL FILMS MARKET, BY TYPE, 2023–2028 (USD MILLION)
 
14 APPENDIX (Page No. - 265)
     14.1 DISCUSSION GUIDE 
     14.2 KNOWLEDGESTORE: MARKETSANDMARKETS’ SUBSCRIPTION PORTAL 
     14.3 CUSTOMIZATION OPTIONS 
     14.4 RELATED REPORTS 
     14.5 AUTHOR DETAILS 

The study involved four major activities in estimating the current size of the mulch films market. Exhaustive secondary research was done to collect information on the market, peer, and parent markets. The next step was to validate these findings, assumptions, and sizing with industry experts across the value chain through primary research. Both top-down and bottom-up approaches were employed to estimate the complete market size. After that, market breakdown and data triangulation were used to estimate the market size of segments and subsegments.

Secondary Research

This research study involved the extensive use of secondary sources—directories and databases such as Bloomberg Businessweek and Factiva—to identify and collect information useful for a technical, market-oriented, and commercial study of the market.

In the secondary research process, various sources such as annual reports, press releases & investor presentations of companies, white papers, food journals, certified publications, articles from recognized authors, gold & silver standard websites, directories, and databases, were referred to identify and collect information. This research study involved the extensive use of secondary sources—directories and databases such as Bloomberg Businessweek and Factiva—to identify and collect information useful for a technical, market-oriented, and commercial study of the mulch films market.

Secondary research was mainly used to obtain key information about the industry’s supply chain, the total pool of key players, and market classification and segmentation as per the industry trends to the bottom-most level, regional markets, and key developments from both market- and technology-oriented perspectives.

Primary Research

Extensive primary research was conducted after obtaining information regarding the mulch films market scenario through secondary research. Several primary interviews were conducted with market experts from both the demand and supply sides across major countries of North America, Europe, Asia Pacific, South America, and the Rest of the World. Primary data was collected through questionnaires, emails, and telephonic interviews. The primary sources from the supply side included various industry experts, such as Chief X Officers (CXOs), Vice Presidents (VPs), Directors, from business development, marketing, research, and development teams, and related key executives from distributors, and key opinion leaders. Primary interviews were conducted to gather insights such as market statistics, data on revenue collected from the products and services, market breakdowns, market size estimations, market forecasting, and data triangulation. Primary research also helped in understanding the various trends related to types of mulch films, application, element, and region. Stakeholders from the demand side, such as agricultural producers, mulch films distributing companies, and those who are using mulch films were interviewed to understand the buyer’s perspective on the suppliers, products, and their current usage of mulch films and outlook of their business which will affect the overall market.
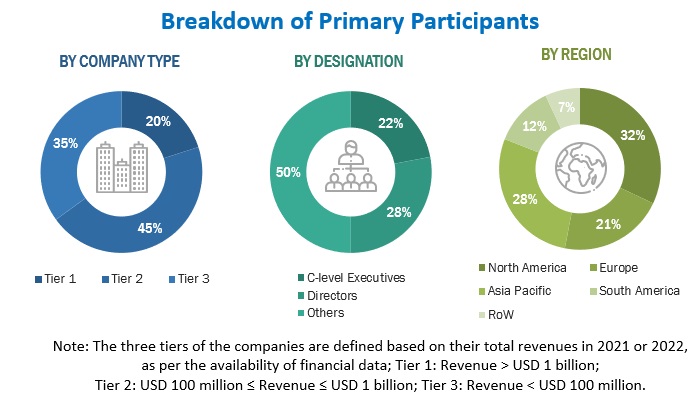
Mulch Films Market Primary Research

To know about the assumptions considered for the study, download the pdf brochure

COMPANY NAME

designation

BASF SE (Germany)

General Manager

Berry Global Inc (US)

Sales Manager

Dow (US)

Manager

Plastika Kritis S.A. (Greece)

Individual Industry Expert

RKW Group (Germany)

Marketing Manager

Novamont S.p.A (Italy)

Sales Executive

Armando Alvarez Group (Spain)

Sales Manager

Kuraray (Japan)

Individual Industry Expert

Exxon Mobil Corporation (US)

Manager

Intergro, Inc. (US)

Individual Industry Expert

Mulch Films Market Size Estimation

Both the top-down and bottom-up approaches were used to estimate and validate the total size of the market. These approaches were also used extensively to determine the size of various subsegments in the market. The research methodology used to estimate the market size includes the following details:

  • The key players in the industry and the overall markets were identified through extensive secondary research.
  • The revenues of the major mulch films players were determined through primary and secondary research, which were used as the basis for market sizing and estimation.
  • All percentage shares, splits, and breakdowns were determined using secondary sources and verified through primary sources.
  • All macroeconomic and microeconomic factors affecting the growth of the market were considered while estimating the market size.
  • All possible parameters that affect the market covered in this research study were accounted for, viewed in extensive detail, verified through primary research, and analyzed to obtain final quantitative and qualitative data.

Global Mulch Films Market: Bottom-Up Approach
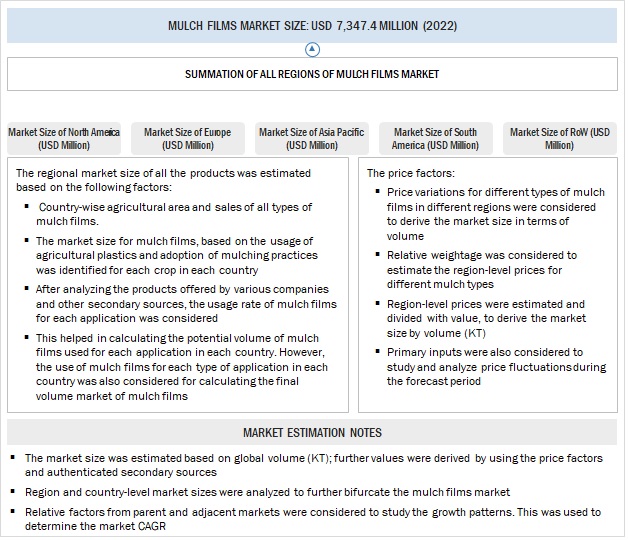
Mulch Films Market Bottom-Up Approach

To know about the assumptions considered for the study, Request for Free Sample Report

Global Mulch films Market: Top-Down Approach
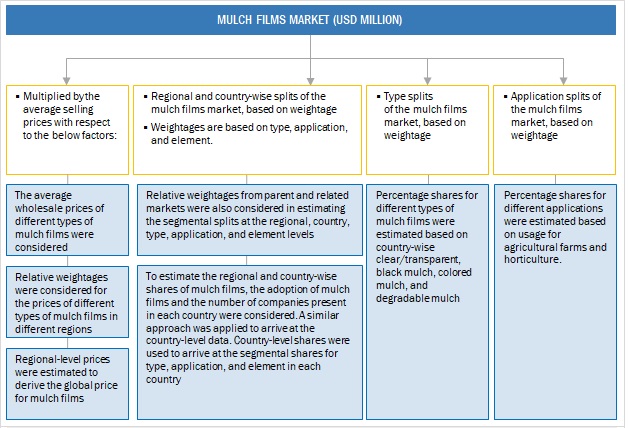
Mulch Films Market Top-Down Approach

Data Triangulation

After arriving at the overall size from the market size estimation process explained above, the total market was split into several segments and subsegments. The data triangulation and market breakdown procedures explained below were implemented, wherever applicable, to complete the overall market engineering process and arrive at the exact statistics for various market segments and subsegments. The data was triangulated by studying various factors and trends from the demand and supply sides. Along with this, the market size was validated using both the top-down and bottom-up approaches.

Mulch Films Market Definition

According to The Food and Agriculture Organization of the United Nations (FAO), mulch films are "thin sheets of plastic material that are spread over the soil to reduce weed growth, conserve moisture, and improve soil temperature."

Mulch films can be made from a variety of materials, including polyethylene, polypropylene, and biodegradable materials. They are typically applied to the soil before or after planting and can be left in place for the entire growing season.

Key Stakeholders

  • Raw material suppliers
  • End users, which include the following:
    • Agricultural producers
    • Companies (manufacturers/suppliers) involved in the mulch films sector.
    • Research centers, laboratories, and scientific institutes
    • Retailers
  • Commercial research & development (R&D) institutions and financial institutions
  • Importers and exporters of mulch films
  • Traders, distributors, and suppliers
  • Government and research organizations
  • Trade associations and industry bodies
    • United States Department of Agriculture (USDA)
    • Environmental Protection Agency (EPA)
    • Food and Agriculture Organization (FAO)
    • Agriculture Plastic & Environment (APE Europe)
    • American Society for Horticulture Science (ASHS)
    • International Mulch Film Association (IMFA)

Mulch Films Market Report Objectives

  • To determine and project the size of the market with respect to the type, application, element, and region in terms of value and volume over five years, ranging from 2023 to 2028.
  • To identify the attractive opportunities in the market by determining the largest and fastest-growing segments across regions
  • To provide detailed information about the key factors influencing market growth (drivers, restraints, opportunities, and challenges)
  • To analyze the opportunities in the market for stakeholders and provide details of the competitive landscape for market leaders.
  • To analyze the micro-markets with respect to individual growth trends, prospects, and their contribution to the total market.
  • To identify and profile the key players in the market.
  • To understand the competitive landscape and identify the major growth strategies adopted by players across the key regions.
  • To provide insights on key product innovations and investments in the mulch films market.

Available Customizations

With the given market data, MarketsandMarkets offers customizations according to company-specific scientific needs.

The following customization options are available for the report:

Product Analysis

  • Product Matrix, which gives a detailed comparison of the product portfolio of each company.

Geographic Analysis of the Mulch Films Market

With the given market data, MarketsandMarkets offers customizations according to company-specific scientific needs.

  • Further breakdown of the Rest of Europe’s market for mulch films into Poland, Romania, and Turkey
  • Further breakdown of the Rest of Asia Pacific market for mulch films into Thailand, Indonesia, and South Korea.
  • Further breakdown of the Rest of the South American market for mulch films into Argentina, Chile, and Colombia.

Company Information

  • Detailed analyses and profiling of additional market players (up to five)
Custom Market Research Services

We will customize the research for you, in case the report listed above does not meet with your exact requirements. Our custom research will comprehensively cover the business information you require to help you arrive at strategic and profitable business decisions.

Request Customization
Report Code
AGI 4161
Published ON
Nov, 2023
Choose License Type
BUY NOW
  • SHARE
X
Request Customization
Speak to Analyst
Speak to Analyst
OR FACE-TO-FACE MEETING
PERSONALIZE THIS RESEARCH
  • Triangulate with your Own Data
  • Get Data as per your Format and Definition
  • Gain a Deeper Dive on a Specific Application, Geography, Customer or Competitor
  • Any level of Personalization
REQUEST A FREE CUSTOMIZATION
LET US HELP YOU!
  • What are the Known and Unknown Adjacencies Impacting the Mulch Films Market
  • What will your New Revenue Sources be?
  • Who will be your Top Customer; what will make them switch?
  • Defend your Market Share or Win Competitors
  • Get a Scorecard for Target Partners
CUSTOMIZED WORKSHOP REQUEST
  • Call Us
  • +1-888-600-6441 (Corporate office hours)
  • +1-888-600-6441 (US/Can toll free)
  • +44-800-368-9399 (UK office hours)
CONNECT WITH US
ABOUT TRUST ONLINE
©2024 MarketsandMarkets Research Private Ltd. All rights reserved
DMCA.com Protection Status
Website Feedback