The study involved four major activities in estimating the current size of the NDIR market. Exhaustive secondary research was done to collect information on the market, peer, and parent markets. The next step was to validate these findings, assumptions, and sizing with industry experts across the value chain through primary research. Both top-down and bottom-up approaches were employed to estimate the complete market size. After that, market breakdown and data triangulation were used to estimate the market size of segments and subsegments.
Secondary Research
Various secondary sources have been referred to in the secondary research process for identifying and collecting information important for this study. The secondary sources include annual reports, press releases, and investor presentations of companies; white papers; journals and certified publications; and articles from recognized authors, websites, directories, and databases. Secondary research has been conducted to obtain key information about the industry’s supply chain, the market’s value chain, the total pool of key players, market segmentation according to the industry trends (to the bottom-most level), regional markets, and key developments from market- and technology-oriented perspectives. The secondary data has been collected and analyzed to determine the overall market size, further validated by primary research.
List of major secondary sources
|
Sources
|
Web Link
|
|
Semiconductor Industry Association (SIA)
|
www.semiconductors.org
|
|
Automotive Industry Action Group
|
www.aiag.org
|
|
Medical Device Manufacturers Association (MDMA)
|
https://www.medicaldevices.org/
|
|
Environmental Protection Agency
|
www.epa.gov
|
|
Occupational Safety and Health Administration
|
www.osha.gov
|
|
Centers for Disease Control and Prevention
|
www.cdc.gov
|
|
World Resources Institute (WRI)
|
www.wri.org
|
Primary Research
Extensive primary research was conducted after gaining knowledge about the current scenario of the NDIR market through secondary research. Several primary interviews were conducted with experts from both the demand and supply sides across four major regions—North America, Europe, Asia Pacific and RoW. This primary data was collected through questionnaires, emails, and telephonic interviews.
 Market Size, and Share")
To know about the assumptions considered for the study, download the pdf brochure
Market Size Estimation
In the complete market engineering process, both top-down and bottom-up approaches have been used, along with several data triangulation methods, to perform market estimation and forecasting for the overall market segments and subsegments listed in this report. Key players in the market have been identified through secondary research, and their market shares in the respective regions have been determined through primary and secondary research. This entire procedure includes the study of annual and financial reports of the top market players and extensive interviews for key insights (quantitative and qualitative) with industry experts (CEOs, VPs, directors, and marketing executives).
All percentage shares, splits, and breakdowns have been determined using secondary sources and verified through primary sources. All the parameters affecting the markets covered in this research study have been accounted for, viewed in detail, verified through primary research, and analyzed to obtain the final quantitative and qualitative data. This data has been consolidated and supplemented with detailed inputs and analysis from MarketsandMarkets and presented in this report. The following figure represents this study’s overall market size estimation process.
Bottom-Up Approach
-
Identifying various gas types detected using NDIR sensors and modules
-
Analyzing the penetration of each type of sensor and module through secondary and primary research
-
Analyzing the penetration of NDIR sensors and modules based on different applications and verticals through secondary and primary research
-
Conducting multiple discussion sessions with key opinion leaders to understand the detailed working of NDIR sensors, and their implementation in multiple applications; this helped analyze the break-up of the scope of work carried out by each major company
-
Verifying and cross-checking the estimates at every level with key opinion leaders, including CEOs, directors, operation managers, and finally with MarketsandMarkets domain experts
-
Studying various paid and unpaid sources of information, such as annual reports, press releases, white papers, and databases
 Market Size, and Bottom-Up Approach")
Top-Down Approach
-
Focusing initially on the top-line investments and expenditures being made in the ecosystem of the NDIR market; further splitting the key market areas on the basis of gas type, application, vertical, and region, and listing the key developments
-
Identifying all leading players and end-users in the NDIR market based on gas type, application, and vertical through secondary research, and fully verifying them through a brief discussion with the industry experts
-
Analyzing revenues, product mix, geographic presence, and key applications served by all identified players to estimate and arrive at percentage splits for all key segments
-
Discussing splits with the industry experts to validate the information and identify key growth pockets across all key segments
-
Breaking down the total market based on verified splits and key growth pockets across all segments
 Market Size, and Top-Down Approach")
Data Triangulation
After arriving at the overall size of the NDIR market from the estimation process explained above, the market has been split into several segments and subsegments. The data triangulation and market breakdown procedures have been employed (wherever applicable) to complete the overall market engineering process and arrive at the exact statistics for all segments and subsegments. The data has been triangulated by studying various factors and trends from both the demand and supply sides. The size of the NDIR market has been validated using both top-down and bottom-up approaches.
Market Definition
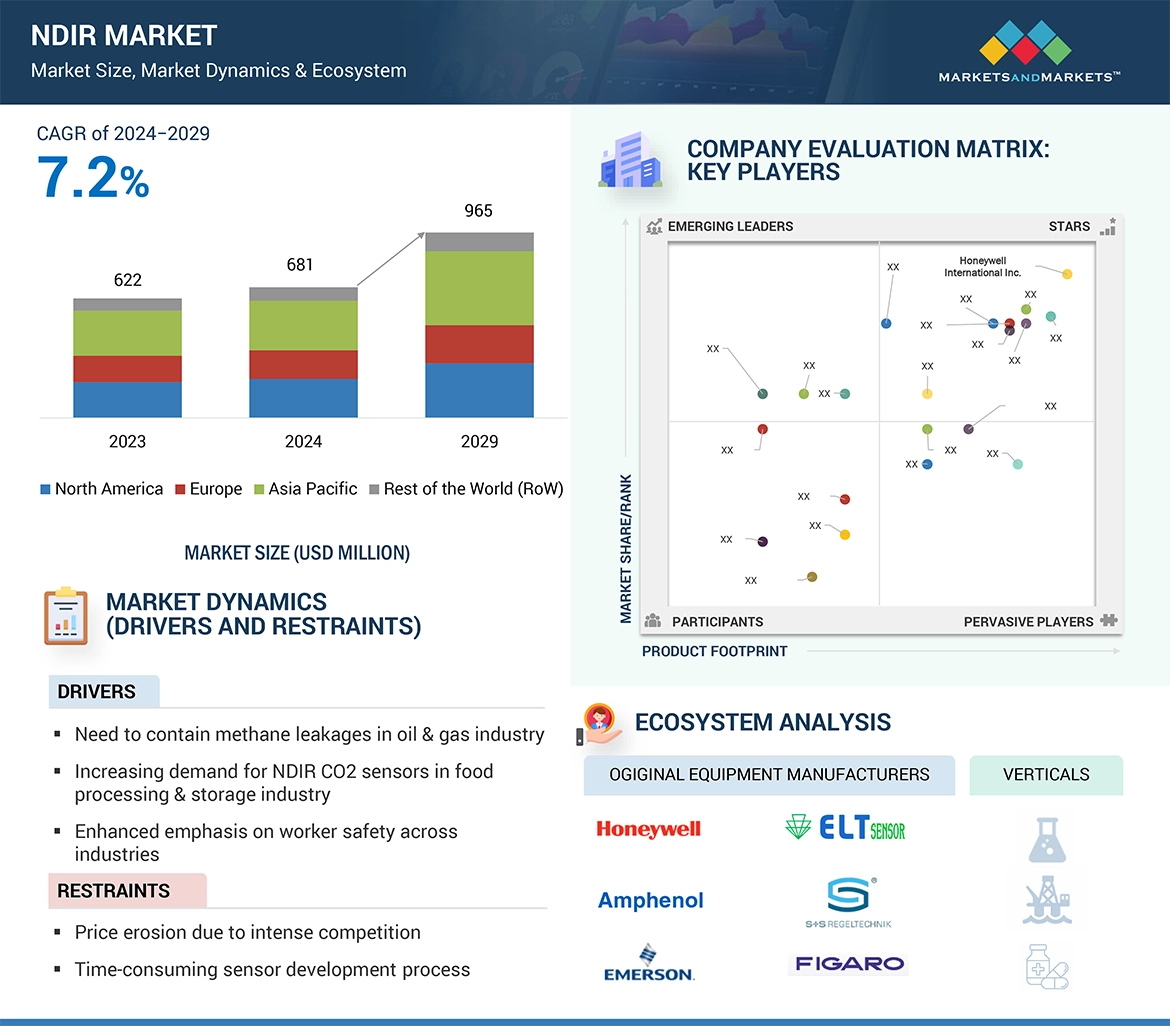
Non-dispersive infrared (NDIR) technology involves the optical measurement of gas concentration in the target application using infrared (IR) light and IR absorption wavelength band. In this, the IR light emitted by the IR source is absorbed by the molecules of the gas under measurement at a particular wavelength. A NDIR sensor has an IR source, optical filter, and IR detector. It measures the amount of IR light of specific wavelength that is absorbed by the surrounding air; this is used to calculate the concentration of that gas in the surrounding air. Small in size, with no moving parts, these sensors have a long lifespan. They are ideal for measuring the concentration of gases such as carbon dioxide, hydrocarbons, refrigerant gases, acetylene, ethylene, anesthetic gases, and carbon monoxide. NDIR sensors are being increasingly used by industrial and manufacturing end-users.
Key Stakeholders
-
NDIR sensor and module manufacturers
-
NDIR end-user product manufacturers
-
Automotive companies
-
Medical, food processing and storage, and mining industries
-
Raw material suppliers
-
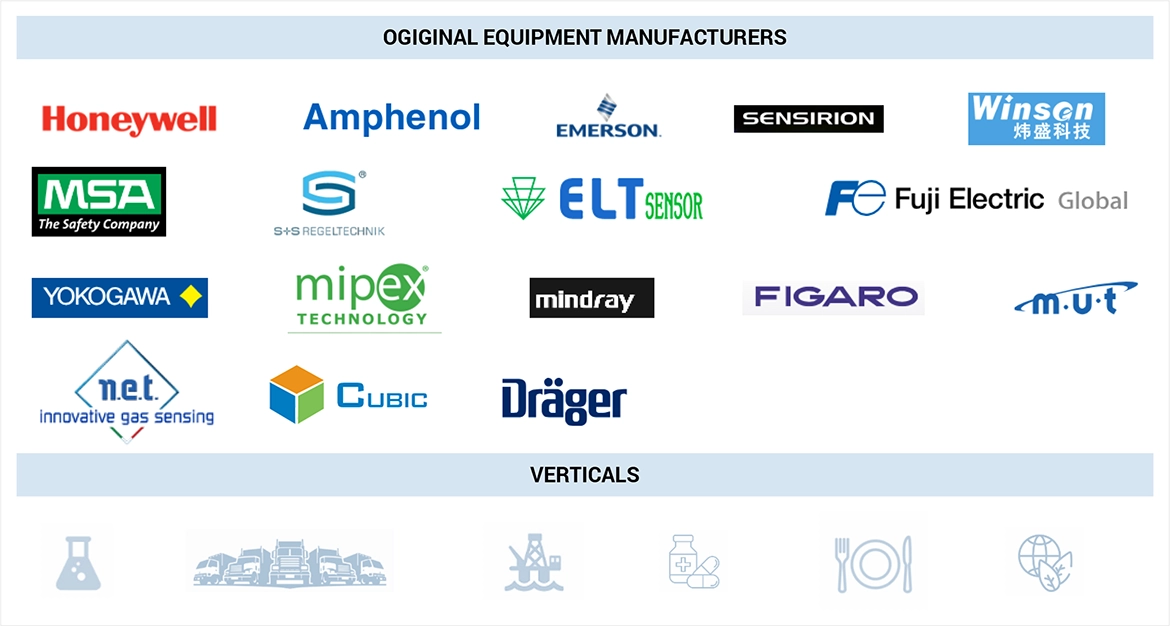
Original equipment manufacturers (OEMs)
-
NDIR solutions distributors and sales firms
-
Technology solution providers and design contractors
-
Electronics and semiconductor companies
-
Technology standards organizations, forums, alliances, and associations
-
Analysts and strategic business planners
-
Associations, organizations, and alliances related to NDIR technology
-
Universities and research organizations
-
Government bodies
Report Objectives
-
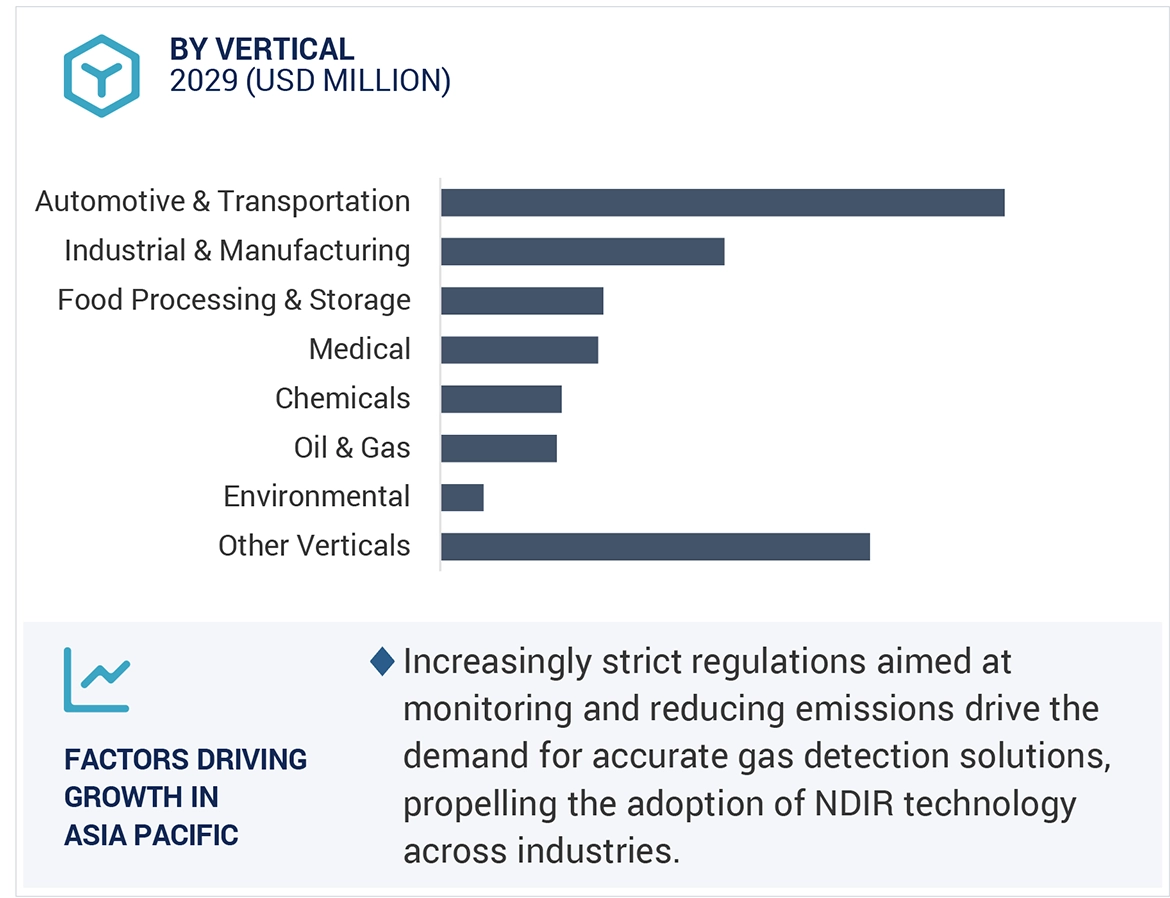
To describe and forecast the non-dispersive infrared (NDIR) market, by gas type, application, and vertical, in terms of value and volume
-
To describe and forecast the market for four key regions—North America, Europe, Asia Pacific and the Rest of the World (RoW)--in terms of value
-
To provide qualitative information about different components used in NDIR sensors
-
To provide detailed information regarding drivers, restraints, opportunities, and industry-specific challenges influencing the growth of the NDIR market
-
To provide a detailed overview of the value chain pertaining to NDIR ecosystems, along with the average selling price for NDIR sensors and modules
-
To strategically analyze the ecosystem, tariff and regulations, patent landscape, and various case studies pertaining to the NDIR market
-
To describe, in brief, the COVID-19 impact on the global NDIR market
-
To strategically analyze micromarkets with respect to individual growth trends, prospects, and contributions to the overall market
-
To strategically profile key players and comprehensively analyze their position in the NDIR market in terms of their ranking and core competencies2, and detail the competitive landscape for market leaders
-
To analyze competitive developments in the NDIR market, such as product launches and developments, expansions, partnerships, and acquisitions
Customization Options
With the given market data, MarketsandMarkets offers customizations according to the company’s specific needs. The following customization options are available for the report:
Company Information
-
Detailed analysis and profiling of additional market players (up to five)
Geographic Analysis
-
Further breakdown of regions into respective countries


Growth opportunities and latent adjacency in Non-dispersive Infrared (NDIR) Market